E ERIMENTS ON NON-SWA ST UCTURAL SUBA S MBLAGESbeams have about the same length and carry the same...
86
Plastic Design of Multi-Story Frames E ERIMENTS ON NON-SWA ST UCTURAL SUBA S MBLAGES EI\JGfj\JEER1NG ltIBOF\j.\TOJ={Y UBF?I\fW by Eugene L. Sheninger Le-Wu Lu Fritz Engineering Laboaratory Report No.
Transcript of E ERIMENTS ON NON-SWA ST UCTURAL SUBA S MBLAGESbeams have about the same length and carry the same...

Plastic Design of Multi-Story Frames
E ERIMENTS ONNON-SWA ST UCTURAL
SUBA S MBLAGES
EI\JGfj\JEER1NGltIBOF\j.\TOJ={Y UBF?I\fW
byEugene L. Sheninger
Le-Wu Lu
Fritz Engineering Laboaratory Report No. 273~62

Plastic Design of Multi-Story Frames
EXPERIMENTS ON 'NON-SWAY STRUCTURAL SUBASSEMBLAGES
by
Eugene L. Sheninger
and
Le-Wu Lu
This .work has b~en carried out as part of an investigationsponsored jointly by the Welding Research Council and the Department of the Navy with funds furnished by the following:,
American Iron and Steel Institute
Naval Ship Engineering Center
Naval Facilities Engineering Commarid
Reproduction of this report in whole or in part is permittedfor any purpose of the United States ~overnment.
Fritz Engineering Laborat~ry
Department of Civil ~ngineering
Lehigh UniversityBethlehem, Pennsylvania
July, 1968
Fritz Engineering Laboratory Report No. 273.62

i
ABSTRACT
Experiments were conducted on full-scale, non-sway beam-and
column subassemblages to study their strength and deformation behavior
in the inelastic range. These tests also provide an experimental veri
fication of a new procedure that was developed for designing col~mns
in braced multi-story frames. Two types of subassemblages were in
cluded: subassemblages with columns bent in single curvature and sub
assemblages with columns "bent in double curvature. All columns were
braced to prevent lateral and torsional deformations. For each type
of subassemblage, two tests were performed, the difference being the
slenderness ratio (about the major axis) of the columns, which was
chosen to be 35 in one test and 30 in the other. The axial load in
the columns varied from about 75 percent to 85 percent of the axial
yield load.
The test subassemblages were designed as if they were part of an
actual building frame. The beams were proportioned for their plastic
mechanism strength, and the columns were, so selected that they had
just enough capacity to resist the maximum moment transmitted from the
beams. A close examination of the failure behavior for both the beams
and columns was thus possible.
The results show that the load carrying capacity of subassem
blages can be closely predicted by the theory upon which the design
procedure is based.

'TABLE OF CONTENTS
ABSTRACT
1. INTRODUCTION
1.1 Previous Research
1.2 Objectives and Scope of the Investigation
2. EXPERIMENTAL PROGRAM
2.1 Procedure for Designing Specimens
2.2 Test Specimens and Preliminary Design Data
2.3 Specimen Details
3. TEST SETUP AND PROCEDURE
3.1 General Description of Test Setup
3.2 Load Application
3.3 Instrumentation
3.4 Test Procedure
4. MECHANICAL AND CROSS-SECTIONAL PROPERTIES
4.1 Tension Tests
4.2 Cross-Sectional Measurements
4.3 Stub Column Tests
4.4 Residual Stress Determination
5. EXPERIMENTAL BEHAVIOR OF SUBASSEMBLAGES
5.1 Design Data Based on Measured Mechanical andCross-Sectional Properties
5.2 Experimental Behavior
i
1
4
6
9
9
11
13
15
15
18
19
21
24
24
25
25
26
27
27
29

6. COMPARISON OF EXPERIMENTAL RESULTS WITHTHEORETICAL PREDICTIONS
6.1 Ma~i~um Loads Carried by Beams
6.2 Moment versus Rotation (M-G) Relationshipsof Joints
7. SUMMARY AND CONCLUSIONS
8. ACKNOWLEDGMENTS
9. NOTATION
10. TABLES AND FIGURES
11. REFERENCES
36
36
37
43
46
47
,49
78

-1
1. INTRODUCTION
Since 1958 extensive research has been carried out at Lehigh
University to develop plastic analysis and design methods for multi-
story building frames. This continuing effort has produced practical
design methods for both laterally braced and unbraced frames. These
h d -1 bl - · - 1,2,3 d h 1met 0 S are now ava1 a e to pract1c1ng eng1neers an ave a -
ready been used in designing an eleven-story apartment building.4 In
the design procedure for braced frames, the beams are selec,ted first
on the basis of their beam mechanism load. The columns are then pro-
portioned to have sufficient strength to resist the axial force from
the stories above and the bending moment transmitted from the adjacent
beams. The frame is assumed to be prevented from sway by an internal
bracing system which is designed to carryall the lateral- loads.
An important aspect of the design procedure is the inclusion of
the axial force effect in determining the moment carrying capacity of
the columns. The presence of axial force causes a reduction of the
moment capacity in two ways. First, the plastic moment of the cross
section is reduced from a full value M to a lesser value Mp pc Second,
the deflected shape causes an eccentricity which, combined with the
axial load, generates an additional moment. This secondary moment
leads to instability failure of the member. For the case of constant
axial thrust and increasing end moment, the complete response of a col-
umn can be represented by its moment-rotation, M-Q, curve. An M-Q

-2
curve is a graphical description of the relationship between end mo
ment and end rotation of a particular column, and it is dependent upon
the magnitude of the axial force, the slenderness ratio, the yield
stress of the material, and the residual stress distribution. To
properly take into account the effect of instability, the design
method described above makes direct use of the M-Q curves. This is
accomplished by developing appropriate "subassemblages" or "limited
frames" for the columns being designed.
A subassemblage, for the purpose of this report, will be defined
as a structural system consisting of two or more column segments and
some of their adjoining beams. Use of the subassemblage concept in
the design of columns can be explained by reference to the frame shown
in Fig. 1. Illustrated in this figure is the design of 1) three in
terior columns for a checkerboard gravity loading pattern and 2) three
exterior columns for full gravity loading. The subassemblage that is
used in the design of the interior columns consists of the three col
umns under consideration and four adjacent beams framing into the up
per and lower joints. Each girder which is loaded by the full fac
tored gravity load (dead plus live) is to fail by forming a beam
mechanism with a plastic hinge at the column face and one at the
center.- A constant moment is therefore applied to each joint. This
moment is to be resisted by the columns above and below and also by
the beam which c-arries only the factored dead load. The size of this
beam is already known at this' stage because in the design procedure
all the beams are usually designed before the columns. To maintain
equilibrium of the joint, the resisting moment provided by the two
columns and the beam must be greater than the applied moment. Figure

-3
2 illustrates the procedure that has been developed for determining
the total resisting moment of the joint. The procedure involves the
construction of separate moment-rotation curves for the three members.
These curves are then added graphically to obtain the combined curve.
The peak of this curve determines the maximum total resisting moment.
It is readily seen that the' total resisting moment of the whole system
can still increase even after one or two of its members have reached
their maximum moment.
Previous studies have shown that the columns in interior subassem-
blages are likely to be bent in single curvature if the·two adjacent
5beams have about the same length and carry the same load. In design
calculations, the moment-rotation curves for symmetrical single curva-
ture bending are often used. To facilitate the design process, a set
of M-Q curves covering a wide range of columns has been prepared. 6
In the design of the exterior columns shown in Fig. 1, the sub-
assemblage will include the three columns and two adjacent beams.
Both beams are now loaded by the full gravity load and are expected to
fail almost simultaneously. Equal bending moments are therefore trans-
mitted to both joints, resulting in double curvature bending of the
columns. At each joint, the applied moment is resisted only by the
two columns. Figure 3 shows the procedure for determining the total
resisting moment of the columns. Once again, direct use of the moment-
rotation curves is made in the procedure. The necessary curves have
also been prepared and are available.6
The subassemblage method of design described above was developed
from the results of an extensive study on the behavior of individual

-4
columns. Conceptually, the method is applicable to both laterally
braced and unbraced columns. For columns having lateral bracing per-
pendicular to the plane of bending, the moment-rotation curves to be
used are those which consider only in-plane bending effect. For uu-
braced columns, the influence of lateral-torsional buckling should be
included in the construction of the M-Q curves. The latter case is
being investigated in a separate study.
The purpose of this investigation is to study the response of in-
terior and exterior subassemblages and to provide experimental con-
firmation of the design concept for the case involving only braced
columns.
1.1 Previous Research
The plastic behavior of beams has been investigated extensively
in the past and is well understood, A summary of the previous results
7has been prepared by Lay. A recent study by Lay and Smith has shown
that in a fixed end beam carrying uniform load, the moment developed
at the support may exceed the plastic moment of the section by 10 to
815 percent. This is due to the strain-hardening effect occurring in
the presence of high shear forces. A similar increase may occur in
the beams of a multi-story frame. Due to this increase, the maximum
moment applied to each joint in a subassemblage may be increased,
Therefore, the members in the subassemblage should be designed to re-
sist the increased moment. Tentative design provisions have been
formulated and are available,S

-5
Extensive research on individual beam-columns has been conducted.
I I 9To mention a few, there was the pioneer.ing work by von Karman which
10 11 ·'1,-' 12 13was followed by Westergaard and Osgood, Chwalla, Jezek, Horne,
14 15Galambos and Ketter, and Ketter. A fairly complete account of
their work can be found in Refs. 16 and 17. Most of these investiga-
tions dealt with symmetrical single curvature and one end moment cases.
Symmetrical double curvature columns were studied to some extent by
15Ketter. He pointed out that for relatively slender columns sub-
j ected to high axial ,forces, there was the possibility that the column
could unwind, or slip into an ,asymmetrical configuration.
18On the experimental side, work was conducted by Chwa1la,
19 20Johnston and Cheney, Campus and Massonnet, Mason, Fisher, and
Winter,21 and Van Kuren and Galambos. 22 With the exception of a few
tests reported by Campus and Massonnet and by Van Kuren and Galambos,
most of these tests were run on columns bent in single curvature.
Research on restrained beam-columns using the column deflection
curve (CDC) approach started with Chwa11a in 1934. 23 This was fol
lowed by Bij1aard,24 Horne,13 E11is,25 Oja1vo,26 Oja1vo and
27 28Fukumoto, and Lay. Experiments on restrained beam-columns were
b - -I' d - h d W- 29 d 1 b 30 dconducted y B1] aar , F1s er an 1nter, Lay an Ga am as, an
31Carpenter. All of these experiments had columns bent in single cur-
vature, and with the exception of one test by Lay and Galambos, all
these were conducted with relatively low axial load (less than 60 per-
cent of the axial yield load"of the column section, p). A completey
summary of the theory behind the CDC approach can be found in Ref. 32.

-6
Levi, Driscoll, and Lu have developed a more general approach
which can be applied to analyze restrained columns with and without
· h · bl d d · h · bl d · 33, 34sway, w~t var~a e en moments, an w~t varla e en restralnts.
Research on non-sway subassemblages is not very complete. A sub-
assemblage in this sense is a unit where bending moment is transmitted
to the column segment by means of loads applied through the beams. A
few such subassemblages have been tested by Baker, Roderick, Horne,
d C b ·d U· · 35, 36 b h d ban Heyman at am rl ge nlverslty, ut t ese were teste y ap-
plying a small beam load first and then increasing the column load un-
til failure occurred. These tests are summarized in Ref. 36.
Recently Gent conducted a series of similar subassemblage experi
37ments at Imperial College, but he too applied moment through beams
and then increased the column load until failure occurred.
All of these studies involved only observation of the behavior of
single beam-columns. Although some were bent in double curvature,
most of the tests were conducted on single curvature specimens. Thus
it is important to observe how two columns, above and below a" floor
girder, 'will share an applied moment. What is even more lacking is
information on how two columns bent in double curvature will share an
applied moment.
1.2 Objectives and Scope of the Investigation
The experimental investigation reported herein was planned to ac-
complish the following three objectives:

-7
1. To provide experimental confirmation of the column design
procedures discussed above.
2. To study the behavior of single and double curvature columns
under high axial load and to determine whether unwinding is
a possibility in columns bent in double curvature--all with
moment applied to the columns through loaded beams.
3. To study the manner in which two columns, above and below a
joint, share the applied moment.
With these objectives in mind, four subassemblages were chosen
for testing: two with the columns bent in single curvature (interior
subassemblage), and two with columns bent in double curvature (exte-
rior subassemblage). Figure 4 shows the configuration of the two
types of subassemblages involved.
The subassemblages shown in Fig. 4 are different from the ones
shown in Fig. 1 in that the restraining beams have been removed in the
single curvature specimen and that the end restraints are considerably
simplified. Since the collective resistance of a beam and a column
has been studied in some depth in the previous investigation on re-
30strained columns, and the main purpose of this research is to study
the manner in which two columns will collectively resist an applied
moment, it was decided to leave out the two restraining beams in the
single curvature specimens.
Attached to the free end of each member of the subassemblages in
Fig. 4 should be a spring that would represent the rotational re-
straint offered by all of the extraneous members that have been

-8
removed. Obviously, it would be quite difficult to represent these
springs in a well-controlled test and even more difficult to determine
their theoretical behavior. Therefore, pinned supports were chosen
for the far ends of all the members.
As shown in Fig. 3 the columns in the exterior subassemblages are
usually bent in double curvature with the point of inflection near
their midheight. The structural action of a double curvature column
can therefore be represented approximately by a column with half of
the actual height and with its far end pinned. This is done for the
upper and lower columns of the two exterior subassemblages.

-9
2. EXPERIMENTAL PROGRAM
2.1 Procedure for Designing Specimens
The first criterion for the design of the test subassemblages was
that all columns should withstand an applied axial load of 80 to 90
percent of the axial yield load at failure (as per Objective No.2).
The second criterion considered was that the slenderness, ratios of the
columns should be in the range commonly encountered in multi-story
frame design. Since these experiments dealt only with subassemblages
having laterally braced columns, the governing slenderness ratio was
that about the major axis (h/r). The selection of the column sizex
was further influenced by the maximum height (about 3~ ft.) of a com-
pression member that could be placed in the testing machine. With
these considerations in mind, an 8WF67 section was selected for all
the columns. The actual lengths adopted for the columns are given in
Art. 2.2.
Once the column section was selected, the next step was to choose
the beam members. These were chosen on the basis that they not be
longer than 20 ft. and that they be representative of the configura-
tion in practical frames. A span length of 20 ft. was chosen for the
upper beam and 15 ft. for the lower beam in the single curvature spec-
imens. A 20 ft. span was selected for both beams in the double curva-
ture specimens.

-10
After the column height had been determined, its section selected,
and the beam lengths set, it was only necessary to determine the
proper sections for the beams. The requirement at this point was that
the bending moments applied by the beams when a mechanism formed
should cause simultaneous failure of the upper and lower joints. Us-
ing a yield stress of 36 ksi and handbook values for section proper-
ties, two trial members were chosen. Then the axial force (or, more
conveniently, the axial force ratio, pIp ) in each of the three col-y
umns could be determined· based upon 0.8 P applied on the top columny
and the shears from the upper and lower beams which increased this
ratio in each of the lower columns. Corresponding to the proper pip,y
h/r , and end moment ratios, M and the M-9 curves were determinedx pc
from Ref. 6. This procedure was continued until the combination of
the two trial beams was such that both joints would fail simultan-
eously when the beam moments were applied. The beam moments which
were considered were assumed to be acting at the centerline of the
column. Since a plastic hinge would actually develop at the face of
the column when a beam mechanism formed, a moment equal to M plus thep
effect of shear (shear force times half the depth of the column,
Vd /2) would be applied to the centerline of the column. As mentionedc
in Art. 1.1, the maximum moment near the column face is likely to ex-
ceed the plastic moment because of the effect of strain-hardening. To
account for this effect, Ref. 5 recommends that an increase of 10 per-
cent of the plastic moment be included in the design. Accordingly,
the criterion for balanced design for single curvature subassemblages
was
M.J
d~1.10 M + V_
P 2( 1)

~ll
and that for double curvature subassemblages was
deM. ::: M + V_
J P 2(2)
Although the order in which the members were chosen is reversed
from a normal design procedure, the finished product was a wel1-
controlled specimen that would simulate a portion of an actual frame.
2.2 Test Specimens and Preliminary Design Data
.Four subassemblages were chosen for the investigation--two with
columns bent in single curvature and two in double curvature (Fig. 4).
The only variable between the two single curvature tests is the h/rx
ratio. The first test, SC-l, had three columns, each with an h/r rax
tio of 35; the second test, SC-2, had three columns, each with an h/rx
ratio of 30. The three columns of each test were of equal length--for
SC-1, h = 10.8 ft. and for SC-2, h = 9.3 ft. The upper beam was on
the west side of the column and was 20 ft. long for both tests. The
lower beam was on the east side of the column and was 15 ft. long for
both tests. Figure 5 gives the dimensions and sizes of all the mem-
bers of the two test subassemblages. Also given in Fig. 5 are the
design data for the subassemblages. The axial load on the column and
the loads which would produce a mechanism in the beams' are listed.
The mechanism consisted of a plastic hinge near the face of the column
and a second hinge at the farther load point from the column. The
plastic moment of each beam and the moments transmitted to both joints
(when strain-hardening is considered and when it is not) are shown.
Finally, the ultimate moment that the two columns of each joint can re-
sist can be compared to the maximum moment applied to the joint

-12
(including strain-hardening) to show that the designs are actually
balanced. All the values listed were calculated from an assumed yield
stress of 36 ksi and handbook cross-sectional properties.
The variable between the first and second double curvature test
is also the h/r ratio. The first test, DC-I, had three columns, twox
with an h/r ratio of 17.5, and the middle column with an h/r ratiox x .
of 35. The second test, DC-2, had an upper and lower column with h/rx
of 15 and the middle column with h/r of 30. For ,Test DC-I, the colx
umn lengths were 5.4 ft., 10.8 ft., and 5.4 ft. for the upper, middle,
and lower columns respectively. For Test DC-2, the column lengths
were 4.6 ft., 9.3 ft., and 4.6 ft. for the upper, middle, and lower
columns respectively. The upper and lower beams were both on the west
side of the column and were both 20 ft. long. Figure 6 gives the di-
mensions and sizes of all the memb,ers of the two double curvature sub-
,assemblag~s. As in Fig. 5 the axial load on the column, the theoret-
ical plastic load, the plastic moment of each beam, and the moments
transmitted to both joints are listed. The moment transmitted to the
joints when strain-hardening is considered has been included for com-
parison purposes only. It was not used in the design of the subassem-
blages. The ultimate moment can again be compared to the maximum mo-
ment applied to each joint to show that ~he designs are actually
balanced. All the values listed were based on a yield stress of 36
ksi and handbook cross-sectional properties.

-13
2.3 Specimen Details
The column in each test specimen was of one length throughout.
Plates 1-1/4 in. thick were welded to the two ends of each subassem
blage and then were milled to remove any unevenness. These plates
were drilled so that the ends could be bolted to the test fixtures.
Milling was considered necessary to make alignment much easier. The
method used to align the column~ will be discussed in Chapter 3.
A typical beam-to-column connection is shown in Fig. 7a. The two
horizontal stiffners are the same thickness as the flanges of the beam,
and the diagonal has "been included and made much thicker than was nec
essary. The only criterion for the design of the stiffners was that
no failure should occur in the connection.
There were only two types of special details which were necessary
on the beams: one, a hole for the pin support at one end; and two,
pins through the web to transmit the loads. Before the hole was
drilled in the end of each beam, a 5-1/2 in. x 1 in. x 5-1/2 in. plate
was welded to each side of the web so that its centerline was 4 in.
from the end of the beam. Then a 2-1/2 in. hole was drilled perpen-
dicular to the web, thus allowing a 2-1/4 in. pin to be used as the
end support.
The detail for a typical load point is shown in Fig. 7b. Two
load points were located at the quarter points of each beam. The
1-1/2 in. x 10 in. pins were welded in holes in the web of each beam
at the proper locations and perpendicular to the web. Then vertical
stiffners were welded from the pin to the flange. This arrangement

-14
allowed the load to act at the centerline of the beam and to produce
fewer local effects.

-15
3. TEST SETUP AND PROCEDURE
3.1 General Description of Test Setup
The four tests were conducted on the static test floor with the
column set up in a 5,000,000 lb. capacity hydraulic testing machine.
The column was placed at the centerline of the machine, and the beams
were welded to the column at one end and attached to a supporting
tower at the other. For the single curvature tests, the upper beam
was welded to the west flange of the column and the lower beam to the
east flange. Figure 8 gives a schematic view of the setup for single
curvature tests, and Fig. 9 shows a photograph taken during one of the
tests. For the double curvature tests, both beams were welded to the
west flange of the column. Overall views of the setup for testing
double curvature subassemblages are shown in Figs. 10 and 11.
Only one supporting tower was required for the double curvature
tests (both beams. rested on rollers attached to the same tower), but
two supporting towers were required for the single curvature test.
Each supporting tower was bolted to a 5 ft. x 6 ft. x 2 in. base plate
that was drilled for the hole pattern in the static test floor and
drilled and tapped to accept the tower base plate and the gravity load
simulators which were used to apply beam loads. A companion plate
5 ft. x 1 ft. x 2 in. was used to s~pport the other ends of the grav
ity load simulators. The large base plate was fabricated so that the

-16
towers could be positioned for beam lengths of 15 ft., 17 ft., 18 ft.,
and 20 ft.
In addition, the towers were sized' to accommodate subassemblages
with either tw~ or four beams attached, and were drilled along their
length to fasten the beam end fixtures at any height desired up to a
combined height of 35 ft. (the maximum length of column which could be
placed in the machine).
For the first single curvature test, a special end fixture was
fabricated to pin the end of the beams at the supporting tower. The
beams for all tests were fabricated to fit the pin-end condition.
During the first test, as the beams began to fail (near the end of the
test), tension was developed in the beams. This force tended to pull
the test column out of alignment. To minimize. this effect, the pin·
was replaced by a roller support, and a pin-end link assembly was pro
vided at each story level to restrain the columns. The original end
fixture was repositioned to accommodate the roller support. The de
tails of the roller support· are shown in Fig. 12. The link assembly
shown in Fig. 13 consisted of a stiff turnbuckle which was pinned at
one end to a fixture attached on the test column and was similarly
pinned at the other end to a box beam that was bolted to the support
ing columns of the testing machine. All of the pins, holes, and fix
tures were machined to very close tolerances in order to remove play
in the assembly. The turnbuckle permitted adjustments to be made be
fore the test began, after which time no adjustments were made.
Deformations of the column out of the plane of bending were pre
vented by special bracing systems designed based on the Watt's linkage

-17
38concept. The bracing systems prevented lateral and torsional move-
ment but did not offer any restraint to in-plane deformation. The
braces were attached to a 6 in. beam which was bolted to the support-
ing columns of the testing machine. The details of the bracing system
can be seen from the photograph of Fig. 14. In the single curvature
subassemblages, five braces were used, two at the story levels and
three at the midheights of the columns. Three braces were used in the
double curvature tests, two at the story levels and one at the center
of the middle column. The use of a midheight brace re,sulted in a
bracing spacing of 30.6 r for SC-l and DC-l and 26.3 r for SC-2 andy y
DC-2, where r is the radius of gyration about the minor axis of they
column. These bracing spacings had been found adequate to ~nforce in-
1 d f ·· · d· 5, 22-pane e ormat10n 1U preV10US stu 1es.
Lateral movement of the beams was prevented by knife edges that
fitted snugly on both sides (see Fig. 15). The fixtures were bolted
to a 10 in. x 10 in. x 3/8 in. box beam which was positioned above the
test beam. The box beam was in turn bolted to a fixture on the sup-
porting tower on one end and on the other end to channels bolted to
the 6 in. beam sections on the testing machine. The. spacing of the
braces was determined from the formulas developed in Refs. 39 and 40
and recommended for use in plastic design.
Since the ends of the columns were assumed pinned, standard pin-
end fixtures, which always assured that the center of rotation would
lie at the base of the column, were used. In the single curvature
tests, one fixture was bolted to the crosshead of the testing mac~ine,
and the other was placed on the test floor. Only the friction between

-18
the fixture and floor was necessary to resist the shearing forces. In
the double curvature test, the same two fixtures were used, but the
bottom fixture was placed upon a 4 ft. high test pedestal ,in order to
provide sufficient clearance for the gravity load simulator.
3.2 Load Application
Column loads were applied directly by the testing machine. The
column had been placed at the intersection of both centerlines in the
machine between the movable crosshead and the test floor, so as to ap
ply a concentrical compressive load on the column.
Beam loads were apphied at the quarter points by using a spreader
beam attached to a gravity load simulator. Provided that the bases of
the simulator were horizontal, a load would always be applied verti~
cally, regardless of any lat~ral movement or initial lateral displace
ment. The jack in the simulator was hydraulic and could apply a max
imum load of 80 kips. The details of the simulators are described in
Ref. 38.
The single curvature subassemblages required only one simulator
for each beam. Each simulator was bolted at one end to the large sup
porting tower base plate and at the othe~ end to the smaller companion
plate. A 1-1/2 in. diameter -rod was pinned to the jack arm at the bot
tom and to the adjustable spreader beam at the top (see Fig. 8). The
adjustable spreader beam was capable of applying quarter point loading
to any of the beams that would fit in the testing apparatus.

-19
The double curvature subassemblages required a special arrange
ment to load the upper beam, since the two beams were on the same side
and one above the other. The lower beam was loaded by the same method
as was used in the single curvature subassemblages. On both sides of
the simulator that applied loads to the lower beam, two additional
simulators were bolted to the base plates. One and one-half in. rods
led from these two simulators, up past the lower beam and to an auxil
iary spreader beam. This auxiliary spreader beam was welded to the
top of the adjustable spreader beam and perpendicular to it. Thus the
two outside simulators both loaded the adjustable spreader beam which
applied quarter point loading to the upper beam (see Fig. 10).
3.3 Instrumentation
Strains in the beams and columns were measured by SR-4 resistance
strain gages. At each section these gages were placed on all four
flange tips. Wi~h gages located in this manner, the axial load and
moment at the section at any particular time could be determined.
Five sections were gaged on each beam for all four tests. For the
single curvature tests, thirteen sections were strain gaged on the
column and at fourteen locations for the double curvature tests.
The strain gage readings were punched directly onto computer
cards through the B & F data aquisition system. For the single curva
ture tests, ninety-two channels were used for strain gages and eight
for electrical rotation gages. For the double curvature tests, ninety
six channels were used for strain gages and eight for electrical rota
tion gages. The B & F unit reads and punches the variable resistance

-20
data at the rate of thirty channels per minute, thus requiring a total
time of about three minutes per load increment.
Rotation at four locations was measured two ways. First, a me
chanical level bar was set up at the top of the upper column, at the
upper joint, at the lower joint, and at the bottom of the lower column
(see Fig. 16a). Second, electrical rotation gages were placed at the
top and bottom of each column as well as at each joint, where there
were three gages: one above the joint, one below, and one on the beam
at a distance equal to the depth of the beam away from the face of the
column. The arrangement of electrical rotation gages at a joint is
shown in Fig. l6b.
The deflection of all the members was measured in each test.
Readings were taken on the column at each strain gage location and on
the beams at the west load point, centerline, east load point, and
column flange. The column displacements were measured by a linearly
varying potentiometer which was connected to the column at the proper
locations with a wire (Fig~ l6c). When the column deflected, the wire
would change the pointer on the potentiometer,.thus changing the volt
age which could be calibrated directly into inches. The beam deflec
tions were measured through a Kern level which was sighted on a scale
glued to the beams at the proper locations. Displacements were thus
measured directly from the scales.
Beam loads were measured by two methods. First, the jack load
could be calculated from the pressure in the hydraulic system. Second,
dynamometers were used as the connecting link between the adjustable

-21
spreader beam and the test beam. Thus, a dynamometer reading was
taken at each load increment which could be converted directly to load.
3~4 Test Procedure
Erection of Test Specimens. Each subassemblage was shipped in
three pieces: column and two beams. Thus, field welding was required
after the specimen was fully assembled in the testing machine. The
column was aligned with a transit to assure that it was plumb and in
the center of the machine. The beams were aligned with a transit and
a carpenter's level to assure that they were parallel to 'the web of
the column, in the center of the column, and horizontal.
After all members had been positioned, all bracing attached, and
the members clamped together, the strain gages were wired and con-
nected to the B & F unit. Readings were taken immediately before
welding, at intervals during welding, and after all the welds had
cooled. These readings permitted an evaluation of the welding
stresses present in the test specimens, which were then converted to
bending moments for later use. Figure 17 shows the residual moment
distributions for Subassemblages SC-2 and DC-2. In SC-2 the maximum
values were 15.8 kip-in. and 18~4 kip-in. in the upper and lower beams
respectively, and 16.7 kip-in. in the middle column. These moments
represent approximately 3 percent, 4 percent, and 0.8 percent of the
M values of the members. (For the column, the maximum moment isp
equivalent to 4 percent of the M value for an axial load of 0.8 P .)pc y
The residual moments in DC-2 were considerably higher with a maximum
of 55.6 kip-in. (10 percent of M ) occurring at the center of thepc

-22
middle column. Fortunately, the center portion of the column was sub-
jected to relatively low bending moment during the test and did not
yield extensively.
Alignment~ After welding was_completed, it was necessary to
align the column under load. The procedure used is similar to the one
41used in testing centrally loaded columns. Column strain gage read-,
ings were taken first at zero load and then again at a load approxi-
mately equal to 1/3 P. Initially, the resulting differences wouldy
show a load that was being applied eccentrically. Adjustments were
made, and the process continued until the strain gages showed that an
axial load was being applied. The criterion for acceptance was a 5
percent difference among the four strain gages at every location in
the column.
Test. Each test was completed in approximately ten hours. First,
column load was applied in ten increments until the chosen percentage
of P was reached. This initial loading was conducted with no load ony
the beams. Readings of the strain gages, rotations, and the beam and
column deflections were taken at each increment. Second, proportional
loading was applied to both beams in fifteen increments and readings
were taken at each increment. Loading progressed until failure oc-
curred. If, at this point, the beams had failed, additional axial
load was applied to the column while' maintaining the failure loads on
the beams. In this way, the reserve strength of the column could be
found, although theoretically, balanced design requires that failure
occur in the beam and columns simultaneously. It was hoped that the
columns would remain stable long enough to ensure failure in the peams

-23
and even retain some reserve strength. Testing procedure differed
slightly with each test. ·These differences will be discussed in Chap
ter 5.

-24
4. MECHANICAL AND CROSS-SECTIONAL PROPERTIES
ASTM A36 steel was used for all four subassemblages. In order to
minimize the differences in mechanical properties, all steel was or
dered rolled from the same heat and ingot as much as was practical.
The steel delivered was actually rolled from five heats (one heat for
each size of section ordered). All members were gag straightened
where necessary. Four types of tests 'and measurements were perfonned
to determine the mechanical and cross-sectional properties: tension
tests, cross-sectional measurements, stub column tests, and residual
stress measurements.
4.1 Tension Tests
A summary of the data obtained from the tension tests is given in
Table 1. Static yield stress, ultimate stress, percent elongation,
and strain-hardening modulus were determined from three tension cou
pons cut from each location with two locations chosen for each member.
One specimen was cut from the edge of each flange and one at the
centerline of the web. A numerical average for each of the four prop
erties was determined for the web and flange separately from each mem
ber. Based upon these average values for the web and flanges separ
ately, a weighted average was determined and listed in Table 1 for
each member. For the columns, the four properties were weighted ac
cording to the area of the flanges and web. For the beams, the four

-25
properties were weighted according to the plastic section modulus, Z ,x
of the flanges and web.
The average yield stress of all beam members ranges from 33.98 to
38.09 ksi, while the range for all column sections is from 28.91 to
31.47 ksi. The standard deviation for the column cr is 1.03 ksi,y
which is 3.4 percent of the average cr of 30.09 ksi, and the standardy
deviation for the beam cr is 1.42 ksi, which is 4.0 percent of the avy
erage cr of 35.85 ksi. These deviations are considered to be smally
but do not seem to improve for the columns which were rolled from the
same heat.
4.2 Cross-Sectional Measurements
The cross sections were measured at each strain gage location on
the main test specimens using a micrometer and vernier calipers. The
average values along the length appear in Table 2, along with the hand-
book values. Average values for each dimension were taken for the
section as a whole. These average dimensions were then used to deter-
mine the area, A, the moment of inertia, I , and the plastic sectionx
modulus, Z. , of each section. Comparison with the handbook values ofx
the section properties shows that there were no significant differ-
ences between the measured and handbook values.
4.3 Stub Column Tests
One 27 in. stub column was cut from the test steel for each of
the four columns and its ends milled square. The value of P was dey
termined for each of the four columns and was used to compute the load

-26
which would be applied to the columns during the tests. The values of
P are shown in Table 2 along with values of M. All the M valuesy p p
were calculated from the cross-sectional measurements and the results
of the tension tests.
4.4 Residual Stress Determination
The method of sectioning was used to determine the residual
42stress distribution in each of the four test columns. Two typical
patterns are shown in Fig. 18. The difference between the two pat-
terns is quite marked, as is the difference between these patterns and
the one that was used to develop the curves in Ref. 6, which were used
to design the test specimens. The two straight line distribution pat-
terns shown in Fig. 18 were assumed for ease of computer programming
in developing the theoretical M-Q curves to be discussed in Chapter 6.

-27
5. EXPERIMENTAL BEHAVIOR OF SUBASSEMBLAGES
5.1 Design Data Based on Measured Mechanical and Cross-SectionalProperties
The data that were used for the initial design of the subassem-
blages have been given in Figs. 5 and 6, but these data needed to be
revised according to the results of the control tests. The revised
data are listed in Figs. 19 and 20. The procedure for developing
these data was very similar to the preliminary design except that the
size of the members had already been chosen.
The yield stress of the columns was in all cases lower than what
was specified, but the yield stress of the beams was close to the
specified value. Therefore, it was necessary to reduce the axial load,
F, in order to increase the moment carrying capacity of the columns
and ensure balanced design. To accomplish this, the moment carrying
capacity of each joint was calculated for several trial values of F.
In these calculations, the measured mechanical and cross-sectional
properties were used, but the required M-Q curves were still those
given in Ref. 6, which were prepared for a specific pattern of resid-~
ua! stress distribution.'\ The particular F value which resulted in a
~
I\The residual stress distribution assumed had a maximum compres-sive stress at the flange tips of 0.3 times the yield stress of the material. A de~ailed description of this particular pattern can befound in Ref. 14.

-28
set of Mu
andM£ values that would just balance (or nearly so) the
maximum applied moments at the joints was then selected for the test.
For the single curvature subassemblages, SC-l and SC-2, the criterion
for balanced design included the effect of strain-hardening and is ex
pressed by Eq. 1. For the first double curvature subassemblage, DC-I,
the effect~of strain-hardening was not included, and the design cri
terion was that given by Eq. 2. In the second double curvature sub
assemblage, DC-2, strain-hardening was considered, and the design cri
terion of Eq. I was used. This was done to study the possible
influence of strain-hardening in the double curvature columns. The
new F values for the four tests were given in the first rows of the
tables in Figs. 19 and 20. The corresponding values of Mu and M~ are
also given in the tables (upper row in SC-l and SC-2).
The values listed for the axial load, F, applied to the column
appear to be inconsistent with wha~ is normally expected. Test SC-2
should be able to sustain a larger F than SC-l and still maintain the
same moment carrying capacity at its joints because its columns are
shorter. But this is not true for these tests because of a difference
in yield stress levels. The difference in yield stress levels caused
more of a change in F from SC-2 to SC-l than did the slight increase
in the moment capacity because of the re4uced column height.
After the tests had been completed, the moment carrying capacity
of the joints was analyzed again by using the more exact M-Q curves
developed for the measured residual stress distribution (linearized ap
proximation shown in Fig. 18). The results of this analysis showed
that the columns in the single curvature subassemblages had less

-29
moment capacity than that predicted previously. The moment capacities
determined from this analysis for SC-l and SC-2 are listed in the
lower row for Mu and M~ in Fig. 19. These results are used as the ba-
sis of comparison with the test results.
The analysis also showed that the moment carrying capacity of the
double curvature columns was not affected by a change of the residual
stress distribution. The columns could carry a maximum moment equal
to the plastic moment, M . Instability effect usually plays a minorpc
role in double curvature columns.
given in Fig. 20 for each test.
Only a single set of M and M isu £
There was little change in cross-sectional dimensions ·from the
values which were listed in the handbook. Therefore, there was only a
slight change in hlr from the one chosen in the preliminary design.x
This slight change also indicates that the changes in design para-
meters from the preliminary ones were due mainly to the change in
yield stress level.
5.2 Experimental" Behavior
Figures 21 through 24 present the joint moment versus joint rota-
tion, M-e, curves for the four tests. Each figure describes separ-
ate1y the behavior ofl
the upper and lower joints of a particular sub-
assemblage. In each experimental curve, the points are labeled with
numbers that correspond to the load increments in the test. The £01-
lowing load numbers were assigned to the first increment of axial load
in the four tests: SC-l, No.1; SC-2, No.1; DC-I, No. 37; DC-2,

-30
No. 27. Numbers I through 36 in DC-I and 1 through 26 in DC-2 corre
spond to welding and alignment readings.
All the plotted points on the curves represent static equilibrium
positions of all members of the subassemblage. These curves are pre
sented here to help describe the behavior of the test specimens under
gradually increasing load. A detailed comparison of experimental and
theoretical results will be 'given in Chapter 6.
In each test nine initial load increments are not plotted on the
experimental curves. These points correspond to the addition of axial
load on the column and should not involve any increase in moment or ro
tation at the joint. But, because of -column shortening, a small mo
ment and joint rotation were observed during the application of the
axial load. Therefore, the last column load (No. 10 for SC-I and
SC-2, No. 46 for DC-I, and No. 36 for DC-2) is shown on the graphs as
the accumulation of all the moments and rotations up.to that time.
Test SC-l. This was the first of the single curvature subassem-
.blages tested. First yielding was noticed on the flange tips of the
columns near the joints at F = 280 kips before the full axial load of
483 kips had been applied. This yielding occurred at places where
there was high residual stress resulting,either from the fabrication
or the cooling process. As the beam load was applied (Load No. 13),
yield lines started to spread in the middle column on the flange that
took increased compression due to bending. At Load No. 15 yielding
began in the top column, and at Load No. 19 yielding began in the bot
tom column, all occurring in the compression flanges. First yielding
in the beams occurred at the load points farther from the columns at

-31
F = 8.7 kips (Load No. 20). The maximum loads that the beams couldu
sustain were 14.4 kips and 15.7 kips for the upper and lower beams re-
spectively at Load No. 29. Additional beam deflection was produced at
Load Nos. 30 and 31, but no increase in load was observed. At this
point the beams were assumed to have failed. Increased axial load was
then applied to the columns by the testing machine while attempting to
maintain the beam loads. The columns could sustain no more load at
Load No. 33 with F = 491 kips,.
The dashed portion of the experimental curves in Fig. 21 corre-
sponds to this increase in axial load. Since the column load was in-
creased, the maximum moment that each joint could take was decrease~.
Thus this decrease in moment is not the normal unloading portion of an
M-Q curve that would have occurred if the previous loading procedure
had been continued.
Figure 25a shows a photograph of a failed single curvature speci-
men. The center columns were bent in single curvature as' can be noted
more clearly in the longitudinal view shown in Fig. 25b. The hinges
that formed in the beams are indicated by exploded views in Fig. 25a.
The location of these hinges and their relationship with the .beams and
columns are indicated.
Test SC-2. The general behavior of this test was similar to that
of the first. First yielding was noticed on the flange tips of the
columns in the vicinity of the joints at F = 280 kips. As the beam
loads were applied, yielding progressed throughout the columns. At
Load No. 13 yield lines started to spread in the center portion of the
middle column. At Load No. 16 yielding commenced in the upper column,

-32
and at Load No. 18 the lower column also began to yield. All yielding
occurred in the compression flanges.
First yielding in the beams occurred at the load points farther
from the colum~s at F = 10.5 kips (Load No. 19). The maximum loadsu
that the beams could sustain were 14.3 kips for the upper beams at
Load No. 27 and 16.8 kips for the lower beam at Load No. 28. Although
the beam loads were applied proportionally, the two beams did not fail
simultaneously. Therefore, the load was maintained in the upper beam.
while the necessary additional load was applied to the lower beam to
cause failure. As increased loading was attempted for Load No. 29,
the only result was increased deflection. This was the indication
that the beams had failed.
Figure 26 shows a plot of the deflections. of the subassemblage.
for a load before the beam capacity was reached, at the beam capacity,
and just after the beam capacity was reached. The beams deflected
continuously at the maximum loa.d, while the column remained stationary.
The deflected shapes of the· columns are almost the same for the three
load increments (only one is plotted). This shows that failure actu-
ally did occur in the beams at the load increment mentioned and that
the column had not failed.
Additional axial load was applied to the column during Load No.
30 until the total axial force reached 470 kips,. but this load could
not be maintained in static equilibrium, and the load dropped back to
453 kips. Thus, at the time of beam failure, the column was so close
to failure that even a slight increase in axial load could not be sus-
tained. At this point the weld in the top flange of the upper beam

-33
cracked slightly, and the test had to be halted. The results obtained
from this phase of the test are given as the dashed portion of the ex-
perimental curves in Fig. 22.
Test DC-I. This was the first of the double curva-ture subassem-
blages tested. Column yielding was first" noticed at F = 350 kips in
the flange tips near the joints. The application of the beam loads
caused all three columns to yield at the same time (Load No. 55) in
the compression flanges. Beam first yielding occurred at F = 15.0u
kips (Load No. 56). The maximum loads that the beams could sustain
were 21.2 kips for the upper beam at Load No. 62 and 17.5 kips for the
lower beam at Load No. 61. One significant difference between this
and the single curvature tests is that the beam load was maintained
over a longer period. The beam loads stayed almost unchanged from
Load No. 61 through 65.
Deflections of the beams and columns were plotted for three load
points near the maximum load of the beams. These plots are shown in
Fig. 27. It is obvious from an inspection of these deflections that
the failure occurred first in the beams.
From Load Nos. 64 to 65, the column load was gradually increased.
The maximum load that the columns could take while still maintaining
the beam loads was 450 kips. This was a reserve strength of 8 kips
over the test load of 442 kips.
For Load Nos. 66 and 67, the beam loads were purposely "reduced,
and the column load could then be raised to 470 kips. This was done
to study how a subassemblage would eventually fail under successive

-34
increase of axial load. At Load No. 66 the column load reached 460
kips, but since the moment at the joint had already reached maximum,
an increase in axial load could not be attained without a.correspond
ing decrease in applied moment. Thus, the beam loads had to be
lowered. The column load was raised again to 470 kips at Load"No. 67,
and the beam loads had to be further reduced. The dashed portion of
the experimental curves in Fig. 23 reflects these changes in axial
load with corresponding decreases in applied moment. This should not
be compared with the normal unloading portion of an M-Q curve which
assumes a constant axial force.
Figure 28 shows a plot of the deflection of the middle column.
The three load increments listed are near the peak of the M-Q curve
'shown in Fig. 23. By following the deflection plots, it can be seen
that the double curvature shape was maintained throughout the critical
portion of the test. Unwinding therefore did not occur in this test.
the failed test specimen is shown in Fig. 29a. The photograph of
the columns shows extensive yield lines developed near both ends of
the middle column where bending moment was maximum. The hinges that
formed in the beams are pictured in enlarged photogr~phs in their
proper locations. The longitudinal view of the column in Fig. 29b
shows more clearly the double curvature shape that the column assumed
at failure.
Test DC-2. This test was similar to the first double curvature
subassemblage. Column yielding was first noticed at F = 300 kips in
the flange tips near the joints. At Load No. 43, under the influence
of beam loads, yielding in the compression flange commenced in the

-35
lower half of the middle column. The top half of the middle column
and the upper and lower columns began yielding in the compression
flange at Load No. 45. First beam yielding occurred at F = 10.0 kipsu
(Load No. 42). The maximum loads that the beams could sustain were
19.6 kips for the upper beam (Load No. 53) and 17.0 kips for the lower
beam (Load No. 52). The beam loads remained almost unchanged for Load
Nos. 52 through 59. Column load was increased during Load Nos. 58 and
59 until it reached 483 kips. This was 19 kips over the test load of
464 kips. The dashed portion of the experimental curves in Fig. 24
shows the results obtained during the application of increasing axial
load.
For all tests equilibrium was obtained very quickly in the elas-
tic range and before the maximum moment was reached. But after this
point, it took more time to achieve a static equilibrium position.
Initial loading of the structure was mainly elastic, but as sections
began to reach yield, a redistribution of moments occurred. Stability
of the beams, columns, and loads (all non-varying parameters) was used
as a criterion to determine that the entire system had reached an
equilibrium state.

-36
6. COMPARISON OF EXPERIMENTAL RESULTS WITH THEORETICAL PREDICTIONS
As described in Chapter 3, during each test sufficient readings
were taken to permit the determination of all the applied loads, the
bending moments in the beams and at the joints, and the resulting de
formations including beam deflections, column deflections, and joint"
rotations. With this information, it is possible to compare the ex
perimentally observed behavior with theoretical predictions. In this
chapter, the behavior of the beams will be examined with respect to
the loads carried, and the behavior of the columns will be examined
with reference to the moment-rotation relationships of the upper and
lower joints.
6.1 Maximum Loads Carried by Beams
Two items are of interest when studying the behavior of the beams:
1) the load at which the beam failed compared to the theoretical fail
ure load based upon simple plastic. theory; and 2) the moment that was
delivered to the joint by the beam at the time of beam failure. The
latter will be discussed in Art. 6.2.
The theoretical failure loads of the beams were computed accord
ing to simple plastic theory for the failure mechanism described in
Chapter 5. The results have been presented in the tables in Figs. 19
and 20. Strain-hardening was not considered in the calculations, nor
was the effect of shear force existing at the plastic hinge location.

-37
The experimental and theoretical failure loads with the corresponding
differences are as follows:
Theoretical ExperimentalFailure F.ailure Percent
Load (kips) Load (kips) Difference
Upper Beam 13.7 14.4 + 5.1SC-l
Lower Beam 14.4 15.7 + 9.0
Upper Beam 13.1 14.3 + 9.2SC-2
Lower Beam 13.9 16.8 +20.8
Upper Beam 20.1 21.2 + 5.5DC-l
Lower Beam 17.0 '17.5 + 2.9
Upper Beam 20.0 19.6 - 2.0DC-2
Lower Beam 17.2 17.0 - 1.2
Because of the effect of strain-hardening, the experimentally ob-
served loads are higher than the theoretical loads (except in DC-2).
For the four tests, the average discrepancy is about 8.4 percent.
6.2 Moment versus Rotation eM-Q) Relationships of Joints
Development of Theoretical M-Q Relationships. To develop the
theoretical M-Q relationship of a joint, it is first necessary to con-
struct the M-Q relationships of the individual columns meeting at the
joint. The M-Q curves of the columns can then be constructed by apply-
ing the Column Deflection Curve (CDC) Concept, the details of which
are discussed fully in Ref. 32. In developing the M-G curves for the
columns in a single curvature subassemblage, the middle column was as-
sumed to be bent in a symmetrical configuration by equal end moments
acting in opposite directions. Similarly, the middle column in a

-38
double curvature subassemblage was assumed to be bent in an antisym
metrical configuration by equal end moments but acting in the same di
rection. Furthermore, the axial loads in the columns were assumed to
be constant (not to vary with the applied moment) and equal to the ax
ial loads present in the columns at failure. The assumed conditions
were not completely fulfilled in the tests. The moments at the ends
of the middle column were not exactly equal because the moments ap
plied by the beams to the two joints were not equal. Also, the axial
loads in the middle and lower columns were not constant. They in
creased slightly as the beam loads increased. These deviations, how
ever, are believed to have only minor effects on the overall predic
tions. The same assumptions were also made in the development of the
design methods in Chapter 1.
The theoretical M-Q curves for the columns were prepared through
the use of a computer program that consisted of three parts: first,
it developed the moment-thrust-curvature (M-P-~) curve; second, it
generated the necessary CDCs; and third, it selected an appropriate
portion of each CDC, from which a pair of moment and rotation values
were obtained. The resulting M-Q curves were then added graphically
to obtain the M-e curve for the joint using the procedure illustrated
in Figs. 2 and 3. For the purpose of co~parison, the maximum moment
which could be expected to be delivered to the joint was superimposed
on the joint M-G curve. This resulted in the expected·behavior of
that particular joint in a subassemblage. The theoretical joint M-Q
curves of the four subassemb1ages are shown as the dashed lines in
Figs. 21 through 24.

-39
In developing the predicted M-Q curves of the various joints, the
measured mechanical and cross-sectional properties and residual stress
distribution as described in Chapter 4 were used. It was found that
the resulting curves depend significantly on these properties. Figure
30 shows three theoretical M-Q curves (dashed curves) of the upper
joint in Subassemblage SC-l. The top curve was determined directly
from the curves presented in Ref. 6 with a linear interpolation to de-
termine the correct curve for the chosen pIp value and with the othery
necessary mechanical and cross-sectional properties taken from the
handbook. The second curve also utilizes the curves in Ref. 6, but
the mechanical and cross-sectional properties used were those actually
measured from the test specimen. The .third curve was generated from
the computer program using the measured cross-sectional dimensions and
properties. A comparison of the second and third curves shows the ef-
fect of variation in residual stress distribution on the joint M-Q
curves. The second ,curve was based on the triangular residual stress
pattern as described in Chapter 5. The third curve was based on the
linearized approximation of the measured residual stress distribution
shown in Fig. 18. This distribution is quite similar to the former
one except that it has more compressive area and less tensile area.
But, even with this slight change, there is a marked change in the re-
suIting M-Q curve.
Comparison of Theoretical and Experimental M-G Relationships. In
Figs. 21 through 24 the M-Q curves obtained from the four experiments
are compared with the theoretically predicted M-Q curves. The moment
plotted on the experimental curve is always the moment transmitted
from the beam to the joint. The attainment of the maximum moment

-40
usually signifies the failure of the beam and not of the columns.
This is because in all the tests the beams failed before the columns.
In SC-2 failure also occurred first in the beams, but this· failure oc
curred nearly simultaneously with the failure of the columns. As ex
plained in Chapter 5, in all the tests, attempts were made to apply
additional axial loads to the columns after the beams had reached
their maximum loads. It was found that the columns in SC-2 failed to
support any significant increase in axial load. The results obtained
during the application of additional axial loads are shown as dot
dashed curves in Figs. 21 through 24. It is emphasized that these re
sults should not be compared with the theoretical predictions which
were made for the case of constant axial force.
For the single curvature subassemblages, SC-1 and SC-2, the max
imum moments applied by the beams to the joints were greater than
those predicted by assuming ideal plastic hinges forming at the face
of the columns (with the exception of the upper joint in SC-l). These
moments are in close agreement with the predicted values including a
10 percent increase of the plastic moment due to strain-hardening.
Because of the strain-hardening effect of the hinges near the columns,
the beams were able to carry loads higher than those predicted by
simple plastic theory.
Since the columns in the two single curvature subassemblages were
designed to include the 10 percent increase in the applied moment, no
failure occurred in the columns prior to the failure in the beams.
Therefore, the experimental M-Q curves can be compared with the theo
retical curves up to the point of maximum moment. Figures 21 and 22

-41
show that the experimental curves agree reasonably well with the theo
retical predictions, although there is a noticeable difference in the
slope of the two sets of curves. The joints tended to rotate more
than predicted. This is probably due to the presence of welding resid
ual moment (as described in Chapter 3), high local stresses, and also
the various approximations'made in developing the theoretical curves.
The descriptions presented above for the single curvature subas
semblages hold true also for the double curvature subassemblages. As
mentioned in Chapter 5, a different criterion was used in selecting
the axial load,F, for each of the two double curvature tests. In
Subassemblage DC-I, the axial load was selected in such a way that at
each joint the resisting moment provided by the columns would be just
sufficient to balance a beam moment computed from Eq. 2 (strain
hardening effect excluded). Theoretically, this would have prevented
strain-hardening from taking place at the plastic hinges. The results
presented in Fig. 23 indicate that no strain-hardening occurred in the
lower beam. The upper beam, however, was able to transmit a moment
even higher than that computed from Eq. I (including 10 percent in
crease in the plastic moment). This result indicates that it is also
possible for the columns in a double curvature subassemblage to strain
harden. No theory is available for analyzing beam-columns with sig
nificant strain-hardening.
In Subassemblage DC-2, it was decided to adjust the axial load so
that the resisting moment at each joint would be sufficient to balance
a maximum moment computed according to Eq. 1. In this test, the ,ex
perimentally determined maximum moments at the two joints are in good

-42
agreement with the predicted values which included 10 percent increase
in the plastic moment (Fig. 24). The column carried considerably more
axial load near the end of the test, while maintaining sufficient mo
ment capacity to prevent the beam loads from dropping. This is an
other indication of the poss~bi1ity of strain-hardening in double cur
vature columns.
As in the single curvature subassemblage, there was close agree
ment between the predicted M-Q curves and the experimentally observed
curves of the double curvature subassemblages.

-43
7. SUMMARY AND CONCLUSIONS
Tests were conducted on four non-sway subassemblages--two with
columns bent in single curvature and two in double curvature. The
only difference between the two tests of each type of subassemblage
was the slenderness ratio of the columns (35 for one test and 30 for
the other). All columns were braced to prevent movement out of the
plane of bending. Axial force in the columns varied from about 75
percent to 85 percent of the axial yield load.
Beams were designed to withstand the plastic mechanism load, and
the columns were proportioned to resist t~e applied moment while sub
jected to high axial load. The design was balanced, since failure in
both beams was expected to occur simultaneously, and immediately there
after failure of the joint was expected. The ultimate strength and
load-deformation behavior of the component members and of the subas
semblages as a whole were investigated.
The main purpose of this investigation was to study the response
of interior and exterior subassemblages and- to provide experimental
confirmation of the design concept for the case involving braced col-
umns.
1. The behavior and strength of the columns in a structural sub
assemblage can be closely predicted by a theory which recog
nizes the effects of instability, spread of yielding, and

-44
residual stresses and appropriate end conditions (such as the
ratio between the applied moments, end restraints, etc.).
2. With proper lateral bracing, columns can sustain high axial
loads (0.75-0.85 P ) while resisting their maximum moments.. y
3. The moment-rotation relationship and the maximum capacity of
a joint can be predicted by graphically combining the moment-
rotation relationships of both the columns meeting at the
joint.
4. The maximum moment that can be applied by a beam to the ad-
jacent columns often exceeds the full plastic moment. If
this effect is included in the design calculations, the re-
suIt would be a slight decrease in beam size but with a cor-
responding increase in column size.
5. Columns designed according to the procedure developed in Ref.
5 seem to have reserve capacity for resisting additional
axial load.
6. Columns subjected to bending moments causing double curvature
deformation tend to strain-harden in a manner similar to
b d d · 40 Th · l· ·earns un er moment gra 1ent. . 1S resu ts 1n an 1ncrease
in the moment carrying capacity.
7. Unwinding is not likely to occur in double curvature columns
with slenderness ratios less than 35 and axial load ratios
less than 0.8.

-45
8. The beam and column loads that can be resisted by a given
subassemblage can be predicted by the theory upon which the
design procedure is based.
The results presented in this report confirm the validity of the
column design procedure.

-46
8. ACKNOWLEDGMENTS
The research reported herein was performed at the Fritz Engineer
ing Laboratory, Department of Civil Engineering, Lehigh University.
The work forms part of a general investigation in "Plastic Design of
Multi-Story Frames." Sponsorship of the program was provided by the'
American Iron and Steel Institute, the American Institute of Steel
Construction, Naval Ship Engineering Center, Naval Facilities Engineer
ing Command, and the Welding Research Council. Technical guidance was
provided by the Lehigh Project Subcommittee of the Structural Steel
Committee of the Welding Research Council. Dr. T. R. Higgins is the
Chairman of the Lehigh Project Subcommittee.
The authors gratefully acknowledge the assistance of Messrs.
Lauren D. Carpenter and Robert J. Kirchberger, who gave unselfishly
of their time and effort. to help make this investigation possible.
Sincere thanks are also due Mrs. Sharon Balogh and Mr. John M. Gera
for preparing the drawings. The work of Kenneth R. Harpel and the
technicians in setting up the tests and ~f Richard N. Sopko for his
photography is gratefully appreciated. A very special thanks must go
to Mrs. Eug~ne L. Sheninger for her care in typing this report.

-47
9. NOTATION
The following symbols are Bsed in this paper:
A
b
d
E
F
h
I x
M
M.J
MJ,
Mu
MP
Mpc
P
py
=
=
=
=
=
=
=
=
=
=
=
=
=
=
=
=
=
=
=
area of cross section;
flange width;
depth, subscript c refers to column;
modulus of elasticity of steel (29,500 ksi);
strain-hardening modulus;
vertical load applied to top column;
lower beam load;
upper beam load;
story height (column length);
moment of inertia about major axis;
length of lower beam;
length of upper beam;
bending moment;
moment applied to joint by beam;
maximum resisting moment of lower joint;
maximum resisting moment of upper joint;
plastic moment capacity of cross section;
reduced plastic moment capacity considering axial load;
axial force in column;
axial yield load of cross section;

r = radius of gyration, subscripts x and y refer to major
axis and minor axis, respectively;
-48
t =
v =
w =
wn =
wL=
Z =x
~ =
Q =
cru
(j =y
flange thickness;
shear applied to joint by beam;
web thickness;
distributed dead load per unit length;
distributed live load per unit length;
plastic section modulus about major axis;
curvature;
rotation;
ultimate stress;
static yield stress.

10. TABLES AND FIGURES
-49

TABLE 1. SUMMARY OF TENSION TESTS
-50
Static Strain-Yield Ultimate Elonga- Hardening
Number Stress, Stress tion Modulus,of (J
y' in CJ u ' in (8 in.) Est, inTest Section ksi ksi Per Cent ksi
(1) (2) (3) (4) (5) (6)
8WF67 31.47 63.2 31.1 855
SC-l lOB17 35.48 56.3 28.9 216
8Bl5 38.09 63.3 25.1 206
8WF67 28.91 61.2 30.4 739
SC-2 10B17 33.98 57.3 29.7 178
8B15 37.38 62.1 27.7 203
8WF67 29.32 60.5 31.2 895
DC-l 10125.4 34.12 62.3 29.1 243
8WF24 36.57 62.6 28.8 284
8WF67 30.67 64.0 30.7 714
DC-2 10125.4 34.70 64.6 26.8 238
8WF24 36.44 63.4 28.8 462

TABLE 2. AVERAGE SECTION PROPERTIES
-51
Nomentof
InertiaFlange Heb about Plastic Axial
Flange Thick- Thick- x-x Section Plastic Yield
Number Number Width, Depth, ness, ness, Area Axis Nodulus Moment, Load,of of b, in d, in t, in w, in A, in Ix, Zx, Np ' in Py , in
Test Section Data in. in. in. in. in. 2 in in. 4 in in. 3 Kip-in. Kips
(1) (2) (3) (4) (5) (6) (7) (8) (9) (10) (11) (12)
SWF6713 S.30 9.03 0.912 0.578 19.30 268.6 69.0 2169.6 615.8
Book 8.29 9.00 0.933 0.575 19.70 271.8 70.1 2523.6 709.2
SC-1 10B175 3.95 10.03 0.330 0.248 4.93 78.3 18.1 641. 7 -----
Book 4.01 10.12 0.329 0.240 4.98 81.8 18.6 669.6 -----
8B155 4.05 8.09 0.312 0.240 4.32 46.5 13.2 501.1 -----
Book 4.02 8.12 0.314 0.245 4.43 48.0 13.6 489.6 -----
8WF6713 8.30 9.05 0.911 0.573 19.26 268.7 69.0 1980.9 577.5
Book 8.29 9.00 0.933 0.575 19.70 271.8 70.1 2523.6 709.2
SC-2 10B17 5 3.95 10.05 0.327 0.250 4.93 78.2 18.1 613.7 -----Book 4.01 10.12 0.329 0.240 4.98 81.8 18.6 669.6 -----
8B155 4.02 8.07 0.311 0.238 4.27 45.7 13.0 485.1 -----
Book 4.02 8.12 0.314 0.245 4.43 48.0 13.6 489.6 -----
8WF67 14 8.30 9.05 0.913 0.573 19.29 269.9 69.1 2010.0 584.3Book 8.29 9.00 0.933 0.575 19.70 271.8 70.1 2523.6 709.2
DC-1 10125.4 5 4.75 10.00 0.469 0.307 8.69 119.9 27.3 940.0 -----Book 4.66 10.00 0.491 0.310 7.38 122.1 28.0 1008.0 -----
8WF245 6.50 7.95 0.381 0.235 6.64 78.2 21.8 795.7 -----
Book 6.50 7.93 0.398 0.245 7.06 82.5 23.1 831.6 -----
8WF6714 8.35 9.07 0.915 0.568 19.39 272.7 69.7 2124.8 612.9
Book 8.29 9.00 0.933 0.575 19.70 271.8 70.1 2523.6 709.2
DC-2 10125.45 4.76 10.00 0.456 0.300 8.48 117.3 26.9 938.2 -----
Book 4.66 10.00 0.491 0.310 7.38 122.1 28.0 1008.0 -----
8WF245 6.53 7.96 0.403 0.244 7.00 82.5 23.0 805.2 -----
Book 6.50 7.93 0.398 0.245 7.06 82.5 23.1 831. 6 -----

-52
Fig. 1 Interior and Exterior Subassemblage in a Multi-Story Frame

G
-53
eFig. 2 Resisting Moment of an Interior Subassemblage

Mec
-54
8
Fig. 3 Resisting Moment of an Exterior Subassemblage

!:.Y.4
Fu
Lu2
h
h
h
-55
L4
Fu
L2
L
h2
h
h2
Fig. 4 Test Subassemblages

-56
F
20'-0" 15 1-0"
SC-I SC-2
F574 581
(kips)
Fu 14.3 14.3(ki ps)
F.l 14.0 14.0(kips)
Mpu669.6 669.6(kip-in.)
Mpu+Vu ~c 748.8 748.8(kip - in.)
deIJOMpu+VUT 816.0 816.0(kip -in.)
Mu796.8 800.4(kip-in.)
MpA489.6 489.6(kip-in.)
deMP1+V1T 567.6 567.6(kip-in.)
deI.lOMp..t+V.t 2 616.8 616.8(kip-in.)
M-e 639.6 657.6(kip - in.)
0.81
30 0.869
35
30 0.845
35 0.835
35 0.859
30 0.82
151.0"
F
t
SC-I
20'-0"
SC-2
Fig. 5 Preliminary Design Data- of Single Curvature Subassemblages

-57
DC-2
20'-0"
DC-I DC-2
F567 567(kips)
Fu 24.3 14.3(ki ps)
F.l 17.7 17.7(kips)
Mpu1008.0 1008.0(kip - in.)
M depu+VuT 1226.8 1226.8(kip - in.)
de1.10Mpu+\{)r 1327.6 1327.6(kip - in.)
Mu1118.4 1118.4(kip-in.)
Mpl831.6 831.6
(kip - in.)
deMp.e+V.t "2 930.9 930.0(kip- in..)
deI.IoMp.t+V1T 1013.2 1013.2(kip- in.)
Ml 912.0 912.0(kip-in.)
35 0.837
h/rx PIp--y
17:5 0.80
h/rx I7p..:.!J..
4'-75/811
15 0.80
9'-35/1611 30 0.837
5 " 15 0.8694'-7 Va
10'-97/8"
8 'IF 24 5'-415~611 17.5 0.8688YF67
20'-011 tDC-I
Fig. 6 Preliminary Design Data of Double Curvature Subassemblages

(a)
(b)
Fig. 7 Specimen Details
-58

-59
Brace
See Fig. 13
CompanionBase Plate
Specimen
Tie RodSupportingTower
Lateral Bracing \
Support __ \
Fig. 8 Test Setup for Single Curvature Subassemblages
Fig. 9 Single Curvature Test in Progress

Lateral BracinoSupport
See Fig. 12
SupportingTower
Bcu;e Plate
See FlO. 13
CompanionBase Plate
-60
Fig. 10 Test Setup for Double Curvature Subassemb1ages
Fig. 11 Double Curvature Test in Progress

Fig. 12 Roller Support
Fig. 13 Link Assembly
-61
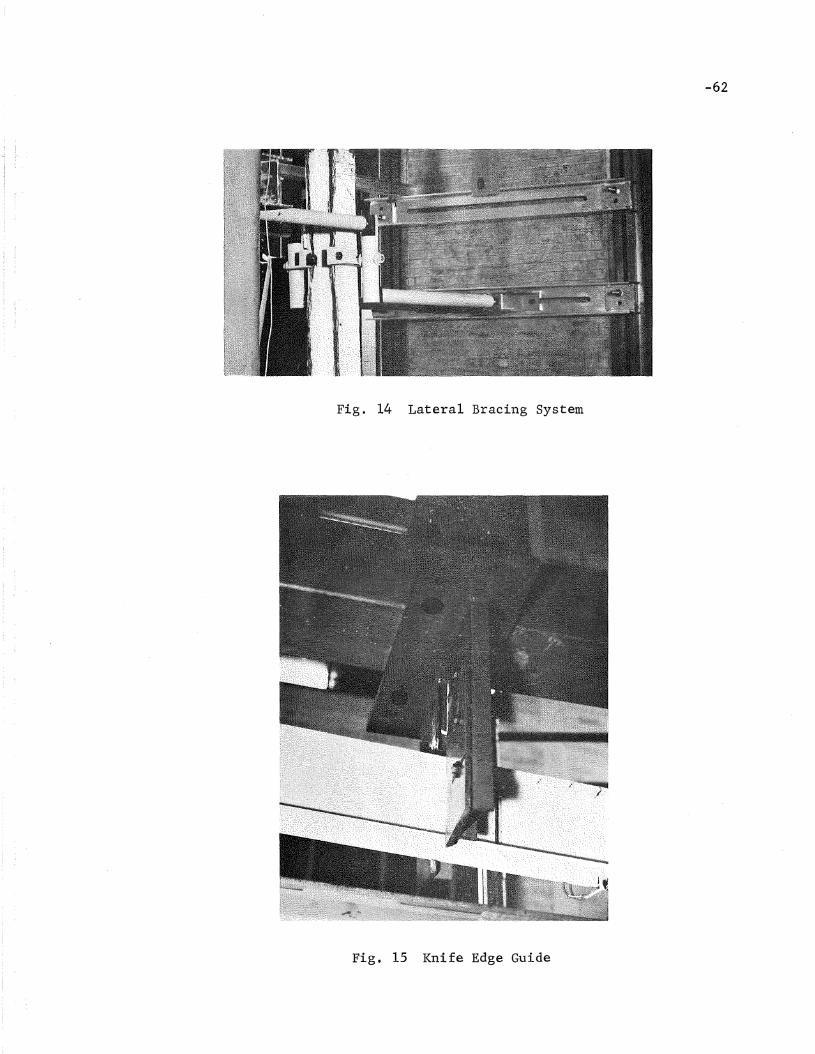
Fig. 14 Lateral Bracing System
Fig. 15 Knife Edge Guide
-62

(a) Mechanical Level Bar
-63
(b) Electrical Rotation Gage
(c) Displacement Potentiometer
Fig. 16 Rotation and Deflection Measuring Devices

11.13 k-in.
M (k -in.)
o 40I ! I ,
Moments Plotted on TensionSide of Members
14.42k- in.
(0 )
16.7I k- in.
18.40k- in.
-64
33~70 k-in.
M(k -in.)
o 40I I I I
Moments Plotted on TensionSide of Members
(b)
Fig. 17 Erection Moments
55.55k- in.

-65
r
/IIII\\\\
+18.76
8YF67
[
-:STRESS(ksl)
TENSION+
+10..--------------,..------, +10 0 -10
I I I I I
- Measured Dist.
--- Assumed Dist.
[-:+10
-10! II+Ip I 9
_------1 r/
//III 0.59
\\\\\'-
8 YF67I
r+IO
·0
-10
I~'~I1./ " 15.07
[.3_ 8.32 "~
Fig. 18 Residual Stress Distribution

-66
F..t 29.8 0.814
.. Pre - test Predictions
SC-I SC-2
F483 453
(kips)
Fu 13.69 13.09(kips)
Fj! 14.37 13.91(kips)
Mpu641.7 613.7(kip - in.
de,Mpu+Vu T 716.2 685.4
(kip- in.)de
1.10Mpu+VU2 780.4 746.8(kip - in.)
Mu 792 * 796 *(kip- in.) 724 750
Mp~501.1 485.1(kip - in.)
deMPI+V~2 579.3 560.9(kip-in.)
de1.10MP.l+V12 629.4 '609.5(kip - in.)
Ml 640 '* 644 "*(kip - in.) 565 603
34.8 0.845
34.8 0.815
29.8 0.845
34.8 0.786
29.8 0.784
h/rx Pip---y-
t15'-0"
F
~
SC-I
sc- 2
F
~8YF67- '
IO'_9~8"
201-0"
Fig. 19 Final Design Data of Single Curvature Subassemblages

-67
F
DC-2
10'-97/e" 34.7 0.800
DC-I DC-2
F -584(k ips) 464
Fu 20.05 20.01(kips)
F.t 16.98 17.18(kips)
Mpu 940.0 938.2(kip- in.)
deMpu+VuT 1049.8 1048.0(kip-in.)
deI. 10Mpu+VuT 1143.8 1141.8(kip - in.)
Mu1103 1164(kip-in.)
Mp~795.7 805.2(kip - in.)
deMpjP+V/T 888.8 899.5(kip- in'>
deI.IOMpl+V-IT 968.4 980.0(kip in.)
M.,t 909 969(kip - in.)
h/rx p/Py
17.4 0.757
h/rx p/Py
4'-75/81 14.8 0.757
20'-0"
8YF24 5'-415/16' 17.4 0.8378YF67
20'-0" tDC-I
Fig. 20 Final Design Data of Double Curvature Subassemblages

-68
de1.10 Mpu + Vu 2 =780.4
---- Thea. (Const. F)Exp. (Const. F) ISC - I I
--- Exp.(lncreasing F)
deMpu + Vu 2: =716.2
0.010
8 (RADIANS)
,-----........ ,/' ,
29 , ,\
30 \ d" 1.10 MpR +~ ~ =629.4
deMpR + V, 2: = 579.3
II
II
II
I22'I
I121I
20 1I 21119I 20
I18 1
I 18171
IIS',I 16II 15I
14 15
I 14l 13
700
200
300
600
500
M(KIP-IN.)
400
Fig. 21 Joint Moment versus Joint Rotation Relationships (SC-l)

-69
0.0200.0150.005 0.010
8 (RADIANS)
II- - -- Thea. (Canst. F)
Exp. (Const. F)
- - - Exp. (Increasing F)
~"""27-""',de
Mu-8u1.10 Mpu +Vu 2 =746.8
/ "700 " de,Mpu + Vu 2 =685.4,,,
, de600 ........ , 1.10 MpJ +\1 2=609.5
.....
" de, .....Mp2+Vt 2=560.9,"\ ....
500 \ '"....
Mt - 8,t \''-i0M \
(KIP-IN.) \\
400 \
Fig. 22 Joint Moment versus Joint Rotation Relationships (SC-2)

-70
0.030
~F
0.020
8 (RADIANS)
,
~66
0.010
62 63 64 de61, 1.10 Mpu+Vu 2"=1143.8
----~----------------65 --.. ........ deMpu +Vu 2" =1049.8
de1.10 Mp2+Vl 2"=968.4
~-------------------- dMpR +Vi : =888.8
---- Thea. (Const. F)-- Exp. (Canst. F)--- Exp.(Increasing F)
Mu-Bu
600
800
1000
M(KIP-IN.)
51 51400
Fig. 23 Joint Moment versus Joint Rotation Relationships (DC-I)

1000
800
600
M(KIP-IN.)
---- Theo. (Const. F)-- Exp. (Canst. F)--- Exp.Uncreosing F)
0.010
8 (RADIANS)
0.020
-71
de1.10 Mpu+Vu 2"=1141.8
deMpu +Vu 2'"=1048.0
de1.10 Mp.l +V1 2' =980.0
deMpi + VJ. "2 =899.5
0.030
Fig. 24 Joint Moment versus Joint Rotation Relationships (DC-2)

(0)
(b)
Fig. 25 Failed Single Curvature Specimen (SC-l)
-72

,,~
" "',', --.--." '~._._.~'
"" //'0- _ - - --0
::,.--:' :;..-"
~'--/ ,\\,III,JII
Loads 25 0----0
27 f:r-.--i:::J.
29 D---a
-73
DEFLECTION
0" 2.0"I I I I
Fig. 26 Deflections in SC-2

-74
,,IIIIIILoads 61 0--0
63 t:r.-A
65 0---02.0"
, I
DEFLECTION
"~.,",." ~-,. ~~..--,, ........... A A..-- • _ • _. --:;:::-t::t-,~._._.~ -- ---
"0--- - - ---0-- -
~~~~.=- J\~ \'" -----~......... . \........._ __ .. __. I
'0-- - - ..=--:.~ - .-::- -- -- -- IIIIII
Fig. 27 Deflections in Dc-l

Loads 61 0--0
63 tr·-6.
65 0---0
COLUMNDEFLECTION
o 0.1 0.2I , I
-75
Fig. 28 Study of Unwinding

(0)
(b)
Fig. 29 Failed Double Curvature Specimen (DC-I)
-76

-77
0.020
F
ISC-I I
0.015
Experimental
0.005 0.010
9u (RADIANS)
---- Theo.(Const. F)Exp. (Const. F)
- -- Exp. (Increasing F)
"",.--," "I ,
/ ,I \
I \\I Interpolation Hand Book PropertiesI \I /"-', \I I " \I / Inte~po~ation Real Properties
I I ,--, \I I // ',\I I / ,,I " ,
,',' / " co~puter Program" I Real Properties
I I I \, I I \I' /I' / \,iI \,IIIII, ,1,II,IIIt,III,"'II'ff
o
500
800
200
300
900
600
700
Mu(KIP-IN.)
400
Fig. 30 Comparison Study of M-Q Curves

-78
11. REFERENCES
1. Driscoll, G. C., Jr., et alPLASTIC DESIGN OF MULTI-STORY FRAMES, 1965 SUMMER CONFERENCELECTURE NOTES, .Fritz Engineering Laboratory Report 273.20, Lehigh University,1965
2. Lu, L. W., Armacost, J. 0., III, and Driscoll, G. C., Jr.PLASTIC DESIGN OF MULTI-STORY FRAMES--BRACED FRAMES,Fritz Engineering Laboratory Report 273.55, Lehigh University,January 1968
3. Driscoll, G. C., Jr., Armacost, J. 0., III, and Lu, L. W.PLASTIC DESIGN OF MULTI-STORY FRAMES--UNBRACED FRAMES,Fritz Engineering Laboratory Report 345.2, Lehigh University,
·June 1968
4. Anon.PLASTIC DESIGN CUTS COST ON PROTOTYPE· HIGHRISE,Engineering News Record, 173 (3) (July 1967)
5. Lu, L. W.DESIGN OF BRACED FRAMES-COLUMNS, LECTURE 11, 1965 SUMMER CONFERENCE LECTURE NOTES,Fritz Engineering Laboratory Report 273.20, Lehigh University,1965
6. Parikh, B. P., Daniels, J. H., and Lu, L. W.PLASTIC DESIGN OF MULTI-STORY FRAMES - DESIGN AIDS BOOKLET,Fritz Engineering Laboratory Report 273.24, Lehigh University,1965
7. Lay, M. G.THE EXPERIMENTAL BASES FOR PLASTIC DESIGN,Welding Research Council Bulletin No. 99, September 1964
8. Lay, M. G. and Smith, P. D.ROLE OF STRAIN HARDENING IN PLASTIC DESIGN,Proc. ASeE, 91 (ST3), pp. 25-43 (June 1965)
, ,9. ~n Karman, T.
UNTERSUCHUNGEN UBER KNICKFESTIGKEIT,Mitteilungen uber Forschungsarbeiten, herausgegeben vorn VereinDeutscher Ingenieure, 81, Berlin, 1910; also in "Collected Worksof Theodore von Karman," Butterworths Scientific Publications,London, England, I, pp. 90-140, 1956

-79
- 10. Westergaard, H. M. and Osgood, W. R.STRENGTH OF STEEL COLUMNS,Trans. ASME, 49-50, Applied Mechanics Section, pp. 65-80 (1928)
11. Chwal1a, E.DIE STABILITAT ZENTRISCH UND EXZENTRISCH GEDRUCKTER STABE AUSBAUSTAHL,Sitzungsberichte der Akademie der Wissenschaften in Wien, Abt.IIa, 137 (8), pp. 469-512 (August 1928)
12. Jezek, K.DIE TRAGFAHIGKEIT DES GLEICHMASSIG QUERBELASTETEN DRUCKSTABESAUS EINEM IDEAL-PLASTISCHEN STAHL,Der Stah1bau, 13 (5), pp. 33-38 (March 1935)
13. Horne, M. R.THE ELASTIC-PLASTIC THEORY OF COMPRESSION MEMBERS,Journal of Mechanics and Physics of Solids, 4 (2), pp. 104-120(February 1956)
14. Galambos, T. V. and Ketter, R. L.COLUMNS UNDER COMBINED BENDING AND THRUST,Trans. ASCE, 126 (I), pp. 1-25 (1961)
15. Ketter, R. L.FURTHER STUDIES ON TIlE STRENGTH OF BEAM-COLUMNS,Frac. ASCE, 87 (ST6), pp. 135-152 (August 1961)
16. Galambos, T. V.COMBINED BENDING AND COMPRESSION,Chapter 11, in "Structural Steel Design," Ronald Press, New York,1964
17. Johnston, B. G., ed.GUIDE TO DESIGN CRITERIA FOR METAL COMPRESSION MEMEERS,Column Research Council, John Wiley and Sons, Inc., New York,1966
18. Chwa1la, E.UBER DIE EXPERIMENTELLE UNTERSUCHUNG DES TRAGVERHALTENS GEDRUCKTER STABE AUS BAUSTAHL,Der Stah1bau, 7 (3), pp. 17-19 (February 1934)
19. Johnston, B. G. and -Cheney, L.STEEL COLUMNS OF ROLLED WIDE FLANGE SECTION,Research Report Nos. 190 and 191, American Institute of SteelConstruction, November 1942
20. Campus, F. and Massonnet, C.RECHERCHES SUR LE FLAMBEMENT DE COLONMES EN AClER A37, A PROFILEN DOUBLE TE, SOLLICITEES OBLIQUEMENT,Bulletin No. 17, L'Institut Pour L'Encouragement de la RechercherScientifique dans L'Industrie et L'Agriculture, Bruxe11es,Belgium, 1956

-80
21. Mason, R. E., Fisher, G. P., and Winter, G.ECCENTRICALLY LOADED, HINGED STEEL COLUMNS,Proc. ASCE, 84 (EM4) , pp. 1-19 (October 1958)
22. Van Kuren, R. C. and Galambos, T. ·V-.BEAM-COLUMN EXPERIMENTS,Proc. ASCE, 90 (ST2), pp. 223-256 (April 1964)
23. Chwalla, E.AUSSERMITTIG GEDRUCKTE BAUSTAHLSTABE MIT 'ELASTISCH EINGESPANNTENENDEN UND VERSCHIEDEN GROSSEN ANGRIFFSHEBELN,Der Stah1bau, 15 (7 and 8), pp. 49-52, 57-60 (March 1937)
24. Bij1aard, P. P.BUCKLING OF COLUMNS WITH EQUAL AND UNEQUAL END ECCENTRICITIESAND END ROTATIONS,Proc. 2nd U. S. Natl. Cong. Appl. Mech., pp. 555-562, 1954
25. Ellis, J. S.PLASTIC BEHAVIOR OF COMPRESSION MEMBERS,J. Mech. and Phys. of Solids, 6 (4), pp. 282-300 (July 1958)
26. Ojalvo, M.RESTRAINED COLUMNS,Prac. ASCE, 86 (EMS), pp. 1-11 (October 1960)
27. Ojalvo, M. and Fukumoto, Y.NOMOGRAPHS FOR THE SOLUTION OF BEAM-COLUMN PROBLEM,Welding Research Council Bulletin No. 18, June 1962
28. Lay, M. G.THE MECHANICS OF COLUMN DEFLECTION CURVES,Fritz Engineering Laboratory Report 278.12, June 1964
29. Bijlaard, P. P., Fisher,. G. P., and Winter, G.ECCENTRICALLY LOADED, END RESTRAINED COLUMNS,Trans. ASeE, 120, pp. 1070-1115, 1955
30. Lay, M. G. and Galambos, T. V.THE EXPERIMENTAL BEHAVIOR OF RESTRAINED COLUMNS,Welding Research Council Bulletin No. 110, November 1965
31. Carpenter, E. F.EXPERIMENTAL AND ANALYTICAL STUDY OF BEAM-COLUMN SUBASSEMBLAGES,M. S. Thesis, University of· Delaware, June 1967
32. Galambos, T. V.COLUMN DEFLECTION-CURVES, LECTURE 9, 1965 SUMMER CONFERENCE LECTURE NOTES,Fritz Engineering Laboratory Report 273.20, Lehigh University,1965

-81
33. Levi, V., Driscoll, G. C., Jr., and Lu, L. W.STRUCTURAL SUBASSEMBLAGES PREVENTED FROM SWAY,Proc. ASCE, 91 (SIS), pp. 103-127 (October 1965)
34. Levi, V., Driscoll, G. C., Jr., and Lu, L. W.ANALYSIS OF RESTRAINED COLUMNS PERMITTED TO SWAY,Proc. ASCE, 93 (STI), pp. 87-108 (February 1967)
3S. Baker, J. F., Horne, M. R., and Roderick, J. W.TIlE BEHAVIOR OF CONTINUOUS STANCHIONS,Proc. Roy. Soc., A198, pp. 498-509 (1949)
36. Baker, J. F., Horne, M. R., and Heyman, J.THE STEEL SKELETON,Vol. II, Chapter 14, Cambridge University Press, 1956
37. Gent, A. R.ELASTIC-PLASTIC COLUMN STABILITY AND THE DECISION OF NO-SWAYFRAMES,Proc. Instn, Civ. Engrs., England, 34, pp. 129-151 (June 1966)
38. Yarimci, E., Yura, J. A., and Lu, L. W.TECHNIQUES FOR TESTING STRUCTURES PERMITTED TO SWAY,Experimental Mechanics, Soc. for Experimental Stress Analysis,7 (8), pp. 321-331 (August 1967)
39. Lay, M. G. and Galambos, T. V.INELASTIC STEEL BEAMS UNDER UNIFORM MOMENT,Prac. ASeE, 91 (ST6), pp. 67-93 (December 1965)
40. Lay; M. G. and Galambos, T. V.INELASTIC BEAMS UNDER MOMENT 'GRADIENT,Prac. ASCE, 93 (STl), pp. 381-399 (February 1967)
41. Estuar, F. R. and Tall, L.TESTING OF PINNED-END STEEL COLUMNS,in "Test Methods for Compression Members," Special TechnicalPublication No. 419, ASTM, pp. 80-96, 1967
42. Huber, A. W. and Beedle, L. S.RESIDUAL STRESS AND COMPRESSIVE STRENGTH OF STEEL,The Welding Journal, 33 (12), pp. 589-s-614-8 (December 1954)