E-EEEEEEE//lEI I-EEEEEEEE-E/ umu/l/hhhhhh. -EEE/llll/EEE E ... · UNCLASSIFIED SECURITY...
218
Af-l10 137 AIR FORCE INST OF TECH WRIGH4T-PATTERSON AFS O44 SCHOO--ETC F/6 1/2 OPTINIZATION OF STRATEGIC AIRLIFT IN-FLIGHT REFUELINMG.(Ul MAR 81 V P BORDELON, J C MARCOTTE UNCLASSIFIED AFIT/GST/OS/&1M-3 NL E-EEEEEOMOE umu/l/hhhhhh. E-EEEEEEE//lEI I-EEEEEEEE-E/ -EEE/llll/EEE
Transcript of E-EEEEEEE//lEI I-EEEEEEEE-E/ umu/l/hhhhhh. -EEE/llll/EEE E ... · UNCLASSIFIED SECURITY...

Af-l10 137 AIR FORCE INST OF TECH WRIGH4T-PATTERSON AFS O44 SCHOO--ETC F/6 1/2OPTINIZATION OF STRATEGIC AIRLIFT IN-FLIGHT REFUELINMG.(UlMAR 81 V P BORDELON, J C MARCOTTE
UNCLASSIFIED AFIT/GST/OS/&1M-3 NL
E-EEEEEOMOEumu/l/hhhhhh.E-EEEEEEE//lEII-EEEEEEEE-E/-EEE/llll/EEE

Af /GS0T/OS/S!M- 3
OPTIMIZATION OF STRATEGIC AIRLIFTIN-FLIGHT REFUELING
THESIS
Vernon P./Bordelon, Jr., Capt, USAFLLJ John C.,Marcotte, Jr,4, Major, USAF
AFIT/GST/OS/81M-3
AlDTprC
Approved for publ£,c -elease; distribution unlimited

UNCLASSIFIEDSECURITY CLASSIFICATION OF THIS PA(A, (IWh w, l I......... 1
REPORT DOCUMENTATION PAGE REAI-I J ' I[ N S)- r
1. REPORT NUMBER ." GOVT ACCESSION NO 3 RE(IPIt NT'S CAI ALC0G NuIMBER
AFIT/GST/OS/81M-3 .....
4. TITLE (-nd SubtII.). TYPL UF REPORT & PERIOD COVERED
OPTIMIZATION OF STRATEGIC AIRLIFT MS ThesisIN-FLIGHT REFUELING 6 PERFORMING O1G RLPORT NUMBER
SAUTNON 8 CONTRACT OR GRANT NUMBER(rJ
Vernon P. Bordelon, Jr., Capt, USAFJohn C. Marcotte, Jr., Major, USAF
' PERFORMING ORGANIZATION NAME AND ADDRESS 167 PHO RAM ELEMENT. PROJECT. TASK
Air Force Institute of Technology (AFIT/EN) AEA & WORK UNIT NUMBERS
* Wright-Patterson AFB, OHIO 45433
II. CONTROLL IN, OFFiCE NAML AND ADDRL ,S 12 REPORT DATE
March 198113 NUMBER OF PAGES
14 MONITORIII, AGLNCY NAIA1, P ADDHI' S(I , il:t'. f I.Iro. .. '-,) IS SECURITY CLASS. (al this r prt)
UNCLASSIFIEDI5, DECL ASSIFICATION DOWNGRADING
SCHEDULE
16 DISTRIBUTION STATN 'M_ NT (,,( ht pofr
Approved for public release; distribution unlimited
17. DISTRIBUTION STATEMENT (.I Ih. eltrnI entht,.f ,,, ont.-k 2. 1v il ,I .., Ho, .ep .t)
W8 SUPPLEMENTARY NOTES
8STAproved fo pub ic release; IAW AFR 190-17
FREDRICC. LYNH, Major, USAF 27 MAY 1981Director of Public Affairs
19 KEY WORDS (Contnue or, vs le d necessar) a1d iderrrlly I, hI-1. numbor)
AIRLIFT Air Force Inslitite ut TEchi.0Uly (ATC)AIR-REFUELING Yg4it-Patterson AFUOa Oa 45433TANKER
\ TANKER-BASING,OPTIMAL AIR REFUELING RENDEZVOUS POINT
113 ABSTRACT (Co e'nue .n r irc. *1hl. It riet e.sary &n,! iderfiify hm bl,-k k number)
During the 1980s increases in the potential use of StrategicAirlift to transport equipment and personnel is anticipated.The capabilities of Strategic Airlift aircraft are extendedthrough the inclusion of efficient in-flight refueling. Theprimary oblert3Ae of this res2,irch was to develop a method whichdetermineS kLiL CQI,)1I)iUdtto0' Of ;',-fligh, refueling rendezvouspoint, takeof f iu.! lo. dc 3 jx tY.nker Iase which results in the
i.
UNCLASSIFIED
SECURITY CLASSIFICATION OF THIS PA(,L(WIha. Dat Entr.oI)
minimum total fuel consumption for an airlifter and tankeraircraft.
The experimental design included the creation of two models.An analytic flight planning model determined the optimalrendezvous point and the takeoff fuel loads for the aircraft ina specific mission scenario. A SLAM simulation model verifiedthe operational feasibility of the results of the analytic modelby simulating the flights of aircraft.
The optimal rendezvous can only be determined by analyzingthe interaction of the airlifter route distance, the cargo load,and the location of the tanker base. As the total distance ofcargo load decreases or the tanker base is located farther alongthe a-rlifter's route of flight, the optimal rendezvous pointis located incrementally farther from the boundary establishedby the maximum feasible range of the airlifter from its destina-tion. The optimal takeoff fuel loads are dependent on the air-craft combination and will result in the smallest sum of thetotal fuel-carrying capacity used. By using the optimalrendezvous point for an in-flight refueling mission, signifi-cant fuel savings are realized.
'% I Accnson For
DTP? TAB
¢t :.at:'r
iNCSII
UNCLASSIFIED

AFIT/GST/OS/81M-3
OPTIMIZATION OF STRATEGIC AIRLIFT IN-FLIGHT REFUELING
-t
THESIS
Presented to the Faculty of the School of Engineering
of the Air Force Institute of Technology
Air University
in Partial Fulfillment of the
Requirements for the Degree of
Master of Science
by
Vernon P. Bordelon, Jr. John C. Marcotte, Jr.Capt USAF Major USAF
Graduate Strategic and Tactical Sciences
March 1981
Approved for public release; distribution unlimited

Preface
Strategic airlift air-refueling planning is
becoming more important as the MAC airlift fleet gains an
operational in-flight refueling capability. As fuel sup-
plies become more expensive and scarce, fuel conservation
becomes increasingly more important. We sincerely hope
that airlift and tanker operational planners will use the
results of this research when selecting air-refueling
points and takeoff fuel loads to reduce total fuel con-
sumption.
We would like to thank Colonel C. C. Shaw, Jr.,
HQ USAF/SAGM, who provided the initial topic on optimizing
airlift air-refueling, and Major Burgesson and Lieutenant
David Sauve, AFGWC/DOY, who provided the aircraft fuel
data base for the C-5A, C-141B, and the KC-135. We would
especially like to thank Paul Fruge, ALD/YTE, who released
the KC-10 engineering fuel consumption estimates to use
as fuel consumption data for that aircraft. We would like
also to thank Major Daniel Fox, our thesis advisor, for
his many helpful suggestions and conscientious guidance
in the preparation of this thesis. 2inally, we would like
to thank Colonel Donald Stevens and Professor Daniel
Reynolds who sacrificed their time to read our papers and
ii

offer their enthusiastic support. To these people and all
of AFIT we wish to express our deepest thanks.
This thesis would never have been completed without
the complete support, sacrifices, and love from our wives,
Jan and Becky. Their steadfast encouragement and patient
endurance of the long hours required to complete this thasis,
contributed more than anything else towards our successful
efforts. We look forward to devoting this time again to
our families.
iii

Contents
Page
Preface.........................ii
List of Figures ..................... vi
List of Tables.....................ix
Abstract.........................x
I. Introduction..................1
The Problem .................. 1Objectives..................1Benefits...................3
Ii. Background...................6
History of Airlift Air-Refueling.........6Current Concepts and Models .......... 10Flight Planning................14
III. Design of Experiment .............. 22
Scope and Assumptions. ............ 22Conceptualization. .............. 23
IV. Verification and Validation ........... 31
V. Results and Analysis .............. 44
Sensitivity Analysis ............. 59
VI. Conclusions and Recommendations .......... 64
Bibliography......................67
Appendix A: Manual Fuel Consumption Computationof a Typical Airlift Mission ProfileUsing the C-141B Performance Manual . 70
Appendix B: Aircraft Ground Delay Data .......... 75
Appendix C: FLTPLN Computer Code ............ 80
Appendix D. SLAM4 Description.............89
iv

Page
Appendix E. SLAM Computer Code ... ........... . 101
Appendix F. User Function Summaries .. ........ 105
Appendix G. Sample Raw Output Data .. ......... . 123
Appendix H. FLYME Subroutine .... ............ . 127
Appendix I. SLAM Validation ... ............ . 151
Appendix J. Confidence Intervals ... .......... . 160
Appendix K. Model Description ... ........... . 165
Appendix L. FLTPLN and SLAM Summary of Results . 191
Vitas of the Authors ...... ................ 198
v
C i ,.. .l' "

List of Figures
Figure Page
1. Flight Planning Segments .. .......... . 17
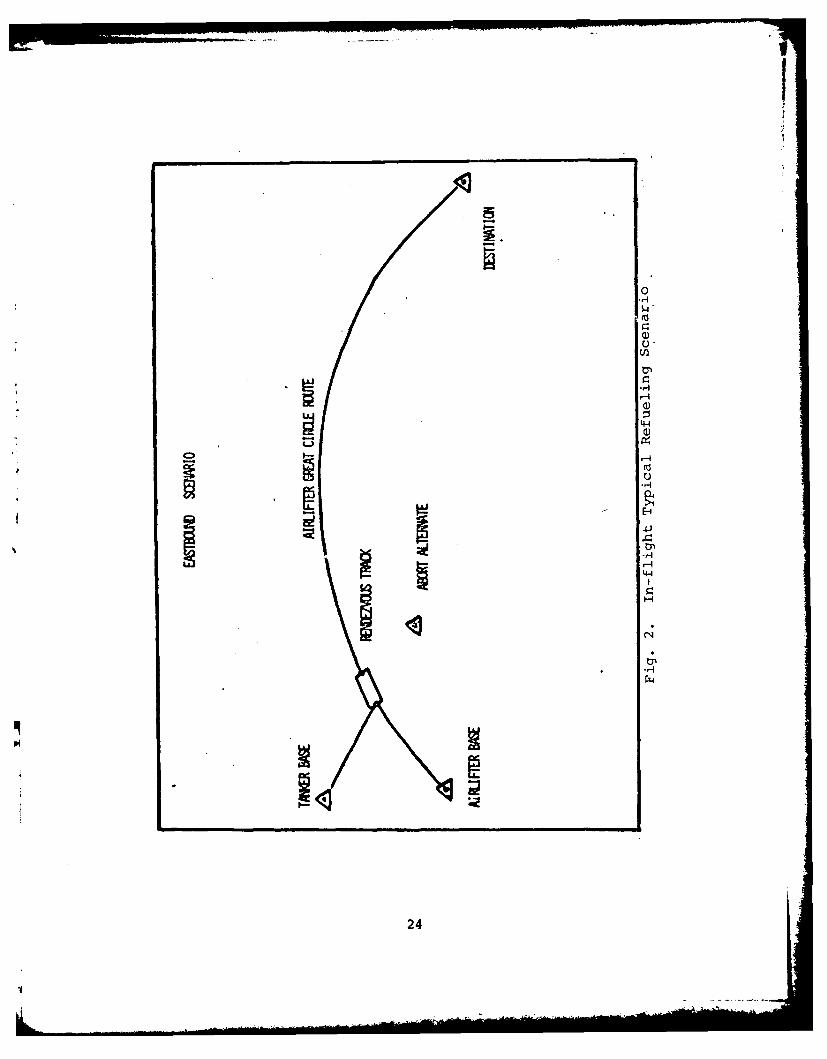
2. In-flight Typical Refueling Scenario . . . . 24
3. C-5--Deviation of SLAM Results Compared tothe Analytical Fuel Consumption Results . . . 38
4. C-141--Deviation of SLAM Results Comparedto the Analytical Fuel Consumption Results 39
5. KC-10--Deviation of SLAM Results Comparedto the Analytical Fuel Consumption Results 41
6. KC-135--Deviation of SLAM Results Comparedto the Analytical Fuel Consumption Results 42
7. C-5A--Optimal Rendezvous Points/FeasibleBoundaries ..... ................. . 45
8. C-141--Optimal Rendezvous Points/FeasibleBoundaries ..... ................. . 46
9. C-141B--Optimal Rendezvous Points/FeasibleBoundaries ..... ................. . 47
10. C-5A--Optimal Rendezvous Points/FeasibleBoundaries ..... ................. . 48
11. Total Fuel Consumption versus InitialAirlifter Fuel Load ... ............. . 51
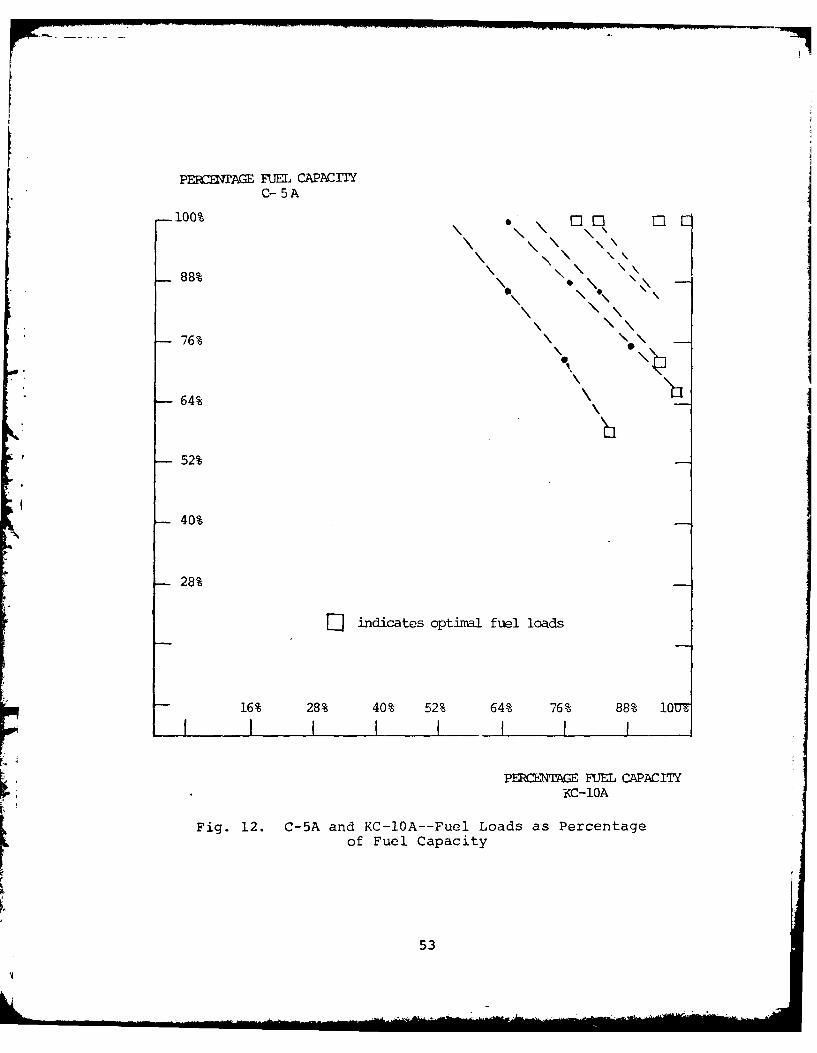
12. C-5A and KC-10A--Fuel Loads as Percentageof Fuel Capacity .... .............. 53
13. C-141B and KC-135A--Fuel Loads as Percentageof Fuel Capacity .... .............. 54
14. C-5A and KC-135A--Fuel Loads as Percentageof Fuel Capacity .... .............. 55
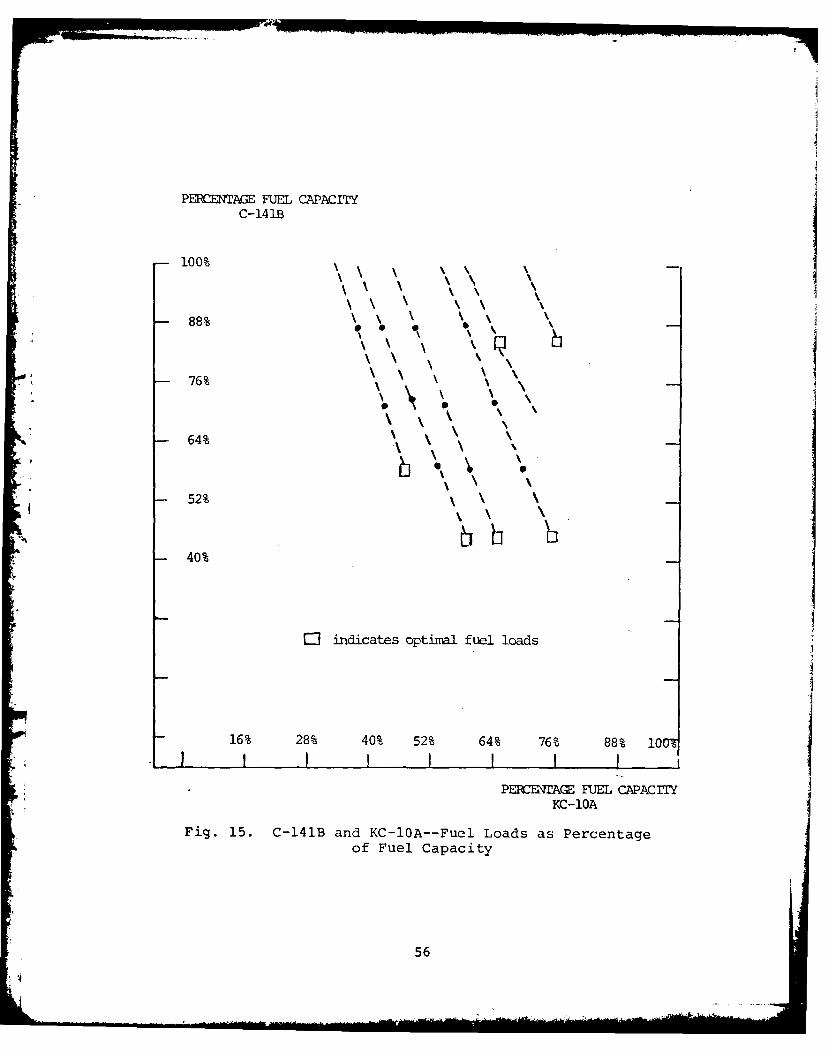
15. C-141B and KC-10A--Fuel Loads as Percentageof Fuel Capacity .... .............. 56
vi

Figure Page
D-1. ASSIGN Node Description Summary..........91
D-2. CREATE Node Description Summary.........92
D-3. ENTER Node Description Summary.............93
D-4. EVENT Node Description Summary.............94
D-5. GOON Node Description Summary .......... 95
D-6. MATCH Node Description Summary.............96
D-7. QUEUE Node Description Summary.............97
D-8. TERMINATE Node Description Summary .... 98
D-9. REGULAR Activity Description Summary ... 99
D-10. SERVICE Activity Description Summary ... 100
F-1. USERF (1) --- Ground Fuel Flow & TaxiFuel-Airlifter........................114
F-2. USIERF (2)--Ground Fuel Flow & TaxiFuel-Tanker.........................114
F-3. USERF (3)---Takeoff Fuel Airlift ............ 114
F-4. TJSERF (4)--Takeoff Fuel Tanker..........114
F-5. USERF (5)--Climb Time Airlift. ........ 115
F-6. USERF (6)--Climb Time Tanker.............115
F-7. USERF (7)--Climb Fuel Airlifter .......... 115
F-8. USERF (8)--Climb Fuel Tanker.........115
F-9. USERF (9)---Climb Distance Airlifter . . .. 116
F-10. USERF (l0)--Climb Distance Tanker ....... 116
F-11l. USERF (11)--Cruise Time Airlifter ....... 116
F-12. USERF (12)--Cruise Time Tanker .......... 116
F-13. USERF (13)--Airlift Cruise Fuel .......... 117
F-14. USERF (14)--Tanker Cruise Fuel .......... 117
vii

Figure Page
F-15. tJSERF (15)--Loiter Fuel Airlifter ....... 117
F-16. USERF (16)--Loiter Fuel Tanker........118
F-17. USERF (17)--Abort Calculation Airlifter 118
F-18. USERF (18)---Abort Calculation Tanker . .. 118
F-19. USERF (19)--Refueling Track Time.........118
F-20. USERF (20)--Tanker Track Fuel.........118
F-21. USERF (21)--Airlifter Track Fuel........119
F-22. USERF (22)--Tanker Time to Destination 119
F-23. USERF (23)--Airlift Time to Destination 120
F-24. USERF (24)---Fuel Cruise & Landing Tanker 120
F-25. USERF (25)--Fuel Cruise & Landing
Airlifter.....................121
F-26. Aircraft Fuel Consumption Values.......122
I-1. SLAM Wind Variance Validation; SPSSProgram and Results; Kolmogorov-Smirnov Test.................154
J-1. SLAM Output Normality Validation; SPSSProgram and Results; Kolmogorov-SmirnovTest.........................164
K-i. SLAM Structural Mission Profile ....... 173
K-2. SLAM Network.................174
K-3. Global SLAM Variables.............180
K-4. SLAM Structural Mission Profile ........ 183
viii

List of Tables
Table Page
1. Aircraft Combinations ..... ........... 3
2. Experimental Design Factors and Levels 28
3. Validation of FLYME Data Base ........ .. 33
4. Validation of FLTPLN and SLAM Models . . 34
5. Tanker Base Influence on RendezvousPoint ...... .................. 50
6. Average Fuel Savings--Optimal RendezvousPoint Versus Hypothesized Rendezvous . . 58
K-I. SLAM Attributes Summary ... .......... . 184
L-1. C-5--SLAM Versus Analytical Fuel* Consumption Results .... ............ .. 194
L-2. C-141B--SLAM Versus Analytical FuelConsumption Results .... ............ . 195
L-3. KC-10--SLAM Versus Analytical FuelConsumption Results .... ............ . 196
L-4. KC-135--SLAM Versus Analytical FuelConsumption Results .... ............ .. 197
ix

AFIT/GST/OS/81M-3
Abstract
During the 1980s increases in the potential use of
Strategic Airlift to transport equipment and personnel is
anticipated. The capabilities of Strategic Airlift air-
craft are extended through the inclusion of efficientL.! in-flight refueling. The primary objective of this research
was to develop a method which determines the combination of
in-flight refueling rendezvous point, takeoff fuel loads
and tanker base which results in the minimum total fuel con-
sumption for an airlifter and tanker aircraft.
The experimental design included the creation of
two models. An analytic flight planning model determined
the optimal rendezvous point and the takeoff fuel loads
for the aircraft in a specific mission scenario. A SLAM
*simulation rrodel verified the operational feasibility of
the results of the analytic model by simulating the flights
of aircraft.
The optimal rendezvous can only be determined by
analyzing the interaction of the airlifter route distance,
the cargo load, and the location of the tanker base. As
the total distance or cargo load decreases or the tanker
base is located farther along the airlifter's route of
flight, the optimal rendezvous point is located incre-
mentally farther from the boundary established by the
x

maximum feasible range of the airlifter from its destina-
tion. The optimal takeoff fuel loads are dependent on the
aircraft combination and will result in the smallest sum
of the total fuel-carrying capacity used. By using the
optimal rendezvous point for an in-flight refueling mission,
significant fuel savings are realized.
xi

OPTIMIZATION OF STRATEGIC AIRLIFT IN-FLIGHT REFUELING
I. Introduction
The Problem
Efficient in-flight refueling of strategic airlift
aircraft is being recognized as vital to the Military Air-
lift Command (MAC) and the Department of Defense. Cur-
rently, all C-5A aircraft are air-refuelable and by the end
of 1982 all MAC C-141 aircraft will be air-refuelable
(Ref 21:48) . As a result of this increased capability,
MAC is constantly striving through innovation and research,
to make air-refueling missions more productive and effi-
cient. One way to increase the efficiency of airlift air-
refueling missions is to determine the combination of plan-
ning factors; the takeoff fuel, tanker basing, and air-
refueling rendezvous point, which would minimize the total
fuel consumed by an airlift and tanker aircraft. No current
method determines an optimal combination of these factors
for in-flight refueling between strategic airlift and tanker
* aircraft.
objectives
The objective of this research effort was to
develop a method which determines the optimal combination
of in-flight refueling rendezvous point, takeoff fuel loads
1
and tanker base for a refueled aircraft riission. By
determining the optimal combination three questions are
answered. First, should the rendezvous point be close to or
far from the points of departure? Second, how much fuel
should be loaded on the airlifter and tanker prior to take-
off? Third, from what base should the tanker depart?
When the research was begun it was believed that
the following two hypotheses would prove true.
1. The minimum total fuel consumed by the airlift
and tanker aircraft for their combined flight will result
from a rendezvous point located at the maximum flight range
of the airlifter from its destination base. This point
is always located on the boundary of the region of feas-
ible rendezvous points closest to the airlifter takeoff
base.
2. Airlifter aircraft departures with the maximum
allowable fueal load will always result in the minimum total
fuel consumption for both aircraft. This implies that the
fuel transferred is the minimum required to complete the
flight.
By demonstrating the accuracy of these hypotheses
they could then be used to help define a general policy
for efficient in-flight refueling.
Two models were developed in the course of this
research. The first, FLTPLN, computed the optimal plan-
ning factors for an air-refueling airlift mission. The
2

FLTPLN results were then validated for operational suit-
ability by a SLAM1 (Simulation Language for Alternative
Modeling) simulation model.
These two models were used to explore different
scenarios and many fuel cargo combinations for the airlift
aircraft. Aircraft combinations investigated are listed
in Table 1. Sensitivity analysis was used to determine
the effect on the response variable, total fuel consumption,
* to changes in the input factors of takeoff fuel onload,
cargo, wind, takeoff delays, and total distance.
-, TABLE 1
AIRCRAFT COMBINATIONS
Airlifters Tankers
C-5A KC-135
C-5A KC-10
C-141B KC-135
C-141B KC-10
Benefits
Three benefits are apparent from determining an
optimal combination of planning factors which minimizes
total fuel consumed. The first benefit is obviously fuel
conservation. To emphasize the importance of conserving
ISLAM is a simulation language developed by
Pritsker and Associates, Inc., West Lafayette, Indiana.SLAM has been designed to support engineers, managers,and researchers.
3

fuel, the Chairman of the Joint Chiefs of Staff stated that,
the supply, access and price of oil will dominate future
national security issues (Ref 13:i). By minimizing total
fuel consumed, operating costs go down, and funds used in
procuring the saved fuel could be used for other equally
essential programs. As the cost of fuel goes up, the
savings from an optimal refueling policy will also go up.
For example, the price of fuel (JP-4) increased from $.42
per gallon in 1979 to $1.16 per gallon in 1980 (Ref 19).
Additional increases can be expected in the future. The
second benefit which results from an optimal refueling
point is that individual mission flight times are reduced.
While the flight time of modern jet aircraft results in a
relatively short deployment time, the savings from the
multiple sorties of a large-scale deployment would be sig-
nificant. This means closure times can be reduced due to
decreased flight times. Closure time occurs when the last
aircraft of a deployment arrives at the destination. More
importantly, the airframe time, which cannot be renewed,
is also reduced. The third benefit from an optimal refuel-
ing point is that operational plans and contingency plans
can be optimally formulated for a wide range of mission
scenarios. By combining all three benefits, the advan-
tages of determining an optimal refueling point, which
ensures more efficient airlift operations are apparent.
During the 1980s, significant increases in the
potential use of airlift to transport equipment and
4

supplies worldwide is anticipated. Due to political and
natural constraints the importance of air-refueling during
a rapid deployment will also increase. Therefore, the
efficient use of air-refueling of airlift aircraft will
result in significant economies to the Air Force.
5

II. Background
Military Airlift Command policies regarding air-
refueling operations for airlift aircraft are relatively
new and untested, compared to those of SAC and TAC.
Employment plans utilizing air-refueling are founded on
only a few years of experience, and have not, as yet, been
tested with large-scale deployments or war-scenario exer-
cises. Employment policy and operations concepts for air-
refueling are constantly being formulated and updated as
more research is conducted in this area. Chapter II pro-
vides a background in air-refueling history, employment
principles and policy currently in use at HQ MAC. Included
is a description of the extent of MAC air-refueling
experience, active air-refueling policy research, current
planning models in use at MAC and HQ USAF, and a descrip-
tion of mission flight planning, using a typical airlift
flight profile.
0 History of Airlift Air-Refueling
In the last two decades, strategic airlift has
become increasingly important to the Department of Defense
to support the rapid deployment and resupply of Allied or
United States forces overseas. To increase this resupply
capability, C-5A aircraft were acquired and C-141 aircraft
are being modified to utilize in-flight refueling.
6

In-flight refueling became availtbz' to the Mili-
tary Airlift Command in December, 1969 (Ref 12), with the
introduction of the C-5A aircraft into the Air Force inven-
tory. Although the C-5 was originally built to be air-
refuelable, this capability was not tested and evaluated
until May, 1974, with the final evaluation report submitted
in March, 1975 (Ref 5:ii,2). Presently, MAC is modifying
C-141A aircraft for air-refueling operations and will
change the designation to C-141B.
The need for quick and efficient airlift and the
potential need for air-refueling airlift aircraft was
graphically portrayed during the Arab-Israeli Conflict of
1973. In October, 1973, Egypt and her allies confronted
Israel with a pre-dawn surprise attack (Ref 9:27-28).
The initial impact on Israel was a la.rge-scale loss of
equipment (aircraft and tanks) as well as a large expendi-
ture of munitions. During the first few days of the war,
the United States realized that Israel would require mas-
sive and rapid resupply to avert a major catastrophe. Due
to the rapid delivery requirement, the only satisfactory
delivery method was airlift. Lack of support from our
European Allies compounded the delivery problem, as they
withheld overflight and landing rights to Israel-bound air-
lifters. As a result, equipment and munitions stockpiled
in Europe were not available for Israeli use and all sup-
plies and munitions destined for Israel had to come from
the Continental United States (CONUS) (Ref 15:14-15)
7

The only European ally to offer support t'> the United
States was Portugal, which controlled the Azores in the mid-
Atlantic Ocean. Portugal approved the Azores as a MAC
staging base enabling Israel to be resupplied by air with-
out air-refueling (Ref 15:14-15). In 33 days, MAC crews
airlifted 22,315 tons of equipment and supplies, flying
421 C-141 sorties and 145 C-5A sorties (Ref 8:26-32).
The quick and effective resupply of Israel's military
machine enabled Israel to regain the offensive on all
borders and eventually dominate the war (Ref 15:14-15).
The Air Force learned a very important lesson from
this resupply effort. Our strategic airlift fleet is very
dependent on friendly foreign natior to provide staging
bases. Without Portugal's cooperation, the airlift would
not have been possible since the C-5A did not have an opera-
tional air-refueling capability at that time. To meet
future challenges to the United States or her Allies, the
dependence on staging bases had to be reduced through the
expansion of air-refueling capabilities.
Since 1973, the Air Force has undertaken several
new programs to increase the in-flight refueling capabil-
ity of the strategic airlift fleet. First, the C-5A was
made operationally air-refuelable and aircrews were
trained (Ref 5). Second, 234 C-141A aircraft are being
modified to air-refuelable C-141B aircraft (Ref 13:199).
Third, a new tanker fleet of DC-10s (designated KC-10)
has been purchased. With the addition of the KC-10,
8

multiple tankers will no longer be requircK to refuel the2
C-5 on a routine basis. Fourth, a proposal to install
more efficient engines in the KC-135 tanker is being
studied. The addition of these new engines and their
reduced fuel consumption will allow more fuel to be trans-
ferred to the airlifter or increase the rendezvous range
of the KC-135 for a fixed offload of fuel. This results
in increased range for the airlifters.
With all of these changes, air-refueling of air-
lift aircraft will make a greater contribution to the stra-
tegic and tactical posture of the United States. However,
increasing airlift capability by adding new refueling
assets (KC-10 and C-141B) also requires expertise and
experience in creating plans and policy to employ these
forces.
In the future, contingency plans which call for air-
lift resources will be re-evaluated using air-refueling as
an option. General Huyser, CINCMAC, has stated that future
airlift plans created to support war plans will address
in-flight refueling as an option in order to take advan-
tage of this increased capability and efficiency (Ref 16).
In addition, studies to determine how to optimally use
strategic airlift refueling must also be undertaken.
These studies should research operational problems as well
2The C-5A fuel capacity is 315,100 pounds and theKC-10 fuel capacity is 349,153 pounds of which any portioncan be transferred in-flight to the airlifters. The KC-135A fuel capacity is only 165,000 pounds.
9

as economic and logistic problems. Includ,-d in the opera-
tional problem area is the problem of obtaining an optimal
air-refueling rendezvous point.
Current Concepts and Models
MAC planners are investigating the possible incor-
poration of air-refueling models in various war and opera-
tions plans. 3This responsibility falls to the Opera-
tional Plans Office, HQ MAC/XP (Ref 16). As plans are
periodically revised, air-refueling is being considered as
a possible method of increasing the efficiency and effec-
tiveness of the plans. MAC considers three areas as poten-
tially beneficial in increasing the efficiency of airlift
operations:
1. When air-refueling is the only possible method
available for a particular mission. An example would be a
f light from. Moody AFB, Georgia, to West Cairo AB, Egypt,
in a C-141B. A C-141B cannot fly from Moody AFB to Cairo
AB without either stopping enroute for fuel or air-
refueling. If, for political reasons, a staging base is
not available, then the C-141B would be unable to accom-
plish the deployment. Therefc)re, air-refueling is the
only way a C-141B can be used on this mission.
2. When a technical constraint is imposed upon an
airlift operation and air-refueling is required. For
3 Specific contingency plans which address air-refueling are classified and will not be covered here.
10

example, if a C-5A were to airlift a full load of the
Army's battle tanks from Peterson Field, Colorado (Colorado
Springs), the C-5A would be unable to take off with a full
fuel load due to inadequate runway length (11,000 FT) at
the airfield's pressure altitude (6,172 PT) (Ref 10:B96).
Air-refueling would add the necessary fuel, after takeoff,
to continue the flight to destination.
3. Air-refueling can be used to improve closure
time of a mission or a planned deployment. An example
would be the deployment of a tactical fighter squadron
from the CONUS to Korea. By employing air-refueling, the
improved closure time may be decisive in political negotia-
tions.
Air-refueling employment in a war plan or a large-
scale operations plan has never been tested by MAC and
therefore actual experience is limited. To determine the
feasibility and efficiency of using strategic airlift air-
refueling in a MAC plan, the planning staff must actually
prepare the plza twice; once with the air-refueling
included and once without, so that an intelligent choice
between the two can be made. Actual mission profiles must
be planned so that logistic and aircrew requirements can
K be determined and analyzed.
L In planning the air-refueling sorties for a par-
ticular mission, coordination between the MAC staff and
the SAC staff is essential. This coordination results in
i tanker commit.rn-ncL from SAC for the particular plan.

Agreement on a rendezvous point between thc two MAJCOMs
is accomplished by a series of negotiations between the two
planning staffs (Ref 3). During the negotiating, each
staff tries to obtain a rendezvous point most advantageous
for their MAJCOM. However, during this process, analyti-
cal procedures or models which can determine an optimal
route of flight for each aircraft are not used (Ref 23).
* Therefore, during the planning process, neither staff
knows if the agreed-upon rendezvous point is picked so as
to minimize total fuel consumed or total mission flying
time for both aircraft.
- , As HQ MAC/XP is planning routes of flight for war
plans, other routine refueling missions are also being
planned. Daily air-refueling training missions that MAC
and SAC fly &re planned in the same iterative manner by
HQ MAC/DOOMF staff officers. Coordination and negotiations
with SAC for an air-refueling rendezvous point is done in
the same manner, again without the benefit of any opti-
mizing procedures (Ref 3). Although these methods are ade-
quate and are operationally feasible, the planning could be
done quickly and more economically using analytical models.
In an effort to obtain knowledge in the area of
air-refueling, HQ MAC has created air-refueling simulation
models. Air-refueling deployments and operations are
being analyzed in order to gain insight into the world of
strategic airlift air-refueling. At HQ MAC, in the recent
past, one primary model has been used to study airlift
12

air-refueling. The model is presently i., -se and is known
as the M-14 model, commonly referred to as "Collosus"
(Ref 14). The name M-14 identifies it as the fourteenth
macro-model created at HQ MAC. This model was originally
created without air-refueling, but this feature has been
recently added. This Monte Carlo simulation model simu-
lates the entire Military Airlift Command operations and
incorporates all strategic airlift aircraft presently
owned by MAC. M-14 includes factors such as crews, air
bases, material depots, and logistic material used in
daily MAC operations (Ref 14). The purpose of M-14 is to
study the entire airlift capacity of MAC under almost any
circumstances. Other uses for the M-14 include study and
analysis of time-phased deployments, such as JCS exercises
(REFORGER, JACKFROST) and to study the interaction effects
of factors on airlift operations (crews, supplies, etc.).
M-14 can also be used to determine or test optimal global
airlift strategies in the event of a global conflict
requiring massive use of airlift. Evaluation and valida-
tion of war and operations plans can also be accomplished
with this model. M-14 is an extremely large model and
cannot be run at HQ MAC due to a lack of computer capa-
bility (Ref 14) . As a consequence, a larger computer at
Kirtland AFB, NM, must be used whenever the M-14 is used.
Major initial inputs to the model include departure
base, destination, route of flight, and fuel and cargo
loads. Another important variable is tanker-airlifter
13

air-refueling rendezvous point for air-rcvfu-ling missions.
The M-14 model allows the manual input of a rendezvous
point, or it will calculate a rendezvous point for a par-
ticular mission. In either case, the rendezvous point is
determined without the benefit of analytical optimization.
At a higher command level, HQ USAF Studies and
Analysis (SAGM) has created a refueling model. The pur-
pose of this model is to study tanker force sizing (Ref
* 22). Given a particular deployment package, the number of
tankers required can be determined, or given a particular
number of tankers, the most efficient employment methods
can be determined and evaluated. This model is detailed in
its fuel calculations, and results have shown that the fuel
figures from the model are within 1 to 2 percent of figures
obtained from the aircraft performance manual and fuel plan-
ning publications (Ref 22). The model is deterministic and
does not use simulation methods. Variables such as wind
factors, which can change dynamically, are fixed for a par-
ticular run of the model. Rendezvous points are either
manually inserted or can be calculated inside the model;
however, no optimization routine is used to try to reduce
fuel consumption by picking the best of all feasible
rendezvous points.
Flight Planning
This section describes and explains flight planning
and fuel planning to include a discussion of the terminology
14

and concepts used later in describing th-L research.
Flight planning is an extremely important part of aviation,
without which, intercontinental flights would be hazardous
and chaotic. Since this study is concerned with detailed
flight planning calculations, a brief description of
flight planning methods will be presented. Appendix A
will present a sample fuel planning calculation for the
C-141B. These calculations will be linked to the SLAM
Simulation Model in Appendix K. For the purpose of this
research, flight planning is defined as the art and science
of determining a route of flight and fuel required to fly
* between a departure and destination location. This plan-
* ning is done on the ground prior to flight. AFR 60-16,
General Flight Rules, states that prior to each mission
the pilot in command will ensure that the flight path and
fuel planning will be performed in sufficient detail for a
safe flight (Ref 2:p.2-1) . The initial phase of flight
planning determines the route of flight. This is usually
listed on a computer flight plan obtained from AF Global
Weather Central (AFGWC), Of futt AFB, NE. The computer
flight plan provides flight altitude, route of flight, dis-
tances, and flying times between reporting points as well
as other information. The flight altitude must conform to
the hemispherical altitude structure i. ,ir traffic con-
trolled airspace.
The next and most important part of flight planning
is fuel planning. Since fuel planning and fuel consumption
15

are of primary importance to this research, fuel planning
will be decomposed into seven sections for an air-refueling
mission (see Figure 1).
1. Start, taxi and takeoff.
2. Climb to an initial cruise altitude.
3. Cruise to an air-refueling rendezvous point.
4. The refueling maneuver.
5. Cruise to destination.
6. Approach and landing.
7. Holding or cruise to an alternate airport
(if applicable), and appropriate fuel reserves.
Each of these seven areas will be explained so
that the terms will be familiar when the air-refueling
models are described. The following explanation will be
for a typical MAC air-refueling mission, and is not
intended to be used as a guide for planning an actual
flight.
The first part of fuel planning is start, taxi, and
takeoff (STTO). This encompasses the fuel required for
engine start, taxi from the parking spot, and acceleration
fuel during the takeoff roll. If ground delays or Air
Traffic Control (ATC) delays are known or anticipated, the
fuel consumed for these is also computed and added to STTO
fuel. The STTO fuel is usually a constant fuel quantity
for a particular aircraft. For example, 1900 pounds of
fuel is used for the C-141B (Ref 1:p.2-2). The ground
delay fuel is based on time and is usually computed from a
16

a4
0)
r4
rX4
17

constant fuel consumed per unit time. For the C-141B,
the ground idle fuel consumption rate is 60 pounds per
minute. Known ground delays are always accounted for in
fuel planning.
The second part of fuel planning is the climb fuel
consumption. The ground distance traveled during the climb
can be obtained from the performance manual for the aircraft,
or from the computer flight plan. Using distance and the
time required to climb to cruise altitude, the fuel con-
sumed in the climb can be determined from the aircraft
performance manual.
The third part of fuel planning is the fuel required
to cruise to the destination or air-refueling rendezvous
point. To calculate this fuel, time at cruise, cruise
altitude, and aircraft gross weight are required. Again
tables in the performance manual for the aircraft are used.
Once the rendezvous point is reached, the fuel
required for section four, the rendezvous and refueling
maneuver, is computed. At this point, it is important to
insure that each aircraft, the tanker and the airlifter,
has sufficient fuel reserves to continue their mission.
For the airlifter, sufficient fuel must be aboard prior to
the refueling so that if unable to refuel, it can reach
a suitable abort location and land with the proper fuel
reserves. These reserves will be detailed later in this
section. If additional fuel beyond that required to
18

accomplish the abort is available, then zn air-refueling
will be attempted.
The air-refueling track is usually a fixed dis-
tance, over which the refueling must be accomplished (Ref
17). The track location and length are determined prior
to flight and the amount of fuel transferred from the
tanker will be enough to allow the airlifter to reach its
destination. The tanker, prior to the refueling, must haveenough fuel to supply the airlifter and return to its
recovery base with the proper fuel reserves. If either the
tanker or the airlifter cannot meet these fuel requirements,
the air-refueling is aborted. However, the abort rate for
airlift aircraft is only between 10 and 15 percent (Ref 3).
Fuel consumption during this stage of flight differs from
cruise fuel rates, and must also be taken into account.
Differences in fuel consumption rates are due to formation
flying with the refueling boom extended. Detailed fuel
computatic are discussed in Appendix A.
Once the refueling is completed, the airlifter and
tanker cruise to their destinations. Cruise fuel is deter-
mined in a manner similar to the cruise to rendezvous point.
Once the aircraft approaches the destination, the
enroute descent, approach, and landing maneuvers occur and
fuel computations are completed for section six. Approach
and landing fuel is usually given as a constant figure for
all aircraft. For example, the approach and landing fuel
for a C-141B is 2500 pounds of fuel (Ref 1:p.2-2).
19

The fuel reserves for an internau-I -zial mAC flight
are used to insure that enough fuel is aboard the aircraft
to complete the mission as planned and to account for
unforeseen changes. These changes can occur at various
times throughout the mission. Examples are ATC delays,
changes in the direction and velocity of the wind, weather,
and changes in the temperature deviation of altitude.
Combining these unforeseen delays, a large quantity of fuel
could be expended. To ensure that the mission is not
jeopardized, AFR 60-16/MAC Supplement One provides guide-
lines for the aircrew establishing procedures to calculate
fuel reserves. These unforeseen delays are accounted for
in three ways:
1. Enroute fuel reserves.
2. Alternate fuel reserves.
3. Holding fuel reserves.
Enroute fuel reserves are added to the normal
flight plan fuel load and consist of fuel which is 10 per-
cent of the fuel used to fly over a category one route/
route segment, not to exceed one hour fuel at normal
cruise (Ref l:p.2-2) . A category one route is any route
where a navigation aid cannot be flown directly over once/
every hour. This generally applies only to those portions
of the flight which are over water.
The second fuel reserve is the fuel required to
divert to an alternate airfield due to weather, airfield
closure, or other circumstances. For flights outside the
20

CONUS, an alternate is always required (P(- l:p. 8 -1).
Fuel reserves to fly to the alternate airfield are computed
as follows:
Fuel (is required) for flight time from overheaddestination or initial penetration fix to alternate,or to the most distant alternate when two are required,at the speed and altitude in the appropriate fuel plan-ning publication. Add a ten percent reserve when timeto alternate exceeds Dne hour for turbojet ....Alternate reserve plus enroute reserve will not exceedone hour at normal cruise [Ref 1:p.2-21.
The final fuel reserve to be calculated duringdo
flight planning is the holding fuel. Once an aircraft has
arrived at a destination, there are many reasons why it
may be instructed to hold by ATC. In any event, if holding
is necessary, a holding reserve fuel can be calculated as
follows: "Holding fuel will be 45 minutes fuel for turbojet
. . computed from the appropriate fuel planning publica-
tion using endurance or holding charts [Ref 1:p.2-2]."
Fuel planning is Completed when all of the fuel
figures are added to provide a flight plan fuel load. This
is the fuel required to fly the intended mission. Each
MAJCOM provides planners and aircrews with fuel management
procedures to ensure a safe flight. When the fuel plan-
ning is concluded the important parts of flight planning
are accomplished.
21
21

III. Design of Experiment
Scope and Assumptions
The scope of this research was limited to scenarios
which require refueling of the airlifter to complete the
mission and where in-flight refueling is dictated becauseF,
enroute refueling bases are not available. Missions which
involve more than a single tanker and airlifter aircraft
are not addressed. Two scenarios have been selected for
investigation. The first is an airlifter flight from
McGuire AFB, NJ, to Tehran, Iran. The second scenario is
a flight from Travis AFB, CA, to Yokota AB, Japan.
The following assumptions are made in this research:
1. The tanker aircraft will take off and recover
from the same base which will be limited to CONUS or U.S.
possession bases. The recovery restriction stems from the
high demand for tankers by SAC, TAC, and MAC during a
general contingency operation. Use of a single tanker
base insures the availability of maintenance and staging
crews for fast turnaround of the tanker to support another
refueling mission. This base may be other than the
tanker's home station if the tanker is prepositioned close
to the refueling point.
22

2. The aircraft operations must b;- in accordance
with AFR 60-16, General Flight Rules, and other major com-
mand regulations pertaining to air-refueling.
3. The maximum allowable cargo, limited by the
maximum gross weight or volume of the cargo compartment,
will be loaded on the airlifter. This operating practice
will minimize the total number of sorties required to
deliver a particular deployment package.
Conceptualization
Two models were developed for this research. The
first, "FLTPLN," is deterministic and it models the air-
craft flight planning as described in Chapter II. It com-
putes the fuel requirements for a specific set of mission
input parameters. The model compares the fuel requirements
at 65 rendezvous points in the feasible region and selects
the geographic point which minimizes the total fuel con-
sumed by the airlifter and tanker aircraft. The second
model is a SLAM simulation model whose inputs are provided
by FLTPLN. The model simulates the actual flight (see
Figures 1 and 2) of the two aircraft substituting a stochas-
tic variable for the wind parameter and adding the proba-
bilistic occurrence of takeoff delays. The mean for the
wind is the constant value used by the flight planning
model. The variance of the wind and the probability of
delay are determined from real world events. The simula-
tion tests the operational feasibility of the input
23
544
CC)
-J
44
C4
'54
244

parameters verifying the r ults of the T'L model. T-he
SLAM model was also used to determine the extreme values
of variance of the stochastic variables beyond which the
flight planning results were always operationally
infeasible. A detailed description of the two models is
in Appendix K.
The response variable under consideration in this
research is the total fuel consumed by an airlifter and
tanker aircraft during a mission which requires an
in-flight refueling of the airlifter. As described in
Chapter II, the major factors which affect the total fuel
are the fuel consumption rates for each aircraft and the
time that fuel is consumed at the respective rates. The
fuel consumption rates are different for each aircraft
and vary for a specific aircraft with changes in aircraft
gross weight and meteorological conditions, such as tempera-
ture and air density. These meteorological conditions
change proportionally with the flight altitude of the air-
craft as well as randomly with changing weather patterns.
The gross weight of the aircraft is derived from the basic
airframe weight plus the cargo and fuel at takeoff. The
gross weight changes constantly during flight as the fuel
weight is reduced. The flight time is a function of the
total distance and groundspeed. The total distance is the
flight path of each aircraft between its departure and
destination. Groundspeed is the sum of the aircraft true
airspeed and the component of the wind velocity in the
25

direction of flight. The true airspced <aries with the
mach number and altitude of the aircraft.
The meteorological conditions are the most diffi-
cult to predict. The computer flight plans generated by
AFGWC require a wind and temperature update every 300 NM
along the planned flight path to accurately compute time
and fuel results. A worldwide weather data base updated
in real time supports this interaction. Because this
research is directed at a general policy rather than a
specific solution, the scenario weather patterns are held
constant. The temperature and air density are fixed at the
* ,standard day values for the cruise altitude and the wind is
a constant, set to 263 degrees at 55 KNOTS. This wind is
an approximate mean value for east-west flights at mid-
latitudes. The cruise altitude is selected at the highest
Air Traffic Control Hemispheric altitude which the aircraft
can attain for its gross weight. Thus, all meteorological
conditions are controlled in the models.
Each aircraft has a fixed basic airframe weight
and operationally assigned cruise mach number. Therefore,
only cargo and fuel weight are varied on the airlifter
and only fuel weight on the tanker. The fuel consumption
rates for each aircraft using these parameters are obtained
from the common fuel data base, referred to as FLYME (see
Appendix H).
For an actual flight, the flight path may be modi-
fied because of airspace constraints, national boundaries,
26

or weather considerations. Since the tott distance is the
only route factor pertinent to this research, the flight
path is defined as the great circle route between the
departure and destination points. As a result, a scenario
of departure and destination bases for each aircraft com-
pletely defines the total distance. The major factors
which are varied in this research are therefore:
1. the airlifter scenario,
2. the tanker scenario,
3. the aircraft combination,
4. the airlifter's cargo load, and
5. the airlift initial fuel load.
In order to investigate the interactive effect of each
factor, a full factorial design is employed combining all
levels of each factor with the levels of all other factors.
This design varies the levels of only one factor at a time
while keeping the others constant. This routine is repeated
until all levels of all factors are examined. Table 2
lists the design factors and their levels.
Two airlifter scenarios were investigated, one
east bound with a tail wind and one west bound with a head
wind. The attempt was to offset the effects of holding the
wind constant in the model. For each airlifter scenario,
four tanker departure bases were considered to test the
impact of tanker basing on the optimal rendezvous point.
The tanker bases were selected with one near the airlifter's
departure base, one to the north, one to the south, and the
27

TABLE 2
EXPERIMENTAL DESIGN FACTORS AND LEVELS
Factor Level
Airlifter Scenario a) McGuire AFB, NJ to Tehran, Iranb) Travis AFB, CA to Yokota AB, Japan
Tanker Scenario a) Castle AFB, CAb) Charleston AFB, SCc) Eielson AFB, ALd) Fairchild AFB, WAe) Loring AFB, MEf) McGuire AFB, NJ
Aircraft Combination a) C-5/KC-10b) C-5/KC-135c) C-141B/KC-10d) C-141B/KC-135
Airlift Cargo Load a) 1) 100,000 lbs.2) 85,000 lbs.3) 70,000 lbs.
b) C-141B1) 70,000 lbs.2) 55,000 lbs.3) 40,000 lbs.
Airlifter Maxin-nu Fuel Load
Fuel (1000 lhs.)Cargo Cargo
C-5 (1000 lbs.) C-141B (1000 lbs.)
261.3 100.0 114.0 70.0276.3 85.0 129.0 55.0291.3 70.0 144.0 40.0
NOTE: These initial maximum fuel loads weredecremented by 20,000 lbs. ten times or until infeasiblefuel loads were obtained.
28
.4i

fourth was Barksdale AFB, LA. Barksdale is the proposed
base of assignment for the KC-l0 (Ref 23). This allows
comparison of the KC-10 operating from Barksdale against
operating from a base closer to the airlifter departure
base. The bases considered in each scenario are listed in
Table 2.
For each scenario and aircraft combination, many
rendezvous points are feasible. Rather than compare all
of the feasible points, a small rectangular region is con-
sidered. The rectangle was fixed along the feasible boun-
dary furthest from the airlifter destination. The size of
the rectangle is 20 degrees of latitude by 24 degrees of
longitude. The region was determined to always contain
the optimal rendezvous point. All other points have higher
total fuel values and the values increase monotonically in
all directions away from the optimal point. As a result,
only the matrix of points in the rectangle were required
to define the optimal point. For rendezvous points near
the airlifter's departure base, the leveloff point after
initial climbout was considered as the first feasible
rendezvous point. These cases are close to not requiring
an air-refueling and are treated as extreme levels. A
single abort base is designated for each scenario. In the
case of an aborted refueling, the airlifter must have suf-
ficient fuel to recover to the departure base or the
abort alternate, whichever is closer. Loring AFB, ME, is
29
7.3

the abort alternate for Lh- east scenaric n: j Elmendorf AFB,
AK, is the abort alternate for the west scenario.
The structure of the SLAM model exactly follows
the sequence of flight planning steps outlined in Chapter II.
The wind velocity is allowed to vary and delays which result
in additional fuel consumption are included. The delay
data is based on the actual home station delay rates from
Travis AFB, CA, and Dover AFB, DE, for the C-5A, Norton
AFB, CA, and Travis AFB, CA for the C-141, and March AFB,
CA, and Plattsburg AFB, NY, for the KC-135. The KC-10 is
not operational, so the results of the C-5A data were used
for the KC-10 also. The raw sample data for these delay
rates are in Appendix B.
Multiple runs of each scenario are made in the SLAM
model to test the feasibility of the FLTPLN results. The
sample size, or number of replications per flight was
determined while the sample runs were conducted. The
sampm3 size was directly determined trom results generated
by the SLAM model output. Initially, runs of ten replica-
tions with a variance reduction technique were used. The
variance reduction technique was antithetic variates
(Ref 18:484-485). Using antithetic variates and twenty
replications reduced thc variance obtained from twenty
replications using regular Monte Carlo simulation tech-
niques in every case tested.
30

IV. Verification and Validation
The steps taken to validate the analytical flight
planning model, FLTPLN, are described in this chapter.
The validation included verification of three aspects of
the model; input parameters, internal design, and tech-
nical accuracy of the computations. The validity of the
output of the model was also measured against the objec-
tives and assumptions used in the modeling efforts. The
validitvr criteria was set at 5 percent deviation frcm the
performance charts for the FLYME fuel data and 10 percent
deviation of the total fuel consumption results of the
model from manual computations. Final validation of FLTPLN
for operational suitability was accomplished by the SLAM
simulation model.
The input parameters used by FLTPLN are constants
or derived results computed in other model subroutines.
The constants are either levels of the factors varied in
the experiment or parameters extracted directly from
the respective aircraft performance manual. The use of
operational constants such as cruise mach number signifi-
cantly adds to the external validity of the model because
these are the values in actual use by the MAJCOMs. The
derived results include fuel data from the FLYME set of
subroutines, great circle distance and course computations
from subroutine RHOTHTA (see Appendix H), and ground speed
31

computations from within FLTPLN (see Appcndiix C). The
FLYME fuel data was technically verified by comparing
selected values to the aircraft performance charts. The
results are presented in Table 3. The average deviation
of the FLYME data from the performance charts as a per-
centage of the chart values is 4 percent. This deviation
was consistent for all parameters in both the FLTPLN and
SLAM models.
Appendix A contains a sample fuel consumption cal-
culation of a typical C-141 mission using the aircraft per-
formance mannals. Table 4 compares these manual fuel con-
sumption values to the manual computations. These are
sufficiently close to verify that the aircraft fuel con-
sumption calculations are representative of the respective
aircraft.
The internal desxgn of FLTPLN was verified by pro-
ceeding manually through each step of the program to ensure
that values were used as the designers intended and not
changed or internally lost. The output parameters were
also cross-checked to verify one result from another.
For example, the onload fuels must equal tbh sum of the
route fuels plus reserves. From these tests, the program's
design was technically certified as accurately computing
and printing the experimental results.
The output of the models was displayed in a
5x 13 matrix consisting of total fuel consumption values
for a specific rendezvous point. For every scenario and
32

TABLE 3
VALIDATION OF FLYME DATA BASE
Cruise HoldingClinb Climb Climb Fuel Fuel
Input Time Dist Fuel Rate RateParameters (Min) (NM) (1000 ib) (1000/Min) (1000/Min)
C-5 FLYME 22 133 12.3 .32 .20500,000# CHT 21 129 11.7 .32 .23FL350 % Dev +.05 +.03 +.05 0 -. 12
C-5 FLYME 25 150 16.1 .42 .23650,000# CHT 25 150 15.3 .42 .26FL290 % Dev 0 0 +.05 0 -.12
C-141B FLYME 15.4 93.6 6.6 .20 .16240,000# CHT 15.1 91.0 6.3 .21 .16FL350 % Dev +.02 +.03 +.05 -.05 0
C-141B FLYME 15.8 92 7.6 .25 .19300,000# CHT 14.8 90.5 6.9 .26 .19FL290 % Dev +.07 +.02 +.10 -.04 0
KC-10 FLYME 18.3 127.5 10.3 .35 .24420,000# CHT 17.6 121 9.8 .35 .24FL370 % Dev +.04 +.05 +.05 0 0
KC-10 FLYME 22.2 154.5 13.7 .41 .31575,000# CHT 21.2 151 13.2 .39 .31FL310 % D-v +.05 +.02 +.04 +.05 0
KC-135 FLYME 19.3 128.6 6.6 .18 .16180,000# CHT 20.0 127.0 6.6 .18 .16FL350 % Dev -.04 +.01 0 0 0
KC-135 FLYME 27.2 171.5 9.9 .25 .20250,000# CHT 28.0 171.0 9.9 .25 .20FL290 % Dev -.03 .00 0 0 0
NOTE: CHT values are obtained from aircraft perform-ance manuals.
33

-4 mf r'4 '-) Nl Lr N
r ~ 0i 0 -: N 14 r-00N O N r- r'-1- Q
04 cv 4 1-4-f
-4 ~ ~ ~ ~ = -4 0 0) L) 0 O
C) c
r-4 N0 C N- 00 N- - CN-4 -
0
I' CN k0 -T 0, C -1 n f
r- Ln LN %-D M -0 n r m m r co 0 f
0.0 0N I'D ND N 0 en vCN -A -4 -q
0 1.0
~~ -44-
o 0- u
0. ~H .0H 4-)) ca _
CI) L A
-4-I r-4 -4 -4 IV -
4.)
44i 00 ~v.12. r-S -4) .-O v4
434

0aH 4-)
4-iIV4 044-4 4.) 4-) r=;coj ul 0Li Q) -~04
Li (1) Z -4 0 -1.*1 4.) (d
fu 4 0
4-4 id rXe 0 4-4
* 0 0 4~-1-4 0 - Li Li 4.' rd ~ ~o r. 4-4 4-4 0 ulC) 41) z
mU r~ Vo V 0 mU E 0Z: a, Q) ) Li 0 Li
41 i - A Z- r, 4-4 ) 4 44.0 0 d .11 LU -4
u )' (13 U) U)0 4J - 4-) Q) z 10 (Du Z) Q .0) Q :j 0 a) 0
0 0 4 0 r-4 Li z -rq C 0 (Uj 44 .4 (a
4J 4' W0 Q) > mU >MU 4,J 4-4 :j -1' 0 4-i
(0 r-i -4 z C)- z0H4 rd i co1 0 z -A 0 0-4 H C > UI) > -4 .14 Q) -r:3 - 4-) (UV C) 4-j
0 4.1 -, C 04 4-i0 0 Q4C)4-4 (U 0 e 0 E .0 e -4 2:
(U04 -r %D H 0 0 (0 0i C4i4 41 ) N) 41 > w)
u ). 04- 04 Z rLi4l E) F 0 19- Z 0
Li -H () :1U) 0 U) U) 0 U)(D (0 4-4 'U U)V Uo ) fa - H
4-3 0 _q r. z .- i 41. .-4'4-4 Vo 0 -4 0 (1) Li 04 D
-4 rCz ) u) C) ;: z 0 0-4 0 0 Li4 4-4 0 41 4-4Li C)*u -4 -4 -4 C .1U U)
4 i Q) 4 4- ) 4l 0)- Z, 41i(75 r.U) U ) (u Li ~04 0 0444 0 9
Q) Z (0 4E-1 14-4 P4 u P)Qi -4a, * 04 4 E-4 ro E-4
Q) 4-) (1) r r14 Z -4 44 4JU) a 0 0 r1 ZH -1 4a,) r-i -H- 0~
l 4-4 I4 (n Li : U) 4-4 C) 4-4 4I-40 (1) Cl -1 ) 0 41. 0
4-4 4-) I . i U) ., - 0 rl0 0 44 r. Ei:: C a . 0 -
m Qs r. (z 0U En .0 -1 04.) Li Li 0 E-4 a) a, *-C 4-4 1 -4
44 (o C) -4- 4 0 J1. 41J 0 U) 4-)fu C) L 4-) a, 4-J.-,I .-W -UH Q)u a, (
C) I o CU 41l 1i m > (I 4- id 41) >Li -l 4-) a) 41 a, .
-4 0 >1i 4 1 1 -4 ru IU'm I VU)E00 (d O L i U) (0 04 (U 04 :
I ( 4.) V0 U) C:0 4-) 4 0 'UUi m U~C) r. 4u 41 UUC C) 4-) 4J~-
41 Q 41~ r 4-)4-4 4.-' 4-4 Cd) IMU 44 a, (U L Z Z
S4 -i H -4 wi Q) 4 4C) u - 04 C) l 4 04 a) a
04 -H E-4 0- -H (U
.0 -4 4
'U 0
35

combination of factors, FLTPLN determincd an optimal
rendezvous point for which the total fuel requirement was
lower than any other point considered. This can be seen
in the FLTPLN output in Appendix G. While this matrix repre-
sented only a portion of the feasible region of points,
the optimal point was always surrounded by higher values.
Every matrix of total fuel values had a gradient increasing
monotonically from the optimal point out to the feasible
boundary or to the edge of the matrix. Thus the minimum
value of the matrices is considered the absolute minimum
for the entire feasible region.
The output was further validated by checking that
changes in the input parameters resulted in consistent
changes in the output. For example, higher cargo weights
or route distances rcsulted in higher total fuel consump-
tion.
Further validation of FLTPLN results was accom-
plished using the SLAM model. FLTPLN output (total fuel
consumption per aircraft) was compared to SLAM output and
mission success rates were computed. In this way, FLTPLN
output could be shown to be feasible under actual real-time
flight conditions. The SLAM validation of FLTPLN was done
for each aircraft. The results of this validation are
described in the following paragraphs.
Each of the twenty-three C-5 flights simulated by
the SLAM model was successful under the normal wind factor
using probabilistic ground delays of zero or fifteen
36
minutes. The SLAM fuel consumption valucs averaged 2.1
percent higher than those calculated by the analytical
model. Deviation of the SLAM fuel consumptions for the
C-5 are shown in Figure 3 for particular cargo loads,
tanker base, and refueling tankers. A negative value means
the SLAM model computed less fuel than the analytical model
and a positive value means the SLAM model computed more
fuel. Even with this increased fuel consumption, the C-5
was still able to complete all flights successfully. To
further validate FLTPLN a 95 percent confidence interval
based on the SLAM fuel consumption mean and variance was
constructed for each aircraft. Using the upper limit of
the confidence interval as the actual C-5 fuel consumption,
and as a r ission completion success criteria, 87 percent
of the flights were successful. For example, if the avail-
able fuel for the C-5 exceeded the upper limit of the fuel
consumption confidence interval the mission was successful.
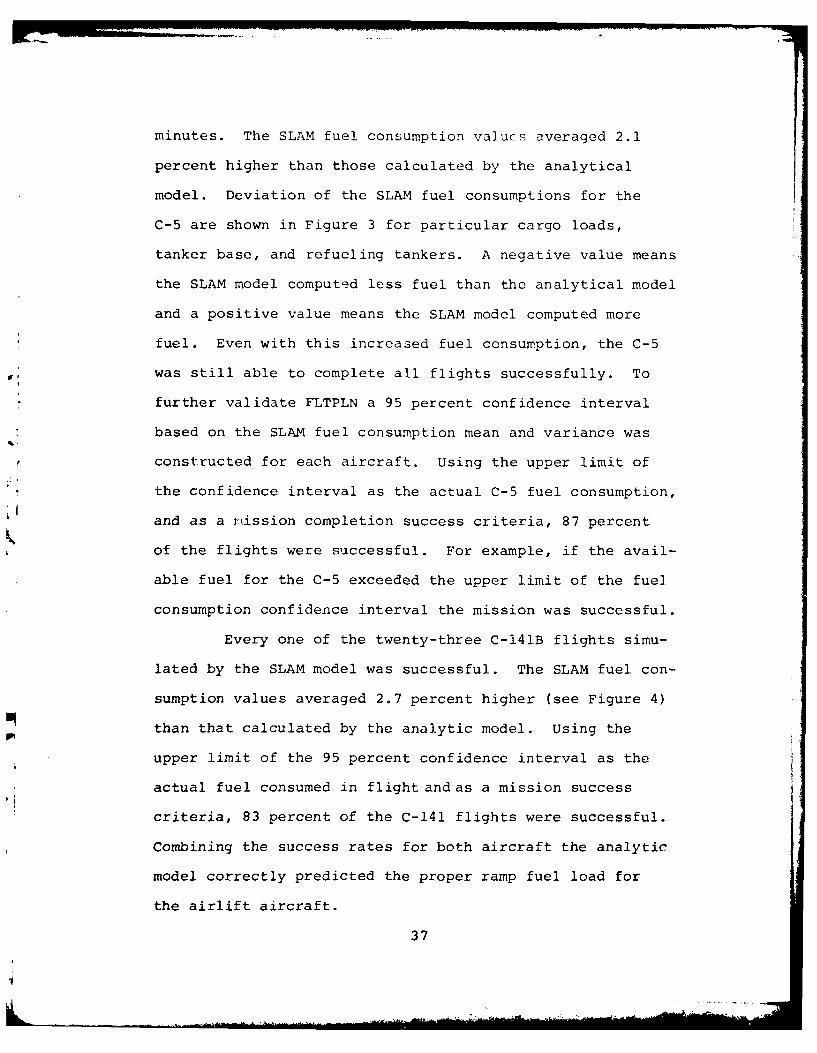
Every one of the twenty-three C-141B flights simu-
lated by the SLAM model was successful. The SLAM fuel con-
sumption values averaged 2.7 percent higher (see Figure 4)
than that calculated by the analytic model. Using the
upper limit of the 95 percent confidence interval as the
actual fuel consumed in flight and as a mission success
criteria, 83 percent of the C-141 flights were successful.
Combining the success rates for both aircraft the analytic
model correctly predicted the proper ramp fuel load for
the airlift aircraft.
37

vv
+10
D
A
T
0
N-10
CARGO 100 70 100 70 100 70 100 70 100 70 100 70TK BSE CASrLE FAIRCHILD EIELSON CASTLE FA HIIfl EIE[SNACET KC-10 KC-135
Fig. 3. C-5--Deviation of SLAM Results Compared tothe Analytical Fuel Consumption Results
38
+10 I5 N
FDEE
AATI0N
-10
CARGO 55 40 55 40 55 40 55 40 55 40 55 40TNK BASE M-GUE LORING CHS bcGUIE LORING CHSACFT KC-10 KC-135
Fig. 4. C-141--Deviation of SLAM Results Comparedto the Analytical Fuel Consumption Results
39

One hundred percent of the SLAM t:ker flighti
were successful using the SLAM wind variant and ground
delays. Also each of the flights was successful using the
upper limit of the 95 percent confidence interval as the
success criteria. The SLAM KC-10 fuel consumption values
averaged less than a 1 pbrcent decrease (see Figure 5)
from the analytical model result and the KC-135 averaged
less than a 2 percent decrease (see Figure 6) from the
analytical model result. From these deviations we con-
cluded that the analytical model provides results that are
operationally feasible under actual flight conditions for
all four aircraft.
Overall, the tankers burned about 1 percent less
fuel in the SLAM model than in the analytical model. Con-
versely, the airlifters burned about 2.5 percent more fuel
in the SLAM model than in the analytical model. This
difference in airlift fuel can be explained from the nature
of the two aircraft missions. The tanker flies to a
rendezvous point and returns to his departure base which
is relatively close compared to the airlifter destination;
the airlifter, however, flies to the rendezvous point and
then continues on to a destination which is thousands of
miles longer than the tanker route of flight. Conse-
quently, the airlifter has more time to be affected by
increases in the wind factor, and these increases plus any
delay in fuel consumption would cause the increased fuel
requirement. There are two reasons the tanker SLAM results
40
.4

II
%
D i .E
I IA 0
I Uo0iN
-10
CARGO 100 70 100 70 100 70 55 40 55 40 55 40TK BASE CASTLE FAIRCHILD EIELSCN CASTLE FAIRCHILD EM"ACFr C-5 C-141
Fig. 5. KC-10--Deviation of SLAM Results Comparedto the Analytical Fuel Consumption Results
41

+10
DE
0
T
0N
-10
CARGO 100 70 100 70 100 70 55 40 55 40 55 40
TK BASE McG(JIRE LORING CHS MCJ IRE LORING CHS
ACFrT C-5 C-141B
Fig. 6. KC-135--Deviation of SLAM Results Compared to
the Analytical Fuel Consumption Results
42

are less than the analytical consumption. First is that
an increase in wind factor has less effect on the tanker
than on the airlifter. A head wind increase to the
rendezvous point becomes a tail wind increase when return-
ing to destination. Second, is the difference in the loiter
fuel computations. In FLTPLN the tanker loiter fuel is
always based on a fifteen-minute loiter duration; however,
in SLAM the loiter time is based on actual aircraft
arrivals which usually requires less than fifteen minutes
loiter time. For the tankers, fifteen minutes loiter fuel
is more than the difference between SLAM and FLTPLN fuel
values. However, without any adjustments for loiter fuel
the fuel consumption values remain within our 10 percent
validation criteria. Finally, from these validation
results we observe that the SLAM model has validated the
results of the analytical model. The SLAM model validation
is discussed in Appendix I.
43

V. Results and Analysis
The major purpose in the analysis of the research
results was to identify the principal factors affecting
the determination of the optimal rendezvous point and
takeoff fuel loads. First, these principal factors were
analyzed in terms of the two hypotheses stated in Chapter I.
The effect of cargo load on the optimal rendezvous
point is the first factor to be considered. The first
hypothesis stated that the optimal rendezvous point would
occur at the maximum flight range of the airlifter from
its destination base. This maximum range from the destina-
tion constitutes a boundary of the region of feasible
rendezvous points closest to the airlifter takeoff base.
The dashed lines on Figures 7 to 10 represent this boundary
at the levels of the cargo weight indicated. The optimal
rendezvous points determined by FLTPLN did not always occur
at this boundary range. The separation between the ren-
dezvous points and the feasible boundary is indicated on
the figures by the arrows. For example, in Figure 7, the
100,000 pounds cargo load on the C-5A resulted in an
optimal rendezvous point location 244 nautical miles from
the respective feasible boundary. The results for the
C-141 on Figure 8 are similar. As the cargo weight is
decreased, the range of the airlifter increases. This
44

0 Co
\ ClN
4 4
1000
- 0
0
4 0
- Lf)
coo 0/ N
4-4
En r-
Cd z
LO) /7 n
45

Lfl
LOV- 0
-D
*Ln C14
- .0->
r-
oU
o -IiWo* 44
a Itzr 0
/r cn)v
46

-4
00Ci,C)4
low'
- ,-4 U)
4-
-H
0 v- 4
00 u)
0N
0 a
- -
0 -4-4
00
0)C0
-) N - -
-4 4
U') Ln -W e
47
IL

-4
ko
-
r~
N -
04-~~C U)- - --
La 0
oo 0
C
C
4-4
'.0
44
41L
zzLnLn
48
shifts the feasible boundary away from the airlifter
destination base. For each decrease in cargo weight,
the optimal rendezvous points shift toward the airlifter
takeoff base along with the corresponding feasible boun-
dary. However, the optimal rendezvous point is located
farther from the hypothesized location with each decrement.
For the maximum feasible cargo weight of an airlifter, the
optimal point occurs on the feasible boundary, as is
indicated on Figure 9 for 70,000 pounds. Beyond these
cargo weights, the shorter range of the airlifter does
not permit a feasible solution. These results contradict
the first hypothesis.
The second factor to be considered is tanker base
selection. Five of the six airlifter/cargo weight combina-
tions for the east suenario resulted in the same optimal
rendezvous points regardless of which tanker base was used.
However, for the west scenario, most tanker bases resulted
in a unique rendezvous point for a given airlifter/cargo
weight combination. The rendezvous point using Eielson
was different from the rendezvous point using Fairchild
or Castle. The location of Eielson far along the western
route of the airlifter, precipitated this result. However,
each of the bases had some influence on the rendezvous
point measured by the distance of the point from the great
circle route of the airlifter. Table 5 lists these dis-
tances by bases. The influence of the tanker base con-
sistently increases as the bases are located farther along
49'.J

TABLE 5
TANKER BASE INFLUENCE ON RENDEZVOUS POINT
Base Location
Eielson 758.7 NM
Fairchild 402.2 NM
Castle 93.7 NM
the airlifter's route. The lack of variance due to tanker
basing in the east scenario rendezvous points stems from
the increased fuel requirements for the airlifter. Because
of the large fuel requirement to reach the ultimate des-
tination in the eastern scenario, little flexibility was
present in determining the rendezvous point. Thus, the
location of the tankur base affects the selection of the
optimal rendezvous point more when the fuel constraints
on the airlifter are relaxed by enroute tanker basing or
shorter total distances for the airlifter.
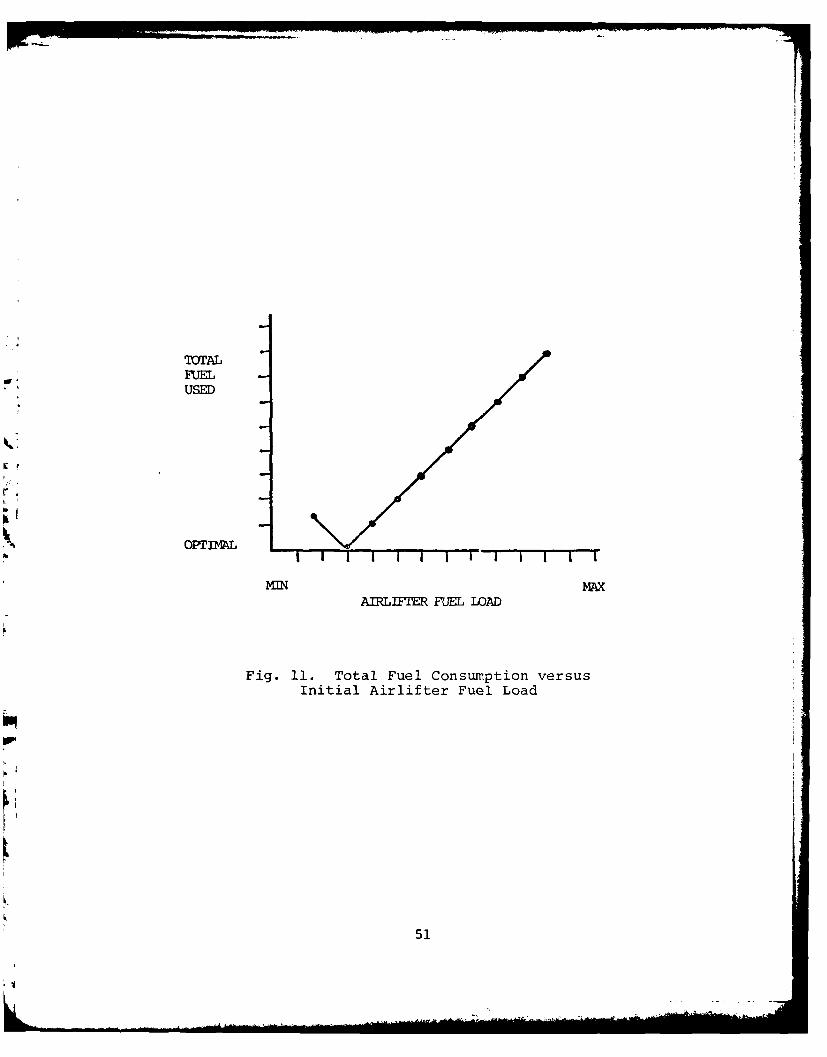
The second hypothesis stated that the maximum
allowable takeoff fuel load for the airlifter would result
in less total fuel consumption than any other fuel load.
However, for most scenarios, the optimal airlifter fuel
load was the minimum required to reach the optimal
rendezvous point and still maintain sufficient fuel
reserves to abort to the closest recovery base. This is
indicated by the lowest point on the graph in Figure 11.
50
TOTAL
FUELUSED
OPTIMAL _ ____
MIN MAXAIRLIF R FUEL LAD
Fig. 11. Total Fuel Consumption versusInitial Airlifter Fuel Load
51

Investigating higher fuel onloads for the same scenario,
the optimal rendezvous point was found to remain the same,
but the total fuel requirement increased. This trend can
be seen in the sample FLTPLN output data in Appendix B.
For smaller fuel loads, the rendezvous point was located
closer to the airlifter takeoff base. This, however,
resulted in a larger total fuel requirement for the mission.
This trend is also shown by the graphs in Figures
12 to 15. The fuel loads of the airlifter and tanker com-
binations are expressed as percentages of their respective
fuel capacities. Each curve corresponds to a different
combination of cargo weight and tanker base. As the
airlifter fuel load is reduced, the tanker fuel load is
increased by an amount proportional to the tanker fuel
decrease. The total fuel represented between any single
point on a curve (Figures 12 to 15) varies only a few
thousand pounds. Therefore, the transfer fuel is the only
factor which changes significantly. The slope of each line
represents the relative efficiency of the aircraft for
transporting fuel to the rendezvous point. Similarities
in the C-5/KC-10 graphs (Figure 12) and the C-141B/KC-135
(Figure 13) graphs can be explained by comparing fuel
consumption rates. For example, the C-5 and KC-10 have
similar fuel consumption rates, as do the C-141B and KC-
135. The slopes of the lines for these combinations are
approximately -1.2. The approximate slopes for the C-5/
KC-135 (Figure 14) and C-141/KC-10 (Figure 15) which have
52
PE I TAGE FUEL CAPACITYC- 5A
-100% ED [] E]
88%\\ \\\ \ \\
76%
64%
52%
40%
28%
indicates optimal fuel loads
16% 28% 40% 52% 64% 76% 88% 10UOI I I I I I i
PERCENTAGE FUEL CAPACITYKC-10A
Fig. 12. C-5A and KC-10A--Fuel Loads as Percentageof Fuel Capacity
53

PERCENAGE U CAPACITYC-141B
100%\
0 \ \\*\ \\ 0
88% % \ \
52%% \
\ \ \ \ N\ \ \ N.
1- 6%\ • \ \
\ \ \ \ \
iniae okina fue loads "
\\\ "\
28% 52% 6 7 8 1
Fig.~~E i3 -11 ndcae optimil-fuel Load sPretg
16428% 4% 2 64 76 88 100
of Fuel Capacity
54

PERCENTAGE FUEL CAPACITYC- 5A
100% L1 L[ILI N
88% N
I N,76% ' N "
64%
52%
40%
- -, indicates optimal fuel loads
16% 28% 40% 52% 64% 76% 88% 100I•I I I I i I I
PERCENTAGE FUEL CAPACITYKC-135
Fig. 14. C-5A and KC-135A--Fuel Loads as Percentageof Fuel Capacity
55
PERCENAGE FUEL CAPACIT
C-141B
100% \ \ \ \\'\ \\\ \ \ \ \
88%\ \ \
\ \ I\ -\ ' ' \I
76% \
\ \ \
64%
52% \ \\ \ \
40%
0 indicates optimal fuel loads
mI16% 28% 40% 52% 64% 76% 88% 100I
PER2-SAGE FUEL CAPACITYKC-10A
Fig. 15. C-141B and KC-10A--Fuel Loads as Percentageof Fuel Capacity
56

vastly different fuel consumptions, are -O.E and -2.6
respectively. Therefore, for the latter two combinations,
the C-5 and KC-10 utilize a smaller percentage of their
fuel capacity than the KC-135 or C-141B for the same total
amount of fuel.
The optimal fuel loads marked by a box on each
curve, corresponds to the two percentages whose sum is the
smallest of any two fuel load percentages on a curve.
* For example, the McGuire 70,000 pound line in Figure 12
has the optimal load at the point corresponding to a sum
of 112 percent for both aircraft while other points on the
graph increase up to 123 percent at the extreme end of the
curve.
The optimal airlifter fuel load did not always
occur at the minimtLm level. This is indicated by the
boxes on Figures 13 and 15. For these curves, the maximum
airlifter fuel load was optimal. However, because of the
differences in slopes for these combinations, the sum of
the percentages is still the minimum for all values along
the curve. This minimum sum criterion contradicts hypo-
thesis two. The relative efficiencies of the two aircraft
to carry the fuel to the rendezvous point, represented by
the slope of the curves in Figures 12 to 15, are the deter-
mining considerations for optimal takeoff fuel loads.
The main result of this research is the identifica-
tion of significant fuel savings which can be derived from
the use of the optimal rendezvous point anc takeoff fuel
57

loads. The exact savings depend on the 3cnario and air-
craft combination. Table 6 lists the average fuel savings
by aircraft combination for the optimal rendezvous point
and fuel loads compared to the point and fuel loads defined
by the two hypotheses.
TABLE 6
AVERAGE FUEL SAVINGS--OPTIMAL RENDEZVOUS POINTVERSUS HYPOTHESIZED RENDEZVOUS POINT
Average FuelAircraft Savings
Scenario Combination (lbs.)
East C-5/KC-0 25,200C-141B/KC-10 8,300C-5/KC-135 19,700C-141B/KC-135 6,300
West C-5/KC-10 39,400C-141B/KC-10 21,700C-5/KC-135 34,700C-141B/KC-135 10,300
Since the original two hypotheses were contra-
dicted by the research results, the hoped for general
optimal refueling policy was not derived. The results
were examined to see if any general hypotheses were sug-
gested.
The results are summarized below by describing the
effect of the principal factors on the determination of
the optimal rendezvous point and onload fuels. At the
maximum feasible cargo weights, the optimal rendezvous
point occurs on the feasible boundary closest to the
58

airlift takeoff base. For lesser cargo i eights, the
separation between the point and the coresponding feasible
boundary increases. Enroute tanker bases draw the loca-
tion of the optimal rendezvous point closer to the tanker
base than do inland bases. The inland bases will most
often result in the same optimal rendezvous point despite
vast differences in the tanker's flight distances. The
takeoff fuel loads for both aircraft are optimized by mini-
mizing the combined percentage of fuel capacity used by the
two aircraft. This sum is greatly dependent on the spe-
cific aircraft combination used.
Sensitivity Analysis
The sensitivity analysis systematically varied the
levels of selected input factors and was used to verify
the consistency of the results of the models for the entire
feasible range of the input variables. The analytic
results were collected for extreme values of airlifter and
tanker total flight distances, and cargo weights for each
aircraft combination. Sensitivity analysis of the SLAM
model was completed for the extreme values of ground
delays, wind factor, and increased in-flight cruise times.
The sensitivity of the results to the total dis-
tance flown by the airlifter was tested by generating
scenarios with different destinations. For the east
scenario CONUS bases, an airlifter destination at Cairo,
Egypt, represented the minimum distance examined. This
59
...... .....

reduced the Tehran flight distance by 570 :1I. The maximum
extreme distance examined used Kabal, Afghanistan, as a
destination, which increased the airlifter flight distances
by 510 NM. The Cairo data results were consistent with
the Tehran data except previously unfeasible cargo loads
became feasible. For example, 120,000 pounds cargo levels
for the C-5A and the 70,000 pounds cargo level for the
C-141B both became feasible. For the Kabal data, the
* 55,000 pounds cargo load for the C-141B became infeasible.
As a result, few airlifter fuel loads were feasible. The
rendezvous points were located closer to the airlifter des-
tination and the transfer fuel at this increased tanker
range was reduced by an average of 23,000 pounds. These
results are continuations of the trends established by the
main data and are consistent with the previous results.
A southwest scenario from Travis AFB, CA, to Clark
AB, Philippines, provided an example of enroute basing
using Hickam AFB, HI, as the tanker base. The rendezvous
point moved an average of 1203 NM from the great circle
route for all runs of this scenario. The use of Barksdale
AFB, LA, by the KC-10 resulted in the same rendezvous point
as Castle, though the extra 2500 NM route segment for the
tanker increased the total fuel used. Thus, these extreme
examples of enroute and deep inland tanker basing were con-
sistent with previous results in the determination of the
optimal rendezvous point.
60

The effects of cargo loads on the results of the
analytic model were consistent with the Tehran results for
all feasible values. For large cargo loads which pre-
cluded transferring sufficient fuel to complete the mission,
no feasible solution was possible. This occurred at 140,000
pounds for the C-5A and 70,000 pounds for the C-141B. For
small cargo loads, the allowable fuel load was sufficient
to conduct the mission without refueling. Between these
extremes, changes in the cargo load consistently produced
the previous results illustrated in Figures 7 to 10.
Therefore, the entire feasible ranges of the input param-
eters produced consistent results for all scenarios.
Extreme values of the factors indicate feasible boundaries
but do not change the trends or results.
Although the primary purpose of the SLAM model was
to validate the analytical model for operational suitabil-
ity, it was also used to conduct part of the sensitivity
analysis. The SLAM sensitivity analysis was conducted in
three major areas: (1) increases in ground delay times,
(2) increases in wind factors, and (3) increases in
cruise times.
The first variable investigated was the ground
delays. In the SLAM model, the delay was either zero, or
fifteen minutes. To determine the sensitivity of ground
delay time on the results, the delay was increased to
twenty-five minutes. Increased ground fuel consumption
resulted; for example, 800 pounds for the C-141B, 1200
61
V

pounds for the C-5, but this had no effect on the mission
completion rates for any of the aircraft or scenarios. A
larger increase in the ground delay time was not explored
because from the experience of the authors, an aircraft
commander would not run the engines for longer than twenty-
five minutes on the ground while waiting for maintenance
repairs or other types of services.
-, The second variable investigated was the wind
factor. The SLAM model was created with a normally dis-
tributed wind variant with a mean of 55 KNOTS and a standard
deviation of 10 KNOTS. The wind was first changed to a
mean of 55 KNOTS and standard deviation of 20 KNOTS. This
caused 43 percent of the missions to fail due to inadequate
fuel. When the wind standard deviation was increased to
30 KNOTS none of the missions flown &gainst a headwind
were successful. It is not surprising that the missions
failed when the wind standard deviation was increased to 20
KNOTS since that is a significant increase. Those missions
which failed, all flew the west scenario to Yokota, had a
headwind for most of the route. The effect of an increase
of 20 KNOTS on a C-141 which travels 3000 NM after the
rendezvous (this is representative of the rendezvous point
to destination distance for the west scenario) increased
the fuel consumption by 4400 pounds. A wind increase of
30 KNOTS increased the fuel consumption by 6400 pounds
which caused all C-141B missions to fail. In actual
flight operations large wind factor deviations are not
62

expected. Combining weather satellite data and pilot mis-
sion weather reports which are forwarded to Air Force
Global Weather Central, the current wind forecasts are very
accurate.
The third variable investigated was the increase in
unplanned cruise time for each aircraft. To examine these
delays, the cruise time was increased by fifteen minutes
for each aircraft. With the extra cruise time added, 83
percent of the C-5 missions were completed but for the
C-141 only 74 percent of the missions were completed. For
the KC-10, 100 percent of their missions were successful
but for the KC-135 only 83 percent of their missions suc-
ceeded. The low mission completion rates seem to indicate
that a fuel reserve is needed to make the mission comple-
tion rate acceptable. HQ MAC does have a fuel reserve
for aircraft flying on overwater routes. If these fuel
reserves are added to each aircraft's fuel load, the mis-
sion completion rates increase to 100 percent.
Since the original fuel load hypothesis has been
rejected and the optimal airlifter ramp fuel loads are most
often less than the maximum fuel allowable, adequate fuel
capacity remains for a fuel reserve. The reserve would com-
pensate for cruise delays, and should not change the trends.
The sensitivity analysis performed indicates that
variations in the parameters of the FLTPLN model used in
the specific scenarios of this research do not change the
basic results obtained.
63
VI. Conclusions and Recommendations
The conclusions of this research are presented as
they relate to the questions and hypotheses stated in
Chapter I. For a specific mission defined by the input
factors, one rendezvous point always resulted in less total
fuel consumption than any other point. This point results
* in a significant fuel savings compared to the suboptimal
points. However, the optimal point was not always located
at the maximum feasible range of the airlifter from its
destination as proposed by hypothesis one. The location
of the optimal rendezvous point can only be determined by
considering the interaction of the airlifter's total dis-
tance, cargo load and the location of the tanker base.
However, definite trends in the results emerged. As the
airlifter total distance to destination or cargo weight
was increased, or the tanker base was located farther
inland of the airlifter takeoff base, the optimal ren-
dezvous point was located incrementally closer to the maxi-
mum feasible range boundary. If airlifter di --e to des-
tination or cargo weight were reduced or '' ne nker base
was-located along the airlifter's route of flight, the
optimal rendezvous point was located farther from the
feasible boundary and closer to the tanker base.
64
KI

The second hypothesis is also rejected in favor of
a proposal to determine the takeoff fuel loads as they
relate to the percentage of the aircraft total fuel capaci-
ties. Adjusting the transfer fuel until the sum of the two
percentages of fuel capacities is the minimal sum for all
feasible fuel loads will result in the minimum total fuel
consumed by both aircraft. This minimum sum is dependent
on the aircraft combination. It typically occurred at the
minimum airlifter fuel loads when the KC-10A was used and
maximum airlifter fuel loads when the KC-135A was used.
The following recommendations are submitted as aV result of this research:
1. The planning of Strategic Airlift air-refueling
missions should incorporate the results of this research
when determining the rendezvous point and takeoff fuel
loads. Attempts at optimization of these factors will
result in significant fuel savings to the Air Force.
2. To aid in the optimization of specific airlift
missions, the concepts of the analytic flight planning model
used in this research should be expanded to include three
additional dimensions:
A. A real time weather data base,
B. Actual route segment flight planning to
replace the great circle route planning of the FLTPLN
model; and finally,
65

C. The inclusion of the possibility of multiple
air-refuelings of a single airlifter or of multiple air-
lifters by a single tanker.
The computer flight planning programs maintained
by AFGWC/DOY provides the best opportunity to consolidate
all of these dimensions into an operational air-refueling
flight planning model.
66

Bibliography
67

1. AFR 60-16, General Flight Rules, MAC Supplement One.Department the Air Force, HQ MAC, Scott AFB, Ill.,December 1977.
2. AFR 60-16, General Flight Rules. Department of theAir Force, HQ USAF, Washington, D.C., 15 July 1977.
3. Barrs, Thomas, Major, USAF. Telephone interview.HQ MAC/DOOM, Scott AFB, Ill., 15 August 1980.
4. Brown, Harold. Department of Defense Annual ReportFiscal Year 1980. U.S. Government Printing Office,Washington, D.C., 15 January 1979.
5. C-5 Aerial Refueling (Phase I, II, III), Directorate
of Operational Requirements, DCS/Operations, HQ MAC,Scott AFB, Ill., March 1975.
6. C-141 First Pilot/Aircraft Commander Self StudyGuide, HQ 443 MAW, Altus AFB, OK, October 1976.
7. C-141A and C-141B Flight Manual. T.O. C-141A/B-I,' 'U.S. Government Printing Office, Washington, D.C.,
27 March 1980.
-1%8. Carlton, Paul K. "The Israeli Airlift of 1973, Opera-tion Vittles Revisited," Policy for Commanders, Sup 2,February 1974.
9. Dickens, Charles W., Jr. "Airlift Heritage--TheIsraeli Airlift," Airlift Operations Review, October1979.
10. "Flight Information Publication (ENROUTE)," IFR,United States. U.S. Government Printing Office,Washington, D.C., 25 December 1980.
11. Hines, William W., and Douglas C. Montgomery. Proba-bility and Statistics in Engineering and ManagementScience. John V4iley & Sons, New York, 1972.
12. Jane's All the World's Aircraft, London, England,1975-1976.
13. Jones, David C. Military Posture. U.S. GovernmentPrinting Office, Washington, D.C., 25 January 1979.
14. Kowalsky, Robert, GS-14. Telephone interview.HQ MAC/XPSR, 6 January 1981.
68

15. "Lockheed's Galaxy, in the Mid-East " GovernmentExecutive, Vol. 16, April 1974.
16. Murphy, Michael, Lt Col, USAF. Personal interview.HQ MAC/XO, Scott AFB, Ill., 16 May 1980.
17. Pfeiffer, Edward, Lt Col, USAF. Telephone interview.56th MAS/DO, Altus AFB, OK, 11 December 1980.
18. Pritsker, A. Alan B., and Claude D. Pegden. Intro-duction to Simulation and SLAM. Halsted Press,New York, 1979.
19. Reeves, Matthew, USCE. Telephone interview. 2750thABW, WPAFB, Ohio, December 1980.
20. Shannon, Robert E. Systems Simulation, the Art andScience. Prentice-Hall, Inc., Englewood Cliffs, NJ,1975.
21. "Twenty-Four C-141's Stretching," Air Force Times,December 17, 1979.
22. Walker, Joseph, Lt Col, USAF. Personal interview.HQ USAF/SAGM, Washington, D.C., November 1980 toJanuary 1981.
23. Webb, Paul, Lt Col, USAF. Telephone interview.HQ SAC/D08A, Offutt AFB, NE, 20 May 1980.

Appendix A
Manual Fuel Consumption Computation of a Typical
Airlift Mission Profile Using the C-141B
Performance Manual
70

This appendix contains a typical fuel planning cal-
culation for a C-141B mission. Output from these calcula-
tions will be compared to the model outputs. (All per-
formance figures are from the C-141B performance manual,
Change 16, 24 Aug 1979.)
The mission will be from McGuire AFB, NJ, to Tehran,
Iran. The tanker will be a KC-135 departing and returning
from and to McGuire. The following steps are used to calcu-
late fuel requirements:
1. INITIAL CONDITIONS (C-141B): (obtained fromFLTPLN)
RAMP GROSS WEIGHT - 325,000 lbs.
McGuire to rendezvous entry point DISTANCE -
1350 NM.
Rendezvous track = 250 NM.
Rendezvous exit point to destination DISTANCE -
1810 NM.
TRANSFER FUEL - 53,000 lbs. (JP-4).
WIND FACTOR - 55 KNOTS.
2. FUEL CONSUMPTION CALCULATIONS:
The following section calculates mission fuel
consumption for the initial conditions in (1). Fuel con-
sumption calculations consist of seven areas:
A. START, TAXI, AND TAKEOFF FUEL - 1900 lbs.
B. INITIAL CLIMB FUEL:
(1) INITIAL PARAMETERS: TAKEOFF GROSSWEIGHT (GW) =
71

RAMP GW - TAKEOFF FUEL =
325,000 - 1900 = 323,100 lbs.
CLIMB ALTITUDE = 33,000 ft.
(2) FROM T.O. C-141B 1-1 Chapter 4:
CLIMB FUEL = 9050 lbs.
CLIMB DISTANCE = 144 lbs.
C. CRUISE FUEL:
(1) DISTANCE from level off to rendezvous point=
1350 - 144 = 1206 NM.
(2) Fuel flow at cruise altitude for a constant
MACH (0.74) is a function of Gross Weight and Temperature
Deviation from a Standard Day and is given in air nautical
miles (ANM) per 1000 lbs. fuel.
(3) CRUISE GW = TAKEOFF GW - CLIMB FUEL323,100 - 9,050 = 314,050 lbs.
(4) TRUE AIRSPEED (TAS) AT 33,000 ft. (.74)MACH = 431 KNOTS
GROUND SPEED (GS) = TAS + WIND FACTOR431 + 55 = 486 :-NOTS
ANM = DISTANCE * TAS/GS = 1026 NM * 486 KNOTS/
431 KNOTS = 1081 ANM
(5) FUEL CONSUMPTION RATE = 27 ANM/1000 lbs.fuel
FUEL CONSUMPTION = 1081 ANM/27 ANM/1000 lbs.fuel = 40,000 lbs.
D. REFUELING TRACK FUEL CONSUMPTION
(1) TRACK DISTANCE = 250 NM
(2) ENTRY GW = CRUISE GW - CRUISE FUEL= 314,050 - 40,000 = 274,050 lbs.
(3) AIRSPEED = .75 MACH @ 25,000 ft. altitude.
72
.4.

(4) FUEL CONSUMPTION RATE = 2%n ibs./minute
(5) REFUELING TIME = DISTANCE/AIRSPEED
TAS @ 25,000 ft. = 453 KNOTS
GROUNDSPEED TAS + WIND FACTOR =453 + 55 508 KNOTS
TIME = DISTANCE/GROUNDSPEED
TIME = 250 NM * 60/508 KNOTS 29.5 min.
FUEL CONSUMPTION 29.5 min. , 260 lbs./min =7680 lbs.
E. POST-RENDEZVOUS CLIMB TO ALTITUDE
(1) INITIAL CLIMB GW ENTRY GW - TRACK FUEL *
TRANSFER FUEL274,050 + 53,000 - 7680 = 319,370 lbs.
(2) CLIMB ALTITUDE = 29,000 ft.
(3) From the C-141B performance manual:
CLIMB DISTANCE = 27 N11
CLIMB FUEL = 1400 lbs.
F. CRUISE TO DESTINATION FUEL
(1) CRUISE GW = CLIMB GW - CLIMB FUEL
= 319,370 - 1400 = 317,970 lbs.
(2) CRUISE DISTANCE = RENDEZVOUS EXIT TODESTINATION
DISTANCE - CLIMB DISTANCE = 3810 - 27 -
3783 NM.
(3) AT 29,000 ft. TAS = 438 KNOTS
GS = 438 + 55 = 493 KNOTS
(4) ANM = 3783 * 438 / 493 = 3361 ANM
(5) FUEL CONSUMPTION RATE = 29 NM/1000 lbs.fuel
(6) FUEL CONSUMPTION = ANM/RATE = 3361 ANM/29 ANM/1000 lbs. 115,900 lbs.
73
G. APPROACH AND LANDING FUEL IS 2500 lbs.
The total planned fuel consumption from McGuire AFB
to Tehran, Iran is:
G(FUEL CONSUMPTION)i = 175,900 lbs.
i=A
7I
, 74

Appendix B
Aircraft Ground Delay Data
75

The aircraft ground delays in the SLAM Simulation
Model were based on the data shown below. The data was
obtained from various CONUS Air Force bases for the follow-
ing aircraft:
AIRCRAFT: KC-135PERIOD: 30 DAYS
INSTALLATION: MARCH AFB, CATOTAL TAKEOFFS: 93
DELAYED TAKEOFFS: 12
LENGTH OF DELAY LENGTH OF DELAYDELAY #(MIN) DELAY # (MIN)j
1 21 7 19
2 19 8 77
3 227 9 210
4 6 10 48
5 34 11 74
6 236 12 1
76

AIRCRAFT: KC-135PERIOD: 30 DAYS
INSTALLATION: PLATTSBERG AFB, NYTOTAL TAKEOFFS: 101
DELAYED TAKEOFFS: 47
LENGTH OF DELAY LENGTH OF DELAYDELAY it(MIN) DELAY # (MIN)
1 26 25 12
.42 179 26 96
3 39 27 23
4 11 28 20
5 13 29 70
6 12 30 57
7 151 31 22
8 12 32 21
9 135 33 21
10 132 34 19
11 45 35 28
12 53 36 19
13 14 37 14
14 25 38 153
15 26 39 137
16 26 40 73
17 64 41 70
18 32 42 16
19 34 43 37
20 76 44 20
421 20 45 27
22 13 46 20
=23 24 47 19
24 62
77
AIRCRAFT: C-141PERIOD: 30 DAYS
INSTALLATION: NORTON AFB, CATOTAL TAKEOFFS: 156
DELAYED TAKEOFFS: 25
LENGTH OF DELAY LENGTH OF DELAYDELAY #(MIN) DELAY # (MIN)
1 72 14 152
2 122 15 99
3 150 16 134
4 25 17 87
5 78 18 41
6 22 19 117
7 85 20 61
8 27 21 25
9 177 22 16
10 42 23 66
11 29 24 42
12 90 25 56
13 42
78

AIRCRAFT: C-5PERIOD: 60 DAYS
INSTALLATION: DOVER, DETOTAL TAKEOFFS: 143DELAYED TAKEOFFS: 25
LENGTH OF DELAY LENGTH OF DELAYDELAY # (MIN) DELAY # (MIN)
1 31 14 90
2 28 15 121
3 72 16 1152
4 30 17 243
5 35 18 44
6 37 19 36
7 29 20 162
8 187 21 1578
9 48 22 119
10 67 23 24
11 34 24 146
12 98 25 218
13 104
79

Appendix C
FLTPLN Computer Code
80

C THIS IS THE MASTER FLIG4T PLANNIN; PROGRAMC
PROGRAM FLTPLN (INPUTtOUTPUT)C
DIMENSION WOW)~DIMENSION LA~lLN( "~7fR()CRO6DIMENSIONLE( ,lLl),ESL 1 LNI0DIMENSION MACH(4MXCWT(4)?MFEL 4)piF WTiURFF4)
* DIMENSION RML(7)b R ,ACH(Z)t STT0FI4),KR(10)vLLll~)REAL LAILONCiNRNMXCWTMXFUELiLECPIACHINTEGER ACP TKDATA PlDORD31'5'64'7.L'791.143~ZZDATA MACH /X77 .741 .9b, .221DATA RMACHI .62v .74 /DATA RFF /.451 .261 .271 .'L5/DATAMXTIl5,Z.,9.,7/DATA MIFUEL1315.l, 151.451 1,45,4t 163.0/DATA OPUTI 354.Ot 141.6t Z25.47 195.0/DATA STIOF/Z.Gi 1.91 3.01 '1gDATA CARGOIO6.i85.,7O.,70O.t55.,40.I
CC FUNCTION STATEMENT TO CONVERT RADIANS TO DEGREES
DRADICOORI (N(CO~CO-N(OR~~6/EC FUNCTION STATEMENT TO CONVERT DEGREES TO RADIANS
RDECWXNLE = ' ' '&VGL-T LE))C CROUND SPEED CALCULATION FROM TRUE AIRSPEED AND WIND
GS(SPDrALTtTC) : ASP(SPDALT)'COS,(ASINl(W'SIN.(WD- C)t ITASP(SPDPALT)))-WV*COS(WD-TC)
CC SCENARIO INPUT DATA IN DEGREES. MINUTES TENTHS
PRINTft" EAST SCENARIO f I"PRINTi," TANKER BASE I I"ELEVI 0.LAT(l) 38.216LONCII): 121.57LATIZ) 35.'L7LONG(Z) :-139.126LAT(3) =61.131LONG(31: 149.5315LAT(4) = 64.37b
4 LONC(41= 147.01ELEVZ , 0.0
* C CONVERT LAT/L'~ DEGREES TO RADIANSDO Wie Itl 4PRL(I? WfDILATI))HM(I)= DRADfLONG1I))
if CONTINUE
8 1
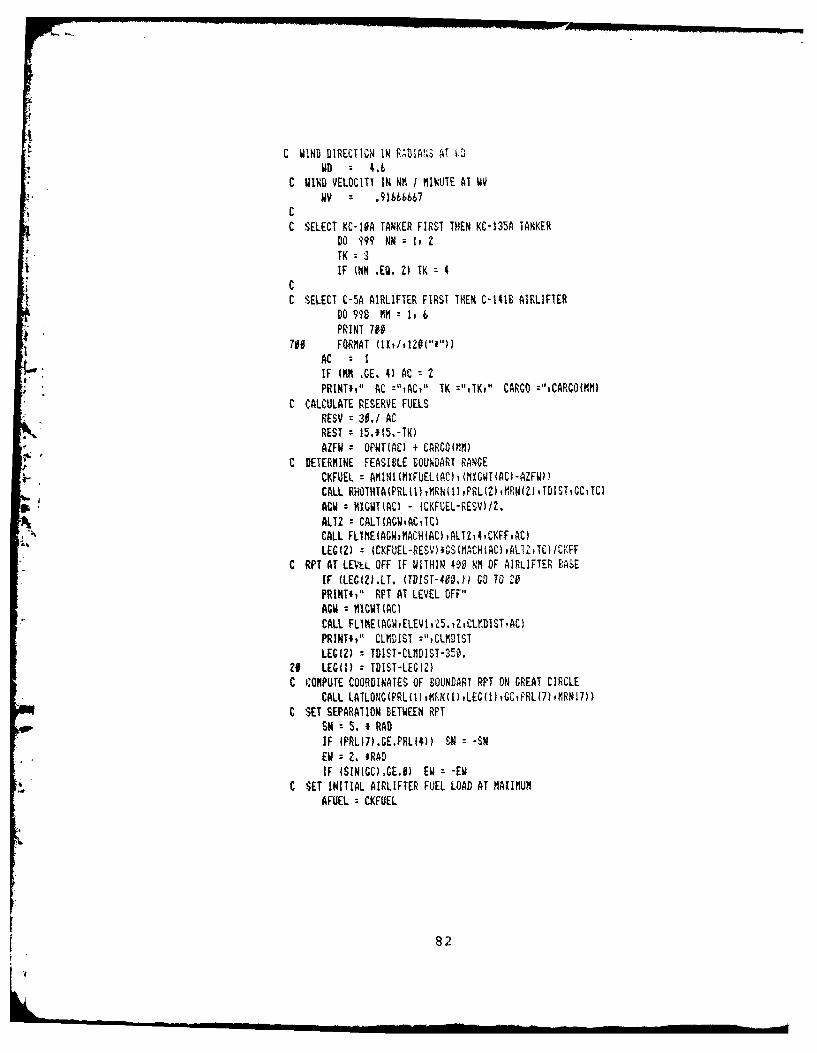
C WIND DIRECT IOR IN RDIPJ'L ATU 1,3
CSELECT XC-I#A TANKER FIRST THEN KC-135A TANKERDO 1?9q NN =1, 2TK : 3IF (NN .EQ. Z) TK = 4
CC SELECT C-JA AIRLIFTER FIRST THEN C-141D AIRLIFTER
Do 9'15 MM~ : 11 6PRINT 701
AC =:1IF INK GCE. 4) AC : 2PRINT'," AC :"iAC," TK :"tTKt" CARGO :"iCARCO(MMI
C CALCULATE RESERVE FUELSRESV 30,/ ACRESTz 5 15-HAZFW r OPWTIAC) + CARCOU(fl)
C DETERMINE FEASIBLE BOUNDARY RANGECKFUEL = AMIN1(MXFUEL(AC~i (MXCWT(AC)-AZFW))CALL RHOTHTAtPRL(IiKdRN(1),PRL(2)drRN(2htTDISTvGCTC)ACM MXGUT(AC) - ICKFUEL-RESV)I2L.
ALT2 CALT(AGWvACtTC)CALL FLYNEIAGWMACHCAC) ,ALT2,4,C KFFAC)LEGIZI = (CKFUEL-RESV)*'GSIM'ACHCAC) ,AL1TZTC) /CKrFF
C RPT AT LEVLL OFF IF WITHIN 490 NM OF AIRLIFTER BASEIF (LEG1ILLT. (TDIST-4000U GO2 T0 'aPRINT'1' RPT AT LEVEL OFF"AGO = NIIGUT(AC)CALL FLINE(AGUELEVIZL5.?'ZiCLrDISTtAC)PRINTI,'" CLPIDIST ="I CLMD ISTLEG(2) :TDIST-CLMDIST-350.
Z# LEC(I) TDIST-LECC2.)C COMPUTE COORDINATES OF BOUNDARI RPT ON GREAT CIRCLE
CALL LATLON4G(PRL(I),t1EN(I),LEG(I)fCRLf7)tMRN17))C SET SEPARATION BETWEEN RPT
SN t . * RADIF IPRL17).GE.PRL14)) SN = -SNEW : 2. #RADIF (SINIGC).CE.0) EU = -EO
C SET INITIAL AIRLIFTER FUEL LOAD AT MAXIMUMAFUEL :CKFUEL
82

AD-AL01 137 AIR FORCE INST OF TECH WRIGHT-PATTERSON AFB OH SCHOC-CYC F/G 1/2OPTIMIZATION OF STRATEGIC AIRLIFT IN-FLIGHT REFUELING. (U)MAR 81 V PBOMOELON. .JC ARCOTTE
I-Ehhhhmhmsm-EEmhEEEEEEE
I-EohEohmhhEE

C DEVELOP MATRICES FOR It AIRLIFTER FUEL LC ,D.DO to# In I I tPRLI5) PRL(7)MRN15) NRNI7)FUELIIIN(INI :177.777
AGWT :AMINI(AZFU4AFUEbMXGWT(AC))AFL :-CALT(AGUToACTC)
C COMPUTE CLIM B VALUES FOR CURRENT AIRLIFTER FUEL LOADCALL FLIlE(AGWTiELEVlyAFLbhCLMTtAC)CALL FLlME(ACWTiELEV1,AFLp2iCLMDoAC)CALL FLTflE(A0WTiELEV1,AFLv3tCLMFpAC)
CC GENERATE 5 1 13 MATRIX OF RPT
DO 80 L:1,l3DO 70 K:1,5
C COMPUTE ROUTE SEGMENT DISTANCES150 CALL RHOTHTA(PRL(1),KRN(1bPRL(5),MRN15),LEC(1btCCRNL(1))
CALL LATLONC(PRL(5),HIRN(5),250.,(CC-PIhPRL(6)NRN(.))CALL RI4OTHTA(PRL(5) ,MRN(5) ,PRL(2L) MRN(2') LEG(Z) iCCiRMLt2))CALL RHOTHTA(PRL(6),NRNt6)bPRL3)MRNI),LEG3)GCRL(3)CALL RIO)THTA(PRL(4)t,NI4)PRL(t.),MRN16)hLEG(4)CRL(4))CALL RiO)THTA(PRL(5)diRN(5),PRL(4),MRN14)LEG5)CCR L(5))FEASBLU(tL) :777.777
CC 4IRLIFTER POST RENDEZVOUS TO DESTINATION
FAY :120.1 ACAGM = AINI (AZFW4RES V42.FAVdIXGUT (AC))
DO 0 JJ : tv3CLD 9.0CLF 0.0AFL CALl(ACI~iACiRML(2))IF (AFL .EQ. 25.) CO TO 25CALL FLTME(ACWt25.,AFL,2pCLDiAC)CALL FLYhE(AGWi25.vAFL,3yCLFiAC)CLD :CLDIGS(MACHIAC),AFL1RML(2))/TASP(MACH(AC) jAFL)
25 AGU AIIINI(AZFU+RESV+FAV.MXGWT(AC))CALL FLIhE(AGiACH(AC) ,AFLt4,AFFAC)FUEL(2):(LEG(2)-CLD)iAFF/GSIHACH(AC) ,AFLRML(2))AGW AMINI (AZFW4FUEL(2)4CLF4RESVNXCWT (AC))FAY =FUEL(2) / 2.
39 CONTINUEAFL2 :AFLFUEL(21 FUEL(2) + CLF
IF IFUEL(Z) .GT. (CKFUEL-RESV)) GO TO 69
83
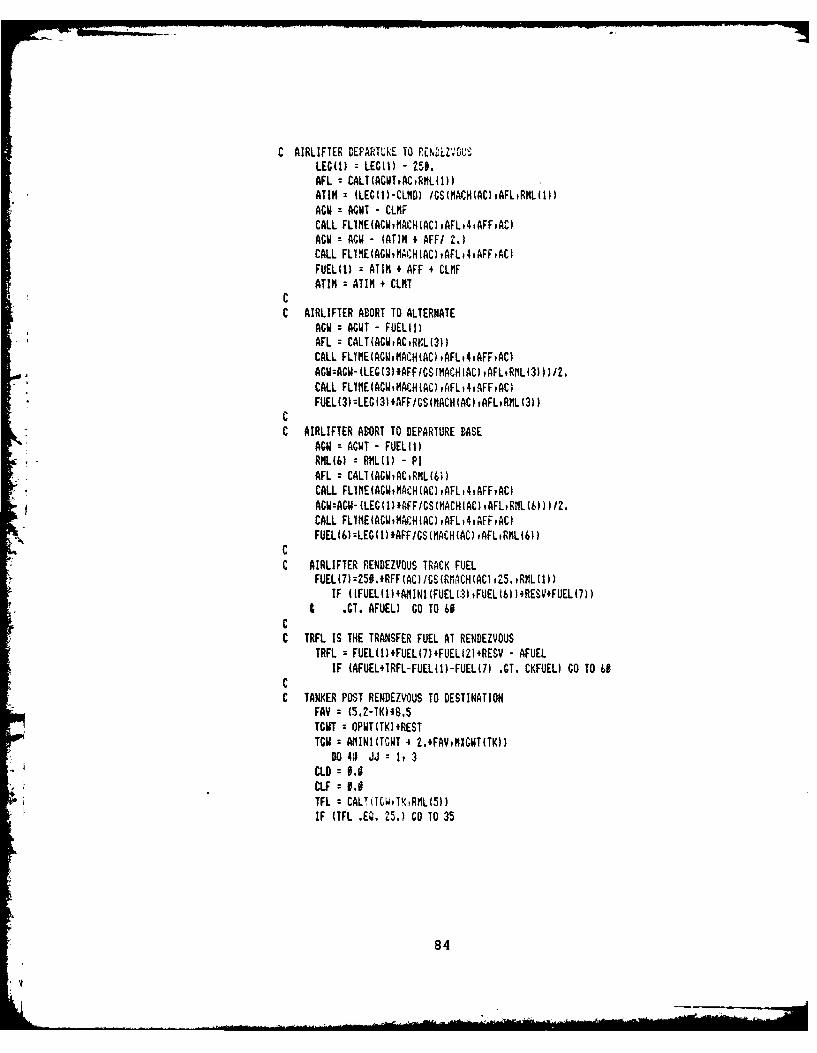
C AIRLIFTER DEPARTURE TO R~huDLtO.,LEGM : LEGMI - 251.AFL :CALTIACTtAt L(1))ATIM =ILEC(1-CLMD) IGS(IACH(ACbtAFLtRML(1))AGO ACWT - CLMFCALL FLIhE(ACU.MACH(AC)hAFL4,AFFAC)AGO AGO - (ATIM * AFF/ 2.)CALL FLIME(ACUI1ACH(AC),AFL.4,AFFAC)FUELM = ATIM 4 AFF * CLMFATIM ATIN + CIMT
CC AIRLIFTER ABORT TO ALTERNATE
AGO AGUT - FUEL1))* AFL =CALT(AGWPACtRKL(3))
CALL FLYME(ACdiMACH(AC) ,AFL,4,AFFPAC)AGU=ACR- (LEC(3)IAFF/GS(HACHIAC) ,AFLRMLI3) ))I2.
* CALL FLIME(ACiPACH(AC),AFL,4,AFFtAC)FUEL(3):LEG(3)IAFF/S(IACH(AC) ,AFL#RIIL(3))
CC AIRLIFTER ABORT TO DEPARTURE BASE
AGO AGUT - FUELM)RML(b) =RML(1) - PIAFLI CALT(AGWvACtRML(b!)CALL FLYNE(ACWtHACH(AC) ,AFL14tAFFiAC)ACU=ACU- (LEG(1)IAFF/GS(?IACHIAC) ,AFLiRIIL(6) I 11.CALL FLYIE(ACWiMACH(AC) ,AFL,4,AFFAC)FUEL(6):LEG(1)IAFFIGS(MACH(AC) vAFLiRflL(6))
CC AIRLIFTER RENDEZVOUS TRACK FUEL
FUELI7)=250.*RFF(AC)/GS(RMit'CH(AC) ,ZS.,RIIL(1))IF (IFUEL(1)4AINII(FUEL(3hFUEL(6114RESVFUEL(7))
I .CT. AFUEL) GO TO 60CC TRFI IS THE TRANSFER FUEL AT RENDEZVOUS
TRFL :FUEL(1)4FUEL(7).FUELIZ).RESV - AFUELIF (AFUEL+TRFL-FUEL(t)-FUEL(7) GCT, CKFUEL) GO TO 61
CC TANKER POST RENDEZVOUS TO DESTINATION
FAY =(5.2-TK)MSTCIIT OPWT(TK)iRESTTGC A( INI(TCWT 4 2.*FAY,NXGWT(TK))
DO 43 JJ 1,It3CLD 0.0iLF :0.0TFL :CALT(TCWtTiRML(5))IF (TFL .EQ. 25.) GO TO 35
84

CALL FL~hE(1GUtl.5.ilFLvZpCLDiTK)CALL FLYt1EtTCU~25.iFLt3iCLFtTK)CID : CLD*CS(NACHITK)tTFLRflL(5))/TAS.P(MACHfTKhiTFL)
35 TCU AIIINI(TCUT 4 FAVo tiICUT(TVK))CALL FLIME(TGUMACH(TKhtTFL,4,TFFTKIFUEL(5k: (LEG(5)-CLD)ITFF/GSIKACH(TK) ,TFLR?4L15PTGU:AMINI (TCWT4FVEL(5)+CLF, flICWT(TK))FAY :FUEL(5) /Z.
41 CONTINUEFUEL(5) =FUEL(5) 4CLF
CC TANKER RENDEZVOUS TRACK FUEL
FUEL(8) :250.IRFF (1K) /G(RflACH(AC) ,25. tRNL(1))TGW = AMINI(TGW+FUEL(8)i MXCWT(TK))CALL FL~IE(TCNiMACH(TKb2l5.15,WAITF.TK)FUEL(81 FUEL(S) 4 15.* IJAITF
CC TANKER DEPARTURE TO RENDEZVOUS
FAY : (6,3-TK)f5.4TGWT = OPhT(TK)4REST4FUEL(5(4TRFL4FUEL(8)T =AMII(TCUT42.IFAVi P1:GWT(TK))
* DO 5O JJ =:1t3TFL =CALT(TGWYTKiRML(4))
* CALL FLIIE(TGUELEVbIFLilvCLTvTK)CALL FLlflE(TGWtELEV~tTFLv2iCLDiTK)CALL FLYME(TGWvELEV'4tTFL:3vCLFtTK)TGU = ANINI(TGUT4FAVi MXCWTITK))CALL FLIhE(TGUMACH(TK)iTFLt4tTFFt~1F)TTIM = ILEG(4)-CLD)/CS(MACH(TK)ITFLR L(4))FUEL(4) = TTIN * 1FFTCU: APIINI(TGWT + FUEL(41 4 CLF, MXGWHITK))FAY = FIUEL() 1 2.
SO CONTINUEFUEL(41 = FUEL(4) + CLFTGUT = 7GNT + FUEL(41
IF (TGUT .GT. MXCUT(TK)) GO TO 69CC COMPUTE TANKER TAKE OFF FUEL LOAD AT TFUEL
TFUEL :FUEL(4)4TRFL4FUEL(8)4FUEL(5)4RESTIF (TFUEL .GT. MXFUEL(TK)) GO TO 60
CC STORE TOTAL. FUEL CONSUMlPTION IN FFASEL M1ATRIX
FEASBLP(KL): FUELI)+FLEL('L)4FUjEL(7)& 4FUEL(414FUEL(5)4FUEL(8)
85

C SELECT MIIWNt VALUE AND SAVE PA70;E1RS
IF (FUELKIN(INI MNE. FEASBICK#L)) GO TO 66NKII)I) XLL(I1) L00 55 1 It 511l) :LEG(I)11(145) =RML;U)1111410) --FUELII)11(14151 zFUEL11451
55 CONTINUEUt(Zl) =AFUEL 4 STTOF(AC)110Z) :TFUEL 4 STTOF(TKIIX(23) zTRFL11(24) zAFLZ1102) 111124) ITIM + 15. - ATIMIF (11(26)) 561 581 58
56 l1(25) z-11(20)11(26) =6
58 11021= PRL(6)11(28) NRN(6)
CC INCREMENT LATITUDE COLUMN69 PRIS) zPRL(53 4 SN70 CONTINUEC INCREMENT LONGITUDE AFTER FIFTH LATITUDE
PRL(5) zPRL(7)MRM(51 MRN15) + EV
Of CONTINUEIF (FUELMINCIM) .EQ. 777.7771 GO O 10
CC PRINT MATRIX VALUES AND OUTPUT FOR MINIMUM RPT
DO 9#0 X --It 5PRINT 8911 (FE4SBL(XtLbtL:t,13)
sit FORMAT (lXvl3(21,F7.31)909 CONTINUE
LAT16) RDEG(KK(Z7l4DEGILONC(61 RDEGlXXl28)lDEG)PRINT.," ",IMFUELMlN(IhtbKX(IM,LL(I)tt RPT ENTRY z"iLAT(6hiLOM0(6)PRINT4," LEGS :,X1)II5PRINT.," TRUE COURSES "((I,:10PRINTff" FUELS "X()JI,8ACIIT : P9T(AC)4CARGO(NM14XI(21)
8 6

U AFLZ :,12)"ATOT :,IUTCUT :OPUT(TK) 4 11(221PRINT*#0 TFUEL :11,11(221,1 IGUT :"iTCWTp9 It TRFL :"vXI(23b" TTOT :"tII(251
C DECREMENT AIRLIFTER TAKEOFF FUEL LOAD100 AFUEL =AFUEL - 29.C SELECT OPTIMAL RPT FROM MINIMUM VALUES
FUELIM :FUELMINII)DO 301 M : b 10FUELIM :AMIN1IFUELIMiFUELMIN(M))IF (FUELIM .NE. FUELMIN(M)) CO TO 300In
309 CONTINUEIF (FUELIM .NE. 777.777) GO TO 400PRINTI." NO FEASABLE SOLUTION"GO TO 998
409 PRINT 70#
LAT(71 RDECIPRL17)#OEG)LONC(7)= RDEC(MRN(7)*DEG)PRINT.," POINT ONE :"iLAT(7[,LONG(7)PRINT 700
998 CONTINUE999 CONTINUE
STOPEND
87

c
SUBROUTINE RN0THTAfPIP1PNiPi'tPMiR.TNETAiRlLIC COMPUTES "REAT CIRCLE DISTANCE AND COURSE
OD: .5079630'IF (PI GCT. GD) PI QIF (PZ GCT. GDI PA.:Q
RHO:D.3437.74617TI4ETA:-ACOS( (Slfl(P2) -SIN(PI )4L^OS D))I/SI)U') /COS (P1))
IF(SIN(PZM-PIM) ,GE.#) TKETA: 6.Zt531520-TPETARK = A1AN((P1N-PZN)I(ALOG(TANI,0.78539816354PZIZ))
*C-ALOC(TAN9.76539816354PI/2W??IF(RflL.LT.1) RL:3.141592654+PjL
IFRETUN PMPM.GE.0) RML:3.14159Z65t4RML
ENDC
SUBROUTINE LATLONG(P1,PIHtRHOTHETAP2.PZN)C COMPUTES LATILONG GIVEN DIST AND COURSE FROM POINT
R RHO I 3437.74677Pt ASlt((SIN(PI) 4COS(R) + COSIPI)
t SI)RR 4 COS(THETAllD ACOsl(COs(R)-slN(PI)fSlklPZ))9ICOS(PI)ICOS(PZ))
IF ISJNITHETA) CE. 0.) D :-DpmzPINl f D
IF (PZM.GT.I. .AND. SIN(P2L'.Ll.l,)P:Pl-.B53IIF (PZII.Ll.B. .AND. SIN(P21).GT.6.1 PZM6.S3IW5234PZlRETURNEND
8 8

Appendix D
SLAM Description
89
SLAM (Simulation Language for Alternative Modeling)
is a new FORTRAN-based simulation language which allows
simulation models to be created in three world views:
1. Network
2. Discrete
3. Continuous
A SLAM model consists of a set of interconnected
symbols that describe the operation under study. SLAM pro-
vides network symbols (see Figures D-Ito D-10) which can be
used to build models and which can be translated into input
statements for computer processing. SLAM symbols and input
statements used for the SLAM Flight Simulation Model
described in Chapter IV are explained here. The following
symbols, statement formats, and definitions are taken from
Introduction to Simulation and SLAM by A. Alan B. Pritsker
and Claude D. Pegden (1979), pp. 435-551.
Network Element Figure
1. ASSIGN NODE D-1
2. CREATE NODE D-2
3. ENTER NODE D-3
4. EVENT NODE D-4
5. GOON NODE D-5
6. MATCH NODE D-6
7. QUEUE NODE D-7
8. TERMINATE NODE D-8
9. REGULAR ACTIVITY D-9
10. SEVICE ACTIVITY D-10
90
. .

NODE TYPE: ASSIGN
FUNCTION: The ASSIGN node is used to assign values
to SLAM variables (VAR) at each arrival
of an entity to the node. A maximum of M
emanating activities are initiated.
INPUT FORMAT: ASSIGN, VAR=value, VAR=value,...,M;
SPECIFICATIONS: ENTRY OPTIONS
VAR ATRIB(INDEX),XX(INDEX),II, whereINDEX is a positive integer orthe SLAM variable II.
value an expression containing con-stants, SLAM variables, or SLAMrandom variables.
M positive integer.
SYMBOL:
[ARVAL01 M
Fig. D-1. ASSIGN Node Description Summary
91

NODE TYPE: CREATE
FUNCTION: The CREATE node is used to generate
entities within the network. The node is
released initially at time TF and there-
after according to the specified time
between creations, TBC, up to a maximum
of MC releases. At each release a maximum
of M emanating activities are initiated.
INPUT FORMAT: CREATE,TBC,TF,MA,MC,M;
SPECIFICATIONS: ENTRY OPTIONS
TBC constant, SLAM variable, orSLAM random variable.
TF constant.
MA positive integer.
MC positive integer.
M positive integer.
SYMBOL:
Fig. D-2. CREATE Node Description Summary
92

NODE TYPE: ENTER
FUNCTION: The ENTER node is provided to permit the
user to enter an entity into the network
from a user-written event routine. The
node is released at each entity arrival
and at each user call to subroutine
ENTER(NUM). A maximum of M emanating
activities are initiated at each release.
INPUT FORMAT: ENTER, NUM,M;
SPECIFICATIONS: ENTRY OPTIONS
NUM positive integer.
M positive integer.
SYMBOL:
Fig. D-3. ENTER Node Description Summary
93
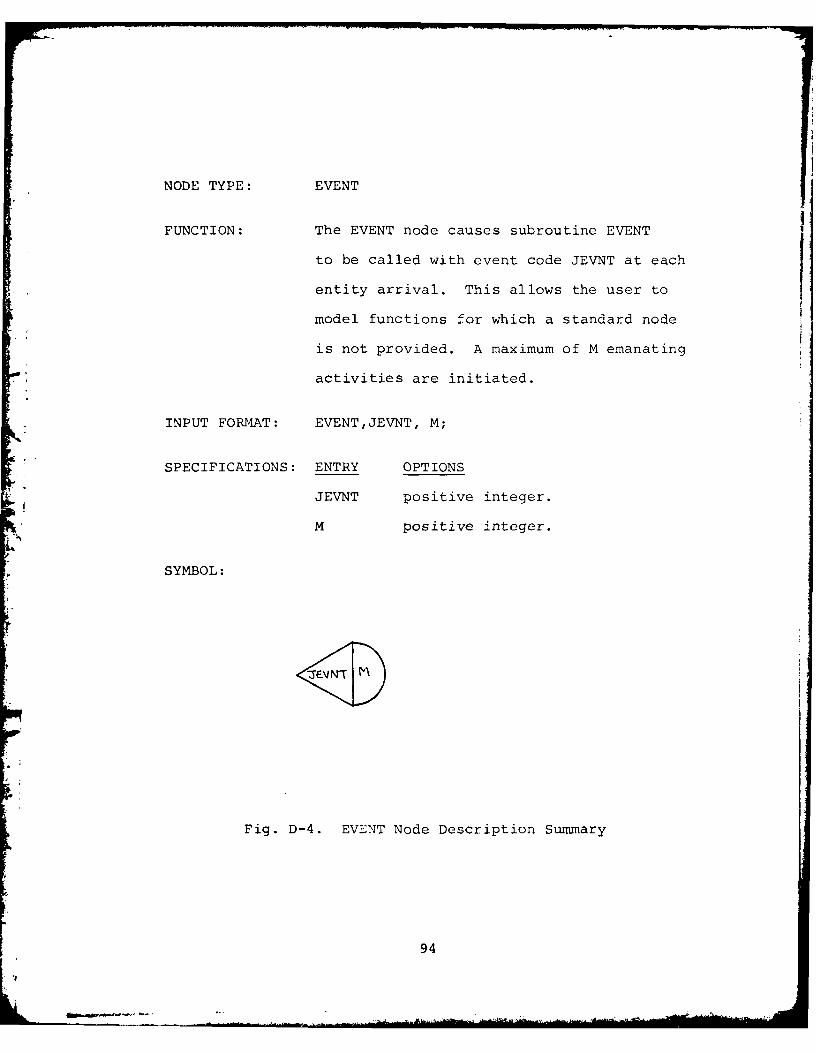
NODE TYPE: EVENT
FUNCTION: The EVENT node causes subroutine EVENT
to be called with event code JEVNT at each
entity arrival. This allows the user to
model functions for which a standard node
is not provided. A maximum of M emanating
activities are initiated.
INPUT FORMAT: EVENT,JEVNT, M;
SPECIFICATIONS: ENTRY OPTIONS
JEVNT positive integer.
M positive integer.
SYMBOL:
Fig. D-4. EVENT Node Description Summary
94
L. A k

NODE TYPE: GOON
FUNCTION: The GOON node provides a continuation
node where every entering entity passes
directly through the node.
INPUT FORMAT: GOON,M;
SYMBOL:V@
Fig. D-5. GOON Node Description Summary
95

NODE TYPE: MATCH
FUNCTION: The MATCH node is used to delay the move-
ment of entities by keeping them in QUEUE
nodes (QLBLs) until entities with the
same value of attribute NATR are resident
in every QUEUE node preceding the MATCH
node. When a match occurs, each entity
is routed to a route node NLBL that corres-
ponds to QLBL.
INPUT FORMAT: MATCH,NATR,QLBL/NLBL,QLBL/NLBL,...;
SPECIFICATIONS: ENTRY OPTIONS
NATR positive.
QLBL a queue node label.
NLBL a node label for any type ofnode.
SYMBOL:
Fig. D-6. MATCH Node Description Summary
96

NODE TYPE: QUEUE
FUNCTION: The QUEUE node is used to delay entities
in the IFL until a server becomes avail-
able. The QUEUE node initially contains
IQ entities and has a capacity of QC
entities.
INPUT FORMAT: QUEUE(IFL),IQ,QC,BLOCK;
SPECIFICATIONS: ENTRY OPTIONS
IFL integer between 1 and MFIL.
IQ non-negative integer.
QC integer greater than or equalto IQ.
SLBLS the labels of MATCH nodesseparated by commas.
SYMBOL:
FUeo
Fig. D-7. QUEUE Node Description Summary
97

NODE TYPE: TERMINATE
FUNCTION: The TERMINATE node is used to destroy
entities and/or terminate the simulation.
All incoming entities to a TERMINATE
node are destroyed. The arrival of the
TCth entity causes a simulation run to
be terminated.
INPUT FORMAT: TERMINATE,TC;
SPECIFICATIONS: ENTRY OPTIONS
TC positive integer.
SYMBOL:
Fig. D-8. TERMINATE Node Description Summary
98

ACTIVITY TYPE: REGULAR
FUNCTION: A REGULAR activity is any activity
enamating from a node other thai, a QUEUE
node. The REGULAR activity is used to
delay entities by a specified duration,
perform conditional/probabilistic testing,
and to route entities to non-sequential
nodes.
INPUT FORMAT: ACTIVITY/A,duration, PROB or COND,NLBL;
SPECIFICATIONS: ENTRY OPTIONS
A positive integer.
duration constant, SLAM variable, SLAMrandom variable.
PROB or probability: constant between 0and 1.
COND condition: value .OPERATOR.value where value is a constant,SLAM variable, or SLAM randomvariable and OPERATOR is LT, LE,EQ, GE, GT, OR NE.
NLBL the label of a labeled nodewhich is at the end of theactivity.
SYMBOL:
Fig. D-9. REGULAR Activity Description Summary
99

ACTIVITY TYPE: SERVICE
FUNCTION: The SERVICE activity is any activity
emanating from a QUEUE node. The service
activity is used in conjunction with the
QUEUE node.
INPUT FORMAT: ACTIVITY(N)/A,duration,PROB,NLBL;
SPECIFICATIONS: ENTRY OPTIONS
k N positive integer.
A positive integer between 1and 50.
duration constant, SLAM variable,SLAM random variable.
probability constant between 0 and 1.
NLBL label of a labeled node.
SYMBOL:
Fig. D-10. SERVICE Activity Description Summary
100

Appendix E
SLAM Computer Code
.1
101
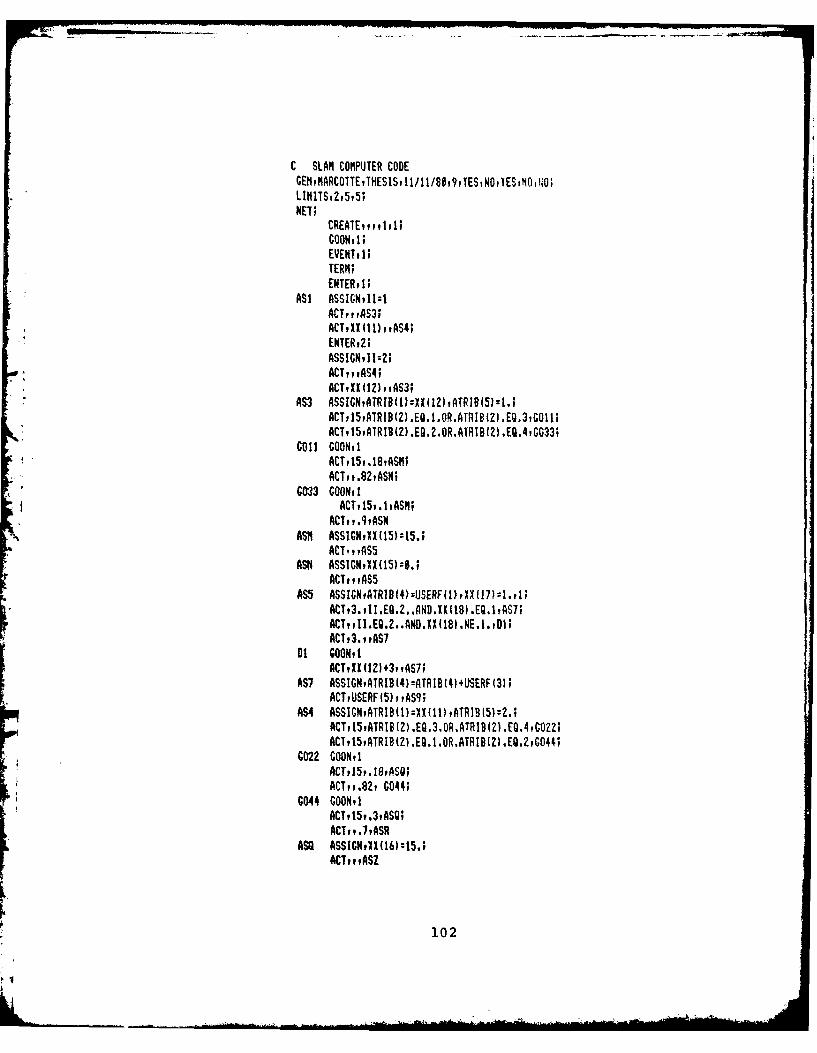
C SLAM COMPUTER CODEGEN ?MARCOTTE ,THESIS, 11/11/80,9p ES, NOYES , Oil0
NE I; C E T p i l lCOON,11;EVENTS i;TERM;ENTERtl;
ASI ASSIGNII:1ACTt ,AS3;ACTv, X (11) , AS4;ENTER,;ASSIGN9,11:2;ACT,, ,AS4;ACTUX(I2)tAS3;
453 ASSICNATRIB(1):XXI(12)ATRIB(5k=1.;ACTiI5,ATRIB(2).EB.1.OR.ATRIB(2l .EQ.3icO11;ACT,15,ATRIB(Z) .EQ.Z.OR.ATRIB(2Z .EQ.4,G033;
Coil COONV1AMT15, .18,ASM;ACT,, .82,ASN;
C033 GOON,!ACTil5i.19ASM;
ACT, ,.9vASNASH ASSIGN9XX(l5)z15.;
ACT ,piflS5ASN ASS!GNXX(l5):$.;
ACT,, ,S5ASS ASSICNATRlDL4):USERF(lbtXX(17):1.,1;
ACTI1l.Eg.2..AND.XX(181 .NE.1.,01;ACTt3., ,AS7
01 COON11
ACTiXX(121.3pvAs7;AS7 ASS!GNATRIB(4)=ATRIB(4)+USERF(3);
ACTPUSERF(5)PtAS9;454 ASSIGNATRIB(1)=XX(11),ATRIS(5):2.;
ACT,15,ATRIB(Z) .EQ.3.OR.ATRIB(Z) .EQ.4tCOZZ;ACT,15,ATRIB(Z) .EQ.1.OR.ATRIB(Z) .EQ.2,GO44;
Q022 GOON11ACT, 15,. 19PA50ACTti.829 G044;
C044 GOON,!ACT, 15,.39ASQ;
ACT,, .7pASRASS ASSICNPXX(16):15.;
ACT,, ,ASZ
102

ASR ASS!CNtXX(16I:S.;ACT,, ,ASZ
ASZ ASSIGNATJIB(4=USERF(),XXIUS):1.,UACTt31lI.EQ.1..A4D.XX(17) .Egl.,Aojb;ACT?,Il.E I..ANDJXX( 17). NEI. ,D2;ACTy3. ,AS6;
DZ COONiIACTiKX(1I)+3tvASb;
AS6 ASSIGNATRIB(4)=ATRIB(4)+USERF(4);ACTYUISERF (6);
AAS8 ASSIGNATRIB(4):ATR]B(4)+USER'F(8)tll(ZO):USERF(1S);ACTiUSERFUZ2;
ASA ASSIGNATRIB(4):ATRIB(4?+USERF(14)b11(22):TNOW;ACTtptQZ
AS9 ASSIGNATRIB(4)=ATRIB(4)+USERF(7),iX(19)=USERF(9);ACTiUSERF( U)
ASB ASSIGNATRIB(4):ATRIB(4)+USERF(13),XK(Z1):TNOW;
91 QUEUE(Zlig;.CMTI PATCHWz,1/Go54UG/CaO;
COS COONFl;ASC ASSIGNvATRI6I4)=ATRIB(4)+I.I,l1
ACTtqUSERF(17) .LT.ITI;ACTttiASX
ASX ASSICN#ATRIB(3)=USERF(191;ACTiATRIBt3J ,,ASE;
TI TERMil;ASE ASSIGNATRIB(4):ATRIB(4)+USERF(ZibIlX(2):ATRIB(3)15,
ATR1B(3)=USERF(23);ACTiATRIB(3);
ASC ASSICNATRIB(4)=ATRIB(4)+USERF(25);T3 TERM;CONE COON,1;
ACT;ASD ASSIGNATR1B(4)=ATRIB(4)+USERF(16h1t
ACTivUSERNFU.T.I.,TZ;ACT, ,ASY;
AST ASSICNiATRIB(3)kUSERF(19);ArTATRIB(3) ,,ASF;
T2 TERM;ASF A5S:CNAfH:B(4)=A7Rl~$+SEF2lxxl-AR[()5
LATRI(DUSERFZZ);ACTiATPIU.i.);
ASH ASSIGNiApr91b,4):ATRIB(4)+uSERF(24);T4 TERM;
EN ON C
103

WOMRtTRACEYOP900;SEEDSi9375295 (1)SIMULATESEEDSt-9375295(t)MNTRPCLEARigMNTRTRACEiO,90gS IULATESEEDSt9375295 (2)
allMOt1TRiCLEARig
NONTRYTRACE4061ISIMlULATESEDSt-9375295(Z)NONTRPCLEARigMOllTRoTRACEtQ,9l@SIMULATESEEDS, 9375295(3)MONTRiCLEARi
HNONTRiTRAC, j1l
k* SIMULATESEDSY9375295 (4)MNTRtCLEARigMNTRTRCEQ,9ftSIMULATESEEDSi-9375295 13)NONTRiCLEATtigWOTRTRACEOY951SIMULATE
SEEDS-9375295(4)MONTRYCLEARigMONTRiTRACE400f*SIMULATE
P SEEDS1 9375295(5)MONTRiCLEARigMNtTRiTRACE40619SIMULATEFIN
104
Appendix F
User Function Summaries
105

1. User function one (USLr) (Figure F-I)1, is
used to calculate the fuel required 4uring all airlifter
ground operations. Normal ground operations consist of
start, taxi, takeoff (STTO) and delays. STTO fuel is a
constant value for a particular aircraft shown in Figure
F-26. USERF1 returns fuel consumed in thousands of pounds
of fuel using the equation:
USERFI = STF + XX(15)* FF where
XX(15) delay time (ain)
STF STTO fuel (1000 lbs)
FF ground idle fuel consumption (1000 lbs/min)
Ground idle fuel consumption for all aircraft is shown in
Figure F-26 and obtained from the aircraft's performance
manuals.
2. User function two (Figure F-2) is used to cal-
culate the fuel required during all ground operations for
the tankers. Calculations are similar to USERFI and will
not be repeated. XX(16) is the tanker ground delay.
3. User function three (Figure F-3) calculates
the takeoff fuel from brake release until landing gear
retraction for the airlifter. Values used are:
USERF = 1000 lbs fuel for the C-SA
500 lbs fuel for the C-141B
1All of the figures referred to in this appendix
appear at the end of the appendix.
106

4. User function four calculate?- 'he takeoff fuel
for the tanker (Figure F-4). Values used are:
USERF = 1000 lbs for the KC-10
500 lbs for the KC-135
5. User function five (Figure F-5) is used to
return the initial climb time for the airlifter computed
by FLYME using:
XX(10) = Airlifter current gross weight
XX(32) = Cruise altitude calculated by sub-routine CALT based on XX(l) andIBIRD.
XX(31) = Airlifter departure base elevation.
6. User function six (Figure F-6) calculates
tanker time (sec) in the initial climbout. Calculations
are similar to user function five except for the following
input variables to FLYME:
XX (9) replaces XX(10) as the current tankergross weight.
XX(42) replaces XX(32) as the tanker cruisealtitude.
XX(41) replaces XX(31) as the tanker departurebase elevation.
7. User function seven (Figure F-7) computes the
airlifter initial climb fuel using FLYME and the same input
variables as USERF5. The value returned is in thousands
of pounds of fuel. Also XX(35) is set equal to the climb
fuel.
107

8. User function eight (Figure P-s) computes the
initial tanker climb fuel using FLYME with the USERF6
input parameters. Also XX(40) is set equal to the climb
fuel.
9. User function nine (Figure F-9) computes the
airlifter climb distance (NM) using FLYME and USERF5 input
parameters. USERF9 also sets XX(19) equal to the climb
distance.
10. User function ten (Figure F-10) computes the
tanker initial climb distance (NM) using FLYME with input
parameters of USERF6. USERF10 also sets XX(20) equal to
climb distance.
11. User function 11 (Figure F-11) calculates the
airlifter cruise time (min) from leveloff to rendezvous
entry point. Variables used are:
a. XX(1) = distance from airlift departure torendezvous entry point.
b. AS = airlifter true airspeed at altitudeXX(32) (NM/MIN)
USERFII = XX(33) = CRUISE TIME =
XX(1) - XX(19) NMAS + RNORM(I,.16)
RNORM = Cruise altitude winds
( = 1 NM/MIN; c .16 NM/MIN)
The parameter for these cruise winds was obtained
from Global Weather Central AFGWC/DOY, Offutt AFB, NE.
The winds are modeled as constant between 25,000 ft to
41,000 ft. The wind variance of .16 NM/MIN was taken
108

as an average of wind vulocitv changes o, - the routes
selected.
12. User function 12 (Figure F-12) determines the
tanker cruise time from leveloff to the rendezvous entry
point in the same manner as USERFIl. XX(43) is set equal
to the cruise time and the user function returns time in
minutes. An undefined variable used in USERF12 is XX(4)
which is the distance between the tanker departure point
and the rendezvous entry point.
13. User function 13 (Figure F-13) computes the
airlifter cruise fuel from leveloff to rendezvous entry
point. The steps used to compute the fuel are:
a. Compute the initial cruise gross weight:XX(10) = Ramp gross weight (XX(75)) - ATRIB(4)ATRIB(4) = total fuel consumed up to level off.
b. Compute the fuel consumption rate (V) at cruisealtitude XX(32) . The rate is returned fromFLYME in thousands of pounds/minute.
c. Cruise fuel = V * XX(33) fuel/min * min =
1000 lbs fuel.
Finally, USERF13 decrements the aircraft gross weight by
the cruise fuel.
14. User function 14 computes (Figure F-14) the
tanker cruise fuel from level off to the rendezvous entry
point in an analogous manner to user function 13. The
user function returns cruise fuel in thousands of pounds.
15. User function 15 (Figure F-15) computes the
airlifter loiter fuel. The computation is computed as
follows:
109

a. Determine loiter time (ATIME). This is deter-mined, after both aircraft have reached thematch node, MAT1, by computing TNOW - XX(21),where XX(21) is the arrival time of the air-lifter and TNOW is the arrival at MAT1 of thelast aircraft. If the expression is negativeor zero, the user function is returned as zeroand there is no loiter time. If the expressionis positive, then airlifter loiter occurred andthe loiter fuel is computed.
b. Compute the loiter fuel. The loiter fuel con-sumption rate is determined from FLYME andreturned as V. The loiter fuel is then com-puted as "ATIME * V" and returned in thousandsof pounds.
16. User function 16 (Figure F-16) computes the
tanker loiter fuel in a manner analogous to user function
15. XX(22) is the tanker arrival time at Q2.
17. User function 17 (Figure F-17) calculates the
rendezvous abort fuel for the airlifter (1000 lbs fuel).
If this user function is less than zero the airlifter does
not have the required fuel to return to the abort base and
a refueling is not possible. Therefore, the mission
becomes infeasible and the model is terminated. The user
function is computed by:
XX(8) = ATRIB(4) - XX(23) where
XX(8) = Airlifter ramp fuel
XX(23) = Flight plan fuel to fly from rendezvousentry point to the abort base, calculatedby FLTPLN.
18. User function 18 (Figure F-18) serves the same
purpose for the tanker as USERF17 serves for the airlifter
and returns the remaining tanker fuel after the abort fuel
has been subtracted. XX(7) is the tanker ramp fuel
110

4
and XX(24) is the flight plan fuel to fly -iom rendezvous
entry point to the abort base, calculated by FLTPLN.
19. User function 19 (Figure F-19) computes the
refueling track time. The track is 250 NM at 25,000 feet
altitude. The time is computed as follows:
a. Track true airspeed (TASTRK) is computed fromSUBROUTINE TASP.
b. Compute track time:
250 NM(TASTRK + WIND ) = MINUTES
TASTRK = True airspeed during refueling.
20. User function 20 (Figure F-20) determines the
tanker track.fuel consumption. The air-refueling track
fuel consumption rates for each aircraft were obtained
from each aircraft's performance manual. The rates are
shown in Figure F-26. Track fuel consumption is computed
as:
USERF20 = (TRACK TIME * FUEL CONSUMPTION RATE)
= Thousands of pounds of fuel.
21. User function 21 (Figure F-21) computes the
airlift refueling track fuel consumption similar to USERF20.
22. User function 22 (Figure F-22) determines the
tanker cruise, approach, and landing time from rendezvous
exit to destination as follows:
a. Compute an average gross weight (GW) fromrendezvous exit to landing.
AVG GROSS WT = (RENDEZVOUS EXIT GW - TRANSFERFUEL + TANKER ZERO FUEL > + RESERVES) 2
11

The gross weight at the end c- the flight iscomputed as XX(95) + XX(46) where XX(95) =zero fuel wt and XX(46) = tanker fuel reserves.Using an average gross weight will permit thetanker to initially climb higher than allow-able at his track exit gross weight. In thisway the model approximates a step climb profile.
b. Cruise altitude to destination is determinedfrom SUBROUTINE CALT using step A gross weight.
c. Climb time (CT) from 25,000 ft (refuelingaltitude) to cruise altitude is determined fromSUBROUTINE FLYME.
d. The climb distance, (CD) is determined fromFLYME.
e. The climb fuel is determined from FLYME andset equal to XX(60)
f. The gross weight is decremented by the climbfuel.
g. The cruise distance (CRDIST) from the level-off point to tanker destination is computed asthe distance from the rendezvous exit point todestination minus the climb distance (CD).
h. The time, XX(62), is computed as:
XX(62) = CRDIST+ 15 minutesTASK - WIND FACTOR
The 15 minutes is a constant time all aircraftuse for approach and landing.
i. USERF22 = XX(62) + CT = CRUISE TIME + CLIMB
TIME
23. User function 23 (Figure F-23) computes the
airlift time (min) from rendezvous exit point to landing
at the airlift destination. Computations a-e analogous
to user function 22. Variables used are defined in
Figure K-3, Appendix K.
112

24. User function 24 (Figure F-24) computes the
tanker fuel consumed from the rendezvous exit point to
destination. Computations are as follows:
a. Determine the approach and landing fuel forthe tanker. This value changes by aircraft;values used were taken from AFR 60-16 MACSupplement One, except for the KC-10 which wasestimated by HQ SAC/D08.
b. Determine cruise fuel consumption rate (R)from FLYME using the average gross weightcomputed by USERF22.
c. Compute cruise, approach, and landing fuel:
USERF24 = CRUISE TIME * FUEL CONSUMPTION RATE+ APPROACH AND LANDING FUEL + CLIMB FUEL
= XX(62) * R + AAL + XX(60)
25. User function 25 (Figure F-25) computes the
airlifter fuel from rendezvous exit to destination. Compu-
tations are analogous to user function 24. Variables used
are defined in Figure K-3 in Appendix K.
113

FUNCTION USERE (IFN)COMMON/SCOM1/ATRIB(l00) ,DD(100) ,DDL(100) ,DTNOW,III,MFA,MSTOP,NCLNR,NCRDR,NPRINT,NNRUN,INNSET,NTAPE,SS (100) ,SSL(100) ,TNEXT,TNOW',XX(100)COMMON QSETGO TO (1,2,3,4,5,6,7,8,9,10,11,12,13,14l,15,16,17,18,19,20,21,22,23,24,25),IFN
C GND FUEL FLOW & TAXI FUEL-AIRLIFT1 IF(ATRIB(2).EQ.1..OR.ATRIB(2).EQ.3.)FF=.12
IF(ATRIB(2).EQ.2..OR.ATRIB(2).EQ.4.)FF=.08IF(ATRIB(2).EQ.l..OR.ATRIB(2).EQ.3.)STF=1.8IF(ATRIB(2).EQ.2..OR.ATRIB(2).EQ.4.)STF=1.4USERF=STF+XX (15) *FFRETURN
Fig. F-1. USERF (1)--Ground Fuel Flow &Taxi Fuel-Airlifter
C GND FUEL FLOW & TAXI FUEL-TANKER2 IF(ATRIB(2).EQ.l..OR.ATRIB(2).EQ.2.)FF=.l
IF(ATRIB(2).EQ.3..OR.ATRIB(2).EQ.4) FF=.12IF(ATRIB(2).EQ.1..OR.ATRIB(2).EQ.2.)STF=l.5IF(ATRIB(2).EQ.3..OR.ATRIB(2).EQ.4.)STF=2.0USERF=STF+XX (16) *FFRETURN
Fig. F-2. USERF (2)--Ground Fuel Flow &Taxi Fuel-Tanker
C TAKEOFF FUEL AIRLIFT3 IF(ATRIB(2).EQ.l..OR.ATRIB(2).EQ.3.)USERF=l.0
IF(ATRIB(2).EQ.2..OR.ATRIB(2).EQ.4.)USERF=.5RETURN
Fig. F-3. USERF (3)--Takeoff Fuel Airlift
C TAKEOFF FUEL TANKER4 IF(ATRIB(2).EQ.1..OR.ATRIB(2).FQ.2.)USERF=.5
IF(ATRIB(2).EQ.3..OR.ATRIB(2).EQ.4.)USERF=1.0RETURN
Fig. F-4. USERF (4)--Takeoff Fuel Tanker
114

C CLIMB TIME AIRLIFT5 IOPTl1
IBIRD=lIF(ATRIB(2).EQ.2..OR.ATRIB(2).EQ.4.)IBIRD=2
51 XX(1Q)=XX(75)-ATRIB(4)XX(32)=CALT(XX(1Q),IBIRD,XX(81))CALL FLYME(XX(1O),XX(31),XX(32),IOPT,V,IBIRD)USERF=VRETURN
Fig. F-5. USERF (5)--Climb Time Airlift
C CLIMB TIME TANKER6 IOPT= 1
IF(ATRIB(2).EQ.1.OR.ATRIB(2).EQ.2.)GO To 55IBIRD=3GO TO 56
55 IBIRD = 456 XX(9)=XX(76)-ATRIB(4)
XX(42)=CALT(XX(9),IBIRD,XX(84))CALL FLYME (XX(9),XX(41),XX(42) ,IOPT,V,IBIRD)USERF=VRETURN
Fig. F-6. USERF (6)--Climb Time Tanker
C CLIMB FUEL AIRLIFTER7 IOPT=3
IBIRD=lIF(ATRIB(2).EQ.2..OR.ATRIB(2).EQ.4.)IBIRD=2
58 CA-- FLYME(XX(1O),XX(31),XX(32),IOPT,V,IBIRD)USERF=VXX (3 5)=RETURN
Fig. F-7. USERF (7)--Climb Fuel Airlifter
C CLIMB FUEL TANKER8 IOPT=3
IBIRD=3IF(ATRIB(2).EQ.1.OR.ATRIB(2).EQ.2)IBIRD=4
60 CALL FLYME(XX(9),XX(41),XX(42),IOPT,V,IBIRD)USERF=VXX (40) =VRETURN
Fig. F-8. USERF (8)--Climb Fuel Tanker
115

C CLIMB DISTANCE AIRLIFTER9 IOPT=2
IBIRD=lIF(ATRlB(2).EQ.2..OR.ATRIB(2).EQ.4)IBIRD=2
62 CALL FLYME(XX(10),XX(31),XX(32),IOPT,V,IBIRD)XX(19)=VUSE RF=VRETURN
Fig. F-9. USERF (9)--Climb Distance Airlifter
C CLIMB DISTANCE TANKER10 IOPT=2
IBIRD=3IF(ATRIB(2).EQ.1..OR.ATRIB(2).EQ.2.)IBIRD=4
64 CALL FLYME(XX(9) ,XX(41) ,XX(42) ,IOPT,V,IBIRD)XX (20) =VUSERF=VRETURN
Fig. F-10. USERF (10)--Climb Distance Tanker
C CRUISE TIME AIRLIFTER11 AMACH=.77
IF(ATRIB(2).EQ.2..OR.ATRIB(2).EQ.4)AMACH=.74AS=TASP (AMACH, XX(3 2))USERF=( (XX(1) -XX(19) ) )/(AS+RNORM(1.0, .16,1))XX (3 3) =USERFRETURN
Fig. F-11. USERF (11)--Cruise Time Airlifter
C CRUISE TIME TANKER12 AMACH=.82
AS=TASP(AMACH,XX(4 2))USERF=( (XX(4)-XX(20) )) /(AS+RNORM(1.0, .16,1))XX(43)=USERFRETURN
Fig. F-12. USERF (12)--Cruise Time Tanker
116
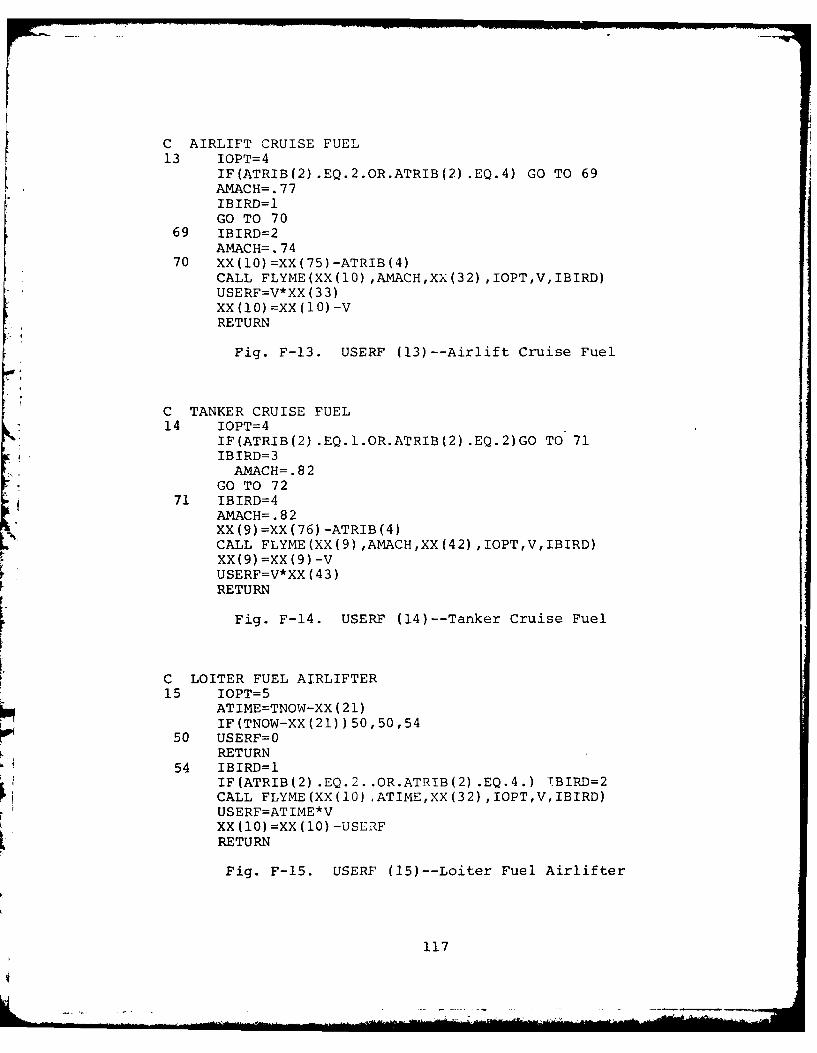
C AIRLIFT CRUISE FUEL13 IOPT=4
IF(ATRIB(2).EQ.2.OR.ATRIB(?).EQ.4) GO TO 69AMACH=.77IBIRD=lGO TO 70
69 IBIRD=2AMACH=. 74
70 XX(l0)=XX(75)-ATRIB(4)CALL FLYME(XX(10) ,AMACH,XX(32) ,IOPT,V,IBIRD)USERF=V*XX (3 3)XX(10)=xX(10) -vRETURN
Fig. F-13. USERF (13)--Airlift Cruise Fuel
C TANKER CRUISE FUEL14 IOPT=4
IF(ATR2EB(2).EQ.1.OR.ATRIB(2).EQ.2)GO TO 71IBIRD=3AMACH= .82
GO TO 7271 IBIRD=4
AMACH= .82XX (9) =XX (76) -ATRIB (4)
L2' CALL FLYME(XX(9),AMAC-,XX(42),IOPT,V,IBIRD)XX (9) =xx (9) -VUSERF=V*XX (43)RETURN
Fig. F-14. USERF (14)--Tanker Cruise Fuel
C LOITER FUEL AIRLIFTER15 IOPT=5
kil ATIME=TNOW-XX (21)IF(TNOW-XX(21) )50,50,54
50 USERF=0RETURN
54 IBIRD=1IF(ATRIB(2).EQ.2..OR.ATRIB(2).EQ.4.) TBIRD=2CALL FLYME(XX(10) .ATIME,XX(32) ,IOPT,V,IBIRD)USERF=ATIME*VXX (10) =XX (10) -USERFRETURN
Fig. F-15. USERF (15)--Loiter Fuel Airlifter
117

C LOITER FUEL TANKER16 IOPT=5
ATIME=TNOW-XX (22)
IF(TNOW-XX(22) )52,52,53I52 USERF=0.
RETURN53 IBIRD=3
IF(ATRIB(2).EQ.l..OR.ATRIB(2).EQ.2.)IBIRD=476 CALL FLYME(XX(9),ATIME,XX(42)',IOPT,V,IBIRD)
USERF=ATIME*VXX (9) =XX(9) -USERFRETURN
Fig. F-16. USERF (16)--Loiter Fuel Tanker
C ABORT CALCULATION AIRLIFTER17 USERF=XX(8)-ATRIB(4)-XX(23)
RETURN
Fig. F-17. USERF (17)--Abort Calculation Airlifter
C ABORT CALC TANKER18 USERF=XX (7) -ATRIB (4) -XX (24)
RETURN
Fig. F-18. USERF (18)--Abort Calculation Tanker
C REFUELING TRACK TIME19 AMACH=.62
IF(ATRIB(2).EQ.2..OR.ATRIB(2).EQ.4.)AMACH=.74RALT=25 .0TASTRK=TASP (AMACH ,RALT)USERF=250./(TASTRK+RNORM(.9, .16,1))
Fig. F-19. USERF (19)--Refueling Track Time
C TANKER TRACK FUEL20 R=.27
IF(ATRIB(2) .NE.3.OR.ATRIB(2) .NE.4 .)R=.25USERF=ATRIB(3) *RXX (9) =XX(9) -USERFRETURN
Fig. F-20. USERF (20)--Tanker Track Fuel
118

C AIRLIFTER TRACK FUEL21 R=.26
IF(ATRIB(2).NE.2..OR.ATRIB(2).NE.4)R=.45USERF=R*ATRIB (3)XX (10) =XX(10) -USERFRETURN
Fig. F-21. USERF (21)--Airlifter Track Fuel
C TANKER TIME TO DESTINATION22 IOPT=l
-A IBIRD=3
IF(ATRIB(2).EQ.1.OR.ATRIB(2).EQ.2.) IBIRD=485 XX(9) = (XX(9)-XX(6)+XX(95)+XX(46))/2
XX(70)=CALT(XX(9),IBIRD,XX(82))CALL FLYME(XX(9),XX(93),XX(70),IOPT,CT,IBIRD)IOPT=2
y CALL FLYME(XX(9),XX(93),XX(70),IOPT,CD,IBIRD)IOPT=3CALL FLYME(XX(9) ,XX(93) ,XX(70) ,IOPT,,XX(60) ,IBIRD)AMACH= .82IF(ATRIB(2).EQ.1.OR.ATRIB(2).EQ.2.)GO TO 86IBIRD=3GO TO 87
86 IBIRD=487 XX (9) =XX(9) -XX(60)
CRDIST.=XX (5)-CDXX(62)= CRDIST/((TASP(A'ACH,XX(70))-RNORM(.83,.16,1)))+15.USERF=XX(62) +CTRETURN
Fig. F-22. USERF (22)---Tanker Time to Destination
119

C AIRLIFT TIME TO DESTINATION23 IOPT=1
IBIRD=lIF(ATRIB(2).EQ.2..OR.ATRIB(2).EQ.4.)IBIRD=2
95 XX(1O)=(XX(1O)+XX(6)+XX(94)+XX(45) )/2.CALL FLYME(XX(1Q),XX(93),XX(73),IOPT,CT,IBIRD)IOPT=2CALL FLYMEI(XX(1O),XX(93),XX(73),IOPT,CD,IBIRD)IOPT=3CALL FLYME(XX(1O),XX(93),XX(73),IOPT,XX(61),IBIRD)AMACH= .77IF(IBIRD.EQ. 2)AMACH=.74
97 XX(1O)=XX(10)-XX(61)CRDIST=XX(2) -CDXX(63)= CRDIST/((TASP(AMACH,XX(73))+RORM(.83,.16,1)))--15.S=TASP(AMACH,XX(7 3))USERF=XX(63)+ CTRETURN
Fig. F-23. USERF (23)--Airlift Time to Destination
C FUEL CRUISE & LANDING TANKER24 IOPT=4
AMACH=.82IF(ATRIB(2).EQ.1.OR.ATRIB(2).EQ.2.)GO TO 150IBIRD=3AAL=5.GO TO 151
150 IBIRD=4AAL= 2. 4
151 CALL FLYME(XX(9) ,AMACH,XX(70) ,IOPT,V,IBIRD)R=VUSERF=(XX(62) -15) *R+pJAL+XX(60)RETURN
Fig. F-24. USERF (24)--Fuel Cruise & Landing Tanker
120
C FUEL & LND AIRLIFTER25 I0PT=4
IF(ATRIB(2%P.EQ.2.OR.ATRIB3(2).EQ.4.)GO TO 152AMVACH= .77AAL=5 .2IBIRD=lGO TO 153
152 AMACH=.74AAL=2.5IBIRD=2
153 CALL FLYIE(XX(1O),AMACH,XX(73),IOPT,V,IBIRD)R=VUSERF= (XX (63) -15) *R+AAL+XX (61)RETURN
Fig. F-25. USERF (25)--Fuel Cruise & Landing Airlifter
I im
121
A. START, TAXI, TAKEOFF FUEL CONSUMPTION VALUES
Aircraft STTO (ibs)
C-5 2800
C-141 1900
KC-10 3000
KC-135 2000
B. GROUND IDLE FUEL CONSUMPTION RATES
Aircraft RATE (lbs/min)
C-5 120
C-141 80
KC-10 120
KC-135 100
C. AIR-REFUELING FUEL CONSUMPTION RATES (lbs/min)
Aircraft RATE (lbs/min)
C-5 450
C-141 260
KC-10 270
KC-135 250
Fig. F-26. Aircraft Fuel Consumption Values
122

iI
Appendix G
Sample Raw Output Data
123

FLTPLN Output
VS7 SCENARIO 8 1IANKER BASE f Z
AC :2 TK -3 CARGO :45.777.777 777.777 777.777 777.777 266.244 272.317 Z78.459 284.647 2.62 ?7 .41 3,414 369.641 316.961777.777 777.777 24.633 249.77 259.717 265.47 Z71.28277.609 3. 3 23Z.9 294.c74 31.919 306.873
777.777 Z44.'12 248.33 257.M2 261.916 2t6.759 Z71.826 276.931 Z;Z.234 287.543 Z72.074 8 .16 313.833258.775 261.686 264.892 229.355 272.3 275.926 279.979 284.181 293.52 2Z.9c6 Z37.4jj9 6Z.215 3Th.915
280.105 281.799 283.881 2:6.Z6 288.811 Z91.611 294.667 Z97.7,6 361.123 104.98 .2,55 313.22 316.917
I 244.2124718=17 3 Z RPT ENTRY :50i311433I36 133.3541731376LEGS :854.45K,7243,1 352.2r1 91.9T73 ~622150 9;. ~7TRUE COURSES :5.72737231 4,:i 5 312397 5.53:7979 17 S.3C4:C542.94172722661FUELS =36.78067189535 12U8T1I% 29.69531641935 31.17733315285 2.2638595241 24.90;51171024 9.3286211941Z 13.136z21
AFUEL :144. AGT -3Z5. A'LZ :31. 3T3T :0.TFUEL :158,1126718817 TOOT :378,5827M71887 TRFL -44.51807413C31 TTOT :39.571671G859
777.777 777.777 777.777 777.77 264.416 27Z.2 276.343 28Z.393 29t39 275.472 31.756 3W1.9,9 32.133777.777 777.777 244.986 252.234 257.726 263.327 26.011 274.756 Z32.544 Z99.119 31..534777.777 245.929 154.Z^@ Z54.847 25,.570 262432 2642 2744335 27.639 235621 2g1.d21 Z76.33 widl.P?
25.469 259.332 26.485 265.892 269.,21 Z73.341 Z77.373 21.,66 2%b.Z7 29 . ,3 .477 10.13 3404.;51Z77.908 Z79.701 281.781 284.122 Z86.71Z 29.497 292.489 Z5.59 2M3,969 362,556 306.164 316.878 32.ZI
t 245.929148396 32 RPT ENTRY :58.81611439136 133,3541731376LEGS =854.4540M72451 31.259 672379964'6.,Z9154126 .^452670731TRUE COUJSES :-.7015-3716231 4.Z{5% 3370K37 5..11737^2l1 4.37 44125664 2.$t77203661FUELS :34.76529346-12 .51:97,1,458 .. 6.179751.2743 9 ,891'321786 28.22358524" 1 3.794102132 9.32862169412 13.13821'AFUEL :124. A74T :375, 2FLZ :31. ATO3 =J.IFUEL :111829148306 TGT :42Z.291433116 TRFL =6Z42269576213 83OT :4Jj649 49451
777.777 777.777 777,777 777.77? 2L63.-5 269,41 Z75.176 21.6 6 2M2.244 299.737 29.374 777.777 777.777777.777 777.777 245.728 5Z0.553 255.941 262.0% 267.695 Z73.37 ^7 .l4424.25 277.229 313.5b; 302.3777.777 244.144 248.426 252,22 258.123 22.962 267.915 272.765 Z7.615 283,Z2 234.844 31.540 299.203
254,841 257.782 263.952 264.252 267,872 271.634 275.662 27.733 2'.637 2 h.414 299.232 30&.L22 3K2,095275.533 277.297 283.812 Z86.366 239.167 232.190 295.416 298.826 32K.412 386.220 311.82 307.093 310.69
3 244.1440970143 3 2 RPT ENTRO :50.0361143136 133.3541731376LEGS :E54.450372494" .2230
,529 862.7910327'89 66.26219506 69,358127781TRUE COURSES .75577979..7 4.?7 5.44:2564 2,.7:727663661FUELS :33.300Z42166: 125.5637:1t459 25.2148 6 99 93 Z34.89943:326 28.282595241 21.58775714158 9.3ZG6ZI9412 13.11I21'
AFUEL :194. AGMT :2'5. AFLZ :31. AT13 45TFUEL :191.6448970143 TGWT =438.5140970143 TRFL :81.73764440683 TI3 :34.93181572213
777.777 777.777 777.777 777,777 264.K22 27.961 Z76.28 777,777 777.777 777.777 777.777 777.777 777.777777.777 777.777 Z&).178' Z8.26 Z53.369 24.01723^,77 777.777 777,777 777.777 777.777 777.777 777.777777.777 241.47 245.619 '5 A24.424 263.35? Z8.461 273.645 777.777 777.777 777.777 777.777 777.777251.147 257.120 263.4Z8 Zt3.q93 267.757 Z71.713 275.845 2M1.115 2 7P. 018 29.6:5 297.384 777.777 777.777Z74.66Z 276.685 273.856 281L7 277.477 286.839 284.765 287.669 290.725 294.011 97.328 31f.759 777.777
4241.472301647 3 2 RPT EIT 'T :[email protected] 113.141731'6-54.4' ,P4-73613?413LEGS :85.5374! 3512227 2.O2:90 4.22 t3 2.5221TRUE COURSES :5.70111r716231 &. :32 2 O .5972:7 4, :71±;5s04 2.5417222661FUELS :29.13128972515 125.5#3>11458 .'X 459335 35.2'7444.&597 28.236353541 2.c;2311373 l.3286Z169412 13.13121AFUEL 464. AGT =265. ;L2 :'I. 47 :5.TFUEL :267.372301247 TGvT :455,4238:047 ',"t :97.66769196511 TTT =4.6125161,789
FUELflIN(4v3.2) :241.47230' 047POINT ONE :43.46637 19951 124.W50332Z7
124

-4--- ---
-
* S a .34-4 . -* *44 I 244 .34 77 44 - 4-- 74 .4 NJ 0t>60 6 4444 04 .14 4/7 '/2.4' 40 A 00 4442e4 ggz I 'WE 4444.1 1 - 4V44 .4 4 4?45 '34.44eke I.win S3054644,64 I 23 Ca fl' J C~ .,j '4 ~0 3,* I 5 4~ 4.43 .4.4 4 .J'J4 6" .3 44 .4)4 .44 A fl~ '~'4 .4 '14 '7364-54 7 '4.4 44' 13 42 .4.4 4' 0 3.4 '22* 4.463 I 24 .4. 4. 4 4.44' 4 4 44lag.. S a4'. 444 41 .3 444"4 '4' 34 344 4264-44'- 4 N 434.4 .4 4,444 .4 .4 .4... 4.4It-SE S N C a' 4.4 N d 4r4,.3I X I44 ID I . 5-. 4-. 4-- - -* ID I 0 0 00 0 0ire 4 7 22 4 4141I -.4 a 34 4
* 4' 5 £ I* r a -. a* I I* 2% I* I .4 .3 .4 - .4 .4 .4La - -~ -. --a - 4.4 .4 .4 .4 .444 444 .4 a 4 .4 LaI 6 .4 4 .3 - .4 - 0* S a ~. 3 4 .4 - 3* I 4 .4 4 4 -2 .4 25 I La .4 .4 .4 '4 N N* 2 2 S 2 4 .4 4 4 2I 4 4 .4 /7 -, .4 4'* a6 II 4* .3 a
-4 .3I I - 24.4
.44-* 4*I
* I 4, 3.4.7 '44
* I - .4* a . . a a . . 2 2 -* OS I ... >. 4 1 ~4 N 0 4% V.4* '444 I
S 4.1.3 a 4.1 S
* D4* I
* ~I I44 I I 52 5 -aS I* . C C ~S
S DC 8
4- a -I I 2 2 2 4 4 2* .4 6 4~I I i- .4 .4 - -~ '3 '-.4 .44 4- 44 .4* b-I I
4' I ol S
- I S I -4 ~4 a .4 4 4 .4 .4 La .474 4. -.4 '4 - '4 -.4 '.4 -4 .4 .4 .4 4-44 .~C 5 .4 .4 .4 .4 .4 .4 .4 .4-3 I 145 I 4.4 .44 0 .4 4.4 444 444 44 .4 44 43I YS S -~ n Ca :3 '1 1' 1 4~' '' '7'.4 5 DC I 0 @3 4' 4 4' 4' .4 4' 0 41 .44" I 4.36 I 4 . 0 , .4 - - 4 3 '4* I -. .4 .4 .9 a S -. .3 .3 .9 S-4 I 5 a 4 2 2 2 4 4 4 a 24.44 6 - C ..) -.4 Ir I5. a I
.4 5 *22 7.4C I a .4 .44.4434
33* 4 N N* La 4 4.4 44
* C I 4 -' 3 4 4 -a '4 4 .4 D..........a 2 4 2 2 2 4 4* '-4 4* 64' S
- S
.4 4
44* a 7.4 7 7 7 7 7 7 744. a '. 4. '4 44 4~ 4- 44NiA 2 W '4- 7 4.3 7 4.4 4. 4.3*a7 6 '.4 CI t, '4' 4.4 444 44' " 4@ (4' 21an-s.. 4 34' 4' 4. 4 '4- "4 4' '4' 4/' 4' 4, 4' 4' 4'**4%I 4'4.4... - - 4. .4 .4 - - 24 .' .4S.,4 4 . S -- 4%.4 .4 4-4 *' 7 .4 4. .IL.I44 5 4., .4 -. -J -. 41 .4 4-. 424114 6 -' 4 4.44 .4 4 '4 .4 .4 4.' 0
* 6
4 .4 7* a
6~ I* - S* S* 4 a N N N '43 N 4-4 21 4-4* I 4.4 .4 .4 .4 .4 4 .444 4.' .4 . 44 4.: 4 - 4.4I C 4 34 3 44 4 . -* 7 6 21 21 '4 ' .4% 43 A.4 @4* 8. 7 43 44' (4 4." 4' 94 N * P* I I .4 .4 .4 '4 N N (44* I 24442~ 2 2 4 .4 4 4 4* 7 C C C 430 C

4"4 4 C - , 4. .. . .. . .4 4 4, 4 ,* 4•
40 - - . J4 .4-A• .2 -
4..)
.4 .4 , 4 . 3 .4 - .4 .4 -: . . . . . . . 4-- w . -4 4 4 -
Appendix H
FLYME Subroutine
127

FLYME is the control program for a set of sub-
routines which provides the fuel data for both the flight
planning and simulation models. The fuel data bases for
the C-5A, C-141B, and KC-135 aircraft were provided by the
Air Force Global Weather Central and is the same data used
to generate operational computer flight plan fuel require-
ments. Fuel data for the KC-10 was available from the
KC-10 System Project Office, AFSC, WPAFB, OH in the form
of experimental performance charts. Data points from these
charts were compiled into FLYME to permit the same sub-
routine calls to address all four aircraft.
FLYME transfers control to one of the four air-
craft subroutines labeled C-5A, C-141B, KC-10, and KC-135.
The aircraft subroutine's coefficients, in dimensioned
variables, compute the tx'el data from six-degree polynomi-
als evaluated in subroutines POLLY and POLY. Five options
are available for each aircraft. Option one computes time
in the climb to cruise altitude in minutes. Option two
computes the ground distance, in nautical miles, traveled
in the climb. Option three computes the fuel consumed in
the climb in 1000s of lbs. Option four computes the
cruise fuel rate in 1000s lbs per minute. Option five com-
putes the rendezvous loiter fuel in 1000s lbs per minute.
Each option contains input and output parameter checks and
128
.4 I z IIII , - . .

, -- -.. .. . . .. . .
error statements printed by subroutine ER}I'S. The data
is restricted to cruise altitudes between 25,000 and
41,000 feet and a standard day temperature with a tempera-
ture deviation of zero.
The C-141B data is the same data used for the E-3A
aircraft with a 3 percent degrade in all fuel computations.
The current C-141B fuel curves have not been prepared by
AFGWS at the time this data was obtained. However, the
data provided with the 3 percent degraded data matches the
performance charts in the C-141B technical orders.
FLYME calls two other subroutines, CALT and TASP.
9 !CALT returns the highest altitude at which an aircraft
can cruise for a given gross weight, and Air Traffic Con-
trol (ATC) hemispherical altitude structure. The calcula-
tions are derived for a given gross weight linear regres-
sion of the performance ceiling charts for each aircraft.
TASP returns the true airspeed of the aircraft at
the given cruise altitude and mach .L..ber derived from
the equation:
TAS = MACH NUMBER * SPEED OF SOUND AT ALTITUDE
The listing of the computer code for these sub-
routines follows:
129

SUBROUTINE FLIKE (VItVZV3,IOPT4V IDIRD)IF (IBIRD .GE. I .AND. IBIRD .LE. 41 CO TO 5
CALL ERROR ("IBIRD ERRO"'R IN FLIKE")
RETURN5# GO TO (1,Z09,3gJ,4D),IBIRDIll CALL C5A lVItVZV3p]OPTV)
RETURNZO CALL C141B (VYV2,V3,IOPT0V1
RETURN301 CALL KC14A (VIVZiV3oOPTiVI
RETURN
411 CALL KCI35A (VYVZtV3,IOPT4i1o RETURN
ENDcC
C RETURNS TRUE AIRSPEED IN NNI MINFUNCTIONd TASPIAMACHtALT)DINENSION SSND(7)DATA SSNDI9.56333i 9.61167t 9.6966714t 9.783331 9.86833t 9.953331 1#.63667/DO It I : I, 7J:I
IF (ALT.CE.(39.-ZfI)) GO TO 261 CONTINUEZI TASP=AMACH*SSNDIJ)
RETURNEND
FUNCTIOfN CALTICGTtIBIRDiTC)DINENSION ALPHAMY)SBETAM4)DATA ALPHA161.12378,61.79053,56.5S588,60.13695/DATA BETAI-.0455556t-.95#7ZD-.043534Z2',i
6 73168l
NIALT : ALPHA(IBIRD) + DETAIIBIRD) 4 CWTD0 19 1 1, 4ALT 4 41. - 4#1IF (TC ,GE. 3.141391 ALT = 43- 411IF (HIALT.GE.ALT) GO TO 20
11 CONTINUE29 CALTI ALT
RETURNEND
130
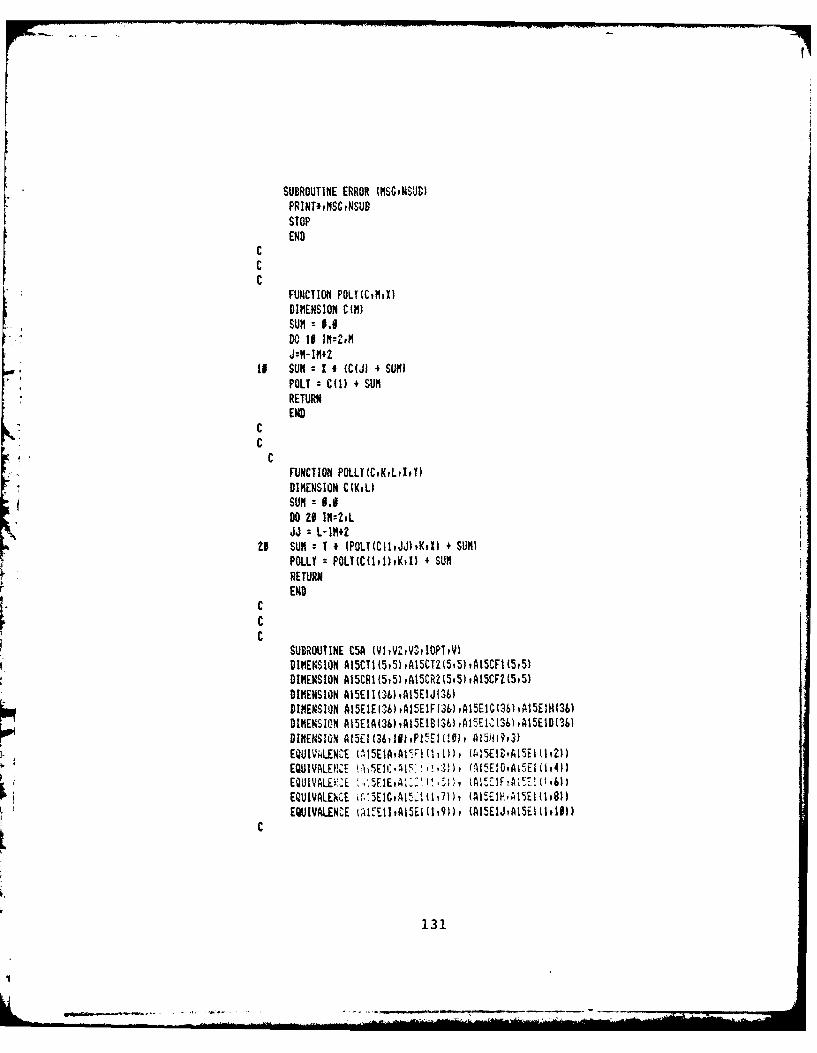
SUBROUTINE ERROR (MSG.NSUB)PRINT.IMSCPNSUBSTOPEND
CCC
FUNCTIONI POLT(CvMtX)DIMENSION C(M)SUM 9 .#Do 19 M:,
It SUMN z1K (C(jl 4 SUMIPOLY C(I) + SUNRETURNEND
CcC
FUNCTION POLLYtWiLui.Y)DIMENSION C(KiLlSUM:DO 29 111:2,1JJ = L-11142
29 SUMl : T #(POLT(ClIIJJhtKtX) *SUM)POLLY -- POLY(C(1.1)jK.I) 4 SUN
RETURNEND
CCC
SUBROUTINE C5A (V1,VZ,V3vIOPTtVlDIMENSION A15CTI (5,5) ,AISCTZ(5.5) ,AISCFI (5.5)DIMENSION AISCRI (5,5) ,AICRZ(5.5) ,AISCFZ (5.5)DIMENSION AI5EI I (3) Al5EIJ(36)
DIMENSION A15EIE('36) .AI5EIFI3&) ,AISEIC(36) ,AI5EIH(36)DIMENSION AtSEtA(36),A15EIBI36btAISEIC(36),AISEID(36)DIMENSION A5I3.9~~I~.A~93
C
13 1

C DIST FOUR ENCINE COEFFICIENTS
DATA AI5CTII .514Z7667E.0Z, .340?2Pj'E+HT, -.96786741E-13i& ~.117:14Z2ZE-65t 52 U EC,-.15142192E.92t& ~.871PS49ZIE-OI 1 87>[;-3 *I896SOE-I66&-.6770,5817E-Ii .1669" 401 -.45SS96eM -02i
.6 K15443E6I5v -00i M81~7465E-lb~& .243Z 3Z'-r' - .I9- ~ & .6,4197566E-96i& -.94Z7*3ZL7iE-f*-,t.z6I:-z -.42545431E-03i
t .454489tIE-f5v -.1400MLE-91 .1446845E-litL -64":il I5ZZE-141DATA A1qCTZ/l .54754MtE421i -.Z3079MzE4g1, .896747SE-llyI -.13647746E-03t .228MI5IE416t -.57847184E+12,
& 17056432E+O1t -.1857076E-l .89505101E-4& -.15517611IE-06? .1051516i6E40ZP -.31197773E+10tt ~ 34@?193'oE-6ZP -. 16248261E-94t .28528073E479,& -.54684296E+ggi .16210MZE-Ply -.17712504E-13#
t.& i84476539E-06i -.14949271E-08t .78714622E-02it -.Z331434@E-03w .25464057E-15t .12152658E-97w& .2141309§E-19/DATA A15CFI/ 9&Z1657ZE40Zt .468ZIMSE-fit -.1687635CE-03it 245?7604E-0- i -.12776864E-09i .25693796E+62tt -.19OW3073E+90, .608'12ME-03i -.74967174E-06it .3334133SE-69i - .37019160E+Olt .Z9754MfE-fitt - .84C54569E-04i .I0'863ZSE-#&i -.4443700ZE-lfvt .15I54~7EMgg -.I116MZ1E-12i .339Z45S1E-65iI -.401050E-08 .16675677E-itt -. 1717349E-§Zt& .13313674E-04? -.35575162E-#7t .38965935E-litt -. 14014112E-131DATA AI5CF2l- .40738972E+0Zt .5I30842IE0,~ -.764'14177E-13t& -.4778556ZE-05i .17370I1E-07i -.21514860E+12,& .64315325E t -.706SSM4E-02t .33b59370E-04it -.58310M9E-071 .35l9383lE+01i -.IG336716E.90tt .Itl'l3f8E-0Z# - .5140909E-05o .867397/67E-0i& -. 15464011E+0 .447233MfE-92t -.47239Mt4E-#4tt .ZI18054E-06i -.35559627E-9 .1764339SE-9Zit - .49841420E-04i .51213M~E-16i -,ZZ595754E-#8t
& .3605678E-11iDATA A15CRt/ .446974Z4E.SZ, .4439Z469E.91, -.125694I0E+IOtt .151636SIE-Oi - .66759124E-#St .3.5ZBZOIZE.OZt
& -.2VIPOI~EW0, .80245119E-fOh -.96009867E-I3iS411.207IE-05i -.47324632E411, .37Z29bIIE.O,&-.I024792ZIE-0l, .11873&35E-03i -.4S62433ZE-06i
t .2094Wi$+00r -.1533995SE-1i, .4IgZSS4ZE-93v& -.450:8295E-05, .17499955E-07i -.2366895SE-flb& .17411988LE-03i -.4'068768E-15i .43037131E-07P9 -.13221863E-91
132

DATA A15CR2I-.164&5248E40Zi -.596SM1E41, .'M317535E-91i&- .47085761E-013w He535576E-06i .48flSHOE402,&-.18W~53ZE+H1, .424189"H~-Mi -.1Y!75209E-03yC.27434952E-96i .4173I172E+Ott -.4.5913136E-01i& .1181146W9-7t .376936IE-45i -.13Z935ME-07#
9 -.42739M9E+00, .964294I7E-62i -.i,80.3)046E-04#t .12711MSE-t~ .13743434E-09t .b706499'JE-02i& -.14846954E-03i .9972772iE-06i -.14487723E-08tt -.35185374E-111
CC CONSTANT ALTITUDE CRUISE COEFFICIENTSCC A:23H B=25M C:Z7M D:Z9N E=31M1C F:33K G=35M H:371 1=39Ml J:41
I. C
CDATA A15EIAIt .36542733E4Ib- .45837b38E+#3, .34593)9765E40*,-. 10186684E+i15,& I121I#256E+05,- .51979966E+04t 2935EC,.4I~941& .82959266E+BI,-.198tVO'2E+J2Lt .49621873E401, .090000EMf ,&-.912iJgf7ZE-04,-.884S40494E-a3v .211140^37E-02t-.1Z1736E-421& *00000E400t .009000E+00 .5199427PAE-f6,- .86674Z41E-46i&.41012403E-s.6i .9J090E040 .0900E+1i, .J000001
t-.14850194E-09i .11516674E-49i . I M +0 .930000EMG,t .fl6SS6I0UEMS MHOEM, .1346.359^)E-13i .000GE4fl&.00e0000E48e, .0000000EMI .019090E+01, .000E+01DATA AI.5EIB/&.346923:396E403),-.'3439947SE.04, .139341f6E.I5v-.272Z9535E+#5,Z .25433674E.O5,-.91344i23&E+4i .2122I96345E+Oi,-.17476749E40I,&.434I9.347Ei01,-.:3874b3ZZE+31, .93332'913E4C, .9000E400,
t-.49999729E-03i .155845ifE-flt-.2844072$E-02i .9580386E-02it .000000E.§Ot .00J0000E403i .17967SZ3E-06i .1342092SE-96i&-.4722733SE-Obt .aj03000E440t ff00?0EoIv J00 01~&-.1742475GE-99, .20046602E-099 .090 E0 ''fe00E+f0i& .00000000E+0.00 al + .1367143ZE-13, *:300E+OO00tt .0m004OE400, .00S006EM~, .00009IE400, .9006 EM0/DATA A15~EIC/t .b5587749E.03.l-.59710137SE.04t .4127Z7169E405,-.41'333^57'E405,& .3711Z4890E+e5t-.I2L793#48'E+fl5t [email protected]& .372L59:38OE40I 1-.185ZISSE+I1 ,-.76937575E-OI, .00O000E+40i
4 I~~~~~~~~~~-.47149'69HE-Hi 2S4EiZ-5Z41#-T,.5393-& .90'E~ ,U~ 40-4'30E~~ 5~84Ei7& .0009~Ei,.~jl~4~S 09E4001 .Jij00#0#E+4@j& 5603Ee~.~3&E~ .00MO~ .4E4 0 * 60@E44i~& .I0002E406~ .,1 '1E40H- 17O5O7El40i& .6HOM0~E.Q00 .401MUEM,9 .60000066gE+00, .001i#0001E461
133
DATA AISEIDI.926#4244E+#3,-.864#1176E+04v .3'156753&E+#5i- .558Z%94E+f5t
9-.2.461745SE-02i .5473)69'37E-01i- .57L'542'36E-01. .z67196'j6E-R?~
& .43694527E-06i .9NZUaj l:."!E~ft , JHg*I9JE+O0,&*.1437Gl57E-O~p .%67974FE-09i *~Js4e 3~~40& *0000gsE40, .9.Z)i'CJffE-+00t.I 00O40 400P .e00IMEME, S4+1, .000000E+i00/
DATA Al.5EIEl&.16539189E404,-. 149678SE445, .5305?558E+05,-.91498270E+05i&[email protected], .147&4374E+,l-.6l67i'EHO1,& 1#769:359E+02,-.629'7783'6E401, .31091440E+~00 3vGO~E+0 v
&-.28883011E-9Z, .70'L1398E-02,t-.118769,ZE-O1, .68525515--02& *I0OPME4f, .490000EiJ .26828716E-05t .115161Z76E-05t&-.15449315E-65i .~0 E40906O? *0000E+Oot .0000E~0,9- .29812134E-08i .59'155904E-09i .000 E0 .000000E+40it .90e00HOEW, MI~lOE+J0t .946445S1E-1Zi .0g100E00,O~& .01#00306E+99, *.I000BB06~ 0*000940#E+10, MOO00E400DATA At.5EIF(& .29139264E4041-.18792246E.05, .67729056E405,-. 11818'Z:E+(Jb,& .9966526SE4051-.3Z7OMt1E4~5, .28423329E+O1,-. 15CO7Zb8E+02Pt .Z893Z:.324E4S2,-.2173S" 31E. ', c.058370"LE401i *G00000E+00
& *g000040 , JEOOPMeE400i .18265's1E-05t .1956S276E-45i
&-.Z7468:373':E-08i .36785770E-09t G7-E+ 33?OO0Eq0t& *00060E4g6 900b+0, .99517707E-IZt JURIE00.1*S00000E0, .9000000EMg, .000604We, .00i09E+05I
DATA AI.5E1G/t .2S4900J53E494v- .Z6965649E+05i .9&884)37tE4@5,-. [email protected]& U23863563E+06,-.44587107E+05, .57t496'SE+#lv-.Z7405519E4qZfI .5175S4G9E.IZ,-.:675765;E+02, .7I29.QiE4011,',fOE+#&- .6859e499E-gZ. 7v 32-I ~ 34~7-1 .10,99918E41t& *10la99EeMs, .009HOE~ff .73.'972e3E-fiv .85733339E-95i&- .59460:357E-05t .0R'7fO0E+Oe, .900E01Wo9-. 118424i27E 107i .%33616SE-09t .*9,,I#E+0v .0 ZE+Jfv& 9004149 .0520E MI .5.4787,8NE-1, JlEt&, .00OUE1, * f091E+46t IV g3;g4I * M1 EM/DATA AF'%IH/
&.77265'91E+4t-.- 214IIP1E , .47548E402? ;~I~f
&.59782166E-24i i OPE4fb .V00099E+00, .900000IE4G9
134

&.00000400E+011 .00 E+9, 3 C9j4E-j MiLME M/0
DATA A15ElIII&.47390746E404t-.43051544E+05o I153Z7183E+0Si,2648Z74E+016t
I .3869.Z59E40')i-. 1736934E+J3, .454?9131E41S2i X009E+00& 659059E-0- .71933IE-Z-. 141317E-91 - , M727E-2it 9 . 0 80E400, .4000MEM, .70'S62A63VE-05t .27444919E-04it .17727124E-04i .00ECODi 0 0, 00E~ .e9iMiE4I,&-.233579?64E-7-:)26309603E-97, .900E901940& .0000JOO~E+90, .000E449, .240503WE-10, J~l M+;&.06000000E,06i .40 0E+OJ0, .00E4001 J9J0E+Ii&10/DATA A15EIJI9-.13825M5E4131 I12I7I563E404t-.I947an96E404t M9843*40E+0l3,I .0000009EMP9 .00000E+00t-.97 33Z943E400v .16383971E+01i&- .954382383E+O0# .900 E49, .M0E00, .950ME+00,.59334:393E-03i .14846428OE-43i otj0jE400j~ E4
&.980104JOE 9 406 f090#E+d,-.667721E-f6t 00000Ee011i&.9000,300E49,0 ~ 049 90E, .0 E90i&.9000010E00, .000900EM,9 C gt)ME+i, .000OE0iI.90000JOSE+0, .00.9050EEM0, .a000E+990J16f094I0E411, .19000HE+48, . 900000E+00 .0990v99E+90I
CDATA PI5EI/ 2331i 25.ft 27.01 Z9.9, 31.01t 33.91 35.61 37.01 39.01 41.0/
DATA AI.5Htt .019 .181671 .18667t .211671 .28331, .208331t .223331 .223331 1239001 24'500i .246671 .255061t .267i .279311 .281671 .288331 .'193331 .999991t .31900 .321~91 .999991 .333331 .3601 .999991t .36091 .99999t .99999/
IF ([OPT GCE. I *OR. [OPT .LE. 5) GO TO 456CALL ERROR ("IOPT ERROR"," IN C5A)RETUR~N
C
451 GO TO (519,699,799,800991, IOPTC
13 5

CC C5A CLIMB TIMEt RANGEi FUEL COMPUTATIONSCC V1:GWJT Vi2:INIT ALT V!Z:TERM ALTCC AT 500 OUTPUT V TIME TO CLIK1D (MINUTES)C519 CUSrAMAI(Vi 354.)
PAS:-VZTD:20.PAT:V3PAS=AAfA PASi,,GWT:GWS- ((.0OI'Z5*CWS-.Z3775)4PAT)
IF (0GT.0T.331) .OR.(W.GT.770.) DOR.I (GUS.LT.350.l.OR.(GUS.GT.770) .OR.9 IPAT.LE.PAS)) GO TO 11111TIMES =0IF (PAS.EQ.0.) GO TO 550
TItNES=POLL1 (Al5CT'Zt5,5,POLLT (AI5CTI ,5#GWSPPAS) ,TD)TIMES=AMAXI (TIIIESiZ.5)
550 IF (CI)T.L.T. 690.) GO TO 575GWT:CWT- 130.
575 TESTGU=4WTTE4P=POLLY IAI5CTI ,5t5tGUTiPAT)TIMET=POLLT (AI5CT~v5v5tTEMPiTD)TIMET=AA1AX1 (TIMETt4.5)V:TIMET-TIMES
IF (IV.LT.#.).OR.(V.GT.55)) GO TO 22221'RETURN
CC
rC AT £61 OUTPUT V =CLIMB RANGE (NMS)C619 CWS:AMAX1(V1/Ift 35.4)
PAS:VZTD:26.PAT=V3PAS=AMAlI (PASt6.)GWT:GWS-((.012c.CUS,-.2375)*i.I.PAT))
IF (IGWT.LT.3':15).SR.(GUT.CT.77.k.OR.t (GWS.LT,35,) .0R,(GWS.GT.77J.OR.
& IAT.LE.Pk.)) GO TO I1111RANGES:0.IF (PAS.EQ. D.tl CO TO 650
RANGES:POLL A15CRZt5,5?POLLT (AISCR1v5t5vGWTtPAS) ,TD)RANGES:AMAII (F~md ESv'Z5.)
659 TEMP:POLLYfAI5CRI ?p5'GWIpPAT)RANGET:POLLI (A1JCR2,5,5.TElPTD)
136

V :R ANGE I RAN GESIF ((VLT.0.).OR.(V.GT.55f)) GO TO ZZZ'Z
RETURNCCC AT 7980 OUTPUT V CLIMB FUEL 11100S OF LOS)C709 CUS=AKAl (Vli 354.)
PAS=VZTD:20.PAT:VSPAS:AIIAXI (PASi9.)CWT:CUS- (.0I25*CWS- .2375)4PAT)
IF ((CUT.LT.3 5.O.R.{GWT.GT.770.LOCR.& IGWS.LT.350.).OR.(GWSSCT.779.k.OR.t (PAT.LE.PAS)) GO TO 11111FUELS4,IF (PAS.EQ. 0.01 GO TO 150
FUEL$ :POLLY (AI5CFZ,5,5; (POLLT (AI5CF) ,5,5,GWSPAS) ) TDIFUELS:=AAXI(FUELS p2.5)
759 IF (GUT.LT. 691,) GO TO 775CUT=CUT-51.
775 TESTGU:CWTTEKP:POLLT (AI5CFI ,5p5vGWTvPAT)FUELTzfPrLLU4AL5CFZ,5,5, WOLLYI A15CF1 ,5iS1CUSrPAT)) tlD)FUELT=AIAI(FUELT,3.5)V=FUELT-FUELS
IF (IV.LT.0.).OR.IV.GT.55.J) GO TO 22222RETURN
CC
C C5A CONSTANT ALTITUDE CRUISECC VI:GUT V24 ACHI V3:ALT OUTPUT V =1009 LOS I MINC800 CU AMAXI(VW,54.)
AMACH z :
PA : Q3IF (PA.L.T.0.0 .OR. PA.GT.45. DOR.
t PIMACH.LT.9.2 .OR. AtACH.GT.9.9 .OR.t CU.LT.350. *OR. CW.GT.775.)& GO TO) UiilDO 859 J =~ Ab1I: J-1IF (PA.LT. PtqEI(jll GO TO 875
859 CONTINUE875 TI=POLLT(AI5El(II(6,6,AflACHCWI
137

TZ:POLL!IA15E1(l,141) 16?61AKACHICW)Vz11 4 IPA-PI5EI(1)) * (TZ-TI)/(P15EII14I)-PI5EI(I))IF (Y.LT.9. DOR. V.CT.50.) GO TO Z2ZZ
V :TAP(AACH#PA) / VRETURN
CCC C5A RENDEZVOUS HOLDING FUELCC V1:CWT 113:ALTC OUTPUT V =19 LBS/KIN
909 CUT = AfAX1(V1,354.)PA =V3
IF (CUT.L.T.356. .OR. GUT.GT.775. .OR.I PA.LT.0 OR. PA.GT.45.) CO TO 1111100 920 1 :1It9
IF (CUT .E. (320,410.)) GO TO 949V920 CONTINUE
949 D0960 1:=It3
IF IPA .E. (Q5.41440)) GO TO 980969 CONTINUE989 V = A15HCJtKl
IF (V .LT. 9. .OR. V GCE. .99999) GO TO Z222RETURN
11111 PRINT.," IOPT z"wilOPT," CUT ="1VCALL ERROR (" IIWUT"," C5An)RETURN
22222 CALL ERROR ("OUTPUT ERR","OR IN C5A"IRETURNEND
CCC 4
CCC
SUBROUTINE C1413 (VltV21V3vIOPTPV)CC
DIMENSION CA!.A(163,Ib6,83016),HFSDIMENSION EIAfl,))EIB(16vhFlC(8bE1DIl6)
DIMENSION EIEI!W)EF(6)tECIb),EHII6)DIMEN&Il D1 ZD2()O3I)DBZ3
13 8

CEQUIVALENCE (CIAtCA(iii) i (C'dAvC(I2))EQUIVALENCE fCAiA(f3) (E(1,1tD1EEQUIVALENCE i H(I p2) PD2B)) (DI: (I13) 1D3 L)
EQUIVALENCE (EI~vEI(1t3)) t (ElDtEI(1ItZfEQUIVALEiNCE vEEE(,f (EIFEI(Iv4))
EQUIVALENCE EtEIE(107)) (EIH#El(li8))
C CLIMB8 COEFFICIENTSC
DATA CIA/&.418M952tE+02,-.533I~l4^;E400, *ZI07t8OlE-OZi- .275654'LIE-O'it&-.867648421+61, .1113544'ZE+O0,-.436 0'37tE-C3,t .57718W9E-46& .44b968324E+00,-..56370250E-#2# ZZ8I0-4-.9948-~9- .bb48389E-02t .84090Z84E-04i- .30vZZ8785)E-06p .46018632E-99/
CDATA CZA/& I@G035453E+03i-.9452I497E+0f, .19945,408E-0Z,-.:3 6946845E-06,&-.19226782E+02, . I7217714E0i1-.668?14DE-03,t-.106451ZE-06,& .79821147iCE+00t- .560573E-02t-. I06S9911E-05t .26085471E-07,&- .90t31 I E-02i .45376HE-44 .ISZ715E-06y- .51003139E-091
CDATA C3AI
&-.63f333q#E4t .874443#3E-Ql r-.4V52320#E-03r .5825741IE-06i& IfQ373707E+#Ip,-.I14I34949E-flp .69608771E-04v-.97L'9575E-07r
M &~~~~~-.48141505E-OI 78lt-3-3IS65-5 .4603S933E-08i& .55"5559E-03i-.8I4iZ5Z0E-05i .37446^)03E-07#-.44546775E-1I
CCC OUTPUT PARAMETER LIMIITSC
DATA D1DDZBPD3BI go, 40o .# 2a 40o *.t 13.41CC CONSTANT ALTITUDE CRUISE COEFFICIENTSCC A:25M B:27l C:29M D:31MC E:3^)M F:35l C:37fl 1:39MC
DATA EIAIt .39144'347E#03,-. 15574907E404, *Z4064998E+4,-,I Z90I585E+f4,9-.37641944+01p 16&77557E+4bZ-.11500Sl47E+0Z, .1Z568017E+4Zv& II196I6E-lIi,53777762E-iqli C5950771E-0h,-.4!049'L6IE-J1v&-.85304424E-05i .45865470E-f4-.79I39,09E-@4t .43972623E-04I
139

DATA EIBIt .5169ZL412E+934t-.167Z3ZL54E+04i .186331207E+04,- .48?76804E403#t-.65156544E.0,.34OZElt,.~625+2 .:5415492Eiflpt &28b67ZE-Oli,1033Orj44E+0Ov, IL"490801E+Ogt-.452744'04E-Oltt-.35491:305E-04i .13S')80b7E-03,-. 16990Z71E-0'7t .64497096E-04
DATA EirIt IL8949-557E403,- .6958ZO5E+OJ3,&-.50477516E+O1v .17634" 5E4ir197ZI525E+02,l .6944Z19EMiJ,& .258'22704E 01, .10275986E+iJi, 1Z63E0,.587E-,&-.46238875E-04# . 16510b347E-ai3,-.'2Z18564ZE-03i .98219017E-04/
DATA EID/t .21f70841E+04,-.i004Z57ZE4, *133l0497IE4#5,-.U442359E+4,
&-.2~%a7E4Z, IU85#585E+~l3,-.1S79071ZE+03, .91879841E+02t& .13199537E+O ,-.5853 600"E410, .8b239993E+00,-.42290730E+00,t-.19004180E-03i .844115Z5E-03y-.1Z45Z789E-OZi .6109129ZE-03/
DATA EtEI& .96574555E+03t- .:1155S06E~iJ4, .35877409E+04i-. 14375898E+f4,&-.16021:38SE4029 .5757le55E4dZv-.6S&774038E.0Zi .26970186E+02P& .83720121lE-01,-.*J189ZL526E4JS, .40158S)49E.00,-.16752'59E+a0,&-J119:367E-03, .54454306E-f3t-.7007958&E-03# .29909214E-031
DATA EIF/t .225190I03E4i3 .2177l855E+03v-.1311l54Z6E+@4t .92519815E+03,9-.64746063EW1, .14899445E4aZ,-.58683456E.01 ,-.31632.492E401,t .4Z7317OZE-Olo-.399Z524E4q0, .14306b786E+00,-.453219795E-O1,&-.77190006E-04i .27475383E-03w-.31$785GbE-f3v .1I2081834E-931
DATA EIG/t .87S08213E+#4,-,28376I09E+fJ5, Z28571Z35E+05,-.837'&4016E+04,&-.14900194E+Ga, .513876Z1E+03),-.56633'8E+03, .19514269E+03,t .8l464l75E.O0t-.Z89440'Z7E+O1, .33S1390)3E.01,-. 127Z6897E+O1,t-.138B7:352E-12, .5122Z43ZZE-OZ,-.6168Z0665E-0Z, .24391291E-OZ/
DATA EIH/t-.53651017E4@1, .:3l1569176E4r5-.556409E495, .321389Z9405,t .b1113514E+0Z,- .3)S126ZE443t .71S3330E.032,-.415713>53E+03)It-.21370924E401i .146X" 12E401-.ZB8613717E401, .1720862SE4I1i.2202792LE-03't-. 7S.:LJ4E-i 35UE-2.45IE9/
DATA FI/ 25.o 27. Z9.v 31.p 33.o 35.p 37.p 39.d
DATA HFFI .121671 .1-33331 .143331 .15661&.168331 .178331 .193331 .20833I
140

CIF IIOPI .GE. I .OR. IOPT .LE. 5) GO TO 1000
CALL ERROR ("lOP! ERROR"," IN C141B")RETURN
CC1#00 GO TO IIs,~0If,291B) OPICCC C1410 CLIMB TIMEt RANCEt FUEL COMPUTATIONSCC V1:GUT V3:INIT ALT V3=TERM ALTCC J:I OUTPUT V =CLIMB TIME (MIN)CC J:Z OUTPUT V = CLIMB RANGE (NM)CC J:3 OUTPUT V =CLIMB FUEL (160 LOS)C1164 CM ANAX1(Vto14t.)
PAS V2PAT V3lCUT CU - ((PAT-PAS)f.6909431CU)
IF (CW .LT. 141. .OR. OW GCT. 349. .OR.t PAS ,LT. #.4 OR. PAS GCT. 45. .OR.t PAT .LT. 0.@ .OR. PAT GCT. 45.) CO TO 11111TI 2POLTY(CA(IYJ)i 41 41 CU, PAS)TI AMAXI( TIP 6.0)TZ POLLY(CA(ItJbt 4y 41 GUTPAT)Y (T2 - TI)IF (J.EQ.31 V = .98 # V 4 .97IF (V .LT. WW(I, .OR. V .0T. DB(Z.Jl) CO TO 22222
RETURNCCC CONSTANT ALTITUDE CRUISE COMPUTATIONSC
4C VI=GMT qY:flACHO V 140L OUTPUT V = 100 LBS/IN4. C
12ff CRU AMA~i(V1,141.)AMACH = ZPA =V3
IF (CR1 .LT. 141. .OR. CR11 GT. 340. .OR.t ANACH .LT. .2 .OR. AIIACH GCT. .8 DOR.
I PA .T. 9.9 .OR. PA GCT. 45.) CO TO 11111
141

IF It(J) .LE. PA) I = J
1250 CONTINUEY : POLLT(EI(II)i4,4,AMACHiGRW)*I1.4
IF (V .LT. 10. .OR. V .GT. 80.) GO TO 2222V : TASP(ARACHPA) I V * .97RETURN
CCC HOLDING FUEL AT FL250CC VI=CUT V2=XXX V3:ALTCC OUTPUT V 110 LSS / MINC1364 CUT = AAKI(Vtl,41.)
PA : V3IF (CWT.LT.141. OR. CWT.GT.340, .OR.
& PA ,LT. 1. ,OR. PA CT. 45.) GO TO 11111DO 1320 1 9 It 8J:1
IF (CUT .LE. (160,41.20.)) GO TO 134013Z4 CONTINUE1340 CONTINUE
V : HFFIJ)IF (q 1T.L . ,4R. Y GT .4W CO .ll.L.
RETURN11111 PRINT.," IOPT :",IOPT," GUT =',141" PA :",V3
CALL ERROR " INPUT"," C141B")RETURN
ZZZ2Z CALL ERROR ("OUTPUT ERR""OR IN C141")RETURNEND
CC
CC 111144114 t~it1111414***1444 *111141*1441~tt4|tttt~t~4*1C
CSUBROUTINE KCIA IV1,V2iV3tlIOPTvV)
CDIMENSION TKCLM7,3)iZ25(7,:)DIMENSION TKCRU(6,7),IkH(14)
142

CC KCIOA CLIMB COEFFICIENTSC
DATA TKCLMt 17.31 17.6, 18.3, 19.61 20.9, 22.2, 19.21& 118., 124., 127.5, 132,, 144. , 154.5, 130.5tI 8.6, 9.5, 10.3, 11.1, 12.5, 13.,7 12.01
DATA Z25/ 7.5, 8.6, 11.21 11.7, 13.4, 15.6, 15,6,t 48.51 56., 64., 73.5, 87., 99.5, 99.5,& 5.1, 5.9, 6.75, 7.7, 8.9, 10.4, 10.4/
DATA TKCRU/ 19.J, 20.6, 23.4y 26.0, 28.49 30.7,t Z.Z, 22.5, 24.91 Z7.1, 29.1, 31.1,t 18.1, 21.1, 22.1, 23.9, p25.7, 27.3,t 16.5, 18.3, 19.9, 21.4, Z3.9, 24.3,1 20.4 21.71, 23.1, 24.3, 25.5 L6.7,t 19.3, 20.5, 21.61 22.6, 23.6, 24.5,t 19.3, 19.3, 20.2, 21.1t Z1.9, 22.6/
CDATA TXN/ 19.6, 19.91 20.31 20.8, Z1.6, Z1.8, ZZ.5,t Z3.3, 24.11 24.51 Z5.3, Z5,8, 26.4, 27.1/
C~CIF (IOPT .CE. I .OR. TOPT .LE. 5) GO TO 1495
CALL ERROR i"IOPT ERROR"," IN KCIOA")RETURN
CC1495 GO TO (1595,15055,1700,1890), IOPTCCC KCIOA CLIMB COMPUTATIONSCC VI=GUT V2=INIT ALT V3=TERM ALTCC J I OUTPUT V = CLIMB TIRE (MIN)CC J : 2 OUTPUT V : CLIMB RANGE (NK)C
C J = 3 OUTPUT V = CLIMB FUEL (1089 LES)C15" J = IOPI
CUT :AlAXI(V1,248.)PAS :lZPAT V:3
IF (CWT.LT.i8. ,OR. GUTGT.591. ,OR.t PAT.LT.P1) CO 10 11111
143
''II

CDO 1559 1 It 7XK: IIFIPAT CE. G43,-iZ.}) CO TO 160#
1550 CONTINUE1604 START : 0.
IF (PAS .LT. 29.1 GO TO 1651START : Z25(KJ)
1654 V : TKCLM(KJ) -STARTIF ((V.LT.3. .OR. V.GT.23. ).AND. J.EQ.1) GO TO 2Z22IF (1V.LT.3. .OR. V.GT.155, ).AND. J.EQ.2) GO TO 2Z222IF (IV.LT.1.5 .OR. V.GT.14. ).AND, J.EQ.3) GO TO 22222
RETURNCC KCIOA CRUISE COMPUTATIONSCC VIGUT V2=XXX V3:ALTC OUTPUT V : 10 1 / MIN
C1704 GOT : AMAXI(V1,248.)
PA r V3IF (CUT.LT.248. .OR. GWT.GT.591. ,OR.& PA .LT. 2b. .OR. PA ,GT. 45.) GO TO 11111
CDO 1729 1 : It 7J: I
IF (PA .GE. i43.-1'Z)) GO TO 17491724 CONTINUE
4 1740 DO 1769 ! -1, 6K -- I
IF (GUT.GE.(36@+(4e;J)-(29iI)) GO TO 17801760 CONTINUE1780 Y : TASP(.82,PAl/KCRU(KJ)
IF (V .LT..2 .OR. V .GT. .5) GO TO 22222RETURN
CC KCItA RENDEZVOUS HOLDING FUELCC VI:GWT V2:XXX V3=1KCC OUTPUT V % :101 LBS I HIMC1IN CRT : AAXI[VIv'48.)
IF (GOT .LT. 248. .OR. GUT .T. 591) GO T0 1111100 1849 1 : I, 14J=I
144
180IF fOUT GE. (600-2011)) ('0 TO HJ6
1860 V :6.22/ TKH(J)IF (Y.1.1. .ZLZ DOR. V.G1. .32) CO TO ZZZZZ
RETURNC
1*11111 PRINT.," IOPT :"tIOPTp" 5G4r z"tVi,"PA :"vY3CALL ERROR (" INPUT"," WCOWA)RETURN
22222 PRINT.," IOPT :"1Jt" CWT :'WI," PA ="4130" V, =")vCALL ERROR (" OUTPUT"," KCIi3A")RETURNI END
CCV ~~~CC
C
C
DIMENS1I)N AZC8A(36h AC9A(36) 1AZClfA(36)DIMENSIO3N AZF3(3tllb A'ZFZ(414v2)DIMENSION FZFI(10), A'LHl(417tZ)v AZFI(7v3tl6)
DIMENSION AZFIA(7,3biA'FIBI7,'),A'ZFIC(7,3hvAZFID(7,3),
k&A2FlO(/,3)tA2.F1P(7t'3 ,AZF1I7,3)EQUIVALENCE (21~Z1111)(Z1t2111Zl
& (AZFlCAZF1(1,1,7)),(A2F1HA2'L1(1,1,8)),
CC CONSTANT ALTITUDE CRUISEC
DATA A2FIA/ .70390E+02P .15779E+03,-.:34584E+03,- .2265')E+03,& .5'2343E493i-. 1514'lE403,j 0.00
t [email protected] 4E-og *.009 .39967E-03, 3JL-2,.29E: .7562ZE402i& .9178JEiZ1-.732ZZE-0Zt 0.0DATA AZF1B/ .Z511E+03v.5Z&458E403v .29179E402, .16933E+64,t -.11412E+04t .Z7593E+01vv 0.00i1 -.Z6611E401i .7116E401.-. l941ZE+OI,-.74513E.9btt .3922OE411i .14017E+Olp1.06
9 .6IZ8:E11,v-.39947E-#1, 6.00/I
14 5

DATA AZFICI 1Z/ 3-.94E2
-.1b640-.5404~ .17073E42t- .651CE4SZ,& .3!I8E4OZv-.91965E+0It 0.0
t .I3b71E-0#v-.5~56E-0Ii 0.0DATA AZ'FID/ .3754E+03t-.IIA&55E404, .155N3E4fI,-,95008E+03pt .701(14E-iO3,-.5893OE+03t 0.901
&-.31465E401, .8089SE4O1i *36599E-O0t-.18OC5E.O2P&.15781E+IZt-.Z314SE.Olt 0.6
& .14914E-00t-.83233E-01, COO/DATA AZFIE/ .Z&'ME403,-. 1017SE+04i ZIS87E404-.11785E+04v& -.395114E+93, .4:)93E+04t-.76,O.0E+03r
t -.14745E+01, .348478E401,-.1754S4E+01,-.45Z14E+0l,& ~-.41767E40,.Z46E@,-I1y+2& -.60467E-02i .18524E-O1l .Z1271E-@h~-.1Z3Z'9E+Oiv& .1324i0E-0i-.2'911LE-B1,-. l5790E-01I
DATA A2FIF/ .38353+021 SZS4E+03y-.5')5'LE+04P .30980E+04tt -.155,4E+04, .884,89E402t 6.001t -.46961E4011 .1G5CE+Ob-.3O75E46Zv .16853E+62f
I -.t2904E-Oly .*79415E-01,-.Iz'653E-Og,-.60159E-OZ,& .149LI3E-eS,-.85:378E-OIv 0.00/
DATA A2FIGI-.1485§E+0^7, [email protected]'148E+O4v .34'014E+94t
t .95392E-0Ot-.95819E+O1t .177'5ZE40Zt-.173008E+O2tt .17G47E+Ol,-.955Z5E+O1, 0.00it .43332E-13i .2924E-DI,-.46@E-O1,-.1909SE-0),& .ll9gJE+O0,-.&7919E-0Iy COO/DATA AZFIH/ *27JE+O'ot-.84408E+03t .181SZE404v-.1Z9b4E+4,t -.33791E403i .49613E+03t-,I2800E+O3vc -.1502SE401t *j7?8SE4Oz1-.j42g4E.O, .29452E+O1r9 -. 13479E41Z, WJ6Z4E+OZ,- .1649&E4VZf& -.8238.5E-02i .60915E-D1,-.9773Z ,E-O1,-.19848E-#2tt .845B2E-0ti-.Z2ZOSE-Ot1,17'244E-O1/DATA AZFII/ .3b995E+03,i-.3b6~E403,- .556^31E+O'3t .57W8E03iI .85MiIE+03? tb9447E+OZ,-J1I494E+O4,
t -.7210aE401i J11MPEOLY .79164E+Oty-.17946E40Z,s 66275E-f~v-.743~ZCE+Oh .14691E+ Llt .1O3EOf.169-l-605-i .10251E-Olp
4 t .8CZJE-0I# .1'19SZE-fi,-.16t39E-Uf1DATA AZFIJI.7?t 143t+ .:383"Z9E+O')i-.11309E+l4,& .Z311E+N,-.ZZiZ'E4O4# 6.00t
t .57355E-'J0.-.709C7E4O2, .1J907E+O2t-.i177E+O2Pt .1472,,E+Ct-.ZF971E+O1, C~9 -.87416E-Gli .3747CE-fUh-.1O66E4800 .96931E-91v& ~-.214Z:)E-f1,-.103f6E-B1 995
146

DATA F2F1/Z2,.0t Z5.0, 27.91 'OO ')Z.9tt 33.9, 35.6t 38.61 40.01 43.01IDATA AZF2/ Z.5lZZ[+Plv-7,j46&E401,t.45E~,~8ZE0
-1.35E4B~4.7214E+10-1.9ZZ"LE+'J1 -1.94E+iOit& 5.S9~E9Z1 S.47-~i-.Z5~E-~~ 2.5&6E-019
& -7.ISIIE-04, .ZZ46E-04i .~6-~-391E03t -2.2914E401f 1,00355E+01t 6.2QL23E+01,-5.7393E+0b,1 1.034E490? Z.711i2E4,0-3,19Eii-4.7Z7E+O'J,t -3.9468E-02i 2.1S-3-.35-I .9979E-giv
&2.6324E-64? 5.1179E-04? 1,1279EO3,3.4-3574E-03JDATA AZF31 8.584'iE-OZY 8.7513E-6lt , £.Z84E-05tt ^).97#92E-#Zt 9.3699E-Oit 4,47IOE-05/
CCC BEST ENDURANCE (CONSTANT ALTITUDEIC
DATA AZHI/ 1.6779E-6l, 4.U61E-4Pi 3.2904*-Obt-6.9689E-'i,& -3.291:3E-0Zt 5.7:37&E-0 t-2.50OZE-Obt 3.'4941E-0ltt 3.4754E03iy5. #775E-05# '.Z1lE-0#t-Z.49Z9E-lfvt -4.163')E-05i 1.6E9-524EV 3.2877E-I2vt -8.5514E-06P 4.9191E-8-1.Z&&5E-l~i 1.1*304E-l3tt 3.695AE-07t-Z.3'l80E-09t Z.3922E-12i 9.6055E-15it -4.0134E-09, 1.50J45E-11, 9.9h4E-lN,-4.'264'E-I6i
& t.Z338E-92,-1.0786E-03v 4.53&6"E-05i 2.475i0E-09t& 5.1107E-82,i-2.7877E-04i-9274E-7-7.474E-019i
I -8,9942E-04t 2.5439E-Obt 2.838ZE-09,+ 2.5999E-14i& -1.5661E-85i 9.36E-08, B.S267E-10t 1.3121E-lbt&-7.1696E-68i 7.3507E-09,-2,.9970E-11,-t.4'3Z'E-13t&9.1834.5E-1lt-ZL.1766E-1Zwi-5,4770E-13,-1.396'3E-15i& &6.3591E- 1t-9.3tZ5E-13,-' .5161E-15i 9.'Z6'bE- Ill
CC 281 KCAS CLIMB DATA (NRTiTElP BY0E 1C 8 =TIMEt 9 :RANGEt 10 FUEL MILAGEC
DATA AZC'SA/S.18842712E+12, .&1363G#7E+6l,-.55344857E400i 19261216E-gli
&.58Z5S6EB2,.1:2I37E-:3,.10564593E-05v .00000000E+l04t.7733321GE-52, .4778Z50'2E-O:3,-.19896540E-04 i~ 695-6
&.1164342'4E-06i .82801229E-01i .090WE+904&900010E+00t .c0g E+a- 7S1E9,.j043090E+00F1.01000POIE40P .6~060909E.i .000001E400v .00090E40tII
147

t.34485743E+92. .385183097E+0Z,-.3700,432E401, W1447979E+H,.&-.23552669E-92L .1:3631375E-04,-.14653)674E+91,- .,'S94'354E4OiyL.3677233E-gI,-.9a076950E-#03, .761295I16"E-f5p J.J'309E+09&.20797579E-OI 3I962-2-184t2-3 .13J431!.SE-05i
C.1364U22E-9&u .000CE+00,. J E4 , J.i+0&.388b7161E-06i .71928750E-0,, .0H9j04E 4'-@ 3,04001+t.10000010E+00, . 100O 43 -0+ .*Z01229E49i .I ti40VEi00ti&.99900011E+00t .90J0 003E400t *000000O3E4d0, *000000E400/DATA A2C1OAI
&.94779048E+00, .106107#7E40li ,94014545E-0lt .31Z70079SE-62i&-.44661'?42E-04p .22872G 4E-04t-.3)987ThZ27E-91 i-. 1541992Z'E-Olvt.10646246E-02,-.Z:3 4049'5E-04i .161C0743E-06i .00009000t.54313'148E-03i .S07674'L3E-04,-.32741814SE-05i .44iJ3338E-07i&.ssOO0 ae040 , .aOeO+0-3531E 5-0932-t,438177f11E-#8t . 00000100 .90000E4i~ .00E400S.89364845E-08i H8I3l83E-09i 00OJE4001 .0fW006E+0.@t
t.10000040E400, .93000 E+0iJ1 .92ZS0077E-Ih .000§00E09/,
CIF (IOPI.CE.1 .OR. IOPT.LE.51 GD TO 1950
CALL ERROR ("IOPT ERROR"," IN KC135A")
195 GO TO IOPT
C
CC CONSTANT ALTITUDE CRUISECC VI=GWT V2:HACH V3:ALTCC OUTPUT V : 1040LBS / MINC2310 CU = AMAXI(V,I90.)
ANACH = VZPA:= V3
2319 IF (PA .LT. 0.0 .OR. PA .GT, 50, DOR.t AMACH .LT. 0,Z .OR. AMACH XGT. 0.9 .OR.t GN.LT. 100, .OR. GU.GT. 3900.) GO TO 11111DO 2320 J 2p 10
IF (PA .LT. FJIF1ln GO TO023302329 CONTIIIE2334 TI % POLLY(i'LFl(lt1,I),7p3,AMACHGU)
TZ=POLLT(A'ZFI(1tlfI+I)t7,3#'AHACHtGUIT : Ti 4 (PA-FIFIII)) # (TZ-Tl)I(FZ(FII4)-FZFIlI))
148

IF (T .11. POLLY (A/lF2L(I 11 14p4iWCHiPA)) G ".340T POLl (flF3(vI1h3iT)CO TO 2:356
2340 IF (T.L1.F0LLY(A'2F2(1,1t2Zh4,4,AMACHPAfl GO TO 2250T POLI(AZF3(I,2b3.T)
2350 IF (1 LT. 14. .OR. T GCT. 80. GOCO1022222V =TASP(AMACHtPA) / TRETURN
CCC BEST ENDBURANCE (CONSTANT ALTITUDE)CI;C VI:GWT VZ=MACH V3=ALTCI C OUTPUT V: 10;30LBS I MINC2490 CU = APAXI(VI,100.)
PA : Vs'
IF (PA .CT. '30.0) I =2AMACH : POLLT(AZHlI1.1,1h4i7,GWiPA)CO TO 2:311
C 28GKCAS CLIMB TIMEtRARCEtFUEL (NRT)CC VI=CWT VZ=INIT ALT V3:TERM ALT 1CC OUTPUT V : TIME TO CLIMB (MIN)CZIN CU: A1IAII(VI,060.)
PAS = V2lPAT = V:3TI : POLLY(AZC8Ai6tbtPASvGU)12 : POLLT(Al2C8Ai46PATtGW)V =12 - TI
IF (V LT. 0.0 .OR. V 0GT. 60. 00C TO 22222
CO TO 2251
PAS :V'4PAT V-3fTI POLLT(Au4',6tPASiGU)12 POLLY(AZC' 'q6i6,PATtGU)V: T2 TI
149

IF (V LT., 0.0 D.OR. V ,Gl. 340. 1 GO TO ZJGO TO 2250
CC OUTPUT V : FUEL TO CLIMB (ISOOLDS)C2204 C= AMAXI(VtI,)00.
PAS : VZPAT V:3TI : POLLYI(ACI0A,6,6,PASGW)Z : POLLY(AZCI0Ai6,6iPATiGW)V = TZ - TIIF (V .LT. 0.0 .OR. V .GT. 17. G GO TO 22222
2250 IF (GW .LT. 100. .OR. GU ,GT. 306. *OR.& PAS .LT. 0.0 .OR. PAT.CT. 50. (GO TO 11111RETURN
CCC11111 CALL ERROR ("INPUT ERRO',"R TO KC135")
RETURNC222Z CALL ERROR ("OUTPUT ERR","ORt KCI35A")
RETURNEND
150

I
Appendix I
SLAM Validation
151

This appendix describes the procedure used to
validate the SLAM simulation model. Validation of the
SLAM model is broken down into two steps: (1) verifica-
tion, and (2) external validation. Verification insures
that the model behaves as intended and designed; this
includes internal mechanical verification. External vali-
dation tests the agreement between the model output data
and the true output obtained from the real world. The
validity of the SLAM model was only evaluated in terms of
the model's purpose which is to validate the analytical
model's output under the real world conditions of stochas-
tic wind factors and ground delays.
Verification of the SLAM model ensured that the
model produced mechanically correct results a:.d that the
results were calculated as intended. This verification
step was done independently three times during the crea-
tion of the model due to discovery of internal errors.
During the verification process errors in design and pro-
gramming were found and corrected. After each design or
programming change, the verification process was repeated
until the SLAM model output was verified to be correct
and the internal mechanical aspects of the model were also
determined to be correct.
The verification process consisted of two stages:
1. Verification of the random wind variables and
probabilistic ground delays.
152
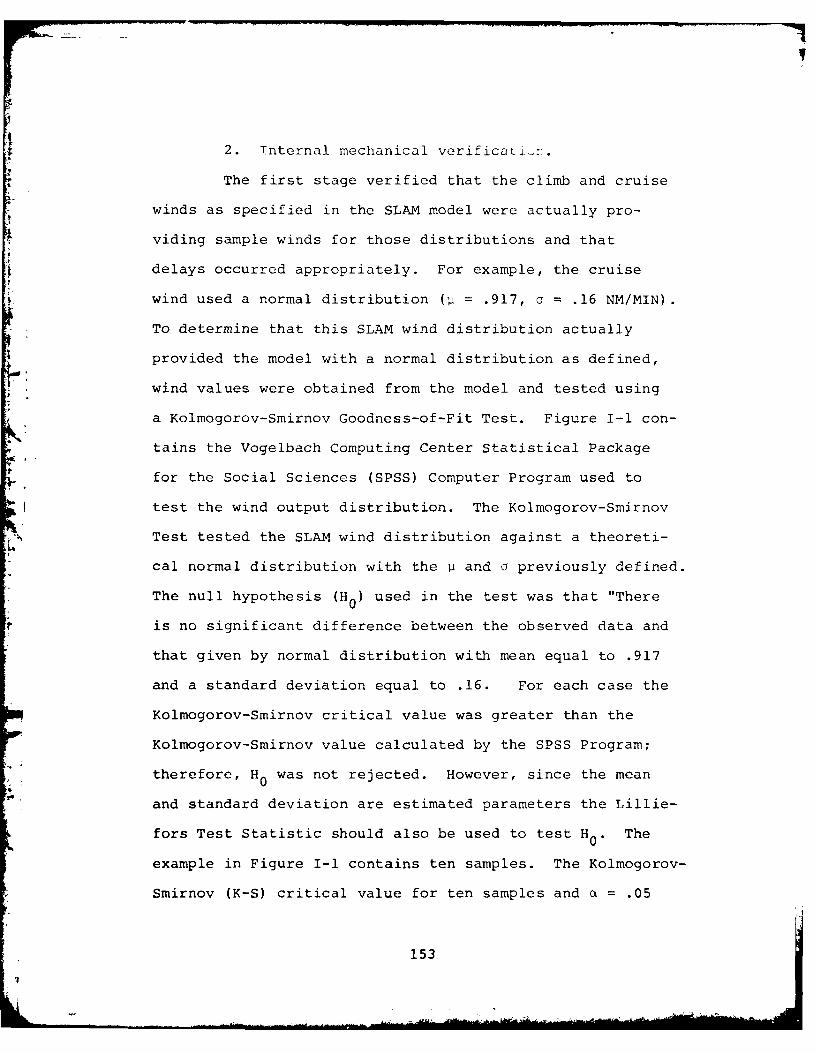
2. Internal mechanical verificatidr..
The first stage verified that the climb and cruise
winds as specified in the SLAM model were actually pro-
viding sample winds for those distributions and that
delays occurred appropriately. For example, the cruise
j wind used a normal distribution ( = .917, u = .16 NM/MIN).
To determine that this SLAM wind distribution actually
provided the model with a normal distribution as defined,
wind values were obtained from the model and tested using
a Kolmogorov-Smirnov Goodness-of-Fit Test. Figure I-1 con-
tains the Vogelbach Computing Center Statistical Package
for the Social Sciences (SPSS) Computer Program used to
test the wind output distribution. The Kolmogorov-Smirnov
Test tested the SLAM wind distribution against a theoreti-
cal normal distribution with the P and a previously defined.
The null hypothesis (H0 ) used in the test was that "There
is no significant difference between the observed data and
that given by normal distribution with mean equal to .917
and a standard deviation equal to .16. For each case the
Kolmogorov-Smirnov critical value was greater than the
Kolmogorov-Smirnov value calculated by the SPSS Program;
therefore, H was not rejected. However, since the mean
and standard deviation are estimated parameters the Lillie-
fors Test Statistic should also be used to test H0. The
example in Figure I-1 contains ten samples. The Kolmogorov-
Smirnov (K-S) critical value for ten samples and a = .05
153

VOGELBACK COMPUTING CENTER
NORTHWESTERN UNIVERSITY
SPSS -- STATISTICAL PACKAGE FOR THE SOCIAL SCIENCES
VERSION 8.0 -- JUNE 18, 1979
RUN NAME K-S SLAM WIND VARIANCE VALIDATION
VARIABLE LIST XN OF CASES 10INPUT FORMAT FREEFIELD
NPAR TESTS K-S(NORMAL,.9,.16)=XREAD INPUT DATA
GIVEN 1 VARIABLES, INITIAL CM ALLOWS FOR 1736 CASESMAXIMUM CM ALLOWS FOR 11336 CASES
IK-S SLAM WIND VARIANCE VALIDATION
FILE NONAME (CREATION DATE = 02/26/81)
-- KOLMOGOROV - SMIRNOV GOODNESS OF FIT TEST
TEST. DIST. - NORMAL (MEAN = .9000 STD. DEV. .1600)
CASES MAX(ABS DIFF) MAX(+ DIFF) MAX(- DIFF)
10 .2368 .1599 -. 2368
K-S Z 2-TAILED P
.749 .629
Fig. I-1. SLAM Wind Variance Validation; SPSS Programand Results; Kolmogorov-Smirnov Test
154

(Ref. Shannon, Systems Simulation: The A- znd Science,
Prentice-Hall, 1975) is 0.410. The critical value for ten
samples, a = .05 from Lilliefors (1967) is 0.258. Since
our largest deviation was .2368, we do nct reject the H0
and the wind distribution is validated under with the K-S
and Lilliefors criteria.
The second stage of verification consisted of
ensuring the internal mechanical operations of the SLAM
model were functioning as designed. To accomplish this the
SLAM Output Trace (see Appendix G) was completely analyzed
for mechanical verification. The items verified were the
time, distance, and the fuel calculations in the user func-
tions and the network portion of the model. The mechanical
verification of the ASSIGN nodes was accomplished for each
node. For example, in ASB (see Appendix K for SLAM descrip-
tion) (Yokota Scenario--C-141/KC-135) the C-141 cruise to
rendezvous point fuel consumption is computed in USERF 13
as 19,300 lbs. and this fuel is added to ATRIB(4) , airlifter
total fuel consumption. Looking at a SLAM Trace (see
Appendix G), ATRIB(4)'s value prior to the completion of
node ASB was 11,280 lbs which represented fuel consumption
up to that point. Upon departing node ASB, ATRIB(4)
equalled 30, 650 lbs (11,280 + 1,936) which was determined
to be correct. Throughout the SLAM model each node was
verified in this way to insure the results were mathe-
matically and functionally correct.
155

The second stage of internal mechic_4.cai verifica-
tion was the verification that the SLAM discrete event
simulation was providing the SLAM network model with the
proper input information. This was easily verified by
assigning SLAM input parameters, such as aircraft ramp
fuel and takeoff times, calculated by the analytical model,
to global variables in the discrete part of the SLAM model,
node EVENT 1. These input values are then made to print
out on the SLAM Trace as they are used in the user func-
tions. The agreement between the input values assigned to
global variables and those used in the user functions was
100 percent. Therefore, this verified that the SLAM net-
work model was indeed using the proper input parameters
defined at the start of the simulation. By verifying the
SLAM network input parameters by this method, validation
of the input values themselves was not necessary; only the
verification that they were transferred correctly to the
user functions as required was necessary. Since these
SLAM input parameters have been previously validated in
the analytical model, it can be said with confidence that
the input parameters for SLAM are not only verified but
4 also validated.
By insuring that the internal mechanical function
of the model is correct, a significant degree of confidence
is built up in the model. If the model could then be shown
to predict flight plan fuel consumptions correctly, then
validation of the SLAM model is completed.
156

To validate the SLAM model, the i:'tparameters
computed for the analytical model, which have already been
validated against real world data, were used to manually
compute total fuel consumed for each aircraft. This was
done for each aircraft combination and each scenario. The
fuel consumption figures using SLAM compared to manual com-
putations are shown in Table 4. As can be seen, the total
aircraft fuel consumption SLAM figures are within 7 percent
of the manual computations. These reassuring results
increase the validity of the SLAM model.
The verification and validation resulted in
increasing confidence in the SLAM model. When the analyti-
cal model verification and validation processes are
included the models have been validated to the point where
experimental data can be obtained and used with confidence
over a varying range of input parameters.
The final validation of FLTPLN was accomplished
using the SLAM model. The FLTPLN output (fuel loads,
distances, takeoff times, etc.) was entered as SLAM input
parameters and SLAM output (total fuel consumption per
aircraft) . Figures 3 - 6 show the percent deviation
of the SLAM fuel consumption mean compared to the analytical
model fuel consumption '.alue. A negative value means that
the SLAM model used less fuel than the analytical model and
a positive value means the SLAM model consumed more fuel.
The specific SLAM results are discussed in con-
junction with Tables L-1 to L-4 by aircraft. Generally,
157

the SLAM results for all aircraft and cac3i loads compare
favorably with the analytical results, which indicates
that the analytical data is realistic and can be used with
confidence. Overall, the tankers burned about 1 percent
less fuel in the SLAM model than in the analytical model.
Conversely, the airlifters burned about 2.5 percent more
fuel in the SLAM model than in the analytical model. This
difference in airlift fuel can be explained from the nature
of the two aircraft missions. The tanker flies to a
rendezvous point and returns to his departure base which
is relatively close compared to the airlifter destination;
the airlifter, however flies to the rendezvous points and
then continues on to his destination which is thousands
of miles farther than the tanker route of flight. Conse-
quently, the airlifter has more time to be affected by
increases in the wind factor, and these increases plus any
delay fuel consumption would cause the increased fuel
requirement. There are two reasons the tanker SLAM results
are less than the analytical consumption. The first is
that an increase in wind factor has less effect on the
tanker than on the airlifter. The headwind increase to
the rendezvous point becomes a tailwind increase when
returning to destination. The second is the difference in
the loiter fuel computations. In FLTPLN the tanker loiter
fuel is always based on a fifteen-minute loiter duration;
however, in SLAM, the loiter time is based on actual
158

aircraft arrivals which usually requires iez~ than fifteen
minutes loiter time. For the tankers, fifteen minutes
loiter fuel is more than the difference between SLAM and
FLTPLN fuel values.
The final validation of the model is subjective
and consisted of asking the question, "Does the output
data make sense?" Speaking as a MAC pilot and navigator,
the output fuel consumptions do make sense. As distance
between the departure and destination bases increases,
the total fuel consumption also increases. In the case of
the tanker, as the distance from the departure base to the
rendezvous entry point increases, total tanker fuel con-
sumption also increases. As the cargo decreases on the air-
lifter, the total fuel consumption decreases for each air-
lifter in each instance. Also, for a route segment with a
tail wind, fuel consumption decreases compared to a com-
parable route segment with a head wirnd. All of these
general ooservations from the data make sense to an opera-
tional pilot or navigator and none of them is counter-
intuitive. The result of these general observations by
professional aircrew is that the model validity is increased
and will help reassure a future decision maker or user of
the completeness of the research and the validity of the
resu~lts. By obtaining reasonable results, user concerns
about the details of the model or the methodology are
minimized.
159

.
Appendix J
Confidence Intervals
160

This appendix explains the methodology used to
calculate the 95 percent confidence intervals portrayed
in Tables L-1 to L-4, Appendix L, and provides a sample
calculation.
A. The results of the SLAM model replications for
a particular mission scenario, aircraft combination, and
cargo load were combined to obtain a sample mean. How-
ever, since they are only estimates, a confidence interval
K' surrounding the mean is a means of indicating the accuracyr •of the results compared to the true population mean. Given
the sample mean (x), the sample size (n), and the sample
standard deviation (s), a confidence interval can be
created using the t statistic. From the confidence inter-
val, with an upper and lower boundary, it can be said that
the probability of the mean being between the upper and
lower limits is equal to probability: 1 - c. Alpha (a) is
defined as .05, hence a 95 percent confidence interval
will be created. If normality is assumed (see Part B for
normality validation of fuel consumption data) a confidence
interval can be estimated using:
P (LL < < UL) =1- =1- .05 =0.95
where,
LL = x - tcrit * s // n-i ;
UL = x - tcrit * s/ /-i- ;
161

tcrit = critical values of t for r.- degrees offreedom; and
a = .05.
and where,
LL = lower limit;
UL = upper limit;
x = sample mean;
s = sample standard deviation; and
n = sample size.
From Hines and Montgomery (1972):
tcrit = 2.26 for a sample size of 10 with 9degrees of freedom.
Therefore, the confidence interval for a KC-135 departing
McGuire, refueling a C-141B with 55,000 pounds of cargo
with 10 samples is:
SLAM Mean (x) = 90,840 lbs.
Sample Standard Deviation (s) = 1,690 lbs.
tcrit * s// n-i = (2.26) (1.69) (1000) = 1,270 lbs.
x + tcrit s// 1 = 90,840 + 1270 = 92,110 lbs.
x -tt * s/i - = 89,570
Therefore, the confidence ixiterval is:
P(89570 < < < 92,110) = .95
162

B. Normality Verification. To compute a confi-
dence interval using the sample t statistic as in Part A
of this appendix, normality must be assumed. Using the K-S
Test, using Lilliefors' Statistic, normality will be vali-
dated for the SLAM output. Figure J-1 is the SPSS Program
and results for a SLAM run (C-141B /KC-135, tanker base
is McGuire AFB, cargo load is 55,000 ibs). For the KC-135
the largest deviation was .2368; since this is not larger
than the Lilliefors critical value of .258 (n = 10, a = .05)
the H0 that, "There is no significant difference between
the data and a normal distribution," cannot be rejected.
Therefore, normality can be assumed for the SLAM output
and the .t statistic can be used to create a 95 percent con-
fidence interval.
163
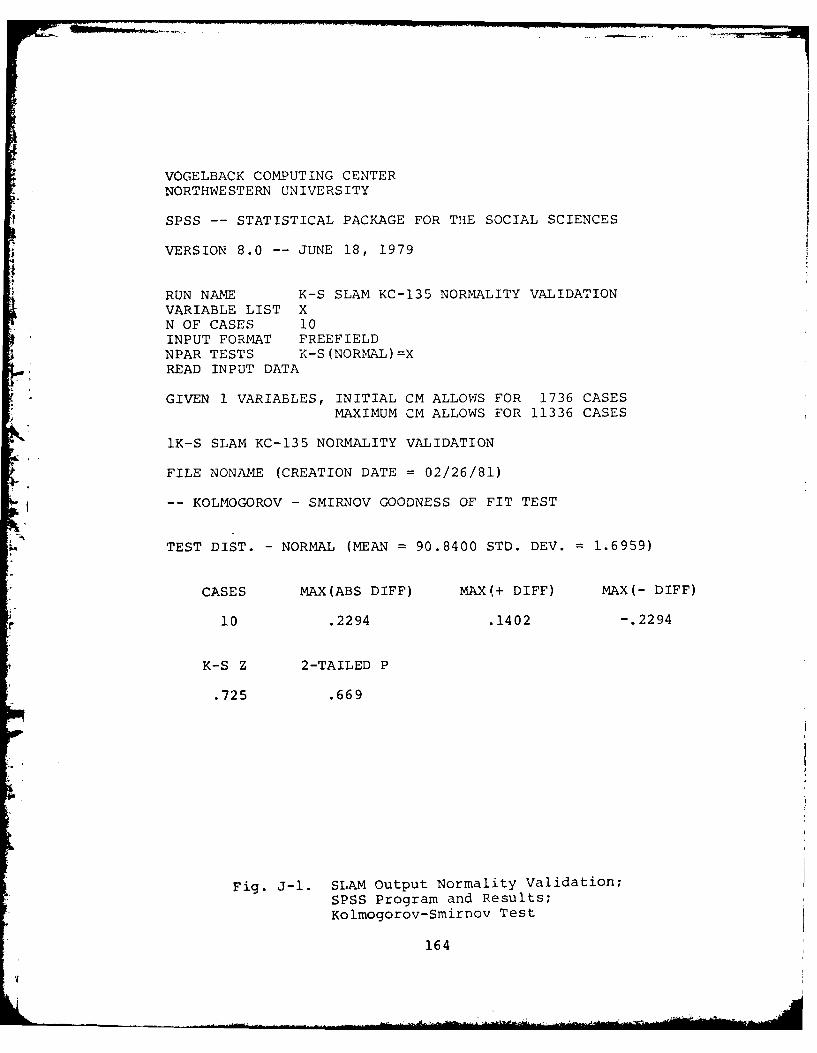
VOGELBACK COMPUTING CENTERNORTHWESTERN UNIVERSITY
SPSS -- STATISTICAL PACKAGE FOR THE SOCIAL SCIENCES
VERSION 8.0 -- JUNE 18, 1979
RUN NAME K-S SLAM KC-135 NORMALITY VALIDATIONVARIABLE LIST XN OF CASES 10INPUT FORMAT FREEFIELDNPAR TESTS K-S(NORMAL)=XREAD INPUT DATA
GIVEN 1 VARIABLES, INITIAL CM ALLOWS FOR 1736 CASESMAXIMUM CM ALLOWS FOR 11336 CASES
1K-S SLAM KC-135 NORMALITY VALIDATION
FILE NONAME (CREATION DATE = 02/26/81)
-- KOLMOGOROV - SMIRNOV GOODNESS OF FIT TEST
TEST DIST. - NORMAL (MEAN = 90.8400 STD. DEV. 1.6959)
CASES MAX(ABS DIFF) MAX(+ DIFF) MAX(- DIFF)
10 .2294 .1402 -. 2294
K-S Z 2-TAILED P
.725 .669
Fig. J-1. SLAM Output Normality Validation;SPSS Program and Results;Kolmogorov-Smirnov Test
164

Appendix K
Model Dlescription~
165
The experimental model consists of two models,
an analytical model and a SLAM model. This appendix
proviTPLa dtis aeFOritAn moe whih omputdsth
provides a dtidscFRiTiN mofe both oels. th
minimum fuel required to operate an airlifter and tanker
aircraft through the optimal rendezvous point for a spe-
cific scenario. Inputs to the program are:
1. The aircraft combination.
2. The airlift cargo weight.
3. The average wind for the scenario.
4. The geographic locations of the departure,
destination, and abort bases.
The program outputs include:
1. The coordinates of the optimal rendezvous
point.
2. The total fuel and all route segment fuels.
3. The takeoff fuel loads for both aircraft.
Additional parameters which are generated and used as
inputs to the SLAM simulation will be described later in
this appendix.
"FLTPLN" is the executive program calling several
subroutines to accomplish the flight planning computations.
The FLYME set of subroutines provides the fuel data base
166

for all calculations. The FORTRAN sourc :,:cde for FLTPLN
is listed in Appendix C.
The "FLTPLN" program begins by computing the maxi-
mum allowable fuel loads. This forms one boundary of the
region of feasible rendezvous points. A geographic point
on this boundary is defined as the rendezvous exit point.
A second point, 250 NM closer to the airlifter departure
base, is defined as the rendezvous entry point. These two
points define the rendezvous track. If the exit point is
within 400 NM of the airlifter departure base the entry
point is redefined at the distance flown by the airlifter
in initial climbout. Rendezvous is then planned when
25,000 feet is first reached. The exit point is redefined
250 NM downtrack. These rendezvous points fall along the
Great Circle course between the airlifter's d-parture and
destination bases. Subroutine RHOTHTA returns this course
and distance from the equation:
-= S [SIN (LAT2) - SIN((LATI) * COS (D)J
8 =CO SIN (D) * Cos (LATlJ
where,
e = the Great Circle course;
LATI = the latitude of the first point;
LAT2 = the latitude of the second point; and
D = the distance between these points computedfrom the equation:
I67167
_V

D = aDS SIN(LATI) * SIN(LAT2) + COS(LATl) *COS(LAT2)
* COS (T.NG2-LONGl)]
where,
LONG1 = the longitude of the first point; and
LONG2 = the longitude of the second point.
The geographic coordinates of these points are computed in
subroutine LATLONG by the equations:
LAT3 = SIN- [SIN(LAT) * COS(D) + CoS(IATl) * SIN(D) * OS()]
-l I (COS (D) -SIN (LATI) * SIN (LAT2)LONG3 = LONGl + COS L XS (LAT) COS (LAT2) 2)
All angles used in these equations are computed in radians
with the following relationships:
1. One degree of latitude = 60 nautical miles (NM).
2. One radian = 57.2957 degrees.
The fuels for the individual route segments between the
coordinates are computed using the equation:
FUEL = DISTANCE/GROUNDSPEED * FUEL RATE
where the distance is obtained from subroutine RHOTHTA, the
fuel rate is obtained from the subroutine FLYME data base,
and ground speed is obtained from the statement function of
the wind triangle equation:
168

GROUND SPEED = TAS * COS(SIN-I (W/TAS*S( .W-TC)))
- WV * COS(WD*EC)
where TAS is the aircraft true airspeed for a given cruise
mach number at the cruise altitude and is computed in sub-
routine TASP, WD is the wind direction, WV is the wind
velocity, and TC is the rumbline course between the points
computed in subroutine RHOTHTA. The wind is held constant
throughout this study at 2600 at 55 KNOTS. The fuels for
eight route segments are computed in the following order:
1. Airlifter rendezvous exit to destination.
2. Airlifter departure to rendezvous entry.
3. Airlifter rendezvous entry to departure base
for abort.
4. Airlifter rendezvous entry to alternate base
for abort.
5. Airlifter rendezvous track.
6. Tanker rendezvous exit to recovery base.
7. Tanker rendezvous track.
8. Tanker departure to rendezvous entry.
The fuels are computed in the reverse order from which they
are flown so that fuel loads determined for each route
segment are the minimum feasible to accomplish the remainder
of the flight. The fuel rate returned by subroutine FLYME
is dependent on the cruise altitude and gross weight of the
aircraft. A step climb profile is approximated by com-
puting the fuel rate at the average gross weight and
169
altitude for the route segment. These a'-rge values are
obtained by estimating half of the fuel to be used. The
fuel computations are repeated until the fuel rate repre-
sents the average for the route segment. Experimentation
with this process determined that the fuels converged to
within 1000 pounds at the second iteration, 50 pounds at
the third, and 2 pounds by the fourth. Three iterations
were selected for the averaging process.
* Climb profiles are computed for the initial
departure segments up to cruise altitude and the post-
rendezvous segments from 25,000 feet to the cruise alti-
tude. The climb time, range, and fuel consumed are
returned from FLYME and added to their corresponding com-
ponents in the fuel computations. The initial takeoff
fuel load for the airlifter is the maximum allowable for
the specified cargo load. The fuel to be transferred
from the tanker is the difference between the airlifter's
total fuel requirements and its takeoff fuel. The tanker's
takeoff fuel load is computed as its total fuel require-
ments plus the transfer fuel. All aircraft maintain a
fuel reserve to accomplish holding, flight to an alternate,
and landing after the final cruise segment. This reserve
is 30,000 lbs for the C-5A and KC-10 and 15,000 lbs for
the C-141 and KC-135.
After each fuel computation, the fuel load is
checked for feasibility against the current maximum fuel
capacity. Both aircraft must maintain sufficient fuel to
170

abort to the departure base or, for the z-i-lifter, to the
alternate base, if the alternate is closer than the depar-
ture base. If the required fuel load is feasible, the sum
of the route segment fuels, not including the abort fuels
is stored as a matrix data point. If infeasible, the
value 777.777 is stored in the matrix.
Next, the coordinates of the rendezvous exit point
are adjusted in five degree increments north or south,
whichever is closer to the direction of the tanker base
and the entire routine is recomputed. Five latitude values
covering twenty degrees are used. The latitude is then
reset at the initial value and the longitude is adjusted
in two degree increments towards the airlifter destination.
The five values of latitude are repeated for each of the
thirteen values of longitude covering twenty-four degrees.
The 5x 13 matrix of total fuel values is sorted and the
minimum value from the sixty-five points is selected as the
output variable. The fuel loads for both aircraft for this
point are increased by the respective start, taxi, and
takeoff constant and these values represent ramp fuel
onloads and are listed along with the planned transfer
fuel.
At this point, the airlifter takeoff fuel load is
decremented by 20,000 pounds generating matrices for ten
values of the fuel load. Only matrices which contain at
least one feasible value are printed and if no feasible
values are computed, the statement "NO FEASIBLE SOLUTION"
171

is printed. The minimum values for each £atrix are sorted
and the overall minimum fuel is printed for this specific
scenario, cargo load, and aircraft combination.
The initial cargo weight for each airlifter is the
maximum allowable cargo defined by operational or perform-
ance limitations. Two additional cargo weights are conr-
sidered. One weight is the lowest that could be expected
if the airlifter were filled with bulky, lightweight cargo,
and the other is the mean of the maximum weight and the
minimum expected weight. For the C-5A, these weights are
100,000, 85,000, and 70,000 lbs. For the C-141B, the cargo
weights are 70,000, 55,000, and 40,000 lbs. Three separate
runs are iteratively made at these cargo weights for a
specifiq airlifter and tanker combination. Since data was
desired from all fouz aircraft combinations, for a spe-
cific scenario, the combinations are changed within the
FLTPLN program. The combinations are listed in Table 1.
Thus, only the specific scenario must be changed to obtain
data for all four aircraft combinations at the six desired
cargo weights.
The SLAM model was used to verify the analytical
solution with the addition of two stochastic variables,
winds and takeoff delays. The SLAM model also determines
the flight times for each aircraft. The model follows the
mission profile shown in Figure K-1 and conforms to the
flight planning segments discussed in Chapter II.
Figure K-2 is the SLAM network description of the model.
172
. ... . .A ll .. .| .... . .. .. .. . a m
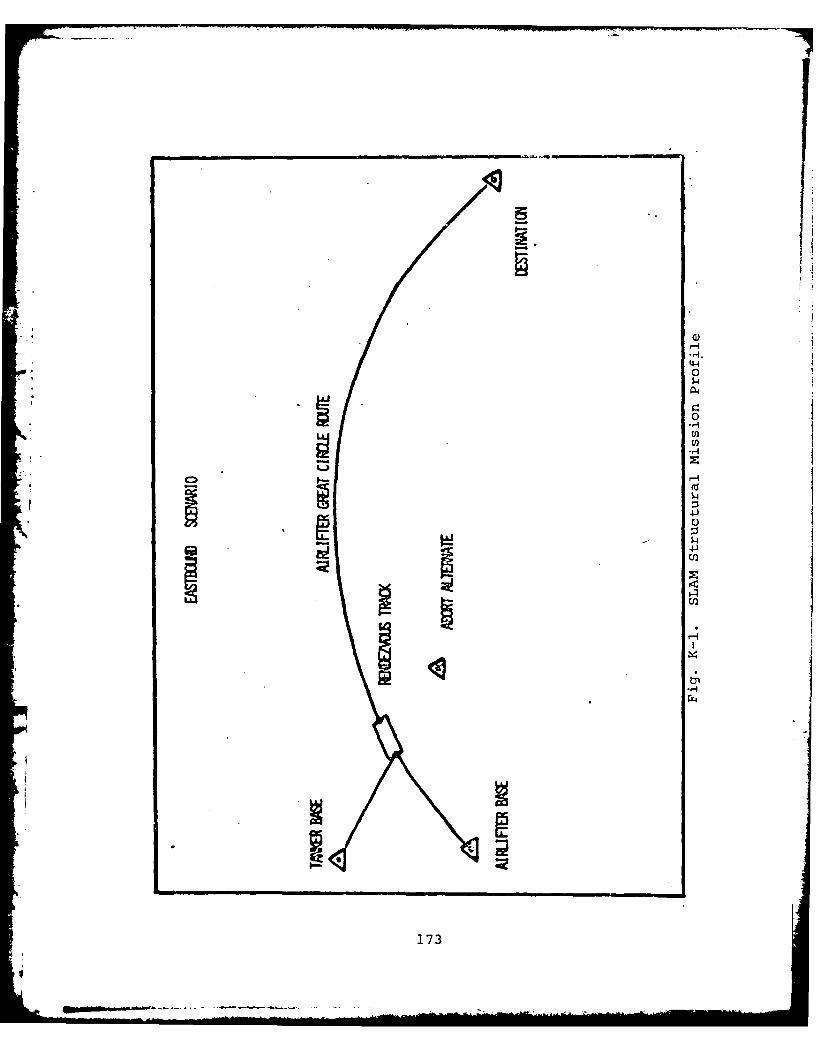
-I-*H.
00
sIn
0
U
173

pro-= =-I
1744

u"3
- "C I
wl -C4 X
II 00
O175

a--
4P
-I -V
~17
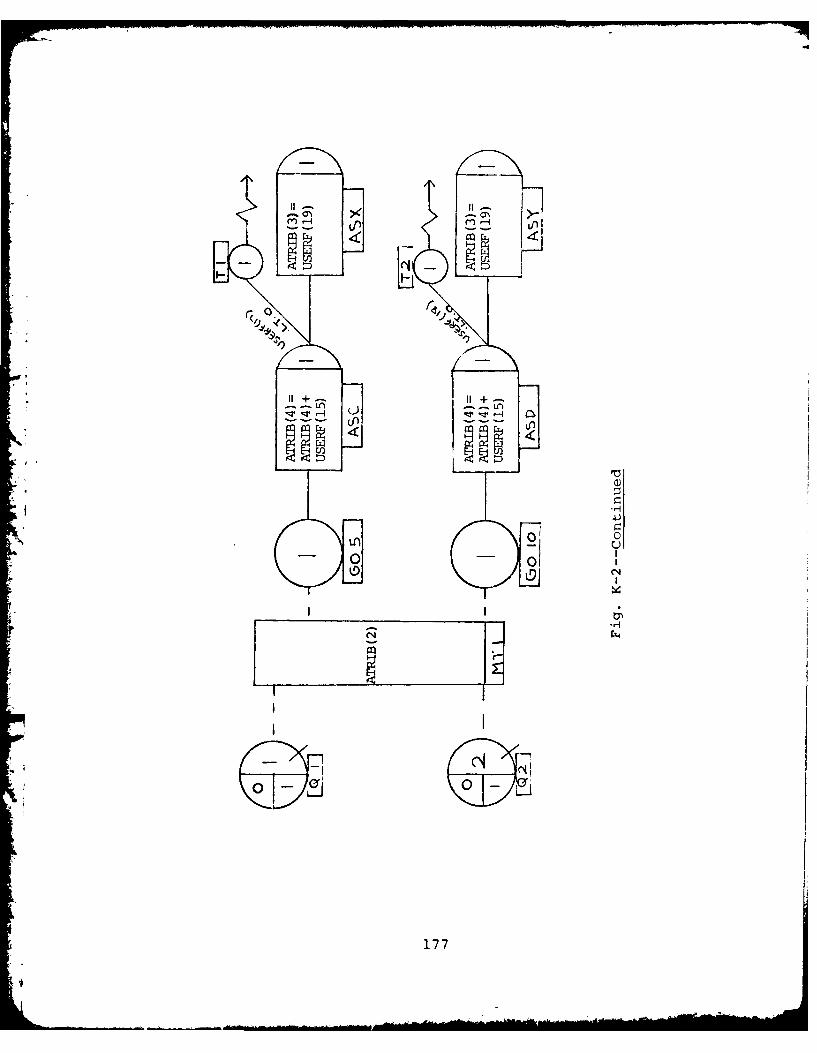
L
Id
r%4
LA 0
177
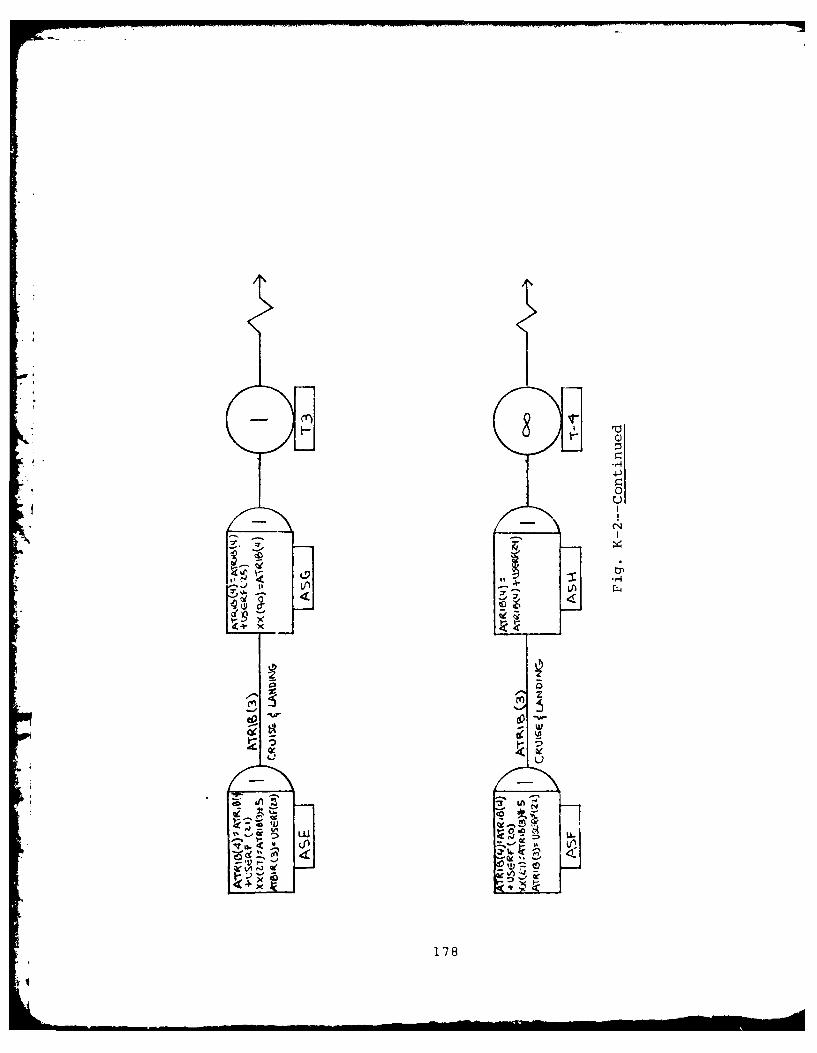
C-,
IO-I
x4 )fCI ,
'178

Afl-AlOl 137 AIR FORCE INST OF TECH WRIGHT-PATTERSON AF OH -FHO00-ETC F G 1/2OPTIMIZATION OF STRATEGIC AIRLIFT IN-FLIGHT REFUELIN.URAR 81 V P BORDELON, J C NARCOTTE
UNCLASSIFIED AFIT/GSTIOS/BIN-3 NL
3 1l3iilllilliIN
illiii~i4Z

See Appendix D for a description of SLA,, sp"rbols and con-
cepts. The model uses a combination discrete event-network
orientation to simulate the aircraft's flight and consists
of two parallel networks representing the flights of the
tanker and airlift aircraft. The output variable and mea-
sure of effectiveness is fuel consumed by the tanker and
airlifter. Only the airlift network is described here and
it is broken down into the segments of Figure K-1. However,
differences in the tanker network will be noted. An
in-depth nodal description follows the general description.
General Description
The SLAM model receives some of the input param-
eters shown in Figures K-3 and K-4 by calling the flight
plan analytic model (FLTPLN). The global variables (XX(i))
contain the initial conditions and other pertinent data.
Attributes 1-5 are used as shown in Table K-1.
The first segment of the model represents the
start, taxi, and takeoff phase (node AS1 to AS7 for the
airlifter and AS2 to AS6 for the tanker). Delays can be
incurred by each aircraft. A logic sequence (AS5 to AS7
for the airlifter) prevents the second aircraft from depart-
ing until the first scheduled aircraft has departed.
The second segment of the model represents the
initial climb from the base to the cruise altitude ana the
cruise to the rendezvous entry point (AS7 to ASX for the
airlifter and AS6 to ASY for the tanker). Included in this
179

XX(1) = Airlift departure to rendezvous entry point dis-tance.
XX(2) = Airlifter rendezvous exit point to destinationpoint.
XX(3) = Airlifter rendezvous entry point to abort basedistance.
XX(4) = Tanker departure to rendezvous entry point dis-tance.
XX(5) = Tanker rendezvous exit point to destination.
XX(6) = Transfer fuel.
XX(7) = Initial fuel load--tanker.
XX(8) = Initial fuel load--airlifter.
XX(9) = Gross weight of the tanker at time (t).
XX(10) = Gross weight of the airlifter at time (t).
XX(ll) = Tanker takeoff time.
XX(12) = Airlifter takeoff time.
XX(13) = Aircraft code:
C-5/KC-135 = 1C-141B/KC-135 = 2C-5/KC-10 = 3C-141B/KC-10 = 4
XX(15) = Airlifter takeoff delay.
XX(16) = Tanker takeoff delay.
XX(19) = Initial climb distance airlifter.
XX(20) = Initial climb distance tanker.
XX(21) = Arrival time of airlifter at rendezvous entrypoint (Qi).
XX(22) = Arrival time of tanker at rendezvous entry point(Q2).
Fig. K-3. Global SLAM Variables
180

XX(23) = Airlifter fuel consumption fror :edezvous entrypoint to abort base.
XX(24) = Tanker fuel consumption from rendezvous entry
point to abort base,
XX(27) = Distance traveled in the refueling track.
XX(31) = Airlifter departure base elevation.
XX(32) = Airlifter initial cruise altitude.
-: XX(28) = Time required in the refueling track
XX(33) = Airlifter cruise time from leveloff to rendezvouspoint.
XX(35) = Airlifter initial climb fuel.
XX(40) = Tanker initial climb fuel.
XX(41) = Tanker departure base elevation.
XX(42) = Tanker initial cruise altitude.
XX(45) = Airlifter destination fuel reserves.
XX(46) = Tanker destination fuel reserves.
XX(60) = Tanker post-rendezvous climb fuel.
XX(61) = Airlifter post-rendezvous climb fuel.
XX(62) = Tanker rendezvous exit point to destination time.
XX(63) = Airlifter rendezvous exit point to destinationtime.
XX(71) Airlifter cruise altitude to destination.
XX(73) = Airlifter average cruise altitude to destination.
XX(75) = Airlifter ramp fuel.
XX(76) = Tanker ramp fuel.
XX(81) = True course for leg 1.
XX(82) = True course for leg 2.
Fig. K-3--Continued
181

XX(83) = True course for leg 3.
XX(84) = True course for leg 4.
XX(85) = True course for leg 5.
XX(94) = Zero fuel weight of the airlifter.
XX(95) = Zero fuel weight of the tanker.
Fig. K-3--Continued
182

Ln H
1 0I w4I PH
9
-' .I0
LA
41
u FZF 4 iE4183
TABLE K-I
SLAM ATTRIBUTES SUMMARY
ATRIB(i) Description
(1) Aircraft takeoff time
(2) Aircraft conbination code
(3) Cruise time
(4) Cumulative fuel consumedfor a particular aircraft
(5) Aircraft identifier
1 = Airlifter2 = Tanker
NOTE: Attributes are numerical characteristicsassigned to entities (aircraft) traveling through the net-work simulation model. These attributes travel with a spe-cific aircraft and are unique to that aircraft. Thistable shows the attributes used in the SLAM model.
segment are fuel consumption calculations for climb,
cruise, and loiter times. The loiter time is the time dif-
ference between the arrival of the second and first air-
craft at the rendezvous point (Ql and Q2). The aircraft
fuel supply must be sufficient to return from the rendezvous
point to a suitable abort base, if the refueling is aborted.
The third segment (ASX to ASE for the airlifter
and ASY to ASF for the tanker) represents the refueling
maneuver and calculates the time and fuel consumed during
the fuel transfer.
The fourth segment (ASE to T3 for the airlifter and
ASF to T4 for the tanker) represents the route segment from
184

the rendezvous exit point to landing. Included in these
segments are time and fuel calculations for post-rendezvous
climbout, cruise to destination, and approach and landing.
At the terminal nodes, T3 and T4, the total fuel consumed
respectively by the airlifter and tanker aircraft are
printed.
Nodal Description
This section describes the mission profiles through
the SLAM model node by node. The discrete flight planning
model provides takeoff times for the airlifter and tanker
and calls the aircraft network model. (Appendix E is the
SLAM computer code.) A logical IF statement in subroutine
FLTPLN will call the ENTER1 or ENTER2 node depending on
which aircraft takes off first. For simultaneous takeoffs,
only one ENTER node will be called so multiple aircraft
are not generated. The ENTER node simulates engine start
for the first aircraft. If the airlifter takes off first,
the ENTER1 node is entered and the next node (ASl) assigns
the value of one to global variable II, indicating the air-
lifter should take off first. II is assigned a value of two
in the tanker network if the tanker is scheduled to take
off first.
The next event consists of two regular activities,
one continues the airlifter to takeoff and one initiates
the tanker engine start sequence. The activity from AS1
to AS3 involves no time and at AS3 assigns ATRIB(5) equal
185

to the aircraft code to facilitate reading~ the SLAM Output
Trace. The second activity leading from ASi occurs with
a completion time from XX(ll) which is the takeoff time
difference between aircraft. In this way each aircraft
is assured of completing the takeoff sequence at the
correct time.
The next section models takeoff delays encountered.
The fifteen minutes activity from AS3 to either G011 or
G033 simulates the time for start, taxi, and takeoff. This
is a standard value used in flight planning. The decision
to go to G011 or G033 is based upon the aircraft code in
ATRIB(2). If the aircraft is a C-5 the aircraft will delay
in accordance with the network following GOll; if the air-
craft is a C-141B the aircraft will delay through G033.
If a delay in the scheduled takeoff time for the first air-
craft occurs, the second aircraft will remain grounded
until the first aircraft is repaired or the mission is can-
celled. Stops to prevent the second scheduled aircraft
taking off prior to the first are discussed later. The
delay occurs probabilistically and always for fifteen
minutes. Those delays which do not burn fuel are not
modeled. once the airlift delay is determined, it is
assigned to global variable XX(15) which will be used in
future fuel computations.
The next segment computes the fuel used in the
start, taxi, and takeoff event including the delays.
186

ATRIB(4) is used as a fuel accumulator for c ch aircraft.
It is initially set at zero and all fuel consumed is added
to ATRIB(4) as it is calculated. AS5 calculates the fuel
consumed up to that point by calling user function one
which assigns the start, taxi, takeoff fuel for the air-
lifter and calculates the amount of fuel used in any delays.
See Appendix F for user function descriptions. AS5 also
assigns the value of "one" to XX(17) which will be used in
determining takeoff sequences.
To determine when to actually launch the second air-
craft, the activity network emanating from AS5 checks three
questions in this order:
1. Has the tanker taken off first?
2. Should the tanker take off first and is he
delayed?
3. Should the airlifter take off first?
If the first answer is yes, the airlifter takes
off and travels to node AS7. If the answer is no and the
second answer is yes, the tanker was delayed and the air-
lifter must also delay to provide the correct takeoff
separation between the two aircraft. The airlifter will
stay grounded until the tanker is airborne plus the original
takeoff time difference. This is accomplished by adding
the original takeoff separation to the actual time the
first scheduled aircraft departs. If the second answer is
no, the third answer is yes and the airlifter departs
first. The takeoff maneuver is modeled as three minutes
187

(brake release to landing gear retraction). The SLAM model
uses a conditional take first logic on the three activi-
ties, thus allowing only the first "yes" activity to be
released. The logic sequence between ASZ and AS6 deter-
mines the takeoff time and sequence for the tanker. After
the takeoff is accomplished AS7 computes, with USERF3,
the takeoff fuel and adds it to ATRIB(4). AS6 performs
this function for the tanker.
The next phase of the flight is the initial climb
to altitude. The airlift climb time is computed in USERF5.
AS9 then calculates the climb fuel and climb distance
using USERF7 and USERF9 respectively. USERF8 and 10 cal-
culates the values for the tanker. The climb fuel is added
to ATRIB(4) in AS9 for the airlifter and in AS8 for the
tanker.
The next phase of flight is the cruise from level-
off to the rendezvous entry point. The cruise time for the
airlifter is computed in USERFII and for the tanker,
USERF12 is used. ASB computes cruise fuel to the entry
point (QI), adds it to ATRIB(4) and sets XX(21) equal to
the entry point arrival time. XX(21) will be used to deter-
mine aircraft loiter time. If the tanker arrives first it
will'hold at Q2.
The next event is the rendezvous maneuver and
refueling. The maneuver begins with the arrival of the
second aircraft at the rendezvous point Ql or Q2. When
the first aircraft arrives at the queue node, it is
188

prevented from proceeding further by match node, MAT1.
The arrival of the second aircraft releases MATi and the
refueling maneuver begins. Once through the match node,
ASC and USERF15 computes the loiter fuel for the airlifter.
ASD and USERF16 perform this function for the tanker.
After each aircraft has arrived at the rendezvous
*point, but before actual refueling occurs, two conditions
must be met:
1. Aircraft must be capable of safely returning
to a suitable abort base, if hookup is unsuccessful.
2. Aircraft must be able to fly to the destina-
* tion base with the fuel available after the transfer.
If these conditions are not met, then unexpected fuel con-
sumption due to excessive loiter fuel, delays, or unfore-
seen wind changes, have made the refueling event infeasible
due to a lack of available fuel. Each aircraft will abort
to their respective bases. The abort computation is calcu-
lated in USERF17 for the airlifter and USERF18 for the
tanker. The SLAM model compares the difference between the
fuel available and the fuel required to abort. A differ-
ence of less than zero, represents an infeasible situation
'and the simulation stops by aborting the applicable air-
craft to terminal node 1 or 2.
If the aircraft meet the feasible criteria, they
proceed with the refueling maneuver. Refueling occurs on
the refueling track, prearranged in length by subroutine
189
FLTPLN. The time in the maneuver is identicz.l for each air-
craft and calculated by ASX and USERF19 for the airlifter,
and ASY and USERF19 for the tanker. Fuel consumed in the
rendezvous maneuver is calculated in ASE and ASF for the
airlifter and tanker using USERF21 and 20 respectively.
Once the rendezvous is completed each aircraft
departs the exit point to their respective destinations.
The time to destination is computed by USERF23 and 22 for
the airlifter and tanker respectively and assigned to
ATRIB(3). The fuel to reach each destination is computed
by USERF25 and 24 for the airlifter and tanker respectively
and added to the total fuel consumed in ASG and ASH.
Approach and landing fuels and fuel reserves are included
in these fuel computations. Fuel reserves used are from
the flight plan parameters.
When the airlifter and tanker reach their destina-
tions, they pass through their terminal node T-3 (airlifter)
and T-4 (tanker). When both terminal nodes are released,
the simulation is stopped and the results are displayed in
a SLAM Nodal Trace of the simulation from takeoff to land-
ing. Total fuel consumed by each aircraft is obtained from
the column labeled attribute four at T3 and T4. Appendix G
lists a typical SLAM nodal trace.
190

Appendix L
FLTPLN and SLAM Sumay of Results
191

This appendix contains four tables of comparisons
between SLAM and FLTPLN fuel consumptions. Table L-1 shows
these results for the C-5, Table L-2 for the C-141B,
Table L-3 for the KC-10, and Table L-4 for the KC-135.
The data in each table represents the combined fuel con-
sumption data for all scenarios (McGuire AFB to Tehran,
Iran and Travis AFB to Yokota AB, Japan) for a particular
aircraft. The SLAM data was obtained using a normal wind
factor variant (P = 55, a = 10 KNOTS).
In Tables L-l to L-4 the first column (Tanker Base)
lists the tanker departure base. By specifying only the
tanker base the scenario is also fully defined since only
the east coast tanker bases are used in the Tehran scenario
and only the west coast tanker bases are used in the Yokota
scenario. The second column (Complementary Aircraft)
defines the aircraft combination. The third column (Air-
lifter Cargo) represents the airlifter cargo load; those
missions which were infeasible at a particular cargo weight
are marked "Infeas." The fourth column (Analytical Fuel
Consumption) represents the total fuel consumption for the
applicable aircraft obtained from the analytical model
(FLTPLN). The fifth column (SLAM Fuel Consumption) repre-
sents the SLAM fuel consumption sample mean. The sixth
column (% Dev) represents the percent deviation of the
SLAM mean compared to the analytical model value. For
192

example, the KC-10 fuel consumption, for the Travis-Yokota
scenario, refueling the C-141 with a cargo load of 55,000
lbs, was 138,000 lbs. The SLAM mean fuel consumption was
131,200 lbs. The percent deviation is:
( 131.2 _i) = -5.5 %138.2
A negative value means that the SLAM model used less fuel
than the analytical model and a positive value means the
SLAM model consumed more fuel. The seventh column shows a
95 percent confidence interval as a total fuel consumption
range such that the probability of the true SLAM mean being
*. in that interval is 95 percent. Appendix J contains a
sample confidence interval calculation. To obtain a con-
fidence interval, normality must be assumed. Kolmogorov-
Smirnov Tests of the SLAM data were used to verify normality
and Appendix J contains a normality verification sample
calculation using the Vogelbach Computing Center's SPSS
Kolmogorov-Smirnov Nonparametric One Sample Test. A "yes"
in column eight (SLAM Feasible) indicates that the SLAM
total mission fuel consumption for the specific aircraft
using the upper limit of the confidence interval as the fuel
required for a successful mission, was feasible for the par-
ticular scenario. The fuel available for the airlifter is
the ramp fuel plus the transferred fuel. The fuel avail-
able for the tanker aircraft is the ramp fuel minus the
transferred fuel. In Figures 3-6 the percent deviation for
each aircraft is plotted.
193

C 1 991 1 Cfl fU -!WCn~WflfU r U2W
coL 0 r m00C) C) r-- )r Nc N0 DrIC 4MMC
r. ,-i NC C JC4mr1C r n M 0CN CN CN CN CN M Mc'MrN
0\0i- m '~
.4) CN- U) 1 4.
LA N, a mL N4 -1 W~~
r-4 ~- LA LA O
44 8~oro r-oeIo
4 UEi H 0 N o OOOc. O, N O-4O -4c
j oC o r ar-C>r-0o -0 r-C)r-0 r-- o r- (Dr- Cor- 0r-,4 Hu (= - 4 -4 H- F--l H- 1- r-
U)
n4J~ LA f1 44 m
U~UH4 )
194
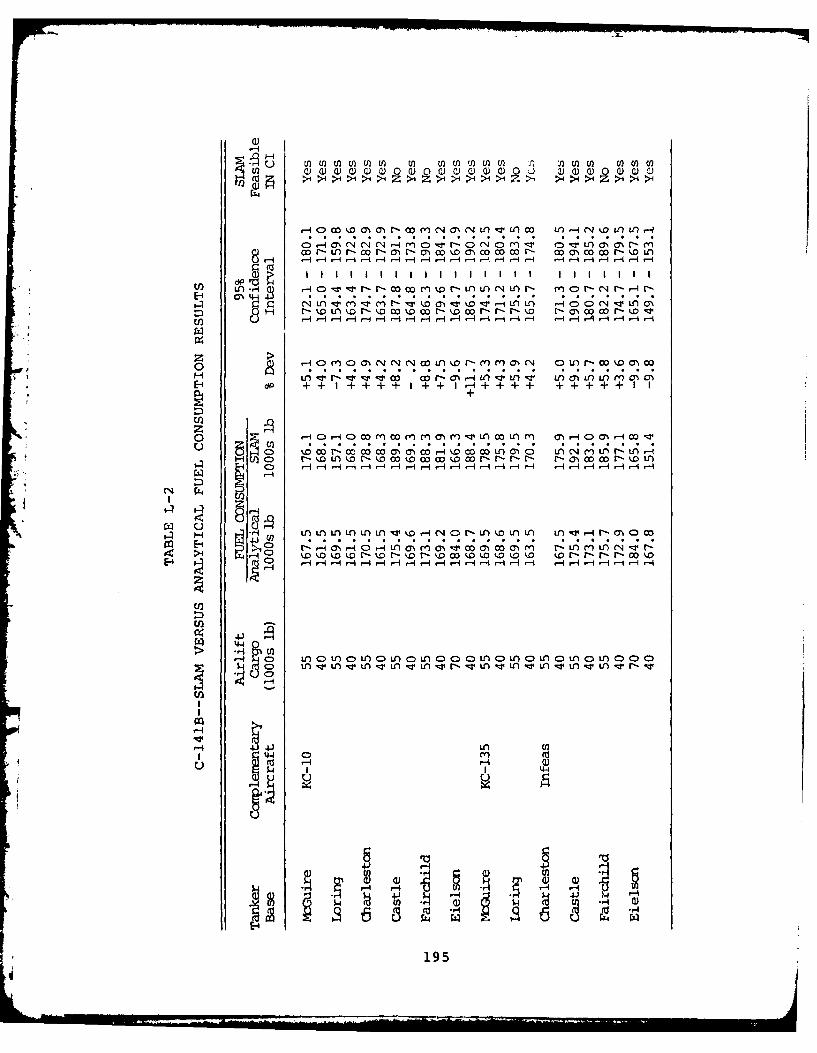
C) WWW) o () 0 C) ) ) 0W W C
00r L -co rO -mc Icc o ccoN r- c 1%0 r- %DL
E-4 N4 - . .
zH~ LoLt~ 4 Z*o - a O ; ; O a ;
E4dP ++I+ +++++.I. .+.+ .++++.I.
z0~ -40r4 C i r iC :r -L i l !91 li C -4
CD . r:mwwomw- om noa L nL -L -
14 UO L U l l C L C l
4 0
1- > moL DL noL nc n nc
C)(1 t 2- TLnT -IWL TL Ttn-; ,r0 . --
.4J4J fl 4J
195
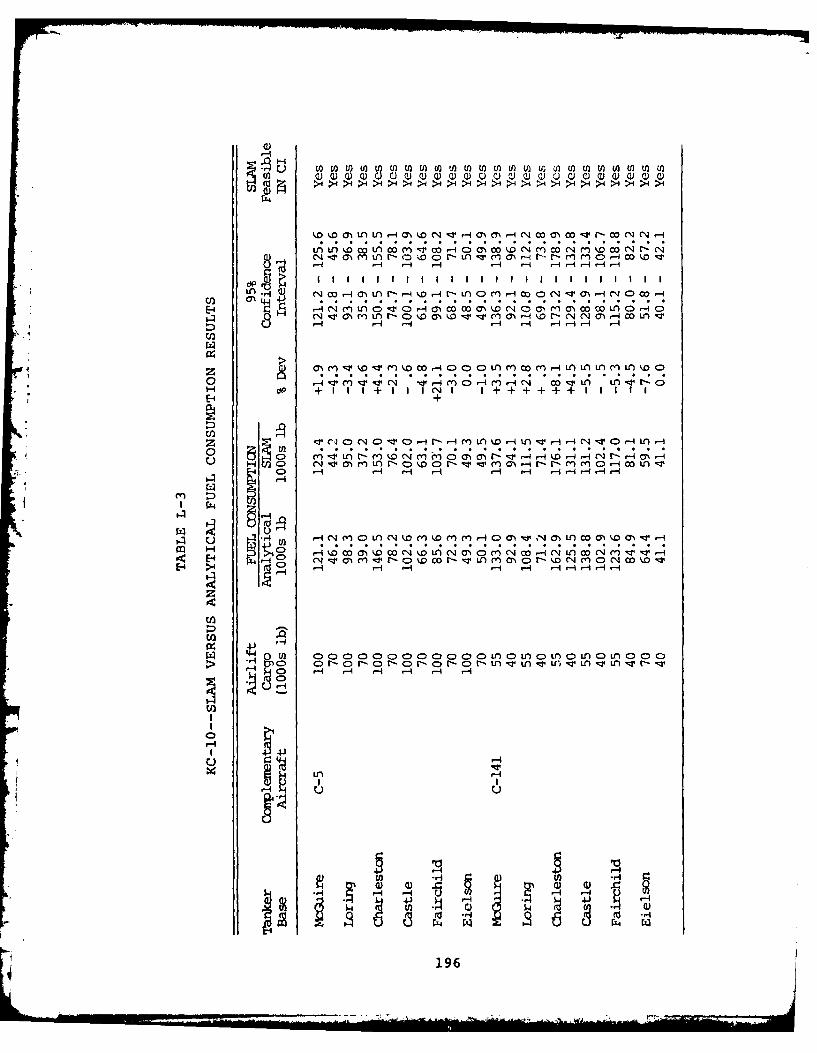
c )
d4 @
0 f co14a, ' ,- %014r U)0mC c 1 W )- N CDr-4 ' coLf L l -4H ) -P .i I Ii c~ . .. ++..+++..II.. .. .. I
r-4C4 n0-ZpC -Imc O l .0C4C O e m0 +011Cr4-TMMI ,0 OM-D--:rMa 44 -( 4ML8-
W UON ~ O ( O - U
z 0 V '4 C)-4 '-PC -i r- -. M1 . - )'W 1- V0 14L -
-44
U)U
r'-4
C19

u En U nU ) U)WCEnCU) U U ul V) Ln ) U U 22U n(n LaO)UO JO ) C )W)CGG
En 04>0
C 19Oc r C . 1 1 l 381- mc\J O m AqD - "r mNmm 4 4 -
HE-4D 1 4 10() VL)M ou liii r 0 liii I+ +I 4 l en 11 14
H ~r- MN 0 - (NC1 o -q r-r C14 q .-- 4 l tm ON
rz~
C oCri r--~ rco: C;V r: C; C mo;
C> r C oN/ ))L . 1 O Or : 00) -L)VC
S4Jri 0> oLooo OO A Lo Lr) cLnc)Ln o
o C!ar-c r >r- or-o r- r- n-v L v n v i r v4 C; - -4 -1 1-4 -4 r-4
4-
4,.

Vitas of the Authors
198

Vernon Paul Bordelon was born on July 23, 1948,
in New Orleans, Louisiana, the son of Vernon P. and
Frances N. Bordelon, Sr. He graduated from the University
of Southwestern Louisiana in may, 1971, with a Bachelor's
Degree in Political Science. Upon receiving his commission
in the United States Air Force, he attended Undergraduate
Navigator Training at Mather AFB, CA. He served as
15th Military Airlift Squadron standardization navigator
and 63rd Military Airlift Wing air operations staff officer
in the Combat Tactics and Techniques Office at Norton AFB,
CA. A tour at 22nd Air Force (MAC) Combat Operations as an
air operations staff officer preceding entering the School
of Engineering of the Air Force Institute of Technology.
ofNew Oreas, Louiiana tothey havmer aebson, Mihel Doravid
ofNwOHeais, Lourriana toThey orme Rebecca Michel MDauid
and a daughter, Rebecca Kristen.
Permanent Address: 409 Upstream Street
New Orleans, Louisiana
199

John C. Marcotte, Jr., was born on December 11,
1946, in Camden, NJ, the son of John C. and Virginia L.
Marcotte. Upon graduation from Reynolds High School,
Troutdale, Oregon, in 1964, he enrolled at Oregon State
University, Corvallis, Oregon, from which he received the
degree of Bachelor of Science in Mechanical Engineering
Ff , in June, 1969. Upon graduation he attended Undergraduate
Pilot Training at Laredo, Texas, and received his pilot
wings in July, 1970. He served at Mather AFB, CA, from
July, 1970, to June, 1973, as a T-29 aircraft commander and
* received a Master's Degree in Business Administration
from Golden Gate University, Sacramento, California. Upon
graduation he served as the Chief of Contract Programs
with the 475th CES, Yokota Air Base, Japan. He served as
a C-141A aircraft commander and current operations staff
officer with the 63rd MAW, Norton, AFB, CA, until entering
the School of Engineering, Air Force Institute of Tech-
nology, in August, 1979.
He is married to the former Janis Patricia Bull
of Mentor, Ohio. They have two daugitters, Monica and
Michelle.
Permanent Address: 448 Judy Court
Merced, California
200


![A Romantic Jazz Suite [C118] - Free-scores.com : World Free … · eee eee e eee )o 2e %e&o %vq i r x m ± ± m ± ± ± ± ± m ± ± m ± ± ± ± ± " eee eee e eee)o 2e %e&o %vq](https://static.fdocuments.us/doc/165x107/60a6220791891f1ffb1e5d23/a-romantic-jazz-suite-c118-free-world-free-eee-eee-e-eee-o-2e-eo-vq.jpg)