
e 1 " * * (( * >^? (* $ > ?** - ( > xg r x? ( kmi ki id "& >* ( (* ? ! "#$"#$ % & "" % & "" '()' )*...
26
Transcript of e 1 " * * (( * >^? (* $ > ?** - ( > xg r x? ( kmi ki id "& >* ( (* ? ! "#$"#$ % & "" % & "" '()' )*...

1
Effect modification of FADS2 polymorphisms on the
association between breastfeeding and intelligence:
results from a collaborative meta-analysis
Fernando Pires Hartwig1,2
*, Neil Martin Davies2,3
, Bernardo Lessa Horta1, Tarunveer S.
Ahluwalia4, Hans Bisgaard
4, Klaus Bønnelykke
4, Avshalom Caspi
5,6, Terrie E. Moffitt
5,6, Richie
Poulton7, Ayesha Sajjad8, Henning W Tiemeier8,9, Albert Dalmau Bueno10,11,12, Mònica
Guxens,9,10,11,12, Mariona Bustamante Pineda10,11,12,13, Loreto Santa-Marina12,14,15, Nadine
Parker16,17
, Tomáš Paus16,18
, Zdenka Pausova19,20,21
, Lotte Lauritzen22
, Theresia M. Schnurr23
, Kim
F. Michaelsen22, Torben Hansen23, Wendy Oddy24, Craig E. Pennell25, Nicole M. Warrington25,26,
George Davey Smith2,3† and Cesar Gomes Victora3†
1Postgraduate Program in Epidemiology, Federal University of Pelotas, Pelotas, Brazil.
2Medical Research Council Integrative Epidemiology Unit, University of Bristol, Bristol, United
Kingdom.
3School of Social and Community Medicine, University of Bristol, Bristol, United Kingdom.
4COPSAC, Copenhagen Prospective Studies on Asthma in Childhood, Herlev and Gentofte
Hospital, Faculty of Health Sciences, University of Copenhagen, Copenhagen, Denmark.
5Duke University, Durham, USA.
6Institute of Psychiatry, Psychology, and Neuroscience, King’s College London, London, United
Kingdom.
7Department of Psychology, University of Otago, Dunedin, New Zealand.
8Department of Epidemiology, Erasmus University Medical Centre, Rotterdam, The
Netherlands.
9Department of Child and Adolescent Psychiatry/Psychology, Erasmus University Medical
Centre, Rotterdam, The Netherlands.

2
10ISGlobal, Centre for Research in Environmental Epidemiology (CREAL), Barcelona, Spain.
11Universitat Pompeu Fabra (UPF), Barcelona, Spain.
12CIBER Epidemiología y Salud Pública (CIBERESP), Madrid, Spain.
13Centre for Genomic Regulation (CRG), The Barcelona Institute of Science and Technology,
Barcelona, Spain.
14BIODONOSTIA Health Research Institute, San Sebastian, Spain.
15Public Health Division of Gipuzkoa, San Sebastian, Spain.
16Rotman Research Institute, Baycrest Centre for Geriatric Care, Toronto, Canada.
17Institute of Medical Science, University of Toronto, Toronto, Canada.
18Departments of Psychiatry and Psychology, University of Toronto, Toronto, Canada.
19Hospital for Sick Children Research Institute, Peter Gilgan Centre for Research and Learning,
Toronto, Canada.
20Department of Nutritional Sciences, University of Toronto, Toronto, Canada.
21Department of Physiology, University of Toronto, Toronto, Canada.
22Department of Nutrition, Exercise and Sports, Faculty of Science, University of Copenhagen,
Copenhagen, Denmark.
23Novo Nordisk Foundation Centre for Basic Metabolic Research, Section of Metabolic
Genetics, Faculty of Health and Medical Sciences, University of Copenhagen, Copenhagen,
Denmark.
24Menzies Institute for Medical Research, University of Tasmania, Hobart, Australia.
25School of Women’s and Infants’ Health, The University of Western Australia, Perth, Australia.
26The University of Queensland Diamantina Institute, The University of Queensland,
Translational Research Institute, Brisbane, Australia.
†Joint senior authors.

3
*Corresponding author. Postgraduate Program in Epidemiology, Federal University of Pelotas,
Pelotas (Brazil) 96020-220. Phone: 55 53 981068670. E-mail: [email protected].
4
Abstract
Background: Accumulating evidence suggests that breastfeeding benefits the children’s
intelligence. Long-chain polyunsaturated fatty acids (LC-PUFAs) present in breast milk may
explain part of this association. Under a nutritional adequacy hypothesis, an interaction
between breastfeeding and genetic variants associated with endogenous LC-PUFAs synthesis
might be expected. However, the literature on this topic is controversial.
Methods and Findings: We investigated this Gene×Environment interaction in a de novo meta-
analysis involving >12,000 individuals in the primary analysis, and >45,000 individuals in a
secondary analysis using relaxed inclusion criteria. Our primary analysis used ever
breastfeeding, FADS2 polymorphisms rs174575 and rs1535 coded assuming a recessive effect
of the G allele, and intelligence quotient (IQ) in Z scores. Using random effects meta-analysis,
ever breastfeeding was associated with 0.17 (95% CI: 0.03; 0.32) higher Z scores in IQ, or about
2.1 points. There was no strong evidence of interaction, with pooled covariate-adjusted
interaction coefficients (i.e., difference between genetic groups of the difference in IQ Z scores
comparing ever with never breastfed individuals) of 0.12 (95% CI: -0.19; 0.43) and 0.06 (95%
CI: -0.16; 0.27) for the rs174575 and rs1535 variants, respectively. Secondary analyses
corroborated these results. In studies with ≥5.85 and <5.85 months of breastfeeding duration,
pooled estimates for the rs174575 variant were 0.50 (95% CI: -0.06; 1.06) and 0.14 (95% CI: -
0.10; 0.38), respectively, and 0.27 (95% CI: -0.28; 0.82) and -0.01 (95% CI: -0.19; 0.16) for the
rs1535 variant. However, between-group comparisons were underpowered.
Conclusions: Our findings do not support an interaction between ever breastfeeding and
FADS2 polymorphisms. However, our subgroup analysis raises the possibility that
breastfeeding supplies LC-PUFAs requirements for cognitive development (if such threshold
exists) if it lasts for some (currently unknown) time. Future studies in large individual-level
datasets would allow properly powered subgroup analyses and would improve our
understanding on the role of breastfeeding duration in the breastfeeding×FADS2 interaction.
Keywords: Breastfeeding; Intelligence; FADS2; Fatty acids; Effect modification; Meta-analysis.
5
Introduction
Breastfeeding has well-established short term benefits on children’s health. There is also
accumulating evidence that breastfeeding may also benefit cognitive development1. A recent
meta-analysis of observational studies reported that breastfed subjects scored higher on
intelligence quotient (IQ) tests [mean difference 3.4 (95% CI: 2.3; 4.6)] than non-breastfed
subjects2. Although issues such as residual confounding
3 and publication bias
4 may have
affected this estimate, randomised controlled trials of breastfeeding promotion reported
benefits in motor development in the first year of life5 and in IQ at 6.5 years of age6. Additional
studies corroborate the notion that breastfeeding has a causal effect on IQ. These include
comparisons between cohorts with different confounding structures7, and between mothers
who tried, but could not breastfeed their child, and mothers who had formula feeding as their
first choice8.
One of the possible biological mechanisms underlying the effect of breastfeeding on IQ is
through long-chain polyunsaturated fatty acids (LC-PUFAs), such as docosahexaenoic acid
(DHA). Meta-analyses of randomised controlled trials of supplementation of DHA and other LC-
PUFAs in infants reported improved cognitive development9 and visual acuity10. Indeed, DHA is
an important component of the membrane of brain cells and retina cells11,12
. Studies in animal
models and humans suggest that adequate levels of DHA are important for cognitive
development through influencing several processes, such as biogenesis and fluidity of cellular
membranes, neurogenesis, neurotransmission and protection against oxidative stress12,13.
The role of LC-PUFAs in the association between breastfeeding and IQ can be investigated
through a Gene×Environment (G×E) interaction analysis. For example, it is possible that there
is an upper limit for the benefits of increasing DHA levels and such requirements are met by
pre-formed DHA available in breast milk. In this case, inter-individual variation in IQ due to
genetically determined differences in DHA endogenous synthesis from metabolic precursors
would only be observable in individuals who were not breastfed14
. This G×E interaction has
been investigated using single nucleotide polymorphisms (SNPs) in the FADS2 gene14-18. This
gene encodes a desaturase enzyme that catalyses a rate-limiting reaction in the LC-PUFAs
pathway19,20
. Candidate gene and genome-wide approaches reported that minor alleles of
SNPs in the FADS2 gene were associated with lower levels of PUFAs in plasma and erythrocyte
phospholipids21-24.

6
Caspi et al. were the first to evaluate the interaction between genetic variation in FADS2 and
breastfeeding, with IQ in children as the outcome. Two SNPs were evaluated: rs1535
(major/minor alleles: A/G) and rs174575 (major/minor alleles: C/G). For both SNPs, having
ever being breastfed was positively associated with IQ in all genetic groups, except in G-allele
homozygotes, where there was no association15. Although there was evidence for a GxE
interaction, it was not consistent with the nutritional adequacy hypothesis outlined above.
However, in a replication study, Steer et al. results were consistent with the nutritional
adequacy hypothesis (and therefore inconsistent with Caspi et al.’s findings), with breastfed
individuals presenting similar mean values of IQ across FADS2 genotypes. Such values were
higher than those observed in never breastfed individuals, with the lowest value (and thus the
greatest effect of breastfeeding) being in GG individuals14
. Morales et al. reported that a
negative association between genotypes in other genetic variants related to lower activity of
enzymes involved in elongation and desaturation processes and cognition was only evident in
non-breastfed individuals25
. However, three studies in twins (but not twin studies, in the sense
that they did not aim at estimating heritability) did not detect strong evidence supporting this
G×E interaction16-18.
In this study, we aimed at improving the current understanding on this G×E interaction and
gaining insights into the sources of heterogeneity between studies through a consortium-
based initiative26
.
Methods
Overview of the study protocol
The protocol of this study has been published elsewhere26. Briefly, studies that were known by
the coordinating team to have at least some of the data required available, as well as other
studies suggested by collaborators, were invited to participate. All studies that were contacted
(and were eligible) accepted to participate.
All of the following criteria were required for eligibility: i) availability of at least a binary
breastfeeding variable (i.e., whether or not the study individuals where ever breastfed),
intelligence measured using standard tests, and at least rs174575 or rs1535 SNPs (either
genotyped or imputed); and ii) European-ancestry studies, or multi-ethnic studies if possible to
define a subsample of European ancestry individuals. Exclusion criteria were: i) only poorly
7
imputed genetic data were available (metrics of imputation such as r2 or INFO quality below
0.3); ii) twin studies; iii) lack of appropriate ethical approval.
Data analysis was performed locally by data analysts of the collaborating studies. Standardised
analysis scripts written in R (http://www.r-project.org/) were prepared centrally and
distributed to the analysts, along with a detailed analysis plan and instructions to format the
data. The scripts automatically generated files containing summary descriptive and association
statistics, which were centrally meta-analysed.
As the analyses progressed, some modifications in the original protocol were required. These
are described in the Supplementary Methods.
Participating studies
A total of 10 eligible studies were identified, all of which were included in the meta-analysis:
the 1982 Pelotas Birth Cohort Study27,28, Dunedin Multidisciplinary Health and Development
Study15, Avon Longitudinal Study of Parents and Children (ALSPAC)29, Copenhagen Prospective
Study on Asthma in Childhood (COPSAC) 201030,31, Generation R Study32-34, INfancia y Medio
Ambiente (INMA) Project35
, Western Australian Pregnancy Cohort (Raine) Study36-38
, Småbørn
Kost Og Trivsel-I (SKOT-I)39,40, SKOT-II41,42 and Saguenay Youth Study (SYS)43,44.
In addition, a subsample of 32,842 individuals from the UK Biobank45 was included. However,
this subsample did not fulfil the pre-established eligibility criteria because IQ was not
measured using a standard test. Therefore, these data were used in secondary analyses only.
Information about the participating studies is shown in Supplementary Tables 1-3.
Statistical analyses
The main outcome variable was IQ. IQ tests varied between studies (Supplementary Table 1),
so IQ measures were converted to Z scores (mean=0 and variance=1) within each participating
study. The primary analysis involved breastfeeding (coded as never=0 and ever=1), FADS2
polymorphism assuming a recessive genetic effect of the G allele (i.e., GG individuals=1;
heterozygotes and non-G allele homozygotes=0) and an interaction term between them.
Different genetic effects, different categorizations of breastfeeding, and exclusive
breastfeeding (defined as receiving only breast milk and no other food or drink, including
water) were evaluated in pre-planned secondary analyses. Unless explicitly stated, all analyses
refer to any quality of breastfeeding (i.e., combining exclusive and non-exclusive).
8
Three analysis models were performed: (i) unadjusted (i.e., no covariates); (ii) adjusted 1:
controlling for sex and age (linear and quadratic terms) when IQ was measured, ancestry-
informative principal components (when available) and genotyping centre (for studies
involving multiple laboratories); (iii) adjusted 2: same covariates in “adjusted 1” model, as well
as maternal education (linear and quadratic terms) and maternal cognition (linear and
quadratic terms); if only one of the maternal variables was available, adjusted model 2
controlled only for that variable. Continuous covariates, as well as sex (which was coded as
male=0 and female=1), were mean-centred before analysis, and squaring was performed
before mean centring. Covariate adjustment was performed by including not only a “main
effect” term, but also (FADS2×Covariate) and (Breastfeeding×Covariate) interaction terms46.
As a sensitivity analysis, the role of gene-environment correlation was evaluated by repeating
models i) and ii), but having maternal cognition (in Z scores) or maternal schooling (in years) as
outcome variables rather than the participant’s IQ. Maternal cognition or schooling are
important predictors of an individual’s IQ, and cannot be consequences of the participant’s
genotype. Therefore, any evidence of breastfeeding×FADS2 interaction in this analysis is
indicative that those maternal variables may confound the main breastfeeding×FADS2
interaction analysis (i.e., having participant’s IQ as the outcome variable).
Analyses were performed using linear regression with heteroskedasticity-robust standard
errors. Results from all studies were pooled using fixed and random effects meta-analysis.
Random effects meta-regression was used to evaluate the potential moderating role of the
following variables: IQ test; adjustment for ancestry-informative principal components; age at
IQ measurement; timing of breastfeeding measurement; continental region; mean year of
birth; prevalence of having ever being breastfed; mean breastfeeding duration; and sample
size.
Results
Characteristics of participating studies
As shown in Supplementary Table 1, seven out of the 10 eligible studies were conducted in
Europe, four were population-based and two were multi-ethnic. The average year at birth
ranged from 1972 to 2011. Three studies measured breastfeeding prospectively, and four
measured IQ using the Wechsler Intelligence Scale (two for children and two for adults).
9
Supplementary Table 2 provides a description of the two FADS2 SNPs in each study. The SNPs
rs174575 and rs1535 were directly genotyped in three and five studies, respectively. The
minimum value of imputation quality was 0.984. The frequency of the G allele ranged from
20.5% to 30.8% for the rs174575 variant, and from 28.5% to 39.1% for the rs1535 variant.
There was no strong statistical evidence against Hardy-Weinberg Equilibrium, with the smallest
P-values being 0.058 (Generation R), 0.074 (SKOTI-II) for rs174575, and 0.085 (1982 Pelotas
Birth Cohort), 0.044 (Raine) and 0.089 (SKOTI-II) for rs1535. Although these results may be
suggestive of some population substructure (especially in Generation R and in the 1982 Pelotas
Birth Cohort, which are multi-ethnic studies) or batch effects (especially in SKOTI-II, which is a
combination of two independent studies), it is unlikely that such phenomena substantially
influenced the results because ancestry-informative principal components computed using
genome-wide genotyping data were available and adjusted for in these four studies.
Additional study characteristics are displayed in Supplementary Table 3. Among eligible studies
(i.e., excluding the UK Biobank), the mean age, maternal education, and breastfeeding
duration ranged from 2.5 to 30.2 years, 11 to 19 years, and 2.3 to 8.2 months, respectively. All
IQ measures produced a variable with mean close to 100 and similar standard deviations
(median: 12.2; range: 9.6 to 16.3). The exception was the one used in SKOT-I and SKOT-II (i.e.,
third edition of the Ages and Stages Questionnaire), which produced a variable with mean
close to 50.
Primary analysis
In analyses without stratification according to genotype, ever breastfeeding was associated
with increases of 0.37 (95% CI: 0.32; 0.42) and 0.30 (95% CI: 0.20; 0.40) Z scores in IQ in fixed
and random effects meta-analysis, respectively. Assuming that a Z score corresponds to 12.2
points (the median of the standard deviation of IQ measures among participating studies),
these coefficients correspond to 4.5 and 3.7 points in IQ. In the fully adjusted model (adjusted
2), the respective coefficients were 0.26 (95% CI: 0.21; 0.32) and 0.17 (95% CI: 0.03; 0.32), or
3.2 and 2.1 points in IQ.
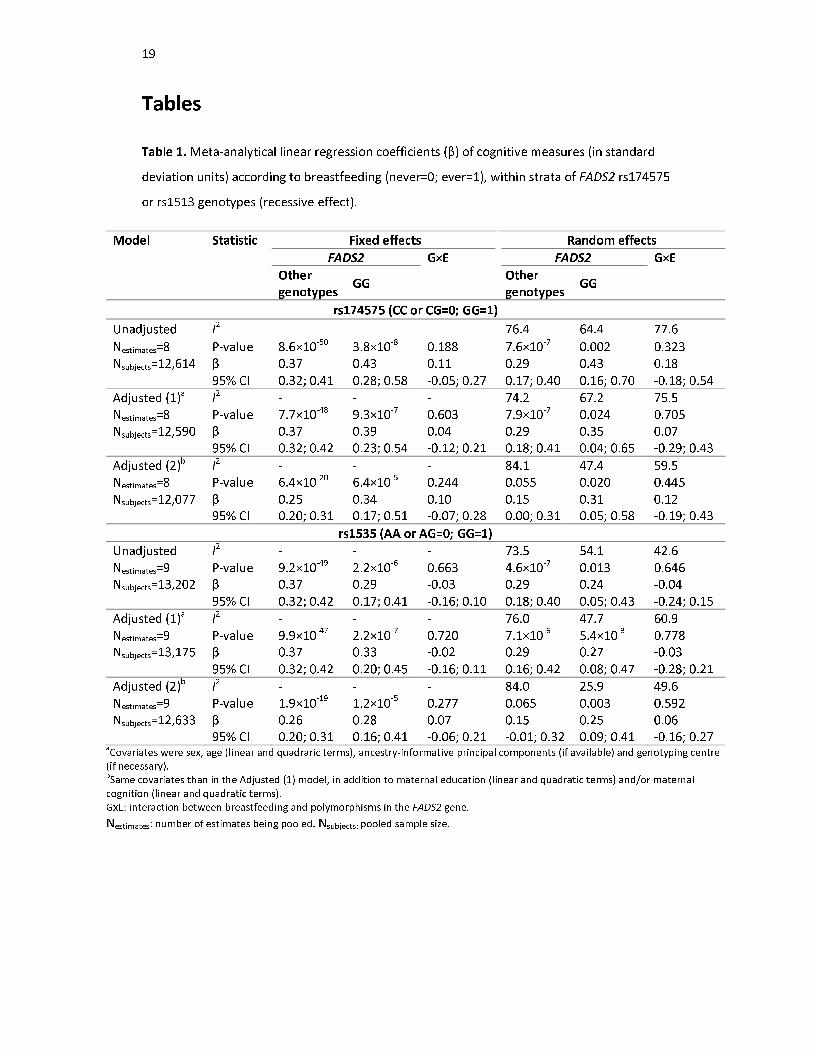
Table 1 and Figure 1 display the results of the primary analysis. There was considerable
between-study heterogeneity. Among non-G carries for the rs174575 SNP, pooled random
effects estimates of IQ Z scores according to breastfeeding (ever=1; never=0) were 0.29 (95%
CI: 0.17; 0.40) and 0.15 (95% CI: 0.00; 0.31) in the unadjusted and fully-adjusted models,
respectively. Among GG individuals, the respective estimates were 0.43 (95% CI: 0.16; 0.70)

10
and 0.31 (95% CI: 0.05; 0.58). There was no strong evidence of interaction, with pooled
estimates of the breastfeeding×FADS2 interaction term of 0.18 (95% CI: -0.18; 0.54) and 0.12
(95% CI: -0.19; 0.43), respectively. These coefficients can be interpreted as the difference
between genetic groups of the difference in IQ Z scores comparing ever with never breastfed
individuals. Similar results were obtained when using fixed effects meta-analysis.
Results for the rs1535 variant were presented a similar trend, but were even less suggestive of
interaction. When using random effects meta-analysis, the estimates of the interaction term
were -0.04 (95% CI: -0.24; 0.15) and 0.06 (95% CI: -0.16; 0.27) in the unadjusted and fully-
adjusted models, respectively. Using fixed effects meta-analysis yielded similar results.
Secondary analysis
As shown in Table 2 and Supplementary Tables 4-6, there was no strong indication of
interaction when analysing other categorisations of breastfeeding duration and FADS2 SNPs
coded assuming a recessive effect. This was also the case when FADS2 variants were coded
assuming additive (Supplementary Table 7), dominant (Supplementary Table 8) and
overdominant (Supplementary Table 9) effects. The same was observed for exclusive
breastfeeding (Supplementary Tables 10-13).
Supplementary Table 14 displays the results obtained when including the UK Biobank, which
was analysed as two independent samples according to the genotyping platform
(Biobank_Axiom and Biobank_BiLEVE). Its inclusion resulted in a combined sample size of more
than 45,000 individuals. When FADS2 variants were coded assuming recessive effects, the
pooled estimates from the unadjusted model -0.02 (95% CI: -0.10; 0.06) and 0.08 (95% CI: -
0.13; 0.29) for fixed and random-effects meta-analysis, respectively. The corresponding
estimates from the adjusted (1) model were -0.04 (95% CI: -0.13; 0.04) and 0.00 (95% CI: -0.21;
0.20), respectively. There was also no strong statistical evidence supporting an interaction
when other genetic effects were assumed.
Sensitivity analysis
Table 3 displays the results of random-effects meta-regression. Neither type of IQ test, timing
of breastfeeding measurement, continental region nor mean year of birth explained a
substantial amount of between-study heterogeneity. For rs174575, the adjusted R² of
ancestry-informative principal components was 88.0%, with pooled estimates of 0.28 (95% CI:
0.02; 0.54) and -0.38 (95% CI: -0.72; -0.04) Z scores in IQ from studies that did and did not
11
adjust for principal components, respectively, which would be suggestive of confounding due
to population stratification towards a negative association. Age at IQ measurement was
inversely associated with the magnitude of the interaction term, with pooled estimates of 0.06
(95% CI: -0.46; 0.58) and 0.20 (95% CI: -0.18; 0.58) when IQ was measured at 10 years of age or
more, or before that age (respectively), possibly suggesting an attenuation of the effect over
time. The adjusted R² was 10.4% when entering age as a continuous variable, but 0% when
dichotomised. When stratifying studies according to prevalence of ever breastfeeding, the
pooled estimate among studies with a prevalence ≥90% was 0.36 (95% CI: -0.19; 0.90), and -
0.04 (95% CI: -0.38; 0.29) when pooling the remaining studies. Adjusted R² estimates were
16.4% and 72.3% when prevalence of ever breastfeeding was analysed as a binary and as a
continuous variable, respectively. Among studies with breastfeeding duration equal to or
greater than the median among studies (i.e., 5.85 months), the pooled estimate was 0.50 (95%
CI: -0.06; 1.06), compared to 0.14 (95% CI: -0.10; 0.38) when pooling the remaining studies.
The adjusted R² was 45.5% when breastfeeding duration was dichotomised at the median, but
0% when analysed continuously. When stratifying studies into larger (≥1000 individuals) and
smaller (<1000 individuals), the pooled estimates were 0.26 (95% CI: 0.00; 0.52) and -0.03
(95% CI: -0.63; 0.56), with an adjusted R² of 33.8% when sample size was dichotomised, and of
0% when analysed in continuous form.
Regarding the rs1535 variant, the respective subgroup-specific estimates were consistent with
those of the rs174575 SNP: adjustment for principal components, with pooled estimates of
0.09 (95% CI: -0.19; 0.37) and -0.03 (95% CI: -0.32; 0.25) among studies that did and did not
perform this adjustment, respectively; age at IQ measurement, with pooled estimates of 0.04
(95% CI: -0.19; 0.37) and 0.07 (95% CI: -0.31; 0.45) among studies that measured IQ when
individuals were ≥10 and <10 years-old, respectively; and sample size, with pooled estimates
of 0.11 (95% CI: -0.12; 0.34) and 0.01 (95% CI: -0.43 and 0.45) among larger and smaller
studies, respectively. However, in all those cases the adjusted R² values were 0%. Prevalence
of ever breastfeeding presented adjusted R² values of 0% and 8.3% when dichotomised and
analysed continuously, respectively. The pooled estimates for the rs1535 variant were 0.15
(95% CI: -0.31; 0.62) and 0.01 (95% CI: -0.15; 0.18) among studies with prevalence of ever
breastfeeding of ≥90% and <90%, respectively. The most consistent moderator between SNPs
was breastfeeding duration, with pooled estimates for the rs1535 SNP of 0.27 (95% CI: -0.28;
0.82) and -0.01 (95% CI: -0.19; 0.16) among studies with ≥5.85 and <5.85 months of duration,
respectively; adjusted R² values were 22.2% and 4.9% when breastfeeding duration was
dichotomised and analysed continuously, respectively (Figure 2).
12
There was no strong evidence in support of gene-environment correlation involving maternal
education or maternal cognition (Table 4). Regarding the rs174575 variant, random effects
meta-analytical estimates from the adjusted model were 0.16 (95% CI: -0.45; 0.78) for
maternal education, and -0.02 (95% CI: -0.25; 0.21) for maternal cognition, respectively. The
corresponding estimates for the rs1535 SNP were -0.12 (95% CI: -0.51; 0.27) and 0.14 (95% CI:
-0.04; 0.33).
Discussion
Our primary analyses were not supportive of the hypothesis that the FADS2 polymorphisms
rs174575 and rs1535 and breastfeeding interact to affect IQ. This was also the case in a priori
secondary analyses using different categorisations of breastfeeding, exclusive rather than any
quality of breastfeeding, assuming different genetic effects and including a large study that did
not meet all eligibility criteria. Sensitivity analyses were not supportive that gene-environment
correlation involving maternal education or maternal cognition substantially influenced the
results. Random effects meta-regression suggested that breastfeeding duration was an
important moderator.
Results from our primary and secondary analyses were not supportive of the nutritional
adequacy hypothesis, according to which a positive interaction coefficient would be
expected14. In other words, there might be no upper limit (or it may be very high) of the effects
of LC-PUFAs on IQ, so that supplementing infants with LC-PUFAs could be beneficial for
cognition for both lactating and non-lactating infants alike. Importantly, this does not imply
that LC-PUFAs supplementation completely replaces the benefits of breastfeeding, since the
latter may act through diverse mechanisms, and also provide benefits other than for
intelligence1,47.
On the other hand, in our random effects meta-regression analysis, studies with longer
average breastfeeding duration generally presented interaction coefficients that were positive
and stronger in magnitude than studies with shorter breastfeeding duration. Moreover,
average breastfeeding duration was the most consistent moderator between polymorphisms.
Considering that positive interaction coefficients are expected under the nutritional adequacy
hypothesis, this result raises the possibility that there may be an upper limit of the benefits of
LC-PUFAs, but achieving such limits from breast milk requires that breastfeeding lasts for some
(currently unknown) time. Given that breastfeeding practices in the participating studies were
13
generally well below international recommendations48,49, it is possible that the amount of LC-
PUFA received from breast milk were, on average, lower than this threshold.
The strengths of our study include: appropriate sample size for the primary analysis26;
publication of study protocol26, which helps to avoid biased reporting; analyses performed
using standardised analysis scripts and harmonised (as much as possible) datasets; inclusion of
published and unpublished reports, thus minimising publication bias; several a priori defined
secondary and sensitivity analyses; proper adjustment for covariates in the G×E setting; and IQ
measures with similar variances, which reduces heterogeneity that could arise due to Z score
conversion50,51.
Our study also had limitations. Some of them were related to the small numbers of individuals
in some categories, which we tried to resolve by changing the protocol, such as in the case of
the definition of never being breastfed and exclusion of some categorisations of breastfeeding
from the analysis. Indeed, had the latter been maintained, the hypothesis above regarding
breastfeeding duration and nutritional adequacy could have been studied. However, due to
statistical issues, we opted for excluding this variable. Other limitations were: small sample
size for some analyses, such as those involving exclusive breastfeeding; heterogeneity in
important study characteristics, such as age, IQ test, timing of breastfeeding measurement,
etc.; and small number of studies for meta-regression analyses. Another potential limitation is
lack of adjustment for maternal genotypes, which may confound the association between
participant’s genotype and IQ by influencing fatty acid composition in breast milk25
. However,
although there is evidence that this may be the case for some genetic variants implicated in
LC-PUFA metabolism25, there is no strong evidence that maternal genotypes with regards to
the particular SNPs that we studied are associated with offspring’s IQ or that they interact with
breastfeeding14
. It is also possible that there are epistatic relationships between genes
implicated in this pathway, so that focusing only on two variants in a single gene may not
capture the whole complexity of the interplay between genetic influences in LC-PUFA levels,
breastfeeding and cognitive development.
Although our primary findings were not supportive of an interaction between breastfeeding
and FADS2 polymorphisms, random effects meta-regression results suggest that such
interaction exist, with studies with longer average breastfeeding duration generally presenting
estimates in accordance with the nutritional adequacy hypothesis. This should be investigated
in future studies comparing different categories of breastfeeding duration, rather than simply
never vs. ever comparisons (or other categorisations used here). Since such analysis would
14
involve many subgroupings, the best alternative is likely to perform such analysis in a large
dataset of individual-level data, which may be achieved by a consortium-based effort such as
this collaborative meta-analysis. This and other future investigations will be important to
further refine our understanding on the role of LC-PUFAs on the association between
breastfeeding and intelligence. This will also have more practical implications, such as
identifying whether current breastfeeding recommendations allow achieving the upper limit of
cognitive benefits related to LC-PUFAs intake (if such limit exists), and the potential benefits (if
any) of supplementing a lactating infant with LC-PUFAs.
References
1. Victora CG, Bahl R, Barros AJ et al. Breastfeeding in the 21st century: epidemiology,
mechanisms, and lifelong effect. Lancet 2016; 387(10017):475-490.
2. Horta BL, Loret de Mola C, Victora CG. Breastfeeding and intelligence: a systematic review
and meta-analysis. Acta Paediatr 2015; 104(467):14-19.
3. Walfisch A, Sermer C, Cressman A, Koren G. Breast milk and cognitive development--the
role of confounders: a systematic review. BMJ Open 2013; 3(8):e003259.
4. Ritchie SJ. Publication bias in a recent meta-analysis on breastfeeding and IQ. Acta
Paediatr 2016.
5. Dewey KG, Cohen RJ, Brown KH, Rivera LL. Effects of exclusive breastfeeding for four
versus six months on maternal nutritional status and infant motor development: results of
two randomized trials in Honduras. J Nutr 2001; 131(2):262-267.
6. Kramer MS, Aboud F, Mironova E et al. Breastfeeding and child cognitive development:
new evidence from a large randomized trial. Arch Gen Psychiatry 2008; 65(5):578-584.
7. Brion MJ, Lawlor DA, Matijasevich A et al. What are the causal effects of breastfeeding on
IQ, obesity and blood pressure? Evidence from comparing high-income with middle-
income cohorts. Int J Epidemiol 2011; 40(3):670-680.
8. Lucas A, Morley R, Cole TJ, Lister G, Leeson-Payne C. Breast milk and subsequent
intelligence quotient in children born preterm. Lancet 1992; 339(8788):261-264.

15
9. Jiao J, Li Q, Chu J, Zeng W, Yang M, Zhu S. Effect of n-3 PUFA supplementation on
cognitive function throughout the life span from infancy to old age: a systematic review
and meta-analysis of randomized controlled trials. Am J Clin Nutr 2014; 100(6):1422-1436.
10. Qawasmi A, Landeros-Weisenberger A, Bloch MH. Meta-analysis of LCPUFA
supplementation of infant formula and visual acuity. Pediatrics 2013; 131(1):e262-272.
11. Cetin I, Koletzko B. Long-chain omega-3 fatty acid supply in pregnancy and lactation. Curr
Opin Clin Nutr Metab Care 2008; 11(3):297-302.
12. Innis SM. Dietary (n-3) fatty acids and brain development. J Nutr 2007; 137(4):855-859.
13. Innis SM. Dietary omega 3 fatty acids and the developing brain. Brain Res 2008; 1237:35-
43.
14. Steer CD, Davey Smith G, Emmett PM, Hibbeln JR, Golding J. FADS2 polymorphisms
modify the effect of breastfeeding on child IQ. PLoS One 2010; 5(7):e11570.
15. Caspi A, Williams B, Kim-Cohen J et al. Moderation of breastfeeding effects on the IQ by
genetic variation in fatty acid metabolism. Proc Natl Acad Sci U S A 2007; 104(47):18860-
18865.
16. Martin NW, Benyamin B, Hansell NK et al. Cognitive function in adolescence: testing for
interactions between breast-feeding and FADS2 polymorphisms. J Am Acad Child Adolesc
Psychiatry 2011; 50(1):55-62 e54.
17. Groen-Blokhuis MM, Franic S, van Beijsterveldt CE et al. A prospective study of the effects
of breastfeeding and FADS2 polymorphisms on cognition and hyperactivity/attention
problems. Am J Med Genet B Neuropsychiatr Genet 2013; 162B(5):457-465.
18. Rizzi TS, van der Sluis S, Derom C et al. FADS2 Genetic Variance in Combination with Fatty
Acid Intake Might Alter Composition of the Fatty Acids in Brain. PLoS One 2013;
8(6):e68000.
19. Sprecher H. Metabolism of highly unsaturated n-3 and n-6 fatty acids. Biochim Biophys
Acta 2000; 1486(2-3):219-231.
20. Nakamura MT, Nara TY. Structure, function, and dietary regulation of delta6, delta5, and
delta9 desaturases. Annu Rev Nutr 2004; 24:345-376.

16
21. Schaeffer L, Gohlke H, Muller M et al. Common genetic variants of the FADS1 FADS2 gene
cluster and their reconstructed haplotypes are associated with the fatty acid composition
in phospholipids. Hum Mol Genet 2006; 15(11):1745-1756.
22. Tanaka T, Shen J, Abecasis GR et al. Genome-wide association study of plasma
polyunsaturated fatty acids in the InCHIANTI Study. PLoS Genet 2009; 5(1):e1000338.
23. Bisgaard H, Stokholm J, Chawes BL et al. Fish Oil-Derived Fatty Acids in Pregnancy and
Wheeze and Asthma in Offspring. N Engl J Med 2016; 375(26):2530-2539.
24. Steer CD, Hibbeln JR, Golding J, Davey Smith G. Polyunsaturated fatty acid levels in blood
during pregnancy, at birth and at 7 years: their associations with two common FADS2
polymorphisms. Hum Mol Genet 2012; 21(7):1504-1512.
25. Morales E, Bustamante M, Gonzalez JR et al. Genetic variants of the FADS gene cluster
and ELOVL gene family, colostrums LC-PUFA levels, breastfeeding, and child cognition.
PLoS One 2011; 6(2):e17181.
26. Hartwig FP, Davies NM, Horta BL, Victora CG, Davey Smith G. Effect modification of FADS2
polymorphisms on the association between breastfeeding and intelligence: protocol for a
collaborative meta-analysis. BMJ Open 2016; 6(6):e010067.
27. Victora CG, Barros FC. Cohort profile: the 1982 Pelotas (Brazil) birth cohort study. Int J
Epidemiol 2006; 35(2):237-242.
28. Horta BL, Gigante DP, Goncalves H et al. Cohort Profile Update: The 1982 Pelotas (Brazil)
Birth Cohort Study. Int J Epidemiol 2015; 44(2):441, 441a-441e.
29. Fraser A, Macdonald-Wallis C, Tilling K et al. Cohort Profile: the Avon Longitudinal Study of
Parents and Children: ALSPAC mothers cohort. Int J Epidemiol 2013; 42(1):97-110.
30. Bisgaard H, Vissing NH, Carson CG et al. Deep phenotyping of the unselected COPSAC2010
birth cohort study. Clin Exp Allergy 2013; 43(12):1384-1394.
31. Thysen AH, Rasmussen MA, Kreiner-Moller E et al. Season of birth shapes neonatal
immune function. J Allergy Clin Immunol 2016; 137(4):1238-1246 e1231-1213.
32. Jaddoe VW, van Duijn CM, van der Heijden AJ et al. The Generation R Study: design and
cohort update 2010. Eur J Epidemiol 2010; 25(11):823-841.

17
33. Jaddoe VW, van Duijn CM, Franco OH et al. The Generation R Study: design and cohort
update 2012. Eur J Epidemiol 2012; 27(9):739-756.
34. Kruithof CJ, Kooijman MN, van Duijn CM et al. The Generation R Study: Biobank update
2015. Eur J Epidemiol 2014; 29(12):911-927.
35. Guxens M, Ballester F, Espada M et al. Cohort Profile: the INMA--INfancia y Medio
Ambiente--(Environment and Childhood) Project. Int J Epidemiol 2012; 41(4):930-940.
36. Newnham JP, Evans SF, Michael CA, Stanley FJ, Landau LI. Effects of frequent ultrasound
during pregnancy: a randomised controlled trial. Lancet 1993; 342(8876):887-891.
37. Williams LA, Evans SF, Newnham JP. Prospective cohort study of factors influencing the
relative weights of the placenta and the newborn infant. BMJ 1997; 314(7098):1864-1868.
38. Evans S, Newnham J, MacDonald W, Hall C. Characterisation of the possible effect on
birthweight following frequent prenatal ultrasound examinations. Early Hum Dev 1996;
45(3):203-214.
39. Madsen AL, Schack-Nielsen L, Larnkjaer A, Molgaard C, Michaelsen KF. Determinants of
blood glucose and insulin in healthy 9-month-old term Danish infants; the SKOT cohort.
Diabet Med 2010; 27(12):1350-1357.
40. Jensen SM, Ritz C, Ejlerskov KT, Molgaard C, Michaelsen KF. Infant BMI peak,
breastfeeding, and body composition at age 3 y. Am J Clin Nutr 2015; 101(2):319-325.
41. Andersen LB, Pipper CB, Trolle E et al. Maternal obesity and offspring dietary patterns at 9
months of age. Eur J Clin Nutr 2015; 69(6):668-675.
42. Andersen LB, Molgaard C, Michaelsen KF, Carlsen EM, Bro R, Pipper CB. Indicators of
dietary patterns in Danish infants at 9 months of age. Food Nutr Res 2015; 59:27665.
43. Pausova Z, Paus T, Abrahamowicz M et al. Genes, maternal smoking, and the offspring
brain and body during adolescence: design of the Saguenay Youth Study. Hum Brain Mapp
2007; 28(6):502-518.
44. Paus T, Pausova Z, Abrahamowicz M et al. Saguenay Youth Study: a multi-generational
approach to studying virtual trajectories of the brain and cardio-metabolic health. Dev
Cogn Neurosci 2015; 11:129-144.
18
45. Sudlow C, Gallacher J, Allen N et al. UK biobank: an open access resource for identifying
the causes of a wide range of complex diseases of middle and old age. PLoS Med 2015;
12(3):e1001779.
46. Keller MC. Gene x environment interaction studies have not properly controlled for
potential confounders: the problem and the (simple) solution. Biol Psychiatry 2014;
75(1):18-24.
47. Hoddinott P, Tappin D, Wright C. Breast feeding. BMJ 2008; 336(7649):881-887.
48. World Health Organization and UNICEF. Protecting, Promoting and Supporting
Breastfeeding: The Special Role of Maternity Services. Geneva, Switzerland1989.
49. World Health Organization. The Optimal Duration of Exclusive Breastfeeding. Geneva,
Switzerland: World Health Organization; 2001.
50. Greenland S, Schlesselman JJ, Criqui MH. The fallacy of employing standardized regression
coefficients and correlations as measures of effect. Am J Epidemiol 1986; 123(2):203-208.
51. Greenland S, Maclure M, Schlesselman JJ, Poole C, Morgenstern H. Standardized
regression coefficients: a further critique and review of some alternatives. Epidemiology
1991; 2(5):387-392.
19
Tables
Table 1. Meta-analytical linear regression coefficients (β) of cognitive measures (in standard
deviation units) according to breastfeeding (never=0; ever=1), within strata of FADS2 rs174575
or rs1513 genotypes (recessive effect).
Model Statistic Fixed effects Random effects
FADS2 G×E FADS2 G×E
Other
genotypes GG
Other
genotypes GG
rs174575 (CC or CG=0; GG=1)
Unadjusted I2 - - - 76.4 64.4 77.6
Nestimates=8 P-value 8.6×10-50 3.8×10⁻⁸ 0.188 7.6×10⁻⁷ 0.002 0.323
Nsubjects=12,614 β 0.37 0.43 0.11 0.29 0.43 0.18
95% CI 0.32; 0.41 0.28; 0.58 -0.05; 0.27 0.17; 0.40 0.16; 0.70 -0.18; 0.54
Adjusted (1)a I2 - - - 74.2 67.2 75.5
Nestimates=8 P-value 7.7×10-48 9.3×10⁻⁷ 0.603 7.9×10⁻⁷ 0.024 0.705
Nsubjects=12,590 β 0.37 0.39 0.04 0.29 0.35 0.07
95% CI 0.32; 0.42 0.23; 0.54 -0.12; 0.21 0.18; 0.41 0.04; 0.65 -0.29; 0.43
Adjusted (2)b I2 - - - 84.1 47.4 59.5
Nestimates=8 P-value 6.4×10⁻²⁰ 6.4×10⁻⁵ 0.244 0.055 0.020 0.445
Nsubjects=12,077 β 0.25 0.34 0.10 0.15 0.31 0.12
95% CI 0.20; 0.31 0.17; 0.51 -0.07; 0.28 0.00; 0.31 0.05; 0.58 -0.19; 0.43
rs1535 (AA or AG=0; GG=1)
Unadjusted I2 - - - 73.5 54.1 42.6
Nestimates=9 P-value 9.2×10-49
2.2×10⁻⁶
0.663 4.6×10⁻⁷
0.013 0.646
Nsubjects=13,202 β 0.37 0.29 -0.03 0.29 0.24 -0.04
95% CI 0.32; 0.42 0.17; 0.41 -0.16; 0.10 0.18; 0.40 0.05; 0.43 -0.24; 0.15
Adjusted (1)a I2 - - - 76.0 47.7 60.9
Nestimates=9 P-value 9.9×10-47
2.2×10⁻⁷
0.720 7.1×10⁻⁶
5.4×10⁻³
0.778
Nsubjects=13,175 β 0.37 0.33 -0.02 0.29 0.27 -0.03
95% CI 0.32; 0.42 0.20; 0.45 -0.16; 0.11 0.16; 0.42 0.08; 0.47 -0.28; 0.21
Adjusted (2)b I2 - - - 84.0 25.9 49.6
Nestimates=9 P-value 1.9×10⁻¹⁹
1.2×10⁻⁵
0.277 0.065 0.003 0.592
Nsubjects=12,633 β 0.26 0.28 0.07 0.15 0.25 0.06
95% CI 0.20; 0.31 0.16; 0.41 -0.06; 0.21 -0.01; 0.32 0.09; 0.41 -0.16; 0.27 aCovariates were sex, age (linear and quadraric terms), ancestry-informative principal components (if available) and genotyping centre
(if necessary). bSame covariates than in the Adjusted (1) model, in addition to maternal education (linear and quadratic terms) and/or maternal
cognition (linear and quadratic terms).
GxE: interaction between breastfeeding and polymorphisms in the FADS2 gene.
Nestimates: number of estimates being pooled. Nsubjects: pooled sample size.

20
Table 2. Meta-analytical linear regression coefficients (β) of the interaction term between
FADS2 rs174575 or rs1535 genotypes (recessive effect) with breastfeeding (<6 months vs. ≥6
months, in ordinal categories or in months), having cognitive measures (in standard deviation
units) as the outcome.
Model Statistic Fixed effects Random effects
<6 months=0
≥6 months=1
Numerically-
coded
categories
Months <6 months=0
≥6 months=1
Numerically-
coded
categories
Months
rs174575 (CC or CG=0; GG=1)
Unadjusted I2 - - - 23.1 57.1 13.9
Nestimates=8 P-value 0.515 0.104 0.371 0.647 0.150 0.335
Nsubjects=11,733 β 0.05 0.04 0.01 0.04 0.06 0.01
95% CI -0.10; 0.20 -0.01; 0.09 -0.01; 0.02 -0.14; 0.22 -0.02; 0.15 -0.01; 0.03
Adjusted (1)a I
2 - - - 53.6 58.7 63.3
Nestimates=8 P-value 0.378 0.189 0.608 0.546 0.282 0.635
Nsubjects=11,706 β 0.07 0.04 0.00 0.08 0.06 0.01
95% CI -0.09; 0.23 -0.02; 0.09 -0.01; 0.02 -0.18; 0.35 -0.05; 0.16 -0.02; 0.04
Adjusted (2)b I
2 - - - 82.6 84.6 85.3
Nestimates=8 P-value 0.244 0.132 0.782 0.496 0.346 0.602
Nsubjects=11,242 β 0.10 0.04 0.00 0.17 0.09 0.01
95% CI -0.07; 0.26 -0.01; 0.10 -0.01; 0.02 -0.32; 0.65 -0.09; 0.26 -0.04; 0.07
rs1535 (AA or AG=0; GG=1)
Unadjusted I2 - - - 0.0 0.0 0.0
Nestimates=8 P-value 0.460 0.966 0.805 0.460 0.966 0.805
Nsubjects=12,018 β -0.05 0.00 0.00 -0.05 0.00 0.00
95% CI -0.17; 0.08 -0.04; 0.04 -0.01; 0.01 -0.17; 0.08 -0.04; 0.04 -0.01; 0.01
Adjusted (1)a I
2 - - - 8.0 54.3 59.6
Nestimates=8 P-value 0.248 0.508 0.538 0.302 0.635 0.330
Nsubjects=11,991 β -0.07 -0.01 0.00 -0.07 -0.02 -0.01
95% CI -0.20; 0.05 -0.06; 0.03 -0.01; 0.01 -0.20; 0.06 -0.09; 0.05 -0.03; 0.01
Adjusted (2)b I
2 - - - 3.9 29.9 35.5
Nestimates=8 P-value 0.194 0.675 0.320 0.216 0.728 0.344
Nsubjects=11,499 β -0.08 -0.01 -0.01 -0.08 -0.01 -0.01
95% CI -0.21; 0.04 -0.05; 0.03 -0.02; 0.01 -0.21; 0.05 -0.07; 0.05 -0.02; 0.01 aCovariates were sex, age (linear and quadratic terms), ancestry-informative principal components (if available) and genotyping centre (if
necessary). bSame covariates than in the Adjusted (1) model, in addition to maternal education (linear and quadratic terms) and/or maternal cognition
(linear and quadratic terms).
Nestimates: number of estimates being pooled. Nsubjects: pooled sample size.

21
Table 3. Stratified random effects meta-analytical linear regression coefficients (β) of the interaction term between FADS2 rs174575 or rs1535 genotypes
(recessive effect) with breastfeeding (never=0; ever=1), having cognitive measures (in standard deviation units) as the outcome. Estimates from the fully
adjusted model were used.
Variable Categories rs174575 (CC or CG=0; GG=1) rs1535 (AA or AG=0; GG=1)
Nestimates β (95% CI) P-value Adjusted Nestimates β (95% CI) P-value Adjusted
(Nsubjects) R² (%) (Nsubjects) R² (%)
IQ test Wechslera 8055 (4) 0.12 (-0.32; 0.56) 0.591 0.0 8070 (4) 0.09 (-0.14; 0.32) 0.452 0.0
Other 4022 (4) 0.12 (-0.37; 0.61) 0.631 4563 (5) 0.02 (-0.45; 0.49) 0.932
Adjustment Yes 10,441 (6) 0.28 (0.02; 0.54) 0.036 88.0 10753 (7) 0.09 (-0.19; 0.37) 0.531 0.0
for PCs No 1636 (2) -0.38 (-0.72; -0.04) 0.028 1880 (2) -0.03 (-0.32; 0.25) 0.814
Age at IQ ≥10 years 4373 (4) 0.06 (-0.46; 0.58) 0.825 0.0b; 10.4
c 4374 (4) 0.04 (-0.25; 0.34) 0.773 0.0
b; 0.0
c
measurement <10 years 7704 (4) 0.20 (-0.18; 0.58) 0.304 8259 (5) 0.07 (-0.31; 0.45) 0.700
BF measurement Prospective 6912 (3) 0.27 (-0.10; 0.63) 0.155 0.0 6926 (3) 0.20 (-0.25; 0.64) 0.383 0.0
Retrospective 5165 (5) -0.01 (-0.48; 0.47) 0.979 5707 (6) -0.01 (-0.28; 0.27) 0.951
Continental Europe 7704 (4) 0.20 (-0.18; 0.58) 0.304 0.0 8259 (5) 0.07 (-0.31; 0.45) 0.700 0.0
Region Other 4373 (4) 0.06 (-0.46; 0.58) 0.825 4374 (4) 0.04 (-0.25; 0.34) 0.773
Mean year of ≥2000 3002 (3) 0.20 (-0.58; 0.98) 0.616 0.0b; 2.9
c 3543 (4) 0.03 (-0.62; 0.69) 0.917 0.0
b; 0.0
c
Birth <2000 9075 (5) 0.10 (-0.27; 0.46) 0.601 9090 (5) 0.07 (-0.13; 0.27) 0.469
Prevalence of ≥90 4798 (4) 0.36 (-0.19; 0.90) 0.200 16.4b; 72.3
c 5339 (5) 0.15 (-0.31; 0.62) 0.519 0.0
b; 8.3
c
any BF (%) <90 7279 (4) -0.04 (-0.38; 0.29) 0.803 7294 (4) 0.01 (-0.15; 0.18) 0.869
Duration of any ≥5.85 3367 (3) 0.50 (-0.06; 1.06) 0.081 45.5b; 0.0
c 3665 (4) 0.27 (-0.28; 0.82) 0.333 22.2
b; 4.9
c
BF (months) <5.85 7866 (4) 0.14 (-0.10; 0.38) 0.255 8123 (4) -0.01 (-0.19; 0.16) 0.882
Sample size (N) ≥1000 9177 (4) 0.26 (0.00; 0.52) 0.052 33.8b; 0.0
c 9191 (4) 0.11 (-0.12; 0.34) 0.365 0.0
b; 0.0
c
<1000 2900 (4) -0.03 (-0.63; 0.56) 0.910 3442 (5) 0.01 (-0.43; 0.45) 0.974 aIncludes both Wechsler Adult Intelligence Scale (ALSPAC and Dunedin Multidisciplinary Health and Development Study) and Wechsler Intelligence Scale for Children
(1982 Pelotas Birth Cohort and Saguenay Youth Study). bVariable categorised as shown in the table.
cVariable entered in continuous form (e.g., age at outcome measurement modelled in years, as a continuous variable).
PCs: ancestry-informative genetic principal components. BF: breastfeeding. N: number of. CI: confidence interval.

22
Nestimates: number of estimates being pooled. Nsubjects: pooled sample size.

23
Table 4. Meta-analytical linear regression coefficients (β) of the interaction term between
FADS2 rs174575 or rs1535 genotypes (recessive effect) with breastfeeding (never=0; ever=1),
having maternal education (in complete years) or maternal cognitive measures (in standard
deviation units) as the outcome.
Model Statistic Fixed effects Random
effects
Maternal
education
Maternal
cognition
Maternal
education
Maternal
cognition
rs174575 (CC or CG=0; GG=1)
Unadjusted Nestimates 7 5 7 5
Nsubjects 14,671 6299 14671 6299
I2 - - 81.1 18.1
P-value 0.159 0.326 0.375 0.389
β 0.28 0.10 0.59 0.10
95% CI -0.11; 0.66 -0.10; 0.31 -0.72; 1.91 -0.13; 0.33
Adjusted (1)a Nestimates 7 5 7 5
Nsubjects 12,113 6126 12113 6126
I2 - - 14.1 0.0
P-value 0.509 0.854 0.607 0.854
β 0.16 -0.02 0.16 -0.02
95% CI -0.31; 0.62 -0.25; 0.21 -0.45; 0.78 -0.25; 0.21
rs1535 (AA or AG=0; GG=1)
Unadjusted Nestimates 8 5 8 5
Nsubjects 15,447 6556 15447 6556
I2 - - 1.4 0.0
P-value 0.784 0.272 0.814 0.272
β -0.05 0.10 -0.04 0.10
95% CI -0.38; 0.28 -0.08; 0.28 -0.39; 0.31 -0.08; 0.28
Adjusted (1)a Nestimates 8 5 8 5
Nsubjects 12,743 6378 12743 6378
I2 - - 0.0 0.0
P-value 0.540 0.160 0.540 0.160
β -0.12 0.14 -0.12 0.14
95% CI -0.51; 0.27 -0.05; 0.33 -0.51; 0.27 -0.05; 0.33 a
Covariates were sex, age (linear and quatric terms), ancestry-informative principal components (if available)
and genotyping centre (if necessary).
Nestimates: number of estimates being pooled. Nsubjects: pooled sample size.
24
Figure legends
Figure 1. Forest plots of mean differences in IQ Z scores from the fully adjusted model
comparing ever with never breastfed individuals based on random effects meta-analysis.
SKOT-I and SKOT-II were excluded from the analyses for the rs174575 polymorphism because
the model did not fit (due to a combination of modest sample size, high prevalence of
breastfeeding and assuming a recessive genetic effect of the rarest allele).
1982Pelotas: 1982 Pelotas Birth Cohort. ALSPAC: Avon Longitudinal Study of Parents and
Children. COPSAC2010: Copenhagen Prospective Study on Asthma in Childhood 2010. DMHDS:
Dunedin Multidisciplinary Health and Development Study. GenerationR: Generation R Study.
INMA: INfancia y Medio Ambiente - Environment and Childhood. Raine: Western Australian
Pregnancy Cohort (Raine) Study. SKOT-I & II: Småbørn Kost Og Trivsel (I and II). SYS: Saguenay
Youth Study.
Figure 2. Scatter plots of mean differences (with 95% confidence intervals) in IQ Z scores
from the fully adjusted model comparing ever with never breastfed individuals according to
prevalence (%) of ever breastfeeding and average breastfeeding duration in months.


![Indonesia[1] kmi tmi copy](https://static.fdocuments.us/doc/165x107/5a6ce6127f8b9a1b428b45c9/indonesia1-kmi-tmi-copy.jpg)


