
dynaTrace 2.6 Integration Handbook - ProxySniffer · dynaTrace Session is not yet active, the...
17
Ingenieurbüro David Fischer GmbH Mühlemattstrasse 61, 3007 Bern Switzerland http://www.proxy-sniffer.com E-Mail: [email protected] Proxy Sniffer V4.2 dynaTrace 2.6 Integration Handbook English Edition © 2008 by Ingenieurbüro David Fischer GmbH All Rights Reserved.
Transcript of dynaTrace 2.6 Integration Handbook - ProxySniffer · dynaTrace Session is not yet active, the...

Ingenieurbüro David Fischer GmbH Mühlemattstrasse 61, 3007 Bern Switzerland
http://www.proxy-sniffer.com E-Mail: [email protected]
Proxy Sniffer V4.2 dynaTrace 2.6 Integration Handbook
English Edition
© 2008 by Ingenieurbüro David Fischer GmbH All Rights Reserved.
Proxy Sniffer V4.2 dynaTrace 2.6 Integration Handbook
© 2008 by Ingenieurbüro David Fischer GmbH All Rights Reserved Page 2 / 17
Table of Contents
1 Overview ........................................................................................................................... 3
1.1 Content of this Document ........................................................................................... 3 1.2 Introduction ................................................................................................................ 3
2 dynaTrace Integration ....................................................................................................... 4 2.1 dynaTrace Configuration in Proxy Sniffer ................................................................... 4 2.2 Preparing the Load Test Program .............................................................................. 6 2.3 Running the Load Test Program................................................................................. 7
2.3.1 Additional Hints ................................................................................................... 9 2.3.2 Real-Time Access during the Load Test ............................................................ 10
2.4 Analyzing Measurement Results .............................................................................. 12 2.4.1 Tracing Individual HTTP/S Requests in Load Test Results ............................... 13 2.4.2 Error Snapshots ................................................................................................ 16
3 Manufacturer ................................................................................................................... 17
Proxy Sniffer V4.2 dynaTrace 2.6 Integration Handbook
© 2008 by Ingenieurbüro David Fischer GmbH All Rights Reserved Page 3 / 17
1 Overview
1.1 Content of this Document
This handbook describes how to integrate Proxy Sniffer with the "dynaTrace Diagnostics" software product from the company dynaTrace software GmbH. Additional information about the dynaTrace product can be found at http://www.dynatrace.com
1.2 Introduction
Proxy Sniffer can produce additional data during a Load Test which can subsequently be analyzed using the server-side diagnostic tool "dynaTrace Diagnostics". It is now possible to compare - from outside of the Web Server - measured response times and/or error responses with corresponding processes from inside the Web Server. As a concrete example, individual HTTP/S calls created by Proxy Sniffer can be traced using "dynaTrace Diagnostics" inside the Web Server, assisting in creating an efficient optimization process, and leading to the stabilization of server-side program code.
Proxy Sniffer V4.2 dynaTrace 2.6 Integration Handbook
© 2008 by Ingenieurbüro David Fischer GmbH All Rights Reserved Page 4 / 17
2 dynaTrace Integration
2.1 dynaTrace Configuration in Proxy Sniffer
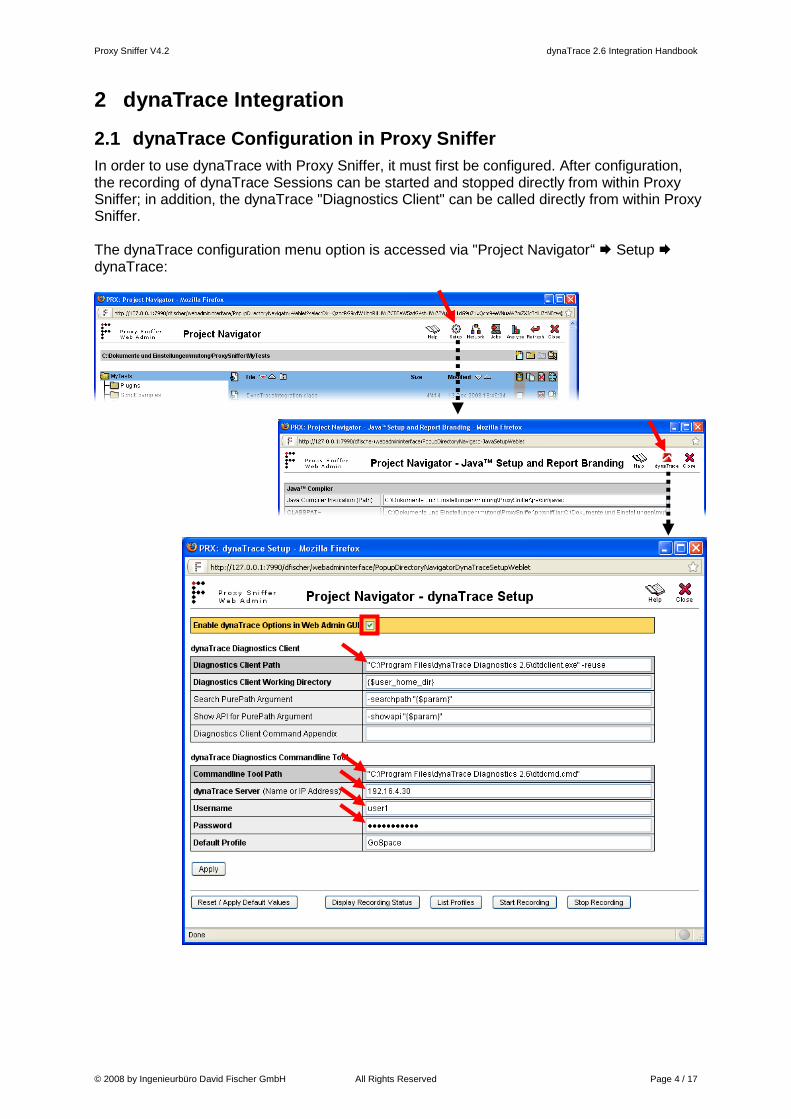
In order to use dynaTrace with Proxy Sniffer, it must first be configured. After configuration, the recording of dynaTrace Sessions can be started and stopped directly from within Proxy Sniffer; in addition, the dynaTrace "Diagnostics Client" can be called directly from within Proxy Sniffer. The dynaTrace configuration menu option is accessed via "Project Navigator“ Setup dynaTrace:
Proxy Sniffer V4.2 dynaTrace 2.6 Integration Handbook
© 2008 by Ingenieurbüro David Fischer GmbH All Rights Reserved Page 5 / 17
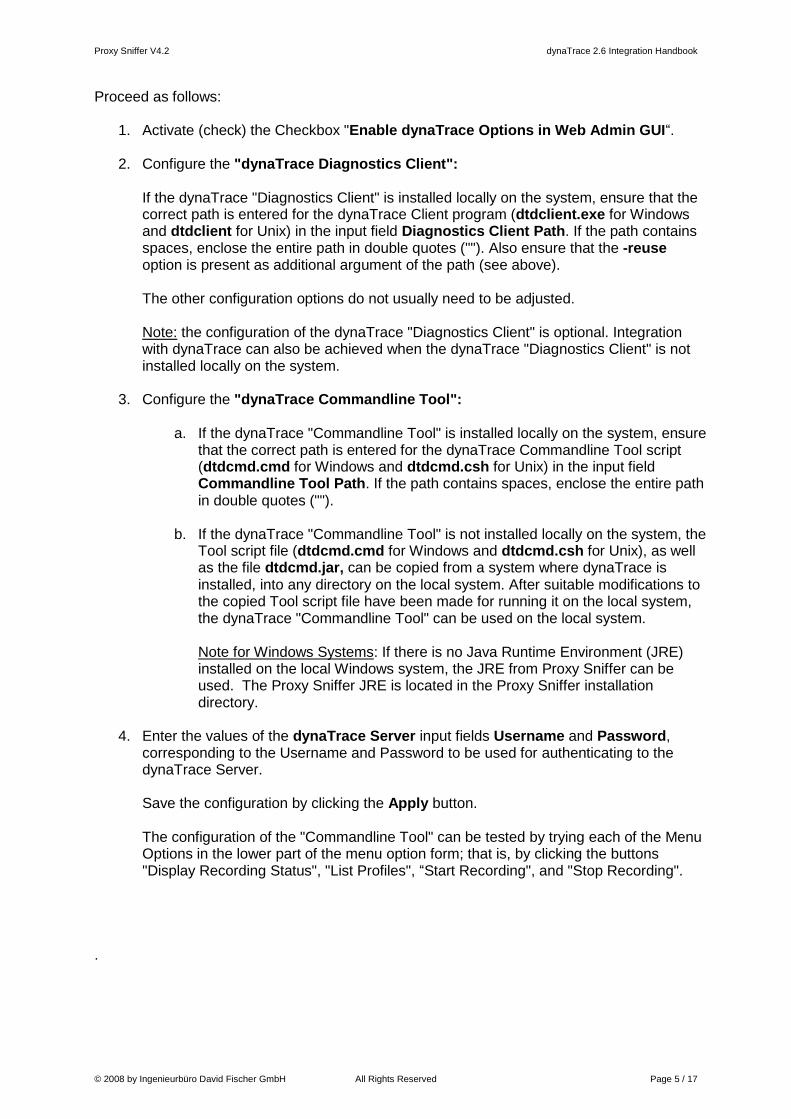
Proceed as follows:
1. Activate (check) the Checkbox "Enable dynaTrace Options in Web Admin GUI“.
2. Configure the "dynaTrace Diagnostics Client": If the dynaTrace "Diagnostics Client" is installed locally on the system, ensure that the correct path is entered for the dynaTrace Client program (dtdclient.exe for Windows and dtdclient for Unix) in the input field Diagnostics Client Path. If the path contains spaces, enclose the entire path in double quotes (""). Also ensure that the -reuse option is present as additional argument of the path (see above). The other configuration options do not usually need to be adjusted. Note: the configuration of the dynaTrace "Diagnostics Client" is optional. Integration with dynaTrace can also be achieved when the dynaTrace "Diagnostics Client" is not installed locally on the system.
3. Configure the "dynaTrace Commandline Tool":
a. If the dynaTrace "Commandline Tool" is installed locally on the system, ensure that the correct path is entered for the dynaTrace Commandline Tool script (dtdcmd.cmd for Windows and dtdcmd.csh for Unix) in the input field Commandline Tool Path. If the path contains spaces, enclose the entire path in double quotes ("").
b. If the dynaTrace "Commandline Tool" is not installed locally on the system, the Tool script file (dtdcmd.cmd for Windows and dtdcmd.csh for Unix), as well as the file dtdcmd.jar, can be copied from a system where dynaTrace is installed, into any directory on the local system. After suitable modifications to the copied Tool script file have been made for running it on the local system, the dynaTrace "Commandline Tool" can be used on the local system. Note for Windows Systems: If there is no Java Runtime Environment (JRE) installed on the local Windows system, the JRE from Proxy Sniffer can be used. The Proxy Sniffer JRE is located in the Proxy Sniffer installation directory.
4. Enter the values of the dynaTrace Server input fields Username and Password,
corresponding to the Username and Password to be used for authenticating to the dynaTrace Server. Save the configuration by clicking the Apply button. The configuration of the "Commandline Tool" can be tested by trying each of the Menu Options in the lower part of the menu option form; that is, by clicking the buttons "Display Recording Status", "List Profiles", “Start Recording", and "Stop Recording".
.
Proxy Sniffer V4.2 dynaTrace 2.6 Integration Handbook
© 2008 by Ingenieurbüro David Fischer GmbH All Rights Reserved Page 6 / 17
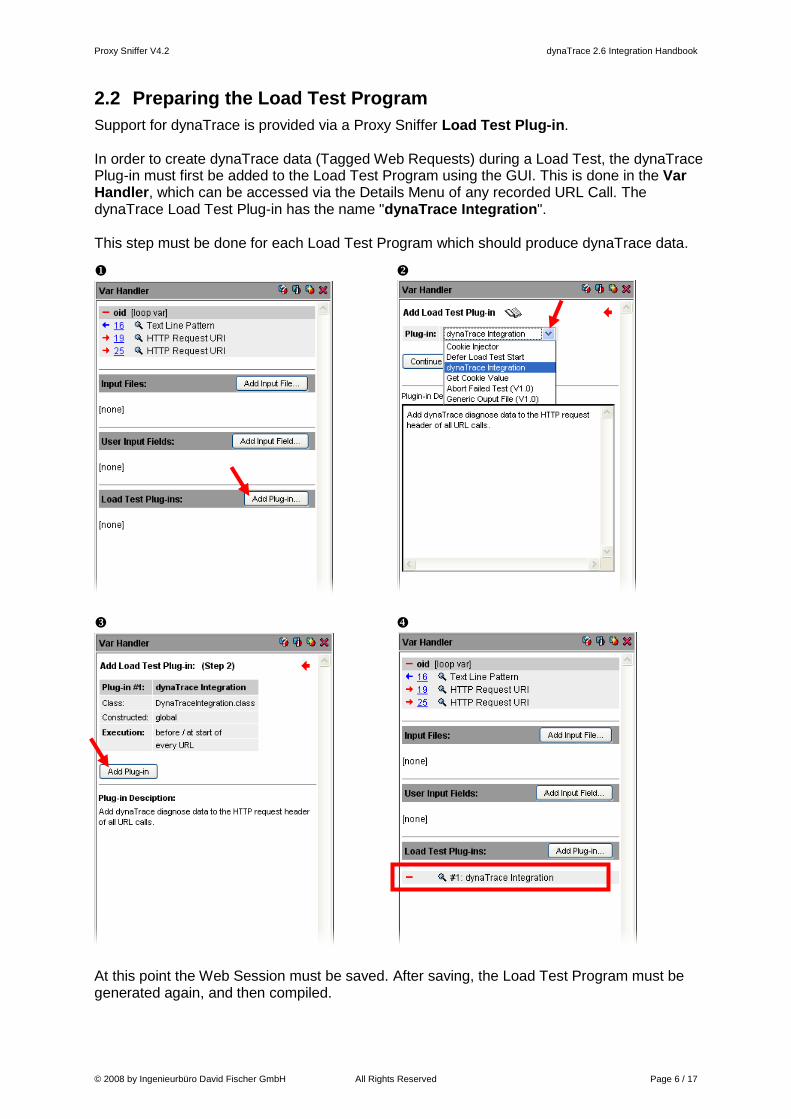
2.2 Preparing the Load Test Program
Support for dynaTrace is provided via a Proxy Sniffer Load Test Plug-in. In order to create dynaTrace data (Tagged Web Requests) during a Load Test, the dynaTrace Plug-in must first be added to the Load Test Program using the GUI. This is done in the Var Handler, which can be accessed via the Details Menu of any recorded URL Call. The dynaTrace Load Test Plug-in has the name "dynaTrace Integration". This step must be done for each Load Test Program which should produce dynaTrace data.
At this point the Web Session must be saved. After saving, the Load Test Program must be generated again, and then compiled.

Proxy Sniffer V4.2 dynaTrace 2.6 Integration Handbook
© 2008 by Ingenieurbüro David Fischer GmbH All Rights Reserved Page 7 / 17
2.3 Running the Load Test Program
The dynaTrace Plug-in is automatically combined together with the program code into a zip archive when the Load Test Program is started.
In order to access the dynaTrace data from Proxy Sniffer, ensure that the HTTP Response Headers for all URL Calls are collected by Proxy Sniffer during the Load Test:
Ensure that the "Additional Sampling Rate per URL Call" is set to 100% (or a lower value for a long-running Load Test), and then select the "Add" Option "Response Headers".
Proxy Sniffer V4.2 dynaTrace 2.6 Integration Handbook
© 2008 by Ingenieurbüro David Fischer GmbH All Rights Reserved Page 8 / 17
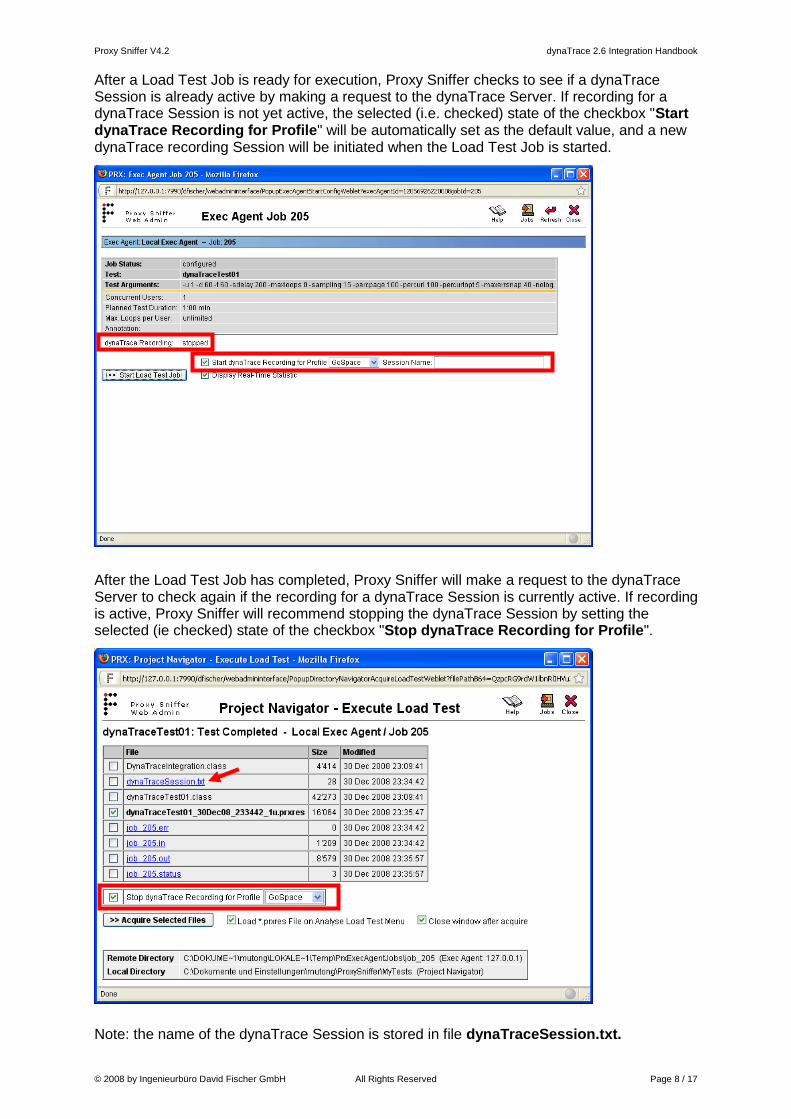
After a Load Test Job is ready for execution, Proxy Sniffer checks to see if a dynaTrace Session is already active by making a request to the dynaTrace Server. If recording for a dynaTrace Session is not yet active, the selected (i.e. checked) state of the checkbox "Start dynaTrace Recording for Profile" will be automatically set as the default value, and a new dynaTrace recording Session will be initiated when the Load Test Job is started.
After the Load Test Job has completed, Proxy Sniffer will make a request to the dynaTrace Server to check again if the recording for a dynaTrace Session is currently active. If recording is active, Proxy Sniffer will recommend stopping the dynaTrace Session by setting the selected (ie checked) state of the checkbox "Stop dynaTrace Recording for Profile".
Note: the name of the dynaTrace Session is stored in file dynaTraceSession.txt.
Proxy Sniffer V4.2 dynaTrace 2.6 Integration Handbook
© 2008 by Ingenieurbüro David Fischer GmbH All Rights Reserved Page 9 / 17
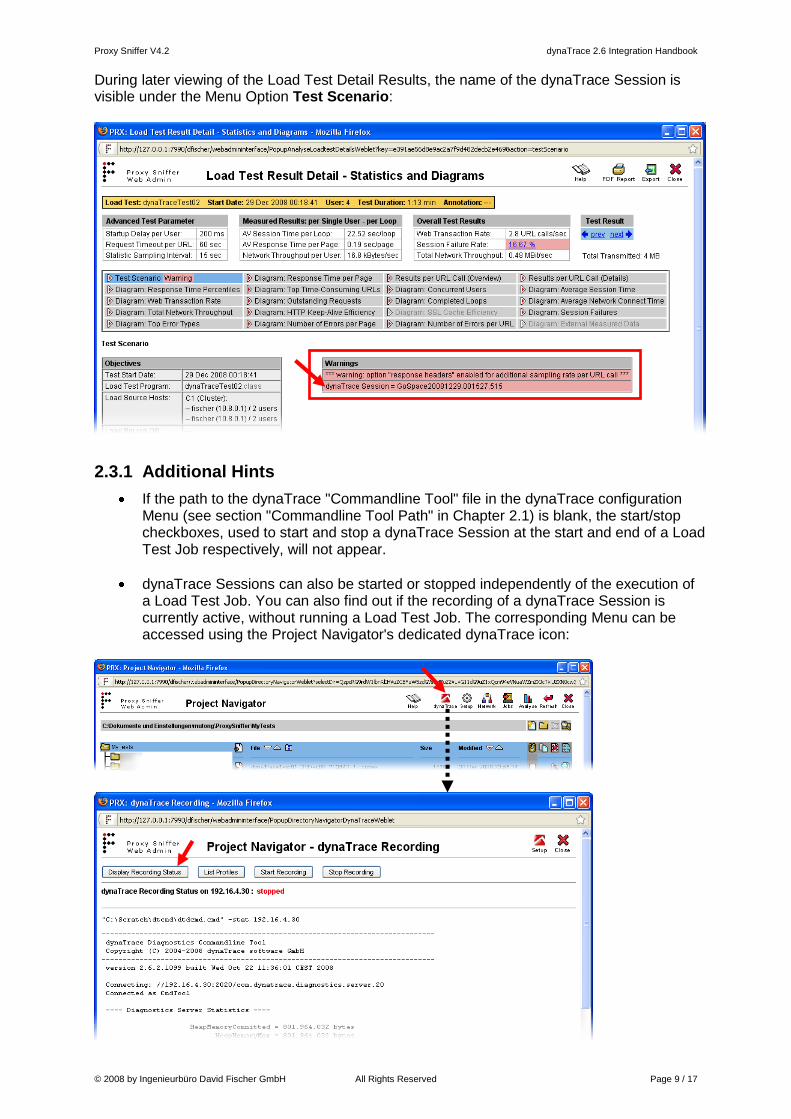
During later viewing of the Load Test Detail Results, the name of the dynaTrace Session is visible under the Menu Option Test Scenario:
2.3.1 Additional Hints
If the path to the dynaTrace "Commandline Tool" file in the dynaTrace configuration Menu (see section "Commandline Tool Path" in Chapter 2.1) is blank, the start/stop checkboxes, used to start and stop a dynaTrace Session at the start and end of a Load Test Job respectively, will not appear.
dynaTrace Sessions can also be started or stopped independently of the execution of a Load Test Job. You can also find out if the recording of a dynaTrace Session is currently active, without running a Load Test Job. The corresponding Menu can be accessed using the Project Navigator's dedicated dynaTrace icon:
Proxy Sniffer V4.2 dynaTrace 2.6 Integration Handbook
© 2008 by Ingenieurbüro David Fischer GmbH All Rights Reserved Page 10 / 17
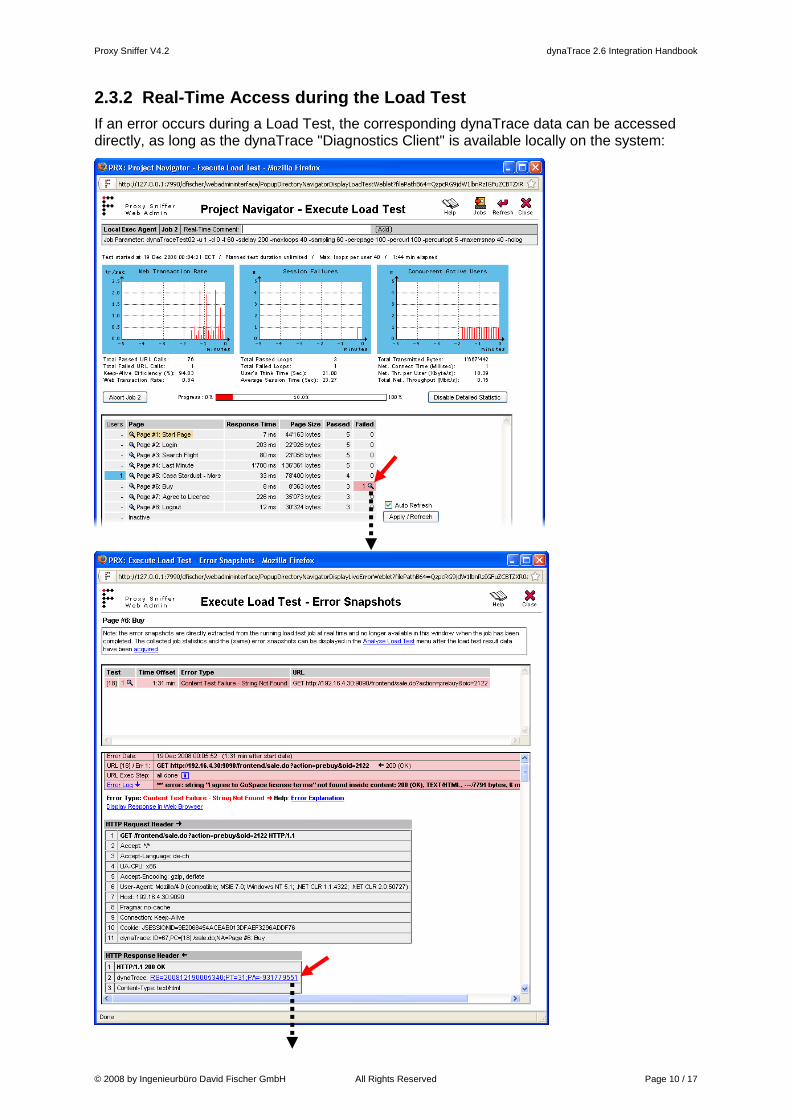
2.3.2 Real-Time Access during the Load Test
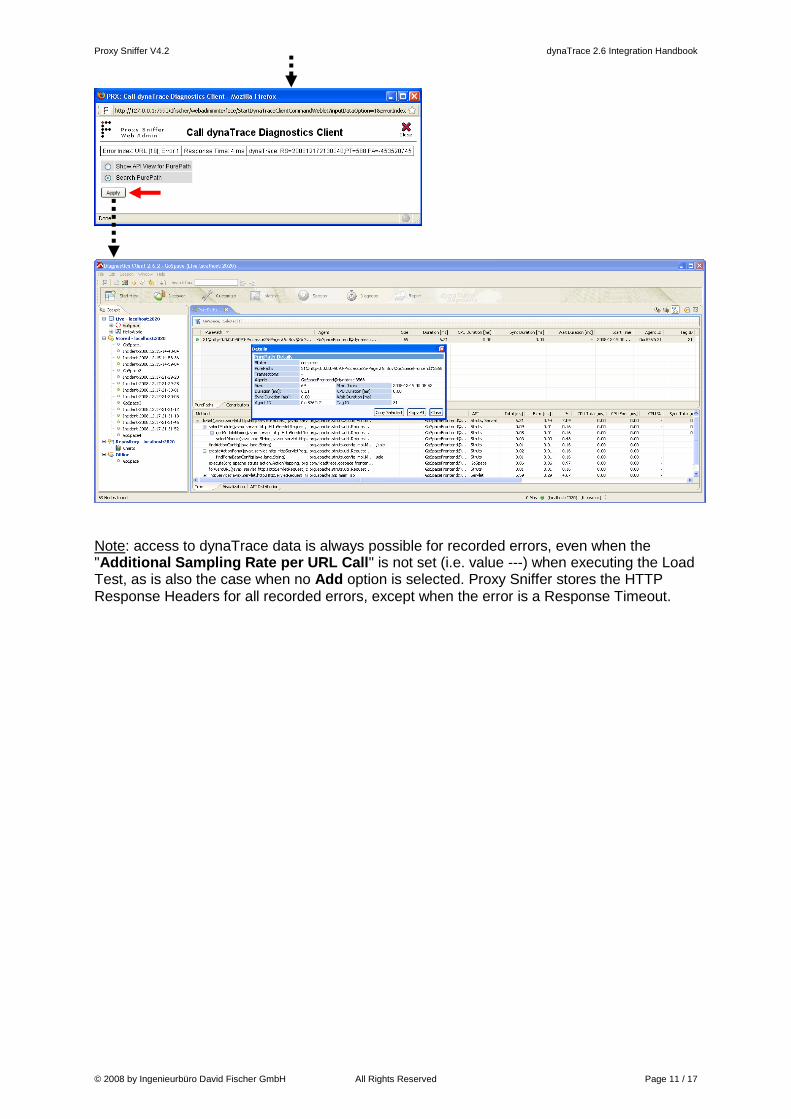
If an error occurs during a Load Test, the corresponding dynaTrace data can be accessed directly, as long as the dynaTrace "Diagnostics Client" is available locally on the system:
Proxy Sniffer V4.2 dynaTrace 2.6 Integration Handbook
© 2008 by Ingenieurbüro David Fischer GmbH All Rights Reserved Page 11 / 17
Note: access to dynaTrace data is always possible for recorded errors, even when the "Additional Sampling Rate per URL Call" is not set (i.e. value ---) when executing the Load Test, as is also the case when no Add option is selected. Proxy Sniffer stores the HTTP Response Headers for all recorded errors, except when the error is a Response Timeout.
Proxy Sniffer V4.2 dynaTrace 2.6 Integration Handbook
© 2008 by Ingenieurbüro David Fischer GmbH All Rights Reserved Page 12 / 17
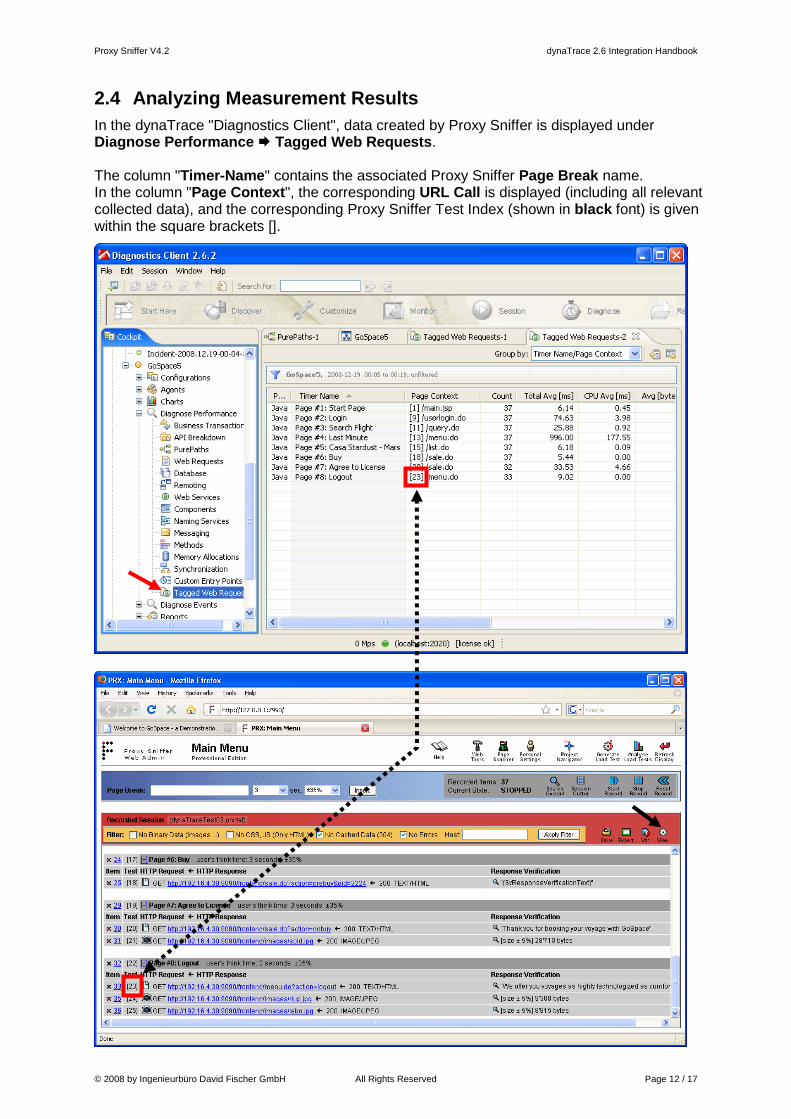
2.4 Analyzing Measurement Results
In the dynaTrace "Diagnostics Client", data created by Proxy Sniffer is displayed under Diagnose Performance Tagged Web Requests. The column "Timer-Name" contains the associated Proxy Sniffer Page Break name. In the column "Page Context", the corresponding URL Call is displayed (including all relevant collected data), and the corresponding Proxy Sniffer Test Index (shown in black font) is given within the square brackets [].
Proxy Sniffer V4.2 dynaTrace 2.6 Integration Handbook
© 2008 by Ingenieurbüro David Fischer GmbH All Rights Reserved Page 13 / 17
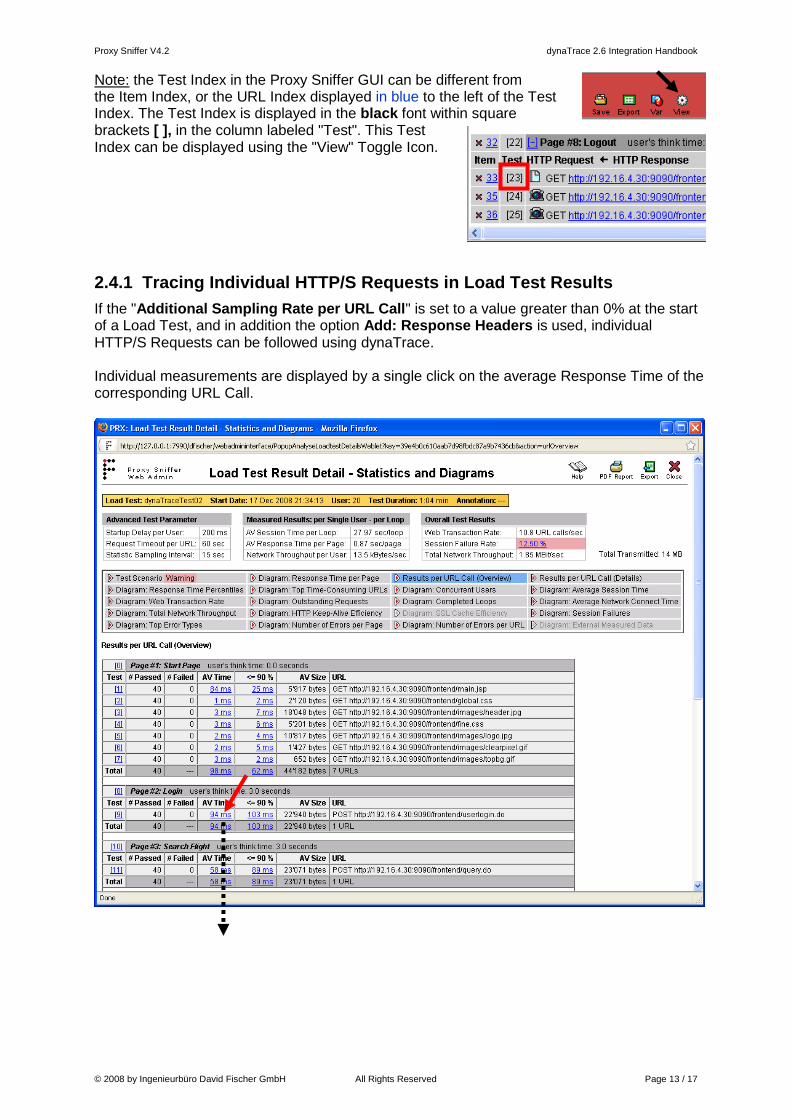
Note: the Test Index in the Proxy Sniffer GUI can be different from the Item Index, or the URL Index displayed in blue to the left of the Test Index. The Test Index is displayed in the black font within square brackets [ ], in the column labeled "Test". This Test Index can be displayed using the "View" Toggle Icon.
2.4.1 Tracing Individual HTTP/S Requests in Load Test Results
If the "Additional Sampling Rate per URL Call" is set to a value greater than 0% at the start of a Load Test, and in addition the option Add: Response Headers is used, individual HTTP/S Requests can be followed using dynaTrace. Individual measurements are displayed by a single click on the average Response Time of the corresponding URL Call.

Proxy Sniffer V4.2 dynaTrace 2.6 Integration Handbook
© 2008 by Ingenieurbüro David Fischer GmbH All Rights Reserved Page 14 / 17
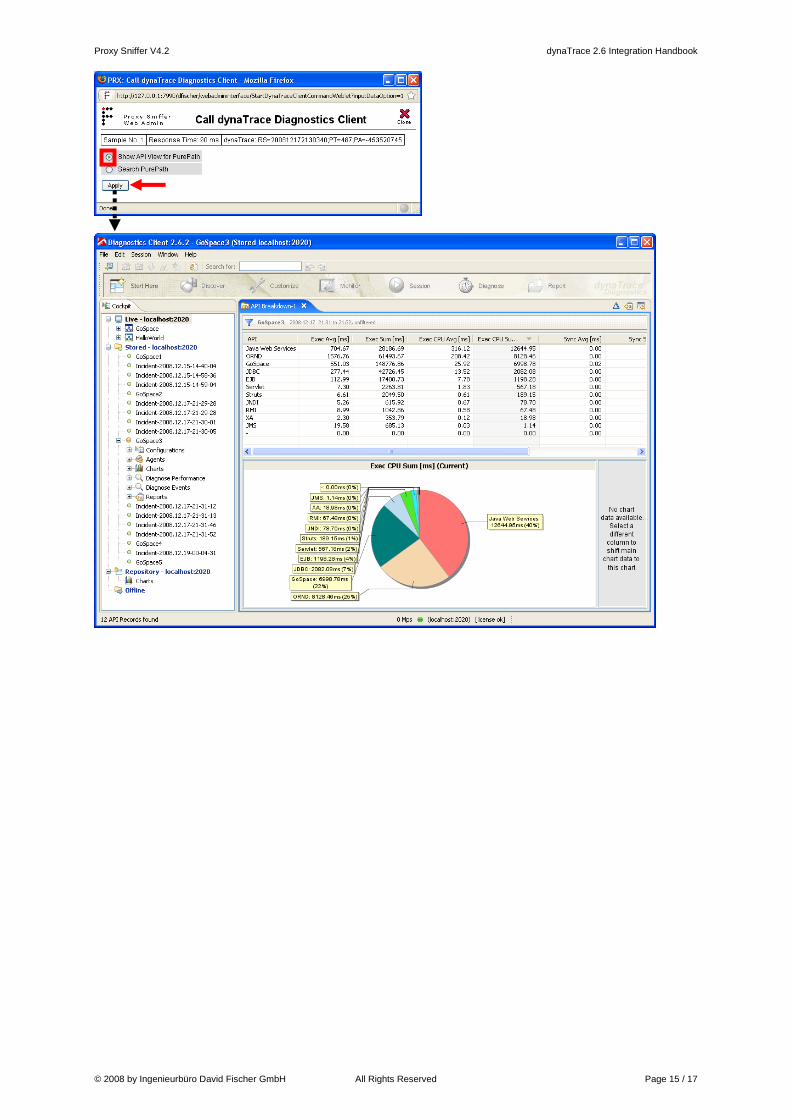
The "Diagnostics Client" can now be called for each individual measurement.
Proxy Sniffer V4.2 dynaTrace 2.6 Integration Handbook
© 2008 by Ingenieurbüro David Fischer GmbH All Rights Reserved Page 15 / 17
Proxy Sniffer V4.2 dynaTrace 2.6 Integration Handbook
© 2008 by Ingenieurbüro David Fischer GmbH All Rights Reserved Page 16 / 17
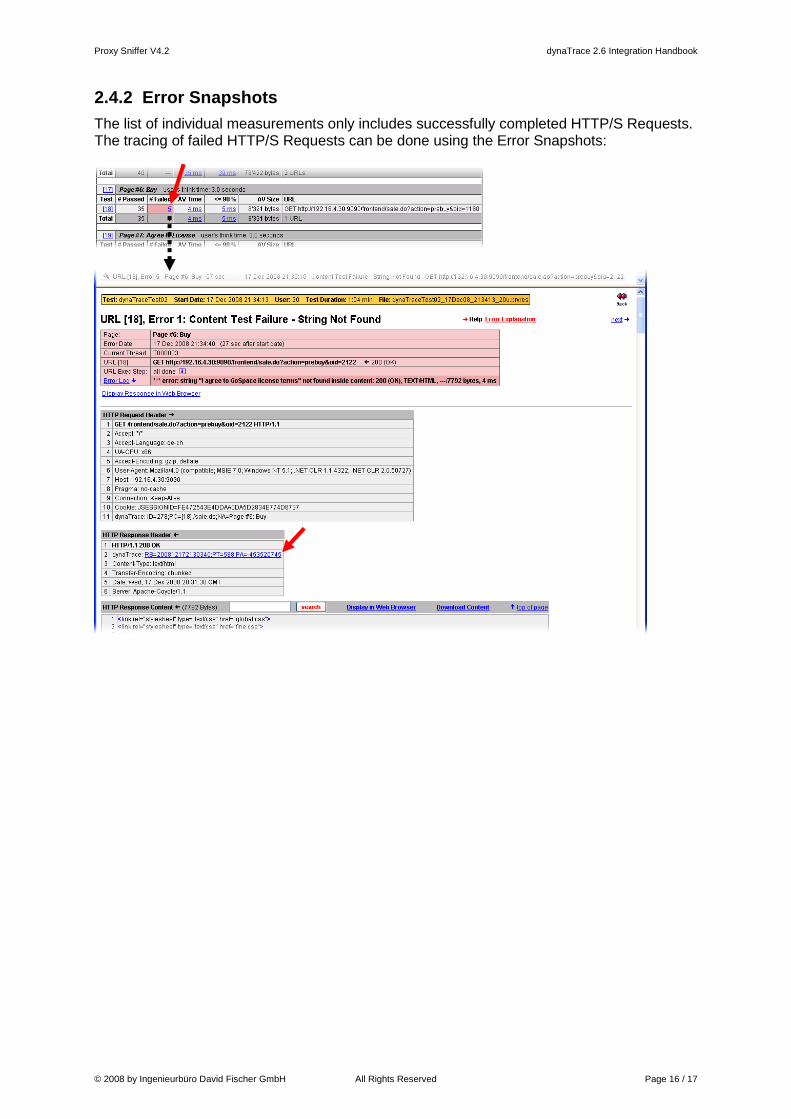
2.4.2 Error Snapshots
The list of individual measurements only includes successfully completed HTTP/S Requests. The tracing of failed HTTP/S Requests can be done using the Error Snapshots:

Proxy Sniffer V4.2 dynaTrace 2.6 Integration Handbook
© 2008 by Ingenieurbüro David Fischer GmbH All Rights Reserved Page 17 / 17
3 Manufacturer Ingenieurbüro David Fischer GmbH Mühlemattstrasse 61 3007 Bern Schweiz Homepage: http://www.proxy-sniffer.com E-Mail: [email protected]