Dynasty Ceramic
35
Dynasty Ceramic “We are making the impossible, POSSIBLE.”
description
Dynasty Ceramic. “We are making the impossible, POSSIBLE.”. Contents. History Sales Market Analysis Cost of Production Performance Going Forward. “Please feel free to ask any questions according to the topic presenting.”. 2. “Our roadmap to number 1.”. History. 3. Timeline. - PowerPoint PPT Presentation
Transcript of Dynasty Ceramic
Dynasty Ceramic“We are making the impossible, POSSIBLE.”

ContentsHistorySalesMarket AnalysisCost of ProductionPerformanceGoing Forward
“Please feel free to ask any questions according to the topic presenting.”
2

HISTORY“Our roadmap to number 1.”
3

Timeline
Esta
blish
ed 1
st of
Augu
st 1
989
Listin
g on
SET
3rd o
f Ja
nuar
y 199
2
Mer
ged
with
Tile
Top
Indu
stry
199
7
First
Com
pany
Ow
ned
Outle
t 199
8
Forb
es A
ward
s 200
2Fo
rbes
Awa
rds 2
006
Dyna
sty P
rodu
ction
Proc
ess 2
004
Impr
ovem
ents
200
7
Was
te H
eat
Reco
very
Syst
em
Com
pute
rized
Sy
stem
s Fo
rbes
Awa
rds 2
010
Prod
uctio
n M
axim
ize
Utiliz
ation
201
2
“Sustainable growth.”
32 Million Sq.M in 2004
42 Million Sq.M in 2008
58 Million Sq.M in 2011
80 Million Sq.M in 2017
4

SALES REPORT“Analyzing market trend.”
5

Sales Volume (1000sq.m)
January February March April May June July August September October November December3000
3500
4000
4500
5000
5500
6000
6500
5,530
4,964
5,728 2011 = 55,908 (1000sq.m)
2012 = 58,445 (1000sq.m)
2013 = 16,222 (1000sq.m)
6
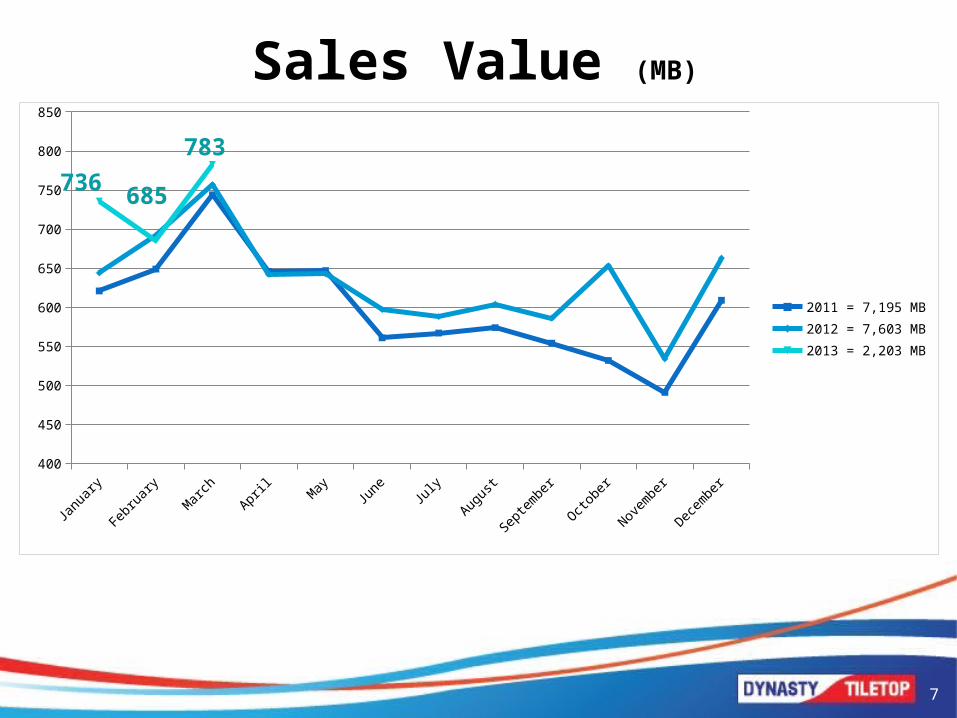
Sales Value (MB)
January February March April May June July August September October November December400
450
500
550
600
650
700
750
800
850
736685
783
2011 = 7,195 MB2012 = 7,603 MB2013 = 2,203 MB
7

8
ASP
DateQ4, 55 Q1, 56
Measures MeasuresProduct Type Product Size Main Qty ASP Sales Amount Main Qty ASP Sales AmountAll Product Types All Product Sizes 14,092,874.55 129.70 1,827,892,564.60 16,160,658.60 135.53 2,190,325,768.90 สขุภัณฑ์และอ่ืนๆ 156,084.34 289.26 45,149,313.75 179,630.78 296.17 53,200,492.97 ชดเชย+สง่เสรมิการขาย 77,738.00 105.21 8,178,542.26 117,289.00 103.75 12,168,679.29 (เฉพาะกระเบื้อง) 13,859,052.21 128.04 1,774,564,708.59 15,863,738.82 133.95 2,124,956,596.64 GRANITO TILES PREMIUM All Product Sizes 10,341.25 271.22 2,804,710.73 31,320.25 321.50 10,069,522.20
กระเบื้องตกแต่ง All Product Sizes 16.00 72.08 1,153.27 3,087.40 86.81 268,005.44 6.5 cm x 25.0 cm 16.00 72.08 1,153.27 3,087.40 86.81 268,005.44
กระเบื้องบุผนัง All Product Sizes 1,763,298.17 127.96 225,640,377.28 2,023,598.38 133.45 270,055,216.59 12 X 16 6,614.01 135.34 895,163.05 8 X 10 1,424,552.15 124.54 177,408,078.85 1,581,682.75 130.55 206,485,463.57 8 X 12 261,289.49 140.89 36,812,562.15 353,514.86 142.90 50,517,803.35
8 X 8 ผนัง 77,456.53 147.43 11,419,736.28 81,786.76 148.64 12,156,786.62
กระเบื้องปูพื้น All Product Sizes 11,757,243.75 132.20 1,554,262,943.31 13,677,075.05 135.75 1,856,716,391.46 12 X 12 7,012,730.98 122.08 856,127,110.18 7,560,513.67 127.08 960,760,579.60 13 X 13 25.89 107.17 2,774.76 16 X 16 3,265,215.46 140.07 457,355,237.33 4,723,287.32 142.57 673,417,596.39 16 x 16 (1.5) 765,405.62 202.02 154,630,872.80 447,789.12 214.76 96,168,850.28
16 x 16 (ขดัขอบ) 26,976.70 155.34 4,190,432.38 204,802.98 164.71 33,732,602.11 6 x 12 4.00 117.29 469.16 4.07 64.52 262.61 6 x 6 1,431.50 38.36 54,915.89 17.37 67.15 1,166.36 8 X 8 685,453.60 119.48 81,901,130.81 740,660.52 125.07 92,635,334.11
สขุภัณฑ์ All Product Sizes 126.00 124.69 15,710.59
อ่ืน ๆ All Product Sizes 155,958.34 289.40 45,133,603.16 179,630.78 296.17 53,200,492.97

Sales Volume & Value
Volume (1000sq.m) Value (MB)0
500
1,000
1,500
2,000
2,500
1,622
2,203
1,4241,851
1,609
2,093
1Q13 4Q12 1Q12
9

Outlet Quarterly Sales Performance by Region (MB)
1Q09 2Q09 3Q09 4Q09 1Q10 2Q10 3Q10 4Q10 1Q11 2Q11 3Q11 4Q11 1Q12 2Q12 3Q12 4Q12 1Q13 50
150
250
350
450
550
650
750
462
393
320
368
622
481
329
397
689
582
455 468
690
559
483
512
717
371 359
368
361
398
373 338
346
383 400 387
322
432 424 404
420 440
122 116 118 115 139 131 123 126 149
138 147 143 147 151 163 165 192
199 181 193 196
249 216 215 221
259 274
295 288
265 256 259 265 266 247 228
204 208
322 281
210 227
344 293
256 257
350 324
291 310
388
NEMESN
10
N
NE
ES
M
0
500
1000
1Q13
1Q12

11
Regional Sales Comparison
ภาคกลาง ภาคใต้ ภาคตะวันออก
ภาคอีสาน ภาคเหนือ กรุงเทพฯ-ปรมิณฑล
-
100,000,000.00
200,000,000.00
300,000,000.00
400,000,000.00
500,000,000.00
600,000,000.00
700,000,000.00
800,000,000.00
ยอดขาย ไตรมาส 1 56 ยอดขาย ไตรมาส 1 55

12
Regional Sales Comparison สดัสว่น 1Q56 สดัสว่น 1Q55 Increase
(decrease)
ภาคกลาง (M) 14.52%
279,276,384.84 14.60% 258,660,464.53 7.97%
ภาคใต้ (S) 13.45%
258,830,037.38 14.36% 254,344,926.75 1.76%ภาคตะวนัออก (E) 8.72%
167,789,324.47 7.38% 130,690,992.14 28.39%
ภาคอีสาน (NE) 36.58%
703,782,015.44 37.29% 660,622,288.90 6.53%
ภาคเหนือ (N) 19.23%
370,040,501.16 17.61% 311,999,166.08 18.60%กรุงเทพฯ-ปรมิณฑล (BKK) 7.50%
144,281,128.44 8.76% 155,139,381.66 -7.00%
รวม 100.00% 1,923,999,391.73 100.00% 1,771,457,220.06 8.61%
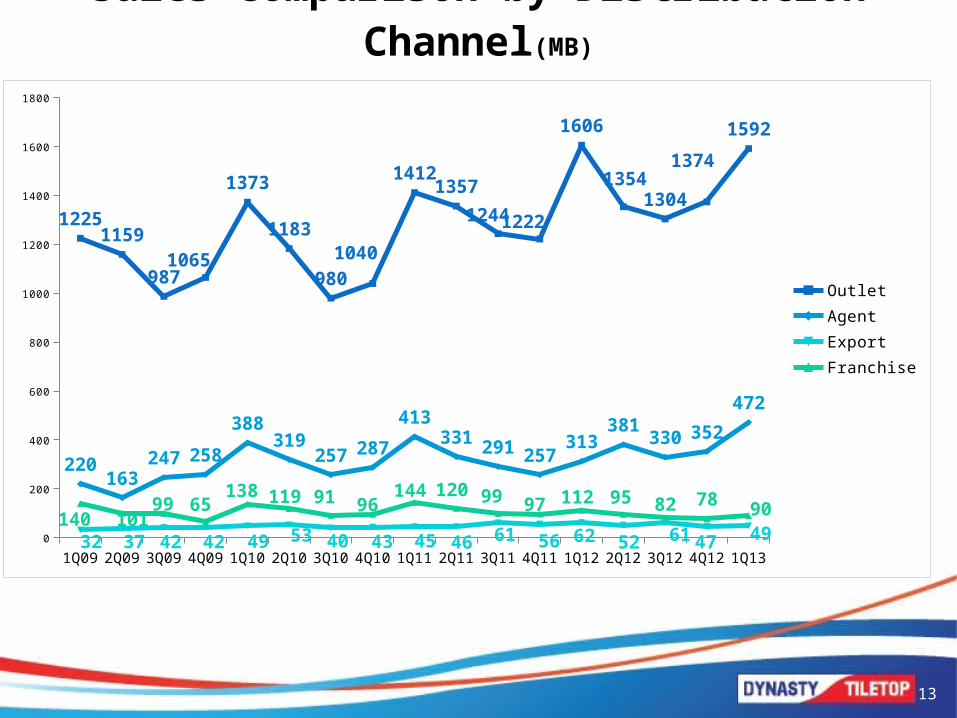
Sales Comparison by Distribution Channel(MB)
1Q09 2Q09 3Q09 4Q09 1Q10 2Q10 3Q10 4Q10 1Q11 2Q11 3Q11 4Q11 1Q12 2Q12 3Q12 4Q12 1Q130
200
400
600
800
1000
1200
1400
1600
1800
12251159
9871065
1373
1183
9801040
14121357
12441222
1606
13541304
13741592
220163
247 258
388319
257 287
413331 291 257
313381
330 352472
32 37 42 42 49 53 40 43 45 46 61 56 62 52 61 47 49140 101
99 65138 119 91 96
144 120 99 97 112 95 82 78 90
OutletAgentExportFranchise
13

Analyzing Distribution Channels
14
Outlet
62%
Franchise
4%Agent
By DCC
8%
Agent
By Outlet
24%
Export2%
1Q2013
Outlet81%
Franchise7% Agent
9%
Export3%
Y2010
Outlet66%
Franchise6%
Agent By DCC7%
Agent By Outlet
18%
Export3%
Y2011
Outlet64%Franchise
5%
Agent By DCC6%
Agent By Outlet
22%
Export3%
Y2012
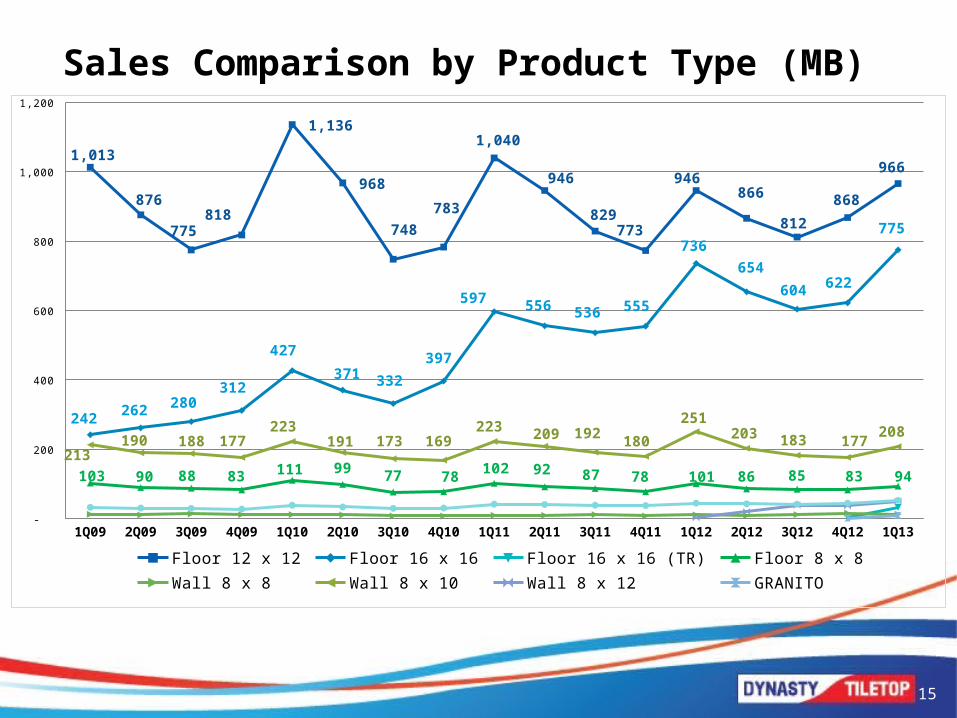
Sales Comparison by Product Type (MB)
15
1Q09 2Q09 3Q09 4Q09 1Q10 2Q10 3Q10 4Q10 1Q11 2Q11 3Q11 4Q11 1Q12 2Q12 3Q12 4Q12 1Q13 -
200
400
600
800
1,000
1,200
1,013
876
775 818
1,136
968
748 783
1,040
946
829 773
946 866
812 868
966
242 262 280 312
427 371 332
397
597 556 536 555
736 654
604 622
775
103 90 88 83 111 99 77 78 102 92 87 78 101 86 85 83 94 213
190 188 177 223
191 173 169 223 209 192 180
251 203 183 177 208
Floor 12 x 12 Floor 16 x 16 Floor 16 x 16 (TR) Floor 8 x 8 Wall 8 x 8 Wall 8 x 10Wall 8 x 12 GRANITO Other

Analyzing Product Types
16Floor 12 x 1256%
Floor 16 x 1624%
Floor 8 x
86%
Wall 8 x 81%
Wall 8 x 10
12% Other2%
Y2010
Floor 12 x 12
50%
Floor 16 x 16
31%
Floor 8 x 85%
Wall 8 x 81% Wall
8 x 10¹¹% Other
2%
Y2011
16
Floor 12x12
44%
Floor 16x16
35%
Floor 16x16(TR)1%
Floor 8x8
4%Wall 8x8
1%
Wall 8x10⁹%
Wall 8x122%
Granito0%
Other2%
1Q2013Floor
12x1246%
Floor 16x1634%
Floor 16x16(TR)
0%
Floor 8x85% Wall 8x8
1%
Wall 8x10¹¹%
Wall 8x121%
Granito0%
Other2%
Y2012

COST OF PRODUCTION“What we can do to improve our cost.”
17
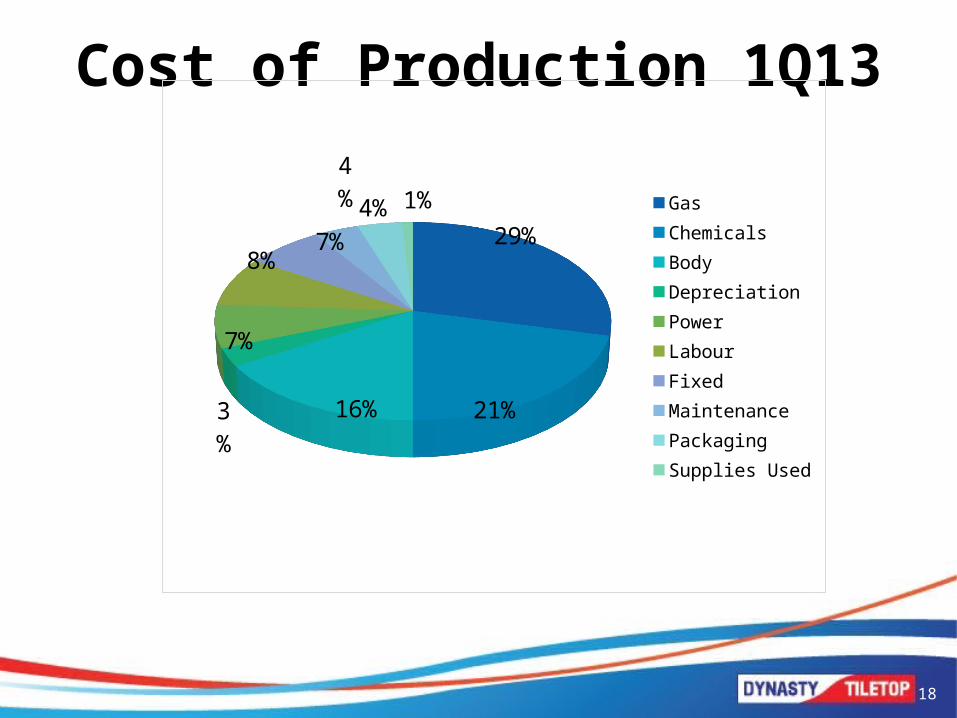
Cost of Production 1Q13
18
29%
21%16%3%
7%
8%7%
4% 4% 1%
GasChemicalsBodyDepreciationPowerLabourFixedMaintenancePackagingSupplies Used

Natural Gas Price History
19
Jan-09
Mar-09
May-09
Jul-09
Sep-09
Nov-09
Jan-10
Mar-10
May-10
Jul-10
Sep-10
Nov-10
Jan-11
Mar-11
May-11
Jul-11
Sep-11
Nov-11
Jan-12
Mar-12
May-12
Jul-12
Sep-12
Nov-12
Jan-13
Mar-13
-
50
100
150
200
250
300
350
400
450
500
BAH
T /
MM
BTU

Changes in Cost
“We’re trying to improve our natural gas usage thru body mixture.”
20
(Baht/Sq.M) 1Q13 1Q12 DIF(%)
Body 12.56 12.65 -0.70%
Chemicals 16.79 16.38 2.55%
Natural Gas 23.17 25.37 -8.66%
Labor 6.03 4.33 39.33%

PERFORMANCE“Perfectionism.”
21
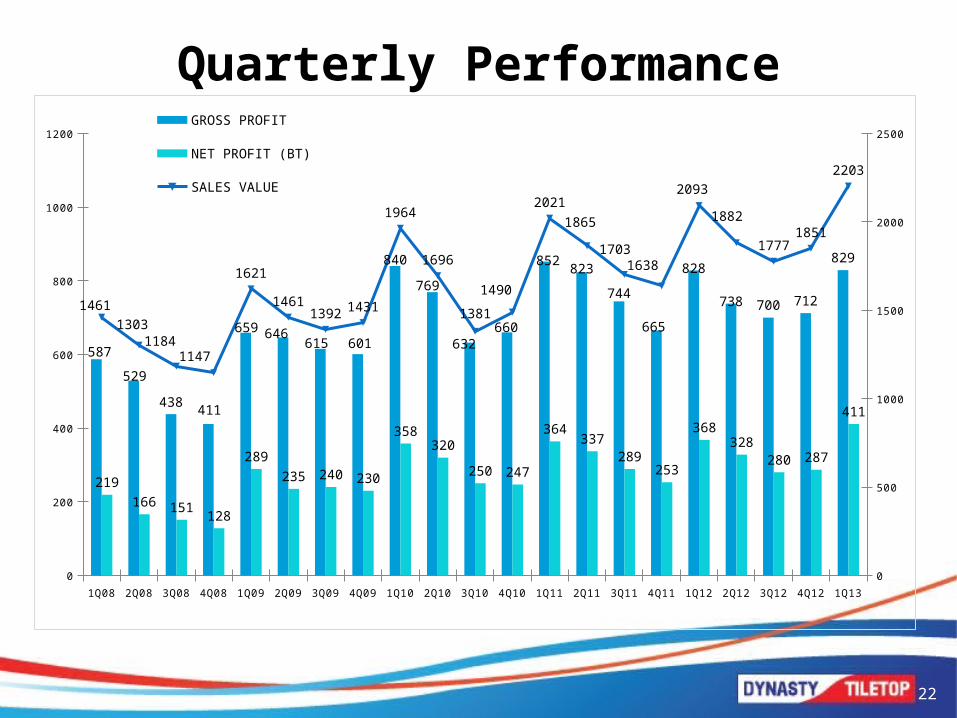
Quarterly Performance
1Q08 2Q08 3Q08 4Q08 1Q09 2Q09 3Q09 4Q09 1Q10 2Q10 3Q10 4Q10 1Q11 2Q11 3Q11 4Q11 1Q12 2Q12 3Q12 4Q12 1Q130
200
400
600
800
1000
1200
0
500
1000
1500
2000
2500
587
529
438 411
659 646615 601
840
769
632660
852 823
744
665
828
738 700 712
829
219166 151
128
289235 240 230
358320
250 247
364337
289253
368328
280 287
411
14611303
11841147
1621
14611392 1431
1964
1696
1381
1490
20211865
17031638
2093
1882
17771851
2203
GROSS PROFIT NET PROFIT (BT)
SALES VALUE
22

Net Profit & Earning Per Share
23
- 50
100 150 200 250 300 350 400 450 500 411 1.01
287 0.70
368 0.90
1Q13 4Q12 1Q12
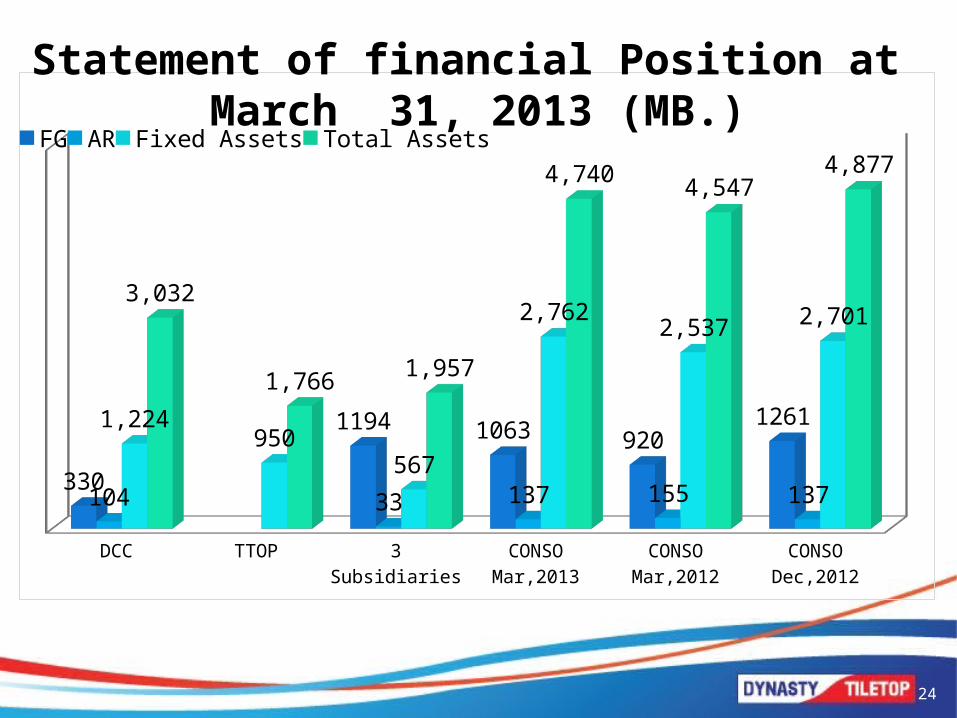
DCC TTOP 3 Subsidiaries CONSO Mar,2013
CONSO Mar,2012
CONSO Dec,2012
330
1194 1063 9201261
104 33 137 155 137
1,224 950
567
2,762 2,537 2,701
3,032
1,766 1,957
4,740 4,547 4,877
FG AR Fixed Assets Total Assets
Statement of financial Position at March 31, 2013 (MB.)
24

DCC TTOP 3 Subsidiaries CONSO Mar,2013
CONSO Mar,2012
CONSO Dec,2012
536 342
27
905 1,029 804
170 170
840
53 46 24 123 108 118
1,435 1,295
851
3,211 3,110 2,798
AP & Accrued Exp. Overdrafts/LoanEmployee Benefit Obligations Shareholders'Equity
LIABILITIES AND OWENER’S EQUITY at March 31 , 2013(MB.)
25
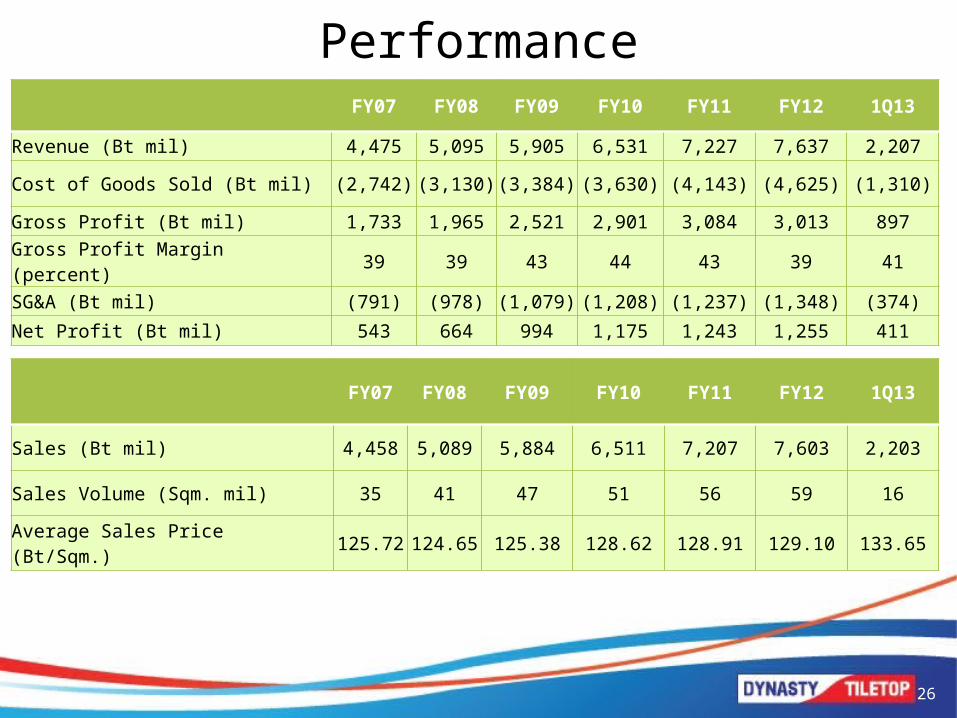
Performance FY07 FY08 FY09 FY10 FY11 FY12 1Q13
Revenue (Bt mil) 4,475 5,095 5,905 6,531 7,227 7,637 2,207
Cost of Goods Sold (Bt mil) (2,742) (3,130) (3,384) (3,630) (4,143) (4,625) (1,310)
Gross Profit (Bt mil) 1,733 1,965 2,521 2,901 3,084 3,013 897
Gross Profit Margin (percent) 39 39 43 44 43 39 41
SG&A (Bt mil) (791) (978) (1,079) (1,208) (1,237) (1,348) (374)Net Profit (Bt mil) 543 664 994 1,175 1,243 1,255 411
FY07 FY08 FY09 FY10 FY11 FY12 1Q13
Sales (Bt mil) 4,458 5,089 5,884 6,511 7,207 7,603 2,203
Sales Volume (Sqm. mil) 35 41 47 51 56 59 16
Average Sales Price (Bt/Sqm.) 125.72 124.65 125.38 128.62 128.91 129.10 133.65
26
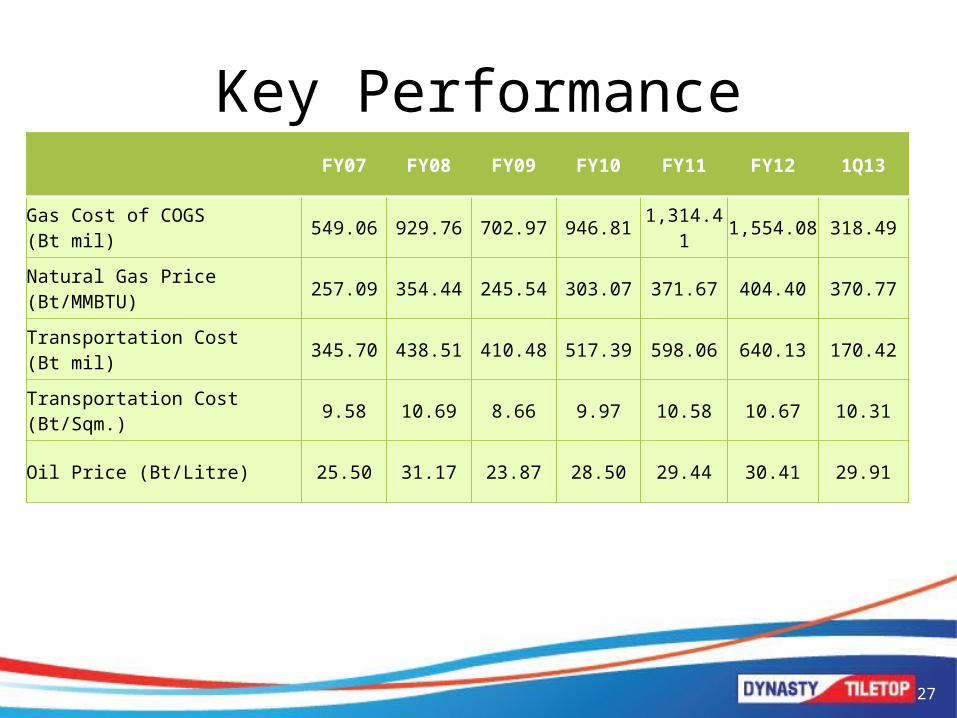
Key Performance FY07 FY08 FY09 FY10 FY11 FY12 1Q13
Gas Cost of COGS(Bt mil) 549.06 929.76 702.97 946.81 1,314.41 1,554.08 318.49
Natural Gas Price (Bt/MMBTU) 257.09 354.44 245.54 303.07 371.67 404.40 370.77
Transportation Cost(Bt mil) 345.70 438.51 410.48 517.39 598.06 640.13 170.42
Transportation Cost (Bt/Sqm.) 9.58 10.69 8.66 9.97 10.58 10.67 10.31
Oil Price (Bt/Litre) 25.50 31.17 23.87 28.50 29.44 30.41 29.91
27

Key Financial Ratio FY07 FY08 FY09 FY10 FY11 FY12 1Q13
ROE 23.86 28.45 39.02 43.80 46.78 58.05 20.96
ROA 13.40 16.72 26.43 31.99 30.99 27.70 8.65
EPS (Baht) 1.33 1.63 2.44 2.88 3.05 3.08 1.01
D/E 0.78 0.59 0.34 0.36 0.62 0.76 0.48
P/BV 2.78 1.78 4.40 9.89 9.41 10.91 11.41
Pay Out Ratio 75% 77% 85% 100% 100% 100% 100%
Dividend Per Share 1.00 1.25 2.08 2.88 3.05 3.08 1.01
28

GOING FORWARD“Targets and Goals.”
29

Production Capacity Expansion Plan
7,500• 16 kilns
8,000• 17 kilns
8,500• 19 kilns
9,000• 20 kilns
9,500• 20 kilns
10,000• 20 kilns
10,500• 20 kilns
11,000• 20 kilns
2009 2010 2011 2012 2013 2014 2015 2016
57.6M
64.8M
79.2M
Increase Production Capacity
Reduce Cost
30

31
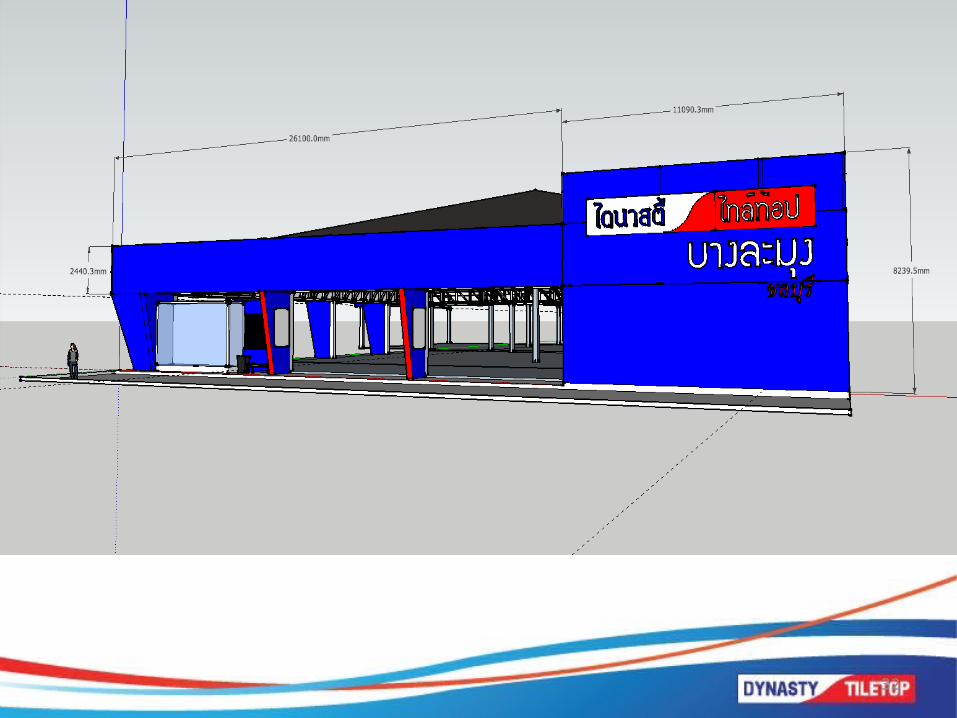
Re-Branding
• New uniform• New outlet structure• Improved service• Improved showcase• Value added
32

33
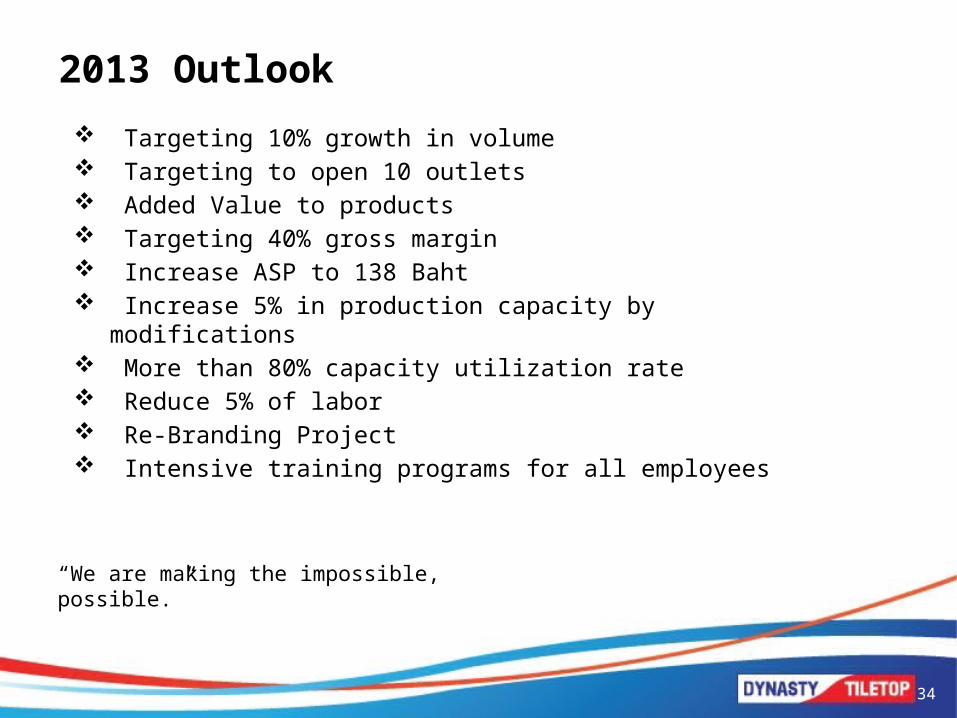
2013 Outlook Targeting 10% growth in volume Targeting to open 10 outlets Added Value to products Targeting 40% gross margin Increase ASP to 138 Baht Increase 5% in production capacity by modifications More than 80% capacity utilization rate Reduce 5% of labor Re-Branding Project Intensive training programs for all employees
“We are making the impossible, possible.”
34

Thank You.
Maruth (Bae) SaengsastraVice President
Dynasty Ceramic Public Company [email protected]
Please visit us at www.dynastyceramic.com
www.facebook.com/DynastyCeramic
35