
Dynamics of water molecules at liquid–vapour interfaces of aqueous ionic solutions: effects of ion...
7
Dynamics of water molecules at liquid–vapour interfaces of aqueous ionic solutions: effects of ion concentration Sandip Paul, Amalendu Chandra * Department of Chemistry, Indian Institute of Technology, Kanpur 208016, India Received 3 December 2002; in final form 29 January 2003 Abstract The dynamical properties of water molecules at the liquid–vapour interfaces of aqueous NaCl solutions are studied by means of molecular dynamics simulations. The diffusion coefficients and the orientational relaxation times of the interfacial molecules of pure water and also the effects of ion concentration on these interfacial dynamical properties of aqueous solutions are investigated and the results are compared with those of the corresponding bulk phases. The inhomogeneous density, anisotropic orientational profiles and the surface tension are also calculated in order to characterize the location, width and the thermodynamic aspects of the interfaces and to explore their effects on the dynamical properties. Ó 2003 Elsevier Science B.V. All rights reserved. 1. Introduction The microscopic structure and dynamics of aqueous solutions at liquid–vapour interfaces have been a subject of great interest in recent years. Studies of these interfacial systems are important not only in chemistry and biology but also in the areas of environmental and atmospheric sciences. Earlier experimental studies on liquid–vapour in- terfaces primarily focused on thermodynamic quantities such as the surface tension and surface potential which could provide only a macroscopic description of these interfaces. More recent ex- perimental techniques such as surface second harmonic [1] and sum frequency generation [2,3] methods can now provide more detailed molecular level information of the structure and dynamics of liquid–vapour interfaces. For aqueous systems, these techniques have been used rather extensively in recent years to find the orientational profiles and kinetics of various chemical processes at air– water interfaces [1–13]. Many of these properties have also been investigated by means of molecular dynamics simulations [14–24]. However, very little is known about the molecular behaviour of liquid– vapour interfaces of concentrated aqueous solu- tions of soluble inorganic salts. Only very recently, a few molecular dynamics studies have considered the structural aspects of the liquid–vapour inter- faces of aqueous alkali halide solutions [21–24]. However, the dynamical properties of the inter- Chemical Physics Letters 373 (2003) 87–93 www.elsevier.com/locate/cplett * Corresponding author. E-mail address: [email protected] (A. Chandra). 0009-2614/03/$ - see front matter Ó 2003 Elsevier Science B.V. All rights reserved. doi:10.1016/S0009-2614(03)00537-2
-
Upload
sandip-paul -
Category
Documents
-
view
213 -
download
1
Transcript of Dynamics of water molecules at liquid–vapour interfaces of aqueous ionic solutions: effects of ion...

Dynamics of water molecules at liquid–vapour interfacesof aqueous ionic solutions: effects of ion concentration
Sandip Paul, Amalendu Chandra *
Department of Chemistry, Indian Institute of Technology, Kanpur 208016, India
Received 3 December 2002; in final form 29 January 2003
Abstract
The dynamical properties of water molecules at the liquid–vapour interfaces of aqueous NaCl solutions are studied
by means of molecular dynamics simulations. The diffusion coefficients and the orientational relaxation times of the
interfacial molecules of pure water and also the effects of ion concentration on these interfacial dynamical properties of
aqueous solutions are investigated and the results are compared with those of the corresponding bulk phases. The
inhomogeneous density, anisotropic orientational profiles and the surface tension are also calculated in order to
characterize the location, width and the thermodynamic aspects of the interfaces and to explore their effects on the
dynamical properties.
� 2003 Elsevier Science B.V. All rights reserved.
1. Introduction
The microscopic structure and dynamics of
aqueous solutions at liquid–vapour interfaces havebeen a subject of great interest in recent years.
Studies of these interfacial systems are important
not only in chemistry and biology but also in the
areas of environmental and atmospheric sciences.
Earlier experimental studies on liquid–vapour in-
terfaces primarily focused on thermodynamic
quantities such as the surface tension and surface
potential which could provide only a macroscopicdescription of these interfaces. More recent ex-
perimental techniques such as surface second
harmonic [1] and sum frequency generation [2,3]
methods can now provide more detailed molecular
level information of the structure and dynamics ofliquid–vapour interfaces. For aqueous systems,
these techniques have been used rather extensively
in recent years to find the orientational profiles
and kinetics of various chemical processes at air–
water interfaces [1–13]. Many of these properties
have also been investigated by means of molecular
dynamics simulations [14–24]. However, very little
is known about the molecular behaviour of liquid–vapour interfaces of concentrated aqueous solu-
tions of soluble inorganic salts. Only very recently,
a few molecular dynamics studies have considered
the structural aspects of the liquid–vapour inter-
faces of aqueous alkali halide solutions [21–24].
However, the dynamical properties of the inter-
Chemical Physics Letters 373 (2003) 87–93
www.elsevier.com/locate/cplett
* Corresponding author.
E-mail address: [email protected] (A. Chandra).
0009-2614/03/$ - see front matter � 2003 Elsevier Science B.V. All rights reserved.
doi:10.1016/S0009-2614(03)00537-2

faces such as the diffusion and orientational re-
laxation of interfacial water molecules have not
yet been investigated for these solutions. The im-
portant issues are the differences between the
interfacial and bulk dynamics at a given ion con-
centration and also the effects of ion concentrationon the dynamical behaviour of such interfaces as
compared to those of the bulk phases. We address
these issues in this Letter by means of molecular
dynamics simulations.
In the present work, we have carried out mo-
lecular dynamics simulations of liquid–vapour in-
terfaces of aqueous NaCl solutions at varying
concentrations. The main focus has been to cal-culate the dynamical properties of the interfacial
water molecules. We have, however, also calcu-
lated the density and orientational profiles and the
surface tension of these systems as the dynamical
properties of the interfaces are intimately related
to these equilibrium quantities. Also, the density
profiles help us to characterize the location and
thickness of the interfaces. The details of the sim-ulations including the construction of the inter-
faces and their characterization in terms of density
profiles are presented in Section 2. In Section 3, we
have discussed the simulation results of the dy-
namics of the interfaces and our conclusions are
briefly summarized in Section 4.
2. Details of simulations and construction of the
interfaces
In this work, we have carried out molecular
dynamics simulations of liquid–vapour interfaces
of pure water and aqueous NaCl solutions of three
different concentrations: 2.1, 3.15 and 4.3 m
(m¼molal). The water molecules are character-ized by the SPC/E potential [25] and the sodium
and chloride ions are modeled as charged Len-
nard–Jones particles [26–28]. In these models, the
interaction between atomic sites of two different
molecules or ions is expressed as
uabðra; rbÞ ¼ 4�abrab
rab
� �12"
� rab
rab
� �6#þ qaqb
rab;
ð1Þ
where rab is the distance between the atomic sites
or ions a and b and qa is the charge of the ath atom
(or ion). The Lennard–Jones parameters rab and
�ab are obtained by using the combination rules
rab ¼ ðra þ rbÞ=2 and �ab ¼ ffiffiffiffiffiffiffiffi�a�b
p. The values of
the potential parameters qa, ra and �a for water
and Naþ and Cl� are available, for example, in
[29].
For each system, we first carried out a bulk
simulation in a cubic box of 864 molecules in-
cluding water and ions, periodically replicated in
all three dimensions. The box length L was ad-
justed according to the experimental density of thebulk solutions. After this bulk solution was prop-
erly equilibrated, two empty boxes of equal size
were added on either side of the original simula-
tion box along the z-dimension and this larger
rectangular box of dimension L� L� Lz with
Lz ¼ 3L was taken as the simulation box in the
next phase of the simulation run. The system was
reequilibrated by imposing periodic boundaryconditions in all three dimensions. This resulted in
a lamella of approximate width L separated by
vacuum layers of approximate width 2L. Some of
the water molecules were found to vapourize to the
empty space to form liquid–vapour interfaces on
both sides of the lamella. In Table 1, we have in-
cluded, for each system, the number of sodium and
chloride ions and water molecules and also thelengths of the simulation box along x and z di-
mensions. In all simulations, the long-range elec-
trostatic interactions were treated by using the
three-dimensional Ewald method [30]. The short-
range Lennard–Jones interactions were calculated
by using a spherical cut-off at distance L=2. We
employed the quaternion formulation of the
equations of rotational motion [30] and, for theintegration over time, we adapted the leap-frog
algorithm with a time step of 10�15 s (1 fs). MD
runs of 300 ps were used to equilibrate each system
in the bulk phase and then MD runs of 400 ps were
used to equilibrate each of the liquid–vapour in-
terfacial systems in rectangular boxes. During the
equilibration, the temperature of the simulation
system was kept at 298 K through rescaling of thevelocities. The simulations of the interfacial sys-
tems were then continued in microcanonical en-
semble for another 600 ps for the calculation of
88 S. Paul, A. Chandra / Chemical Physics Letters 373 (2003) 87–93
various structural and dynamical quantities of theinterfaces.
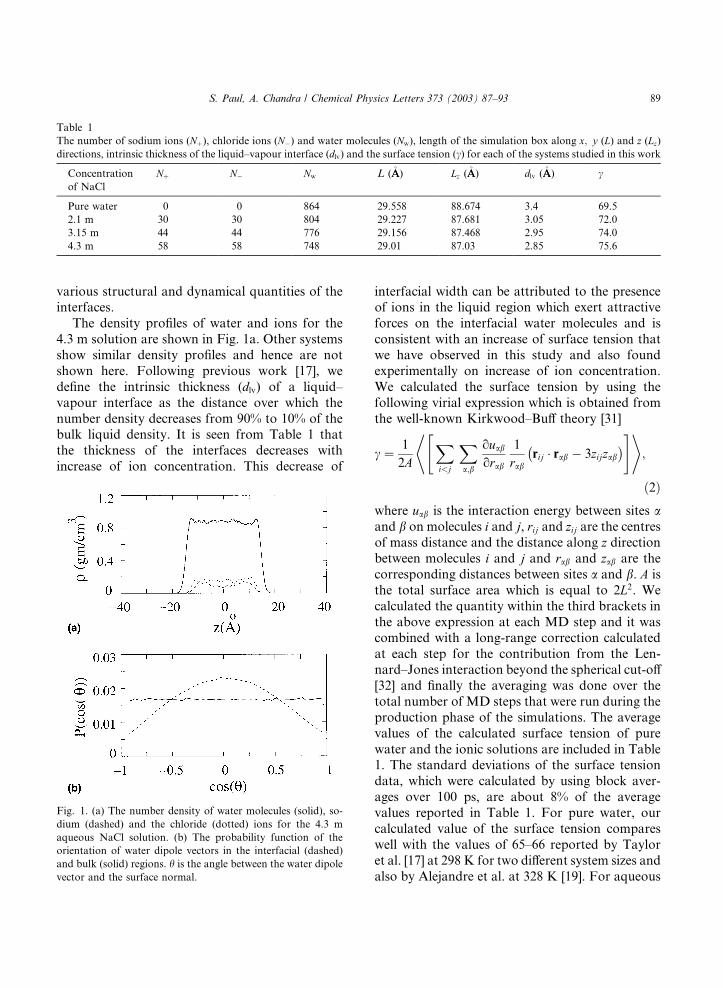
The density profiles of water and ions for the
4.3 m solution are shown in Fig. 1a. Other systems
show similar density profiles and hence are not
shown here. Following previous work [17], we
define the intrinsic thickness (dlv) of a liquid–
vapour interface as the distance over which the
number density decreases from 90% to 10% of thebulk liquid density. It is seen from Table 1 that
the thickness of the interfaces decreases with
increase of ion concentration. This decrease of
interfacial width can be attributed to the presenceof ions in the liquid region which exert attractive
forces on the interfacial water molecules and is
consistent with an increase of surface tension that
we have observed in this study and also found
experimentally on increase of ion concentration.
We calculated the surface tension by using the
following virial expression which is obtained from
the well-known Kirkwood–Buff theory [31]
c ¼ 1
2A
Xi<j
Xa;b
ouab
orab
1
rabrij � rab
�"*� 3zijzab
#+;
ð2Þwhere uab is the interaction energy between sites aand b on molecules i and j, rij and zij are the centresof mass distance and the distance along z directionbetween molecules i and j and rab and zab are the
corresponding distances between sites a and b. A is
the total surface area which is equal to 2L2. We
calculated the quantity within the third brackets in
the above expression at each MD step and it wascombined with a long-range correction calculated
at each step for the contribution from the Len-
nard–Jones interaction beyond the spherical cut-off
[32] and finally the averaging was done over the
total number of MD steps that were run during the
production phase of the simulations. The average
values of the calculated surface tension of pure
water and the ionic solutions are included in Table1. The standard deviations of the surface tension
data, which were calculated by using block aver-
ages over 100 ps, are about 8% of the average
values reported in Table 1. For pure water, our
calculated value of the surface tension compares
well with the values of 65–66 reported by Taylor
et al. [17] at 298 K for two different system sizes and
also by Alejandre et al. at 328 K [19]. For aqueous
Fig. 1. (a) The number density of water molecules (solid), so-
dium (dashed) and the chloride (dotted) ions for the 4.3 m
aqueous NaCl solution. (b) The probability function of the
orientation of water dipole vectors in the interfacial (dashed)
and bulk (solid) regions. h is the angle between the water dipole
vector and the surface normal.
Table 1
The number of sodium ions (Nþ), chloride ions (N�) and water molecules (Nw), length of the simulation box along x; y (L) and z (Lz)
directions, intrinsic thickness of the liquid–vapour interface (dlv) and the surface tension (c) for each of the systems studied in this work
Concentration
of NaCl
Nþ N� Nw L (�AA) Lz (�AA) dlv (�AA) c
Pure water 0 0 864 29.558 88.674 3.4 69.5
2.1 m 30 30 804 29.227 87.681 3.05 72.0
3.15 m 44 44 776 29.156 87.468 2.95 74.0
4.3 m 58 58 748 29.01 87.03 2.85 75.6
S. Paul, A. Chandra / Chemical Physics Letters 373 (2003) 87–93 89
NaCl solutions, the surface tension is found to in-
crease with increasing ion concentration which is in
good agreement with the known experimental re-
sults [33]. The results of Fig. 1b will be discussed in
Section 3 in the context of orientational relaxationin the bulk and interfacial regions.
We note in this context the recent work of
Jungwirth et al. [21–23] and also of Stuart et al.
[24] on the density profiles of halide ions at the
liquid–vapour interfaces of aqueous ionic solu-
tions. In these work, the polarizable force fields
were used for the ions and water molecules and it
was found that the flouride ions stay mainly in thebulk liquid region, chloride ions stay both in the
liquid and also at the interfaces whereas the bro-
mide and iodide ions were found to act as surf-
actants [23]. This different behaviour of the anion
density profiles was attributed to the varying de-
gree of polarizability of the halide ions. In the
present work, we have used nonpolarizable force
fields and that could be the reason of our notfinding a significant density of the chloride ions at
the surface region. However, the effects of polar-
izability was found to be particularly important
for the bromide and iodide ions than the chloride
ions. For example, the density of chloride ions in
the interfacial region was found to be significantly
lower than that in the bulk solution even after
including the polarization effects [21–23]. Also, in[24], the polarizable chloride ion was always found
to have a full solvation shell. Even when it ap-
proached the interfacial region, it maintained its
solvation shell beneath the surface.
3. Dynamics of water molecules at interfaces
The main objective of this section is to study the
effects of ion concentration on the dynamics of
interfaces and to see how much the dynamics of
interfaces is different from that of the corre-
sponding bulk phases. We denote the ath compo-
nent of velocity of a water molecule by vaðtÞ(a ¼ x; y; z) and its normalized autocorrelation
function Cv;aðtÞ is defined by
Cv;aðtÞ ¼hvaðtÞvað0Þi
hv2ai; ð3Þ
where h� � �i denotes an equilibrium ensemble av-
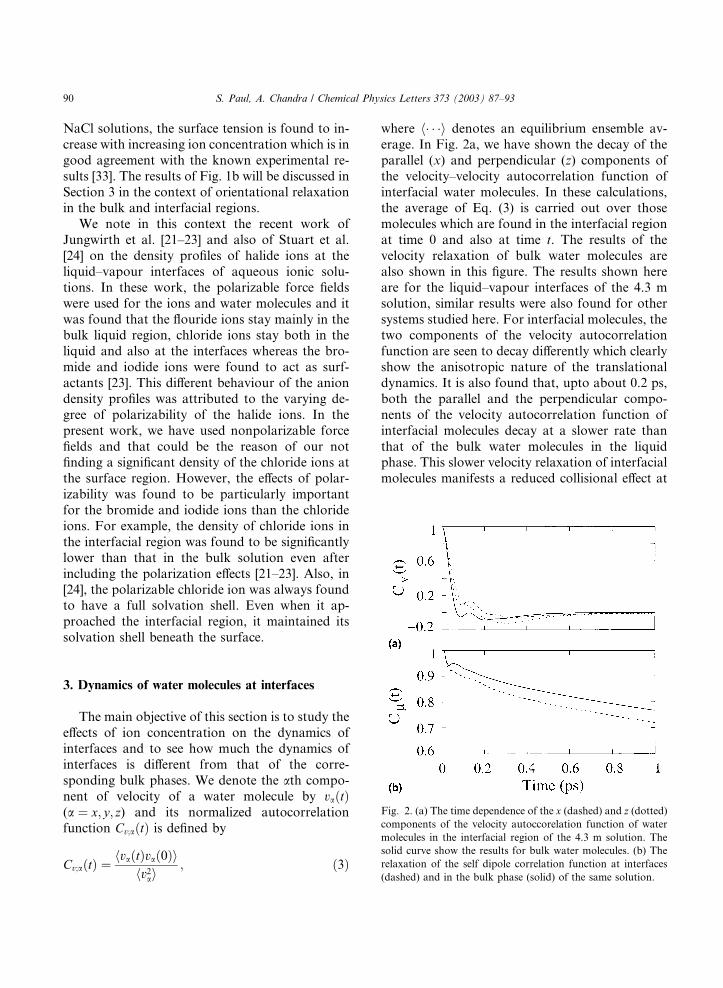
erage. In Fig. 2a, we have shown the decay of the
parallel (x) and perpendicular (z) components of
the velocity–velocity autocorrelation function of
interfacial water molecules. In these calculations,the average of Eq. (3) is carried out over those
molecules which are found in the interfacial region
at time 0 and also at time t. The results of the
velocity relaxation of bulk water molecules are
also shown in this figure. The results shown here
are for the liquid–vapour interfaces of the 4.3 m
solution, similar results were also found for other
systems studied here. For interfacial molecules, thetwo components of the velocity autocorrelation
function are seen to decay differently which clearly
show the anisotropic nature of the translational
dynamics. It is also found that, upto about 0.2 ps,
both the parallel and the perpendicular compo-
nents of the velocity autocorrelation function of
interfacial molecules decay at a slower rate than
that of the bulk water molecules in the liquidphase. This slower velocity relaxation of interfacial
molecules manifests a reduced collisional effect at
Fig. 2. (a) The time dependence of the x (dashed) and z (dotted)components of the velocity autoccorelation function of water
molecules in the interfacial region of the 4.3 m solution. The
solid curve show the results for bulk water molecules. (b) The
relaxation of the self dipole correlation function at interfaces
(dashed) and in the bulk phase (solid) of the same solution.
90 S. Paul, A. Chandra / Chemical Physics Letters 373 (2003) 87–93

the interfaces due to their lower density and less
number of hydrogen bonds than that of the bulk
liquid water. The somewhat stronger negative
values of the perpendicular velocity correlation
function in the interfacial region at intermediatetimes show, in most likelihood, the rebounce of
water molecules from the surface in the perpen-
dicular direction. This rebounce occurs due to the
inward pull that the surface molecules experience
because of the presence of larger number of mol-
ecules in the liquid side than that in the vapour
side. We have also calculated the diffusion coeffi-
cient Da (a ¼ x; y; z) from the velocity–velocityautocorrelation function by using the following
relation:
Da ¼kBTm
Z 1
0
Cv;aðtÞdt; ð4Þ
where m is the mass of a water molecule and kB is
Boltzmann constant. The values of Dx and Dz ofinterfacial molecules are included in Table 2. We
note that for interfacial molecules Dx ¼ Dy . In this
table we have also included the diffusion coeffi-
cients of bulk water molecules for which
Dx;y ¼ Dz ¼ D. The faster diffusion in the interfa-
cial region is related to the slower relaxation of the
corresponding velocity correlation which occurred
due to the reduced density and less number ofhydrogen bonds in the former region. The rela-
tively smaller value of Dz than Dx in the interfacial
region originates primarily from the stronger
negative region that we found in the relaxation of
perpendicular velocity at intermediate times.
The orientational relaxation of water molecules
at liquid–vapour interfaces is investigated by cal-
culating the time dependence of the self dipolecorrelation function
ClðtÞ ¼hlðtÞ � lð0Þihlð0Þ2i
; ð5Þ
where lðtÞ is the dipole vector of a water moleculeat time t. The results of ClðtÞ are shown in Fig. 2b
for the 4.3 m solution. It is seen that the orienta-
tional relaxation at the interface occurs at a faster
rate than that in the bulk. Similar results have also
been obtained for other solutions. We define the
orientational relaxation time sl as the time integral
of the orientational correlation function where we
have calculated the integral explicitly upto 4 ps byusing the simulation data of ClðtÞ and the contri-
bution of the tail part is obtained by using the
fitted exponential functions. The results of the
orientational relaxation times are also included in
Table 2. The orientational relaxation time of in-
terfacial water molecules is found to be shorter
than that of bulk water molecules for all the sys-
tems studied here although the difference is moresignificant for the concentrated solutions than
pure water. We note that the density is low in the
interfacial region and also interfacial molecules
essentially do not have any solvation shell on the
vapour side of the interface. Because of these re-
duced density and incomplete solvation effects, a
water molecule in the interfacial region has less
number of hydrogen bonds and experiences lessrotational friction than that in the bulk phase. The
second effect is the orientational constraint which
the water molecules face at the liquid–vapour in-
terface. This is illustrated in Fig. 1b where it is seen
that the water dipoles at the interfaces prefer to
orient parallel to the surface although the proba-
bility maximum at cos h ¼ 0 is rather broad which
means the somewhat tilted orientations of thewater dipoles are also present at the interfaces.
Table 2
Values of the diffusion coefficients and orientational relaxation times in bulk solution and at interfaces
Concentration of
NaCl
D (bulk) Dx (interface) Dz (interface) sl (bulk) sl (interface)
Pure water 2.65 4.70 2.90 3.90 3.80
2.1 m 2.05 4.30 2.60 4.55 3.90
3.15 m 1.75 4.05 2.42 4.80 4.10
4.3 m 1.55 3.90 2.15 4.95 4.15
The diffusion coefficients and the relaxation times are expressed in units of 10�5 cm2 s�1 and ps, respectively.
S. Paul, A. Chandra / Chemical Physics Letters 373 (2003) 87–93 91

The bulk molecules do not show any orientational
preference as expected. This orientational struc-
ture imposes a constraint on the rotational motion
of interfacial water molecules. For liquid–vapour
interfaces of aqueous solutions, the effects of re-duced density and less number of hydrogen bonds
prevail and as a result we find an enhanced rate of
orientational relaxation of interfacial water mole-
cules. The more significant difference between the
rates of orientational relaxation of interfacial and
bulk water molecules for concentrated solutions is
due to the greater slowing down of orientational
motion of bulk water molecules as a result of thepreferential presence of ions in the bulk region of
these solutions.
In Fig. 3, we have shown the relative changes of
the diffusion coefficients and orientational relaxa-
tion times with ion concentration. In this figure,
the values of the diffusion coefficients and orien-
tational relaxation times of interfacial and bulk
water molecules of ionic solutions are normalizedby the corresponding values for pure water. It is
seen that the dynamical properties of interfacial
water molecules show a weaker change with ion
concentration than those of bulk molecules. We
note that the density of ions in the liquid region is
significantly higher than that at the interfaces for a
given bulk ion concentration of the ionic solutions.
Also, with increase of bulk ion concentration, the
ion density in the liquid region increases substan-
tially but the increase is much smaller in the in-
terfacial region. Thus, the water molecules in theinterfacial region face a less ionic field and also a
reduced effect of concentration rise for their both
translational and orientation motion. We also find
that the perpendicular diffusion at the interface
depends somewhat stronger on ion concentration
than the parallel diffusion. This behaviour can
again be attributed to the higher density of ions in
the bulk region which drags and enhances therebounce of water molecules from the surfaces in
the perpendicular direction.
4. Conclusion
We have presented molecular dynamics results
for the dynamics of water molecules at liquid–va-pour interfaces of aqueous NaCl solutions of
varying ion concentration ranging from 0 (pure
water) to 4.3 m. The density and orientational
profiles and the surface tension of the interfaces
are also calculated since the dynamics of the in-
terfaces is intimately related to these equilibrium
properties. We found a decrease of the interfacial
width and an increase of the surface tension withincreasing ion concentration. Both these effects are
attributed to a higher concentration of the ions in
the bulk liquid phase than that in the interfacial
region. The water molecules at interfaces are
found to translate and rotate at a faster rate than
that of bulk molecules because of the reduced
density and less number of hydrogen bonds in the
interfacial region. The difference between the ratesof molecular relaxation at interfaces and in the
bulk phase is found to be more significant for the
concentrated solutions which can again be attrib-
uted to the higher ion concentration in the bulk
region that cause a greater slowing down of the
translational and orientational motion of bulk
water molecules. With increase of ion concentra-
tion of the solutions, the ion density in the liquidregion increases substantially but the increase is
found to be much smaller in the interfacial region
Fig. 3. The relative changes of the (a) diffusion coefficients and
(b) dipole orientational relaxation times of water molecules in
the interfacial and bulk regions with increase of ion concen-
tration of the solutions. D0x;z and s0l denote the corresponding
values for pure water.
92 S. Paul, A. Chandra / Chemical Physics Letters 373 (2003) 87–93
or in its vicinity and this causes a weaker depen-
dence of the interfacial diffusion and orientational
relaxation on the ion concentration of the solu-
tions.
The present study of the interfacial dynamics of
aqueous NaCl solutions can be extended in manydirections. For example, it would be interesting to
investigate the dynamics of liquid–vapour inter-
faces of aqueous solutions containing polarizable
bromide and iodide ions which behave as surfac-
tants [23] and thus can modify the interfacial dy-
namics in a different manner. It would also be
interesting to study the dynamics of hydrogen
bonds [34,35] at liquid–vapour interfaces ofaqueous ionic solutions.
References
[1] K.B. Eisenthal, Chem. Rev. 96 (1996) 1343, and references
therein.
[2] Q. Du, E. Freysz, Y.R. Shen, Science 264 (1994) 826.
[3] Q. Du, R. Superfine, E. Freysz, Y.R. Shen, Phys. Rev.
Lett. 70 (1993) 2313.
[4] M.C. Goh, J.M. Hicks, K. Kemnitz, G.R. Pinto, K.
Bhattacharyya, K.B. Eisenthal, T.F. Heinz, J. Phys. Chem.
92 (1988) 5074.
[5] K. Kemnitz, K. Bhattacharyya, J.M. Hicks, G.R. Pinto,
K.B. Eisenthal, T.F. Heinz, Chem. Phys. Lett. 131 (1986)
285.
[6] K. Bhattacharyya, E.V. Sitzmann, K.B. Eisenthal, J.
Chem. Phys. 87 (1987) 1442.
[7] D. Zhang, J.H. Gutow, K.B. Eisenthal, T.F. Heinz, J.
Chem. Phys. 98 (1993) 5099.
[8] R. Superfine, J.Y. Huang, Y.R. Shen, Opt. Lett. 15 (1990)
1276.
[9] J.C. Conboy, J.L. Daschbach, G.L. Richmond, J. Phys.
Chem. 98 (1994) 9688.
[10] T. Raising, T. Stehlin, Y.R. Shen, M.W. Kim, P. Valint Jr.,
J. Chem. Phys. 89 (1988) 3386.
[11] X. Shi, E. Borguet, A.N. Tarnovski, K.B. Eisenthal, Chem.
Phys. 205 (1996) 167.
[12] K. Wolfrum, J. Lobau, A. Laubereau, Appl. Phys. A 59
(1994) 605.
[13] D. Zimdars, K.B. Eisenthal, J. Phys. Chem. B 105 (2001)
3993.
[14] I. Benjamin, Chem. Rev. 96 (1996) 1449, and references
therein.
[15] M. Matsumoto, Y. Takaoka, Y. Kataoka, J. Chem. Phys.
98 (1993) 1464.
[16] B. Yang, D.E. Sullivan, C.G. Gray, J. Phys.: Condens.
Matter 6 (1994) 4823.
[17] R.S. Taylor, L.X. Dang, B.C. Garrett, J. Phys. Chem. 100
(1996) 11720.
[18] V.P. Sokhan, D.J. Tildesley, Mol. Phys. 92 (1997) 625.
[19] J. Alejandre, D.J. Tildesley, G.A. Chapela, J. Chem. Phys.
102 (1995) 4574.
[20] R.D. Mountain, J. Phys. Chem. B 105 (2001) 6556.
[21] P. Jungwirth, D.J. Tobias, J. Phys. Chem. B 104 (2000)
7702.
[22] P. Jungwirth, D.J. Tobias, J. Phys. Chem. B 105 (2001)
10468.
[23] P. Jungwirth, D.J. Tobias, J. Phys. Chem. B 106 (2002)
6361.
[24] S.J. Stuart, B.J. Berne, J. Phys. Chem. A 103 (1999) 10300.
[25] H.J.C. Berendsen, J.R. Grigera, T.P. Straatsma, J. Phys.
Chem. 91 (1987) 6269.
[26] D.E. Smith, L.X. Dang, J. Chem. Phys. 100 (1994) 3757.
[27] L.X. Dang, J. Chem. Phys. 102 (1995) 3483.
[28] S. Koneshan, J.C. Rasaiah, R.M. Lynden-Bell, S.H. Lee,
J. Phys. Chem. B 102 (1998) 4193.
[29] S. Chowdhuri, A. Chandra, J. Chem. Phys. 115 (2001)
3732.
[30] M.P. Allen, D.J. Tildesley, Computer Simulation of
Liquids, Oxford University Press, Oxford, 1987.
[31] J.G. Kirkwood, F.P. Buff, J. Chem. Phys. 17 (1949) 338.
[32] M. Mecke, J. Winkelmann, J. Fischer, J. Chem. Phys. 110
(1999) 1188.
[33] R.C. Weast, et al. (Eds.), CRC Handbook of Chemistry
and Physics, CRS Press, Boca Raton, FL, 1989.
[34] A. Chandra, Phys. Rev. Lett. 85 (2000) 768.
[35] S. Balasubramanian, S. Pal, B. Bagchi, Phys. Rev. Lett. 89
(2002) 115505.
S. Paul, A. Chandra / Chemical Physics Letters 373 (2003) 87–93 93


![Chapter 16: Aqueous ionic equilibriumwebs.anokaramsey.edu/aspaas/1062/notes/ch16blank.pdf · Chapter 16: Aqueous ionic equilibrium ch16blank Page 1 . pH = pKa+ log [base] [acid] This](https://static.fdocuments.us/doc/165x107/5e79dfbe28d72078ac4bffd0/chapter-16-aqueous-ionic-chapter-16-aqueous-ionic-equilibrium-ch16blank-page-1.jpg)

