Dynamics of potential fill backfill material at very small...
15
HOSTED BY Dynamics of potential fill–backfill material at very small strains K. Senetakis a,n , B.N. Madhusudhan b a University of New South Wales, Sydney, Australia b University of Southampton, Southampton, UK Received 24 September 2014; received in revised form 21 April 2015; accepted 22 May 2015 Available online 26 September 2015 Abstract The paper presents a synthesis of past and recently acquired laboratory test results on granular soils using wave propagation techniques at very small strain amplitudes. Resonant column tests on uniform to well-graded coarse sands and gravels of angular and low sphericity grains were analyzed. Empirical-type equations were developed for the prediction of the elastic modulus and material damping at small strains considering the effects of the grading characteristics, the isotropic effective stress and the void ratio. The G 0 –p' relationship, expressed through exponent n G , was affected by the sample preparation method. For the narrow range in relatively low pressures adopted in the study, it was observed that n G decreased slightly with an increase in relative density. Due to the limited initial void ratios of those tests, the effect of the preparation method was not incorporated into the proposed formulae for the n G prediction. In this direction, additional experiments from the literature, which adopted the resonant column and bender element methods, were further analyzed, including soils of variable types tested with a wider range in relative densities. By employing typical formulae from the theory of elasticity, the bulk modulus and the changes in void ratio were estimated based on the change in isotropic effective stress in the literature data. Considering the recent micromechanical experimental findings associated with the nature of the contact response of soil particles, the importance of soil type and particle-contact behavior in the constant-state response of soils was demonstrated and quantified. Material damping values ranged from about 1.10% to about 0.45% for p' from 25 to 200 kPa with a slight decrease in D s0 with an increase in pressure. & 2015 The Japanese Geotechnical Society. Production and hosting by Elsevier B.V. All rights reserved. Keywords: Resonant column; Bender elements; Dry sand; Shear modulus; Damping ratio; Elastic properties 1. Introduction The resonant column method provides reliable measure- ments of modulus and damping at very small to medium strains, within a range of about 10 4 –10 2 %. Modulus derivations refer to secant stiffness and can provide an excellent indication of fabric effects. Constant-state stiffness and material damping are pressure-dependent and the G 0 –p' and D s0 –p' relationships are expressed through Eqs. (1) and (2), where G 0 and D s0 are the small-strain shear modulus and the material damping, respectively, and p' is the isotropic effective stress. The power n G and n D in these formulae express the effect of p' in the constant-state properties of soils, whilst A G and A D are material-dependent constants (Santamarina and Cascante, 1998; Santamarina et al., 2001). With reference to dry granular soils, material damping at very small strains is not affected significantly by the loading frequency (Menq, 2003); and thus, derivations for energy losses may also be considered in the resonant column method without any considerable effect of viscous damping on dry sands or gravels. G A p 1 n 0 G G = × ( ′) () The Japanese Geotechnical Society www.sciencedirect.com journal homepage: www.elsevier.com/locate/sandf Soils and Foundations http://dx.doi.org/10.1016/j.sandf.2015.09.019 0038-0806/& 2015 The Japanese Geotechnical Society. Production and hosting by Elsevier B.V. All rights reserved. n Corresponding author. E-mail address: [email protected] (K. Senetakis). Peer review under responsibility of The Japanese Geotechnical Society. Soils and Foundations 2015;55(5):1196–1210
Transcript of Dynamics of potential fill backfill material at very small...

H O S T E D B Y
Dynamics of potential fill–backfill material at very small strains
K. Senetakisa,n, B.N. Madhusudhanb
aUniversity of New South Wales, Sydney, AustraliabUniversity of Southampton, Southampton, UK
Received 24 September 2014; received in revised form 21 April 2015; accepted 22 May 2015Available online 26 September 2015
Abstract
The paper presents a synthesis of past and recently acquired laboratory test results on granular soils using wave propagation techniques at very smallstrain amplitudes. Resonant column tests on uniform to well-graded coarse sands and gravels of angular and low sphericity grains were analyzed.Empirical-type equations were developed for the prediction of the elastic modulus and material damping at small strains considering the effects of thegrading characteristics, the isotropic effective stress and the void ratio. The G0–p' relationship, expressed through exponent nG, was affected by the samplepreparation method. For the narrow range in relatively low pressures adopted in the study, it was observed that nG decreased slightly with an increase inrelative density. Due to the limited initial void ratios of those tests, the effect of the preparation method was not incorporated into the proposed formulaefor the nG prediction. In this direction, additional experiments from the literature, which adopted the resonant column and bender element methods, werefurther analyzed, including soils of variable types tested with a wider range in relative densities. By employing typical formulae from the theory ofelasticity, the bulk modulus and the changes in void ratio were estimated based on the change in isotropic effective stress in the literature data.Considering the recent micromechanical experimental findings associated with the nature of the contact response of soil particles, the importance of soiltype and particle-contact behavior in the constant-state response of soils was demonstrated and quantified. Material damping values ranged from about1.10% to about 0.45% for p' from 25 to 200 kPa with a slight decrease in Ds0 with an increase in pressure.& 2015 The Japanese Geotechnical Society. Production and hosting by Elsevier B.V. All rights reserved.
Keywords: Resonant column; Bender elements; Dry sand; Shear modulus; Damping ratio; Elastic properties
1. Introduction
The resonant column method provides reliable measure-ments of modulus and damping at very small to mediumstrains, within a range of about 10�4
–10�2%. Modulusderivations refer to secant stiffness and can provide anexcellent indication of fabric effects. Constant-state stiffnessand material damping are pressure-dependent and the G0–p'and Ds0–p' relationships are expressed through Eqs. (1) and(2), where G0 and Ds0 are the small-strain shear modulus and
the material damping, respectively, and p' is the isotropiceffective stress. The power nG and nD in these formulaeexpress the effect of p' in the constant-state properties of soils,whilst AG and AD are material-dependent constants(Santamarina and Cascante, 1998; Santamarina et al., 2001).With reference to dry granular soils, material damping at verysmall strains is not affected significantly by the loadingfrequency (Menq, 2003); and thus, derivations for energylosses may also be considered in the resonant column methodwithout any considerable effect of viscous damping on drysands or gravels.
G A p 1n0 G G= × ( ′) ( )
The Japanese Geotechnical Society
www.sciencedirect.comjournal homepage: www.elsevier.com/locate/sandf
Soils and Foundations
http://dx.doi.org/10.1016/j.sandf.2015.09.0190038-0806/& 2015 The Japanese Geotechnical Society. Production and hosting by Elsevier B.V. All rights reserved.
nCorresponding author.E-mail address: [email protected] (K. Senetakis).Peer review under responsibility of The Japanese Geotechnical Society.
Soils and Foundations 2015;55(5):1196–1210
User
Cross-Out
User
Inserted Text
the power

D A p 2ns0 D D= × ( ′) ( )
Past and recently acquired research works have demon-strated that resonant column test results may also provideuseful information related to the effect of properties at thegrain scale on the macro-scale response of soils and a betterunderstanding of the dominant mechanisms in particulatemedia during cyclic/dynamic loading (e.g., Santamarina andCascante, 1996, 1998; Cascante and Santamarina, 1996;Senetakis et al., 2013a, 2013b). This is because the resonantcolumn method provides an indication of the fabric effectseven in the range of extremely small deformations (e.g.,Cascante and Santamarina, 1996), and these fabric effects,from a micromechanical point of view, are linked to themagnitude and the distribution of the contact forces (e.g.,Radjai and Wolf, 1998) and the probable preferable concen-tration of normals in the vertical direction within a granularassembly of particles (e.g., Yoshimine et al., 1998). Forexample, it has been shown through resonant column teststhat due to the plastic nature of the particle contact response,which is more dominant in the sliding direction (e.g., micro-mechanical experimental findings by Cole and Peters, 2007,2008, Cole et al., 2010, and Senetakis et al., 2013c), the G0–p'relationship cannot be described efficiently by the Hertz–Mindlin theory. This theory could predict a value for theexponent nG equal to 1/3 (Santamarina and Cascante, 1996),which represents more effectively particulate media with anelastic particle-contact response in nature. However, highervalues for nG have been determined through resonant columntests or derived from other wave propagation techniques, suchas the bender element method or cyclic-dynamic triaxial tests(e.g., Hardin and Richart, 1963, Hardin, 1978, Kokusho, 1980,Chung et al., 1984, Tanaka et al., 1987, Goto et al., 1987,Menq, 2003, Cho et al., 2006, Senetakis et al., 2012 amongothers). This is because of the visco-plastic to brittle nature ofthe contact response of soil particles (Cascante andSantamarina, 1996).
Through wave propagation experiments, Cho et al. (2006)found a significant effect of particle shape in the G0–p'relationship. They attributed their observations to the possibleeffect of the particle contact response which alters between
irregular and regular in shape particles, perhaps because of themore pronounced grain crushing or micro-crushing and overallchanges in bulk volume when more irregularly shapedparticles are considered than regularly shaped particles.Through one-dimensional compression tests on referenceparticles, Cavarretta et al. (2010) verified the significant effectof particle shape in the overall compression-pressure relation-ship which, in turn, affects the fabric, and thus, the stiffness ofgeo-materials. In this direction, Senetakis et al. (2012), whostudied the small-strain dynamic properties of fine- to medium-grained sands, reported a significant effect of particle shape onthe constants nG and AG.Menq (2003) and Menq and Stokoe (2003) noticed in their
resonant column experiments a dominant effect of the coeffi-cient of uniformity in the G0–p' relationship. This trend hasbeen correlated, partly, through numerical simulations andquantification of the grain size distribution effects on isotro-pically consolidated granular assemblies, to the distributionand magnitude of the particle contact forces (e.g., Radjai andWolf, 1998, Radjai et al., 1998). Recently, Senetakis et al.(2012, 2013a) highlighted the importance of particle type andmorphology in the G0–p' relationship. Senetakis et al. attrib-uted their observations primarily to the possibly more pro-nounced damage of surface roughness because of the couplednormal force – deflection and tangential force – deflectionresponses at particle contacts. These derivations were based onthe recent quantification of particle damage by Senetakis et al.(2013c) and measurements of friction and stiffness at particlecontacts by Senetakis et al. (2013c, 2013d) and Senetakis andCoop (2014, 2015) on reference strong particles of a quartzsand and reference weak particles of a biogenic crushable sand.For example, Fig. 1 presents the coupled effect of normal loadand tangential load – deflection responses at the contacts oftwo quartz particles before and after sliding tests by Senetakiset al. (2013c). In this figure, a cross-section of a quartz particleis shown within the area of contact and sliding on the surfaceof another similar particle before and after micromechanicalsliding tests. They quantified the damage of the surfaceroughness using white light interferometry. As demonstratedin the figure, the coupled effect of the normal force and slidingsignificantly reduced the magnitude of surface roughness
Fig. 1. Quantification of surface roughness damage due to shearing between two quartz particles: interferometer section before and after shearing (Senetakis et al.,2013c) – Horizontal size is 141.5 μm.
K. Senetakis, B.N. Madhusudhan / Soils and Foundations 55 (2015) 1196–1210 1197

(vertical axis) with the removal of asperities due to shearing.This experimental observation may be one of the keys to theconnection between the particle-contact response and theconstant-state macro-scale properties of soils.
The higher magnitude of stiffness for soils of stronger-harder particles in comparison to weaker-crushable particles,found by Senetakis et al. (2012, 2013a) in their resonantcolumn tests, along with the probable different energy dis-sipation mechanisms from small to medium strains, may beexplained by the significant differences observed in themicromechanical tests by Senetakis et al. (2013c) at thecontacts of strong and weak particles with respect to frictionand stiffness on the micro-scale level. Previous research works,for example, Sadd et al. (1993, 2000), Sazzad and Suzuki(2011), Barreto and O' Sullivan (2012) or Huang et al. (2014),have highlighted through numerical studies the partiallyimportant effect of the particle contact characteristics (e.g.,coefficient of friction at particle contacts, stiffness or particle-contact response model) in the overall macro-scale behavior ofsoils.
In this study a synthesis of torsional resonant column tests ispresented on a potential fill–backfill material of hard grainswith particle size from coarse sand to fine gravel and a varietyof coefficients of uniformity. Particular focus is given to theconstant-state properties of the samples in terms of the G0–p'and Ds0–p' relationships in the range of relatively lowconfining stresses which represent typical low working loadsfor geotechnical engineering design. For this range of rela-tively low stresses, no measurable damage to particles wasobserved, at least visually. For further interpretations and a linkbetween the macro-scale observed behavior of the samples andthe probable effect of the particle contact response, additionaldynamic test results that have been published by the authorswere included and re-analyzed by means of investigating theG0–p' relationship adopting formulae from the theory ofelasticity.
2. Materials, sample preparation and testing program
2.1 Primary dynamic testing program: materials andexperimental techniques
Fifteen samples, denoted as "SAMPLE01" to "SAM-PLE15", were created in the laboratory from the same parentsoil of hard, angular particles of low sphericity. The labora-tory-created samples had a mean grain size, d50, a coefficientof uniformity, Cu, and a maximum grain size, dmax, in theranges of 1.33–10.1 mm, 1.03–12.5 and 2.00–12.7 mm,respectively. The specific gravity of solids was determinedby adopting the water pycnometer method (ASTM, 2002,D854-02) with a value equal to 2.67, which was foundindependent of the particle size. Adopting the unified classi-fication system USCS (ASTM, 2000a, D2487-00), the soilswere classified as SP, SP-SW, GP and GW with varyingpercentages of sand and gravel portions. It is noted that byemploying the ASTM specifications, the gravel-size grainswere defined as the fraction retained on sieve No. 4 (size equal
to 4.75 mm) and the "gravelly" samples for soils that had agravel content of more than 50% of dry mass. These samples,presented in Fig. 2 and Table 1, comprised the materials of theprimary dynamic testing program of the study and they weresubjected to isotropic torsional resonant column (RC) testing ina dry state. The maximum void ratio (emax) of the samples wasdetermined following the ASTM (2000b) D4254-00 specifica-tion, whilst the vibratory table method (ASTM, 2000c, D4253-00) was used to determine the minimum void ratio (emin). Anoptical microscope image of the fine-sand fraction of the parentsoil is given in Fig. 3 (fraction 0.075–0.180 mm). Adopting theempirical chart for the quantification of the particle shapedescriptors by Krumbein and Sloss (1963), it was revealed thatthe particles had very low roundness with R values between0.1 and 0.3 and very low sphericity with S values between0.3 and 0.5 for the majority of the particles. It is noted that Rand S denote the mean roundness and the sphericity of thegrains, respectively (Krumbein and Sloss, 1963; Santamarinaet al., 2001; Cho et al., 2006).For each sample of the primary dynamic testing program,
two specimens were constructed in a standard split mold,approximately 71 mm in internal diameter and 142 mm inheight, one loose to very loose specimen and one dense to verydense specimen. To prepare the loose samples, the handspooning method was used and the soil was prepared keepinga very small height of fall between the spoon and the freesurface of the sample. For dense samples, the material wasprepared in fourteen layers of, approximately, 10 mm inthickness. Compaction was applied for each layer using astainless steel tamper with diameter about 0.6 times thediameter of the sample and a weight of about 9 kN. Theheight of drop of the tamper was approximately equal to40 mm and the total number of tips for the fourteen layers wasequal to approximately 1050 (i.e., on average 75 tips perlayer). Assuming a diameter of the sample of 70 mm and alength of 140 mm, the applied compaction energy was about700 kN m/m3. This compaction energy is slightly greater thanthe energy provided in the specifications of ASTM for standardcompaction (600 kN m/m3) which resulted in high density
Fig. 2. Grain size distribution curves of materials tested in a Drnevich-typeresonant column apparatus (primary dynamic testing program).
K. Senetakis, B.N. Madhusudhan / Soils and Foundations 55 (2015) 1196–12101198

samples. It is noted that the fractions of the study were coarse-grained, and thus, the difference in emax and emin is expected tobe narrow (Menq, 2003). This is opposite to the trend observedin clays, for which soils small changes in the overconsolidationratio can produce significant changes in the void ratio.Therefore, small changes in the compaction energy in thestudy, and thus, small changes in the void ratio at which thesamples were prepared could reflect significant changes in theinitial relative density, as depicted in Table 2.
For each specimen, prior to the first isotropic consolidationstage in the resonant column at p'¼25 kPa, a vacuum of 5 kPawas applied during the setup of the drive mechanism and thesurrounding electrical and mechanical parts of the resonantcolumn. After the setup of the apparatus, each sample was
subjected to resonant column testing in torsional mode ofvibration at increasing steps of p' equal to 25, 50, 100 and200 kPa. The aim of the primary dynamic testing program wasto (a) measure elastic moduli G0, and material damping Ds0 ofthe potential fill and backfill materials in the range of verysmall strains; (b) study the effects of isotropic effective stressp', void ratio e and grain size characteristics on the dynamicconstant-state properties of the samples; (c) develop empirical-type equations that can be used for modeling the elasticproperties of granular soils, in particular, coarse-sands andgravels of very low sphericity and angular grains. A linkbetween the soil properties at the grain scale and the overallmacro-scale response of the samples, and comparisonsbetween the results of this study and those of previouslypublished data are also discussed. Details of the specimens ofthe primary dynamic testing program, including the initial voidratio, the dry unit weight and the relative density at which thespecimens were prepared, as well as the range in shear strainamplitudes at which G0 and Ds0 were measured (denoted asγLA), are summarized in Table 2. It is noted that for therelatively low pressures adopted in the study, no significantdamage to the grains or breakage of the asperities wasobserved, at least visually. As mentioned in the studies bySenetakis et al. (2013a, 2013b), for crushable (volcanic) sandsand gravels, some damage to the particles was observedvisually after the resonant column tests. This was not the casefor the hard particles included in the primary dynamic testingprogram of the present study.The samples were vibrated in torsional mode using a fixed-
free resonant column apparatus of the Drnevich type(Drnevich, 1967). This system utilizes four coils whichsurround the drive mechanism embedded with two magnetsand an accelerometer to record the sample response on its top.
Table 1Laboratory-created samples of primary dynamic testing program.
Laboratory material d50 (mm) Cu Cc dmax (mm) emin emax Gravel content (%) USCS Method
(1) (2) (3) (4) (5) (6) (7) (8) (9) (10)SAMPLE01 1.33 2.13 1.01 2.00 0.502 0.876 0 SP RC-TSAMPLE02 1.33 11.8 0.68 9.53 0.271 0.511 20 SP-SW RC-TSAMPLE03 2.00 2.50 1.07 4.75 0.467 0.810 0 SP RC-TSAMPLE04 2.00 5.40 0.50 9.53 0.370 0.651 21 SP RC-TSAMPLE05 2.00 7.30 0.65 12.7 0.302 0.633 25 SP-SW RC-TSAMPLE06 3.07 1.53 0.90 4.75 0.572 0.950 0 SP RC-TSAMPLE07 3.00 2.45 1.10 6.35 0.465 0.818 15 SP RC-TSAMPLE08 3.07 4.24 1.77 9.53 0.362 0.654 20 SP RC-TSAMPLE09 2.90 5.95 1.19 9.53 0.450 0.880 30 SP-SW RC-TSAMPLE10 3.00 7.85 0.68 9.53 0.424 0.849 40 SP-SW RC-TSAMPLE11 3.00 12.5 0.94 9.53 0.330 0.590 40 SP-SW RC-TSAMPLE12 5.50 1.17 0.96 6.35 0.688 0.985 100 GP RC-TSAMPLE13 6.40 2.70 1.19 12.7 0.453 0.820 75 GW RC-TSAMPLE14 7.80 1.22 0.94 9.53 0.593 0.870 100 GP RC-TSAMPLE15 10.1 1.03 1.00 12.7 0.590 0.902 100 GP RC-T
(2) Mean grain-size; (3) coefficient of uniformity;(4) coefficient of curvature; (5) maximum grain size(6) minimum void ratio; (7) maximum void ratio;(8) percentage of coarse soil retained on No. 4 (4.75 mm) sieve; (9) ASTM D2487-00;(10) RC-T¼resonant column torsional modeLow-amplitude RC tests were performed at increasing steps of p' equal to 25, 50, 100 and 200 kPa.
Fig. 3. Optical microscope image of fine-sand portion of granular material ofprimary dynamic testing program (fraction 0.075–0.180 mm).
K. Senetakis, B.N. Madhusudhan / Soils and Foundations 55 (2015) 1196–1210 1199

A close-up view of the top of the sample with the attachedexcitation mechanism and the surrounding coils is given inFig. 4. The experiments were controlled and monitoredmanually through an electronic system of controllers, oscillatorand amplifiers. Changes in sample height during the consoli-dation stage or during dynamic loading were monitored
through a vertically positioned linearly variable differentialtransformer (LVDT) of repeatability equal to 0.01 mm. Thismeans that the transducer could capture changes in the samplelength not less than 0.01 mm. In those tests and for the case ofdry specimens, the estimated changes in sample volume wereimplemented by the records of the vertically positioned LVDTassuming isotropic compression of the sample through Eq. (3),where εv and εa are the volumetric and axial strains,respectively.
3 3v aε ε= × ( )
For the analysis of the resonant column tests, the ASTMspecifications were adopted (ASTM, 1992), whilst for thematerial damping derivations, the steady-state vibrationmethod was used (Senetakis et al., 2015).
2.2 Secondary dynamic testing program: analysis of literaturetest data
Apart from the samples of the primary dynamic testingprogram (Tables 1 and 2), additional granular soils, for which
Table 2Primary dynamic testing program.
Code name of specimen eo γdo (kN/m3) RD (%) γLA (� 10�4%) AG* (MPa) nG AD
* (%) nD
(1) (2) (3) (4) (5) (6) (7) (8) (9)SAMPLE01-1a 0.594 16.43 75 4.4–4.6 71.7 0.63 0.78 �0.03SAMPLE01-2a 0.820 14.39 15 6.2–9.6 64.7 0.65 0.61 �0.30SAMPLE02-1 0.354 19.34 65 3.3–4.0 36.0 0.71 0.79 �0.21SAMPLE02-2 0.498 17.49 5 3.4–6.8 41.6 0.72 0.65 �0.05SAMPLE03-1a 0.553 16.87 75 2.0–3.7 63.5 0.57 0.53 �0.08SAMPLE03-2a 0.770 14.80 12 6.3–7.0 65.4 0.67 0.62 �0.24SAMPLE04-1 0.440 18.19 75 1.3–5.0 48.8 0.64 0.70 �0.05SAMPLE04-2 0.605 16.32 16 4.4–7.5 56.5 0.68 0.69 �0.36SAMPLE05-1 0.396 18.76 72 1.0–5.0 44.1 0.61 0.77 �0.09SAMPLE05-2 0.558 16.81 23 4.5–7.9 50.7 0.67 0.71 �0.27SAMPLE06-1 0.579 16.59 98 4.1–4.7 77.1 0.45 0.83 �0.02SAMPLE06-2 0.835 14.27 30 5.2–7.5 73.5 0.55 0.61 �0.27SAMPLE07-1 0.611 16.26 59 2.1–2.5 75.1 0.50 0.61 �0.12SAMPLE07-2 0.718 15.25 28 2.3–5.2 77.7 0.47 0.96 �0.12SAMPLE08-1 0.483 17.66 58 3.8–7.3 57.4 0.43 0.79 �0.12SAMPLE09-1 0.479 17.71 93 2.8–4.2 66.0 0.65 0.57 �0.26SAMPLE10-1 0.592 16.45 60 4.2–7.8 51.1 0.63 0.95 �0.16SAMPLE11-1 0.448 18.09 55 1.4–4.4 51.8 0.59 0.65 �0.25SAMPLE11-2 0.570 16.68 8 4.1–8.4 57.4 0.60 0.91 �0.19SAMPLE12-1b 0.700 15.41 96 1.9–4.1 90.9 0.46 0.59 �0.10SAMPLE12-2b 0.878 13.95 36 2.1–4.1 83.2 0.50 0.58 �0.18SAMPLE13-1 0.633 16.04 51 3.9–4.2 89.3 0.48 0.74 �0.05SAMPLE13-2 0.732 15.12 24 3.7–6.2 71.3 0.54 0.66 �0.30SAMPLE14-1b 0.624 16.13 89 3.0–4.1 92.3 0.46 0.76 �0.19SAMPLE14-2b 0.846 14.19 9 4.5–5.2 78.8 0.53 0.72 �0.16SAMPLE15-1b 0.618 16.19 91 2.1–2.6 79.3 0.48 0.52 �0.25SAMPLE15-2b 0.867 14.03 11 4.2–6.8 85.3 0.48 0.76 �0.27
(2) Initial void ratio; (3) initial dry unit weight; (4) initial relative density;(5) shear stain at which low-amplitude RC measurements were conducted;(6), (7) shear modulus constants; (8), (9) material damping constants.
(a)Senetakis et al. (2012, 2013a).(b)Senetakis et al. (2013b).
Fig. 4. Close-up view of top of sample, excitation mechanism and surroundingcoils of the Drnevich-type resonant column used in the experiments of theprimary dynamic testing program.
K. Senetakis, B.N. Madhusudhan / Soils and Foundations 55 (2015) 1196–12101200

wave propagation velocities and moduli have been presentedin previous published works by the authors, were included inthe study. These soils are summarized in Table 3 and referredto as samples of the secondary dynamic testing program.Quartz sand SP-2 was studied by Madhusudhan (2011); thissoil was subjected to torsional and flexural modes of vibrationin a modified Stokoe-type resonant column apparatus(Cascante et al., 1998). Quartz sand SP-4 was studied byKumar and Madhusudhan (2010); this soil was subjected tobender/extender element tests; and thus, shear and Young'smoduli were measured for both SP-2 and SP-4. Details of thebender/extender element method and the adopted interpreta-tions may be found elsewhere (e.g., Kumar and Madhusudhan,2010, 2012). The soils with code names LWCID6 (pumicegravel) and V3 (rhyolitic crushed rock) in Table 3 were studiedby Senetakis et al. (2012, 2013a, 2013b); these soils weresubjected to a torsional mode of vibration under isotropicresonant column testing.
All the materials included in Table 3 were prepared at threeto five initial void ratios; and thus, these samples wereincluded in this study in order to (a) enrich the interpretationsof this research work with respect to the effect of thepreparation method and the initial fabric on the elastic modulusparameters, (b) highlight the importance of the particle contactresponse in the constant-state behavior of particulate media bycomparing the effect of p' in the changes in void ratio insamples of variable types (i.e., hard or weak-crushable grains)and (c) provide, based on the experiments, useful equationsthat can be utilized in numerical simulations of particulatemedia (i.e., discrete element simulations) associated withchanges in the void ratio of isotropically consolidated samplesof variable types for a given change in p'. It is noted that sandsSP-2 and SP-4 are quartz of strong-massive particles, whereasmaterials LWCID6 and V3 are volcanic soils of weakerparticles of intra-particle voids. Therefore, the interpretationsfor those soils comprise the key for a link between properties atthe grain scale and macro-scale observed responses associatedwith constant-state properties.
3. Experimental results and discussion
3.1 Small-strain shear modulus: formulation of empirical-typeequation, typical results and comparisons with literaturemodels
Typical plots of small-strain shear modulus G0 against p' aregiven in Fig. 5(a) and (b) for uniform and well-graded samples,respectively. Fitting curves of the general formula of Eq. (1)are also depicted in these figures along with the computedvalues for the power nG.For the uniform soil (SAMPLE06), this power corresponded
to values in a range of nG¼0.45–0.55, which are typical valuesfor reconstituted uniform granular soils reported in theliterature (e.g., Hardin and Richart, 1963; Hardin, 1978;Kokusho, 1980; Santamarina et al., 2001). For the well-gradedsoil (SAMPLE04), nG had higher values, which was thegeneral trend for the well-graded soils of the study incomparison to uniform samples.In Fig. 6, the measured G0 values of the study were
compared with empirical-type models proposed in the litera-ture. In particular, the formulae proposed by Hardin andRichart (1963) in Fig. 6(a), Menq (2003) in Fig. 6(b) andWichtmann and Triantafyllidis (2009) were used for thispurpose. It was noticed that these formulae underestimatedthe measured shear moduli and this may be attributed in part todifferences in the particle shape descriptors between the soilsof the present study and the soils used for the development ofthe empirical-type models in previous studies. More pro-nounced scatter was noticed at higher levels of p' whichmirrors the possible scatter of the nG values. On the otherhand, the underestimation of the shear moduli mirrors thedifferences in AG values between the empirical models and thedata of the study. In previous works, for example, by Menq(2003) or Wichtmann and Triantafyllidis (2009), the gradingcharacteristics were incorporated into the development of theG0 formulae, but it is possible that these formulae may moreefficiently cover soils of sub-angular to rounded particles,
Table 3Samples of secondary dynamic testing program.
Laboratory material d50 (mm) Cu Cc dmax (mm) Gravel content (%) USCS Type Method
(1) (2) (3) (4) (5) (6) (7) (8) (9)SP2a 0.31 2.00 1.08 0.42 0 SP Quartz RC-T/FSP4b 2.50 1.32 0.88 4.75 0 SP Quartz BE/EEV3c 0.55 4.18 0.75 4.75 0 SP Rhyolite RC-TLWC1D6d 5.60 1.20 0.97 9.53 96 GP Pumice RC-T
(2) Mean grain-size; (3) coefficient of uniformity; (4) coefficient of curvature; (5) maximum grain size;(6) percentage of coarse soil retained on No.4 (4.75 mm) sieve; (7) ASTM D2487-00(8) Type of soil;(9) RC-T/F¼ resonant column torsional and flexural modes, RC-T¼ resonant column torsional mode BE/EE¼bender and extender elements.
(a)Madhusudhan (2011).(b)Kumar and Madhusudhan (2010).(c)Senetakis et al. (2012, 2013a).(d)Senetakis et al. (2013b).
K. Senetakis, B.N. Madhusudhan / Soils and Foundations 55 (2015) 1196–1210 1201

whilst in the present study, the grains were of high angularity.Cho et al. (2006) highlighted the importance of particle shapein both AG and nG parameters. Thus, a modification of theconstants of those empirical formulae is necessary for a betterfit to granular soils of high angularity.
3.2 Effect of isotropic pressure on changes in void ratio
In addition to the effect of Cu on the small-strain shearmodulus parameters, the RC test results in Fig. 5 and for agiven sample, showed higher values for nG for a looserspecimen than a denser one, and this was a systematic trendobserved in the study. In order to further examine the effect ofthe sample preparation method on nG, the changes in void ratiode, of the samples, due to the change in p', were estimated byadopting the formulae from the theory of elasticity expressedthrough Eqs. (4) and (5) (Richart et al., 1970). These formulaemay provide an alternative estimation of the changes in samplevoid ratio due to an increase in p'. Typically, changes in voidratio are implemented by assuming isotropic compression.
p e
Kde
1
4o( )
=′ × +
( )
K E G4
3 50 0= −( )
In Eqs. (4) and (5), K is the bulk modulus, eo is the voidratio at which the samples were prepared, G0 is the measuredsmall-strain shear modulus and E0 is the small-strain Young's
Fig. 5. Typical plots of shear moduli against isotropic effective stress for(a) uniform soil SAMPLE06 and (b) well-graded soil SAMPLE04.
Fig. 6. Comparison between measured and estimated G0 using formulae fromthe literature: (a) Hardin and Richart (1963), (b) Menq (2003) and (c)Wichtmann and Triantafyllidis (2009).
K. Senetakis, B.N. Madhusudhan / Soils and Foundations 55 (2015) 1196–12101202

modulus. For the computation of E0, Eq. (6) was used byassuming a value for Poisson's ratio, equal to 0.25, whichmight be representative for granular soils (Menq, 2003).
E v G2 1 60 0= × ( + ) × ( )
The change in void ratio de, for a given increase in p' forSAMPLE04 and SAMPLE06, is given in Fig. 7. Through aregression analysis, the fitting curves of the general formula ofEq. (7) were also plotted in the figure. Parameter ne in Eq. (7)expresses the slope of the de–p' relationship, whilst β is aconstant, and thus, ne mirrors the alteration in constant-stateproperties of granular soils for a given change in p'.
n pde 7e β= × + ( )′
From the results in Fig. 7 it was demonstrated that theexponent ne decreased with a decrease in void ratio or,alternatively, with an increase in relative density. Theseobservations demonstrated that the power nG, and thus, theG0–p' relationship, is possibly affected by the preparationmethod, and that the more pronounced increase in G0 with anincrease in p', for a looser sample, is attributed to the morepronounced changes in void ratio when the sample has a lowerrelative density. This observed trend might be explained by thefundamental behavior of soils reported by Jovicic and Coop
(1997). In particular, Jovicic and Coop found that the samplesthey tested, prepared with different initial void ratios, tended toa unique line in the log G0–log p' plot and this observed trendwas more pronounced at relatively high isotropic pressures, ingeneral beyond 1.0 MPa. In the present study and in most soildynamics laboratory research works, the pressures underconsideration are in the range of 0.05–0.5 MPa for mostpractical purposes. Therefore, the slight increase of nG for alooser packing, may be related to the trend of the initial moduliat variable relative densities and for a given soil to converge athigher pressures to a unique line.It is noted that, in this study, the investigation of the effect of
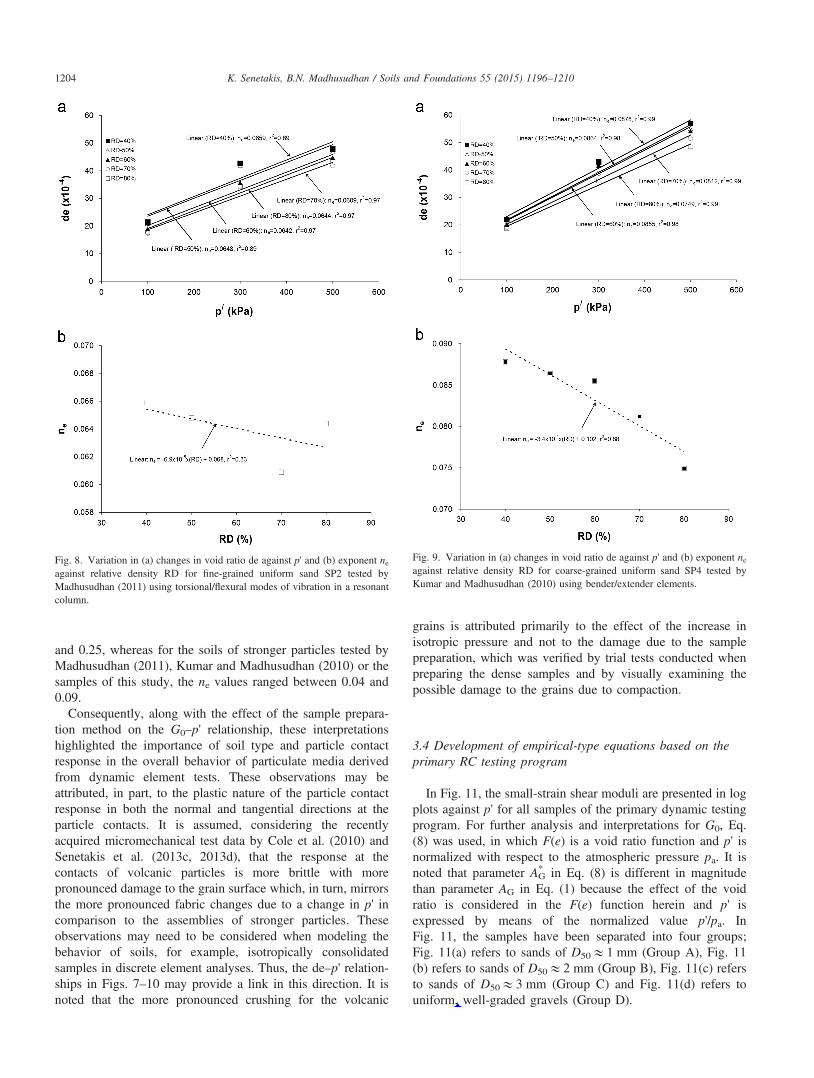
the preparation method on the shear modulus parameters waslimited because only two specimens were tested in the resonantcolumn for each sample of the primary dynamic testingprogram, namely, a relatively dense to very dense sampleprepared with compaction in layers and a loose to very loosesample prepared with the hand-spooning method. For the sakeof completeness and in order to further study the aforemen-tioned interpretations, the authors present herein correspondingresults by Madhusudhan (2011) and Kumar and Madhusudhan(2010) who thoroughly investigated the effect of the samplepreparation method on the shear modulus parameters of a fine-grained uniform quartz sand denoted as SP2 and a coarse-grained uniform sand denoted as SP4 (Table 3). The de–p'relationships from those two studies are presented in Figs. 8(a) and 9(a) along with estimated fitting curves using Eq. (7).The ne–RD relationships are plotted in Figs. 8(b) and 9(b).These results, in agreement with the findings of the primarydynamic testing program, demonstrated the importance of thesample preparation method in the G0–p' relationship with adecrease of the power ne for denser samples.
3.3 Effect of particle type and particle contact response on de–p' relationship
The importance of soil type and the nature of the particlecontact response on the de–p' relationship was examined by acomparison between the results of Figs. 7–9 with the resultsshown in Fig. 10. In the latter figure, the corresponding de–p'and ne–RD relationships for sands and gravels of volcanicorigin with intra-particle voids are presented. The pumice soil,tested by Senetakis et al. (2013b), named LWC1D6 in thatstudy, and the crushed rhyolithic rock, tested by Senetakiset al. (2012, 2013a), named V3 in their work, were subjected totorsional mode of vibration; and thus, only the G0–p' relation-ships were available in that study. The authors back-calculatedYoung’s modulus from Eq. (6) assuming a Poisson’s ratio of0.25 for the volcanic soils. Using Eqs. (4)–(7) and through aregression analysis, the de–p' and ne–RD relationships werethereafter determined. It was revealed that the values for ne ofthe volcanic soils were much higher than the ne values of thesoils of this study (Fig. 7) and the studies by Madhusudhan(2011) (Fig. 8) and Kumar and Madhusudhan (2010) (Fig. 9)with additional substantially higher (de) values for the volcanicsoils, in particular for the pumice gravel. For example, for thepumice gravel in Fig. 10, the ne values ranged between 0.13
Fig. 7. Variation in (a) changes in void ratio de against p' and (b) exponent neagainst relative density RD for uniform SAMPLE06 and well-gradedSAMPLE04.
K. Senetakis, B.N. Madhusudhan / Soils and Foundations 55 (2015) 1196–1210 1203
User
Cross-Out
User
Inserted Text
studies
User
Cross-Out
User
Inserted Text
these
and 0.25, whereas for the soils of stronger particles tested byMadhusudhan (2011), Kumar and Madhusudhan (2010) or thesamples of this study, the ne values ranged between 0.04 and0.09.
Consequently, along with the effect of the sample prepara-tion method on the G0–p' relationship, these interpretationshighlighted the importance of soil type and particle contactresponse in the overall behavior of particulate media derivedfrom dynamic element tests. These observations may beattributed, in part, to the plastic nature of the particle contactresponse in both the normal and tangential directions at theparticle contacts. It is assumed, considering the recentlyacquired micromechanical test data by Cole et al. (2010) andSenetakis et al. (2013c, 2013d), that the response at thecontacts of volcanic particles is more brittle with morepronounced damage to the grain surface which, in turn, mirrorsthe more pronounced fabric changes due to a change in p' incomparison to the assemblies of stronger particles. Theseobservations may need to be considered when modeling thebehavior of soils, for example, isotropically consolidatedsamples in discrete element analyses. Thus, the de–p' relation-ships in Figs. 7–10 may provide a link in this direction. It isnoted that the more pronounced crushing for the volcanic
grains is attributed primarily to the effect of the increase inisotropic pressure and not to the damage due to the samplepreparation, which was verified by trial tests conducted whenpreparing the dense samples and by visually examining thepossible damage to the grains due to compaction.
3.4 Development of empirical-type equations based on theprimary RC testing program
In Fig. 11, the small-strain shear moduli are presented in logplots against p' for all samples of the primary dynamic testingprogram. For further analysis and interpretations for G0, Eq.(8) was used, in which F(e) is a void ratio function and p' isnormalized with respect to the atmospheric pressure pa. It isnoted that parameter AG
* in Eq. (8) is different in magnitudethan parameter AG in Eq. (1) because the effect of the voidratio is considered in the F(e) function herein and p' isexpressed by means of the normalized value p'/pa. InFig. 11, the samples have been separated into four groups;Fig. 11(a) refers to sands of D50E1 mm (Group A), Fig. 11(b) refers to sands of D50E2 mm (Group B), Fig. 11(c) refersto sands of D50E3 mm (Group C) and Fig. 11(d) refers touniform, well-graded gravels (Group D).
Fig. 8. Variation in (a) changes in void ratio de against p' and (b) exponent neagainst relative density RD for fine-grained uniform sand SP2 tested byMadhusudhan (2011) using torsional/flexural modes of vibration in a resonantcolumn.
Fig. 9. Variation in (a) changes in void ratio de against p' and (b) exponent neagainst relative density RD for coarse-grained uniform sand SP4 tested byKumar and Madhusudhan (2010) using bender/extender elements.
K. Senetakis, B.N. Madhusudhan / Soils and Foundations 55 (2015) 1196–12101204
User
Cross-Out
User
Inserted Text
and

⎛⎝⎜
⎞⎠⎟G A F e
p
p 8
n
0 Ga
G
= * × ( ) ×′
( )
F ee
19xe
( ) =( )
For F(e), the general formula presented in Eq. (9) was usedin which a value for the power xe equal to 1.3 (afterJamiolkowski et al., 1991) was adopted. Therefore, Eq. (1) isrewritten as follows:
⎛⎝⎜
⎞⎠⎟G A
e
p
p
1
10
n
0 G 1.3a
G
= * × ×′
( )
Using the experimentally derived G0 values, the constantsAG* and nG were computed by fitting the G0–p' relationship
with the power-law type function. These values are summar-ized in Table 2. By plotting AG
* and nG against Cu, as shown inFig. 12, fitting curves were estimated that correlated the small-strain shear modulus constants with the coefficient of uni-formity. The proposed formulae are given in Eqs. (11) and(12).
A . C .3 36 81 8 11G u* = − × + ( )
n . C0 485 120.G u
13= × ( )
For the shear moduli, the measured values are plottedagainst the predicted values in Fig. 13 using Eqs. (11) and(12). The scatter between the measured and the estimatedvalues varied for most samples within a range of 720%which is satisfactory for practical purposes. These formulaemay be more applicable for coarse-grained materials of verylow sphericity and high angularity grains as well as for thenormalization of G/G0 against shear strain curves, for example,by means of a hyperbolic type of model (Menq, 2003,Senetakis et al., 2013a, 2013b), since G0 defines the plateauof the normalized curves. The scatter shown in Fig. 13 issignificantly reduced in comparison to the results in Fig. 6,which is related, in part, to the variability in particle shapedescriptors used in different research works to developempirical-type models.It is noted that, in Eq. (12), the relative densities of the
samples were not incorporated into the nG power due to thelimited number of specimens prepared from each sample; andthus, the equation is applicable for relatively low engineeringworking loads. It is also noted that Eq. (12) would predict avalue for nG equal to approximately 0.49, for Cu¼1, which isvery close to the typical value of 0.50 reported in the literaturefor the contact response of real-soil particles which, in nature,is visco-plastic to brittle. On the other hand, for Cu¼5, Eq.(12) would predict a value for nG equal to 0.60. Similarly,previous research works have indicated an increase in nG withan increase in Cu. In different studies, however, the differentformulae and magnitudes of nG mirror, in part, the differencesin particle shape and overall morphology (for example, theresearch works by Menq, 2003, Wichtmann andTriantafyllidis, 2009, and the results of the present study). Inparticular, the empirical-type equations proposed by Menq(2003) and Wichtmann and Triantafyllidis (2009) for the nGprediction as a function of Cu are plotted for comparison inFig. 12(b).On the other hand, Eq. (11) would predict a decrease in AG
*
with increasing Cu, which implies that for a given void ratio andp', the constant-state stiffness decreases in magnitude for well-graded soils. This observation may be analytically explainedthrough Eq. (13), in which, fn is the average contact force for anisotropic particulate medium of spherical particles of a givensize, e is the void ratio, Cn is the average coordination numberwithin the granular assembly, p is the isotropic pressure and r isthe radium of the particles in contact (Rothenburg and Bathurst,1989, after Cascante and Santamarina, 1996). This formulaprovides an indication and a strong link to the findings of thiswork on that, for a given e and pressure, the normal contactforce, as an average value within a granular material, decreaseswith an increase in the coordination number and the latter is afunction of the coefficient of uniformity.
fe r p
C
4 1
13n
2
n=
π +× × ( ) × ×
( )
Fig. 10. Variation in (a) changes in void ratio de against p' and (b) exponent neagainst relative density RD for volcanic soils tested by Senetakis et al. (2012,2013b) using torsional mode of vibration in a resonant column.
K. Senetakis, B.N. Madhusudhan / Soils and Foundations 55 (2015) 1196–1210 1205

3.5 Small-strain material damping: formulation anddevelopment of empirical equation
The measured small-strain material damping values of allsamples of the primary dynamic testing program are plotted inFig. 14 against the normalized pressure in log plots. A slightdecrease in Ds0 with an increase in pressure, which isconsistent with previous research works (e.g., Cascante andSantamarina, 1996; Menq, 2003; Senetakis et al., 2012), wasobserved. For p'¼25 kPa, material damping ranged between0.80% and 1.10% for most samples, whilst for p'¼200 kPa,Ds0 ranged between 0.45% and 0.75% in the majority of theexperiments. No clear trend was observed for the effect of theinitial void ratio on Ds0; for example, for SAMPLE07 orSAMPLE15, Ds0 values decreased for the denser specimens incomparison to the looser samples, but the opposite trend wasobserved for SAMPLE06 or SAMPLE14. It is noted that, inthe study, the changes in sample volume, and thus, in voidratio, were based on the assumption of isotropic compression.In a previous study by Senetakis (2011), saturated samples atvariable initial densities were tested and accurate measure-ments of changes in sample volume were incorporated.Senetakis (2011) did not notice a systematic effect of the void
ratio on small-strain damping, which is in agreement with aprevious work on granular soils by Menq (2003).In order to further analyze the data, the following general
formula for material damping was adopted which is given as afunction of the normalized pressure.
⎛⎝⎜
⎞⎠⎟D A
p
p 14
n
s0 Da
D
= * ×′
( )
In Eq. (14), AD* and nD are material constants. For those
constants, a similar procedure to the one followed for thedetermination of the shear modulus constants was adopted. Foreach sample, Ds0 was plotted against p'/pa and a power lawequation was determined expressed through the constant AD
*
and the power nD. The analyses for those constants aresummarized in Table 2, while in Fig. 15, AD
* and nD areplotted against the coefficient of uniformity. No clear trendwas observed for the effect of the initial void ratio or thegrading characteristics of the samples on Ds0. The dataindicated an average value and a standard deviation for AD
* andnD equal to 0.7170.12% and �0.1770.10, respectively. Thematerial damping constants were more scattered than thecorresponding stiffness constants; this observation may be
Fig. 11. Small-strain shear modulus against confining pressure normalized with respect to the atmospheric pressure of all specimens: (a) sands with D50E1 mm,(b) sands with D50E2 mm, (c) sands with D50E3 mm and (d) uniform and well-graded gravels.
K. Senetakis, B.N. Madhusudhan / Soils and Foundations 55 (2015) 1196–12101206

attributed to the overall complex mechanisms of energydissipation in particulate media at very small deformations.In their analyses, Senetakis et al. (2012), based on resonantcolumn test data on fine to coarse grained sands of variabletypes including shape, mineralogy and morphology, similarlyreported average values for the constant AD
* between 0.62%and 0.52% for quartz and volcanic sands, respectively, whilstthe nG values were affected by particle shape. In Fig. 16, the
measured against the estimated damping ratios using Eq. (14)are plotted. The use of Eq. (14) with AD
* ¼0.71% and nD¼�0.17 did not show any systematic overestimation orunderestimation of Ds0 values over the measured dampingratios. For most data points, the scatter between the measuredand estimated values varied within a range of 730%. Thisscatter is satisfactory considering the uncertainties in measur-ing material damping in the laboratory.
3.6 Practical implications of proposed formulae and futureimprovements
Computer codes for seismic response analysis studies use G0
(or shear wave velocity Vs) and non-linear curves, i.e.,modulus degradation and increase in damping against shearstrain, as input. In addition, G0 is important in the normal-ization of the G/G0-strain curves which are very popular inengineering practice particularly when equivalent linear ana-lysis codes are used for seismic response studies and inmedium-strain geotechnical problems. G0 is the "start point"of a normalized curve and it has been recognized for itsimportance in the prediction of deformations for both staticand dynamic loading problems (e.g., Jovicic and Coop, 1997).Consequently, the importance of small-strain stiffness isassociated not only with studies that include seismic loading,but also with conventional foundation engineering, tunnelingdesign, infrastructures such as retaining walls and otherfacilities with fill–backfill material. Damping in the range ofsmall-strains can also be very important in particular in small-strain problems which may be of interest in machine founda-tion vibration analyses and soil-structure-interaction analysesof dynamically loaded systems. Small-strain damping is alsoimportant for the geophysical characterization of sediments(Cascante et al., 1998). This means that the dynamic propertiesexamined in the study are of immediate interest in engineeringpractice, including deformation prediction and dynamic pro-blems, and the produced formulae of the paper can be useddirectly for predictions of ground deformation as well as forgeophysical characterizations of sediments.The aim of the study was to propose formulae for small-
strain stiffness and damping prediction that are applicable tosoils of similar characteristics in terms of particle size,distribution, specific gravity and most importantly particleshape descriptors, i.e., for soils of low sphericity and round-ness. This type of soil, such as crushed rock, is very commonin geotechnical projects.It is noted that in the present study and, in particular, for
stiffness derivations, a void ratio function proposed in theliterature was incorporated, i.e., F(e)¼e�x where the power xwas equal to 1.3. In previous studies, for example by Menq(2003) or Senetakis et al. (2012), the experimental data wereadjusted in order to compute a best-fit x power, but in thepresent work a constant value was adopted, without adjustmentbased on the specific experiments of the study. This may addsome additional scatter to the predicted stiffness values. Thedecision for an appropriate void ratio function F(e) to be usedin the analysis affects the magnitude of the constant AG, but it
Fig. 12. Variation in shear modulus constants against coefficient of uniformityand comparisons with empirical-type models from the literature.
Fig. 13. Measured against estimated shear moduli.
K. Senetakis, B.N. Madhusudhan / Soils and Foundations 55 (2015) 1196–1210 1207

is expected not to have a qualitatively important effect ongeneral trends, for example, the effect of Cu on the power n orthe constant AG, whilst the produced formulae demonstrated animprovement between the estimated and the measured values.It was out of the scope of this paper to investigate in furtherdetail the uncertainties in estimating stiffness at small strains,which may include, for example, the effect of different void
ratio functions to be used in the small-strain stiffness formula.The main contributions of this work were (1) to emphasizesome differences with the literature data, for example, betweendifferent formulae for stiffness prediction; (2) to highlight theimportant effect of particle shape which significantly affectsthe differences in the proposed formulae in the literature; (3) toimprove the general formula for G0 prediction for the
Fig. 14. Material damping values against confining pressure normalized with respect to atmospheric pressure of all specimens: (a) sands with D50E1 mm,(b) sands with D50E2 mm, (c) sands with D50E3 mm and (d) uniform and well-graded gravels.
Fig. 15. Variation in material damping constants against coefficient of uniformity.
K. Senetakis, B.N. Madhusudhan / Soils and Foundations 55 (2015) 1196–12101208

particular type of soil which was mirrored through theimproved comparison between the measured and the estimatedvalues; and (4) to provide micro-mechanical interpretationsand the effect of the particle contact response including soils ofvariable types.
4. Conclusions
The study presented a synthesis of torsional resonantcolumn tests on a potential fill–backfill material with focuson elastic moduli G0 and material damping Ds0. Additionalpreviously published tests that adopted dynamic test methodswere re-analyzed. The following main conclusions may bedrawn:
1. The G0–p' relationship followed a power law with observedeffects of the preparation method and the coefficient ofuniformity on the power nG. These effects were attributed,in part, to the fundamental behavior of soils of convergentmoduli with respect to the effect of the preparation methodand to the effect of the coordination number on themagnitude and the distribution to the particle contact forceswithin a granular assembly, with respect to the coefficientof uniformity.
2. Using formulae from the theory of elasticity, along withpreviously published data from dynamic element tests, theimportance of particle type and particle contact responsewas examined in terms of the changes in void ratio for agiven change in p'. The more brittle in nature particle-contact response of weaker particles, such as volcanic soils,led to more pronounced changes in void ratio, and thus,changes in fabric with an increase in p', which in turnaffected the G0–p' relationship.
3. Material damping constants were more scattered and theeffect of grading or the preparation method on Ds0 was notclear. For the range of isotropic effective stresses in thisstudy, small-strain material damping was generally found to
be less than unity in magnitude, with a slight decrease withan increase in p'.
4. The developed equations of this research work may bedirectly used to model the behavior of potential fill–backfillmaterials which may find many applications in geotechnicalengineering practice. These formulae may be more applic-able to granular soils of very high angularity and very lowsphericity. However, it is believed that further laboratoryand theoretical research, by means of numerical simulationsof granular assemblies, is necessary in order to examinesome observed trends of this work. For example, the effectof the sample preparation method and its link to themagnitude and the distribution of particle contact forces,attenuation at the contacts of the soil particles and its link tothe macro-scale observed material damping, or, the effectsof particle shape and morphology in the energy dissipationmechanisms and stiffness of particulate media, need to beinvestigated.
Acknowledgments
The authors would like to thank the anonymous reviewersfor their constructive comments and their detailed suggestionswhich helped us to improve the quality of the paper.
References
ASTM, 1992. Standard test methods for modulus and damping of soils by theresonant column method: D4015-92, Annual Book of ASTM Standards.ASTM International.
ASTM, 2000a. Standard practice for classification of soils for engineeringpurposes (Unified Soil Classification System): D2487-00, Annual Book ofASTM Standards. ASTM International.
ASTM, 2000b. Standard test methods for minimum index density and unitweight of soils and calculation of relative density: D4254-00, Annual Bookof ASTM Standards. ASTM International.
ASTM, 2000c. Standard test methods for maximum index density and unitweight of soils using a vibratory table: D4253-00, Annual Book of ASTMStandards. ASTM International.
ASTM, 2002. Standard test methods for specific gravity of soil solids by waterpycnometer: D854-02, Annual Book of ASTM Standards. ASTMInternational.
Barreto, D., O' Sullivan, C., 2012. The influence of inter-particle friction andthe intermediate stress ratio on soil response under generalised stressconditions. Granul. Matter 14, 505–521.
Cascante, G., Santamarina, C., 1996. Interparticle contact behavior and wavepropagation. J. Geotech. Geoenviron. Eng. 122, 831–839.
Cascante, G., Santamarina, C., Yassir, N., 1998. Flexural excitation in astandard torsional-resonant column. Can. Geotech. J. 35, 478–490.
Cavarretta, I., Coop, M.R., O' Sullivan, C., 2010. The influence of particlecharacteristics on the behavior of coarse grained soils. Geotechnique 60(6), 413–423.
Cho, G.-C., Dodds, J., Santamarina, C., 2006. Particle shape on packingdensity, stiffness, and strength. J. Geotech. Geoenviron. Eng. 132,591–602.
Chung, R., Yokel, F., Drnevich, V., 1984. Evaluation of dynamic properties ofsands by resonant column testing. Geotech. Test. J. 7 (2), 60–69.
Cole, D.M., Peters, J.F., 2007. A physically based approach to granular mediamechanics: grain-scale experiments, initial results and impications tonumerical modeling. Granul. Matter 9, 309–321.
Cole, D.M., Peters, J.F., 2008. Grain-scale mechanics of geologic materials andlunar simulants under normal loading. Granul. Matter 10, 171–185.
Fig. 16. Measured against estimated material damping.
K. Senetakis, B.N. Madhusudhan / Soils and Foundations 55 (2015) 1196–1210 1209

Cole, D.M., Mathisen, L.U., Hopkinks, M.A., Knapp, B.R., 2010. Normal andsliding contact experiments on gneiss. Granul. Matter 12, 69–86.
Drnevich, V., 1967. Effects of Strain History on the Dynamic Properties ofSand (Ph.D. Dissertation). University of Michigan.
Goto, S., Syamoto, Y., Tamaoki, S., 1987. Dynamics properties of undisturbedgravel samples obtained by the in situ freezing method. In: Proceedingsofthe 8th Asian Regional Conference on Soil Mechanics and FoundationEngineering. Kyoto.
Hardin, B.O., Richart, F.E., 1963. Elastic wave velocities in granular soils. J.Soil Mech. Found. Div. 89, 33–65.
Hardin, B., 1978. The nature of stress strain behaviour of soil. In: Proceedingsof the Geotechnical Division Speciality Conference on EarthquakeEngineering and Soil Dynamics. ASCE, Pasadena, CA, vol. 1, pp. 3–90.
Huang, X., Hanley, K.J., O’Sullivan, C., Kwok, C.Y., 2014. Exploring theinfluence of interparticle friction on critical state behaviour using DEM. Int.J. Numer. Anal. Methods Geomech. 38, 1276–1297.
Jamiolkowski, M., Leroueil, S., Lo Priesti, D., 1991. Design parameters fromtheory to practice. In: Proceedingsof the International Conference onGeotechnical Engineering for Coastal Development: Geo-Coast 1991.Coastal Development Institute of Technology, Yokohama, Japan, pp.877–917.
Jovicic, V., Coop, M.R., 1997. Stiffness of coarse-grained soils at small strains.Geotechnique 47 (3), 545–561.
Kokusho, T., 1980. Cyclic triaxial test of dynamic soil properties for widestrain range. Soils Found. 20 (2), 45–60.
Krumbein, W., Sloss, L., 1963. Stratigraphy and Sedimentation. W.H. Freemanand Company, San Francisco.
Kumar, J., Madhusudhan, B.N., 2010. Effect of relative density and confiningpressure on Poisson ratio from bender and extender elements. Geotechni-que 60 (7), 630–634.
Kumar, J., Madhusudhan, B.N., 2012. Dynamic properties of sand from dry tofully saturated states. Geotechnique 62 (1), 45–55.
Madhusudhan, B.N., 2011. Dynamic Properties of Dry to Fully SaturatedStates Using Resonant Column and Bender Element Tests (Ph.D. Dis-sertation). Indian Institute of Science, Bangalore, India.
Menq, F.-Y., 2003. Dynamic Properties of Sandy and Gravelly Soils (Ph.D.Dissertation). University of Texas at Austin, Austin, TX, USA.
Menq, F.-Y., Stokoe, K., 2003. Linear dynamic properties of sandy andgravelly soils from large-scale resonant tests. In: Di Benedetto, H., Doanh,T., Geoffroy, H., Sauzeat, C. (Eds.), Deformation Characteristics ofGeomaterials. Swets and Zeitlinger, Lisse, pp. 63–71.
Radjai, F., Wolf, D., Jean, M., Moreau, J.-J., 1998. Bimodal character of stresstransmission in granular packing. Phys. Rev. Lett. 80 (1), 61–64.
Radjai, F., Wolf, D., 1998. Features of static pressure in dense granular media.Granul. Matter 1, 3–8.
Richart, F.E., Hall, J.R., Woods, R.D., 1970. Vibrations of Soils andFoundations. Prentice Hall, Englewood Cliffs, 414.
Rothenburg, L., Bathurst, R.J., 1989. Analytical study of induced anisotropy inidealized granular material. Geotechnique 39 (4), 601–614.
Sadd, M.H., Tai, Q.M., Shukla, A., 1993. Contact law effects on wavepropagation in particulate materials using distinct element modeling. Int. J.Non-Linear Mech. 28 (2), 251–265.
Sadd, M.H., Adhikari, G., Cardoso, F., 2000. DEM simulation of wavepropagation in granular materials. Powder Technol. 109, 222–233.
Santamarina, C., Cascante, G., 1996. Stress anisotropy and wave propagation:a micromechanical view. Can. Geotech. J. 33, 770–782.
Santamarina, C., Cascante, G., 1998. Effect of surface roughness on wavepropagation parameters. Geotechnique 48 (1), 129–136.
Santamarina, C., Klein, K., Fam, M., 2001. Soils and Waves. John Wiley andSons, New York.
Sazzad, Md.M., Suzuki, K., 2011. Effect of interparticle friction on the cyclicbehavior of granular materials using 2D DEM. J. Geotech. Geoenviron.Eng. 137 (5), 545–549.
Senetakis, K., 2011. Dynamic Properties of Granular Soils and Mixtures ofTypical Sands and Gravels with Recycled Synthetic Materials (Ph.D.dissertation). Department of Civil Engineering: Aristotle University ofThessaloniki, Greece (in Greek).
Senetakis, K., Anastasiadis, A., Pitilakis, K., 2012. The small-strain shearmodulus and damping ratio of quartz and volcanic sands. Geotech. Test. J.35 (6)http://dx.doi.org/10.1520/GTJ20120073.
Senetakis, K., Anastasiadis, A., Pitilakis, K., 2013a. Normalized shear modulusreduction and damping ratio curves of quartz sand and rhyolitic crushedrock. Soils Found. 53 (6), 879–893.
Senetakis, K., Anastasiadis, A., Pitilakis, K., Coop, M., 2013b. The dynamicsof a pumice granular soil in dry state under isotropic resonant columntesting. Soil Dyn. Earthq. Eng. 45, 70–79.
Senetakis, K., Coop, M., Todisco, M.C., 2013c. The tangential load-deflectionbehaviour at the contacts of soil particles. Geotechnique Lett. 3 (2), 59–66.
Senetakis, K., Coop, M., Todisco, M.C., 2013d. The inter-particle coefficientof friction at the contacts of Leighton Buzzard sand quartz minerals. SoilsFound. 53 (5), 746–755.
Senetakis, K., Coop, M.R., 2014. The development of a new micro-mechanicalinter-particle loading apparatus. Geotech. Test. J. 37 (6), 1028–1039.
Senetakis, K., Coop, M.R., 2015. Micro-mechanical experimental investigationof grain-to-grain sliding stiffness of quartz minerals. Exp. Mech. 55 (6),1187–1190. http://dx.doi.org/10.1007/s11340-015-0006-4.
Senetakis, K., Anastasiadis, A., Pitilakis, K., 2015. A comparison of materialdamping measurements in resonant column using the steady-state and free-vibration decay methods. Soil Dyn. Earthq. Eng. 74, 10–13.
Tanaka, Y., Kudo, K., Yoshida, Y., Ikemi, M., 1987. A Study on theMechanical Properties of Sandy Gravel-dynamic Properties of Reconsti-tuted Sample (Report U87019). Central Research Institute of ElectricPower Industry (in Japanese).
Wichtmann, T., Triantafyllidis, T., 2009. On the influence of the grain sizedistribution curve of quartz sand on the small strain shear modulus Gmax. J.Geotech. Geoenviron. Eng. 135 (10), 1404–1418.
Yoshimine, M., Ishihara, K., Vargas, W., 1998. Effects of principal stressdirection and intermediate principal stress on undrained shear behavior ofsand. Soils Found. 38 (3), 179–188.
K. Senetakis, B.N. Madhusudhan / Soils and Foundations 55 (2015) 1196–12101210