
Dynamics of explosive degassing of magma: Observations of ...
14
JOURNAL OF GEOPHYSICAL RESEARCH, VOL. 101, NO. B3, PAGES 5547-5560, MARCH 10, 1996 Dynamics of explosive degassing of magma: Observations of fragmenting two-phase flows H. M. Mader, J.C. Phillips and R. S.J.Sparks Department of Geology, University of Bristol, Bristol, England B. Smrtevant Graduate Aeronautical Laboratories, California Institute ofTechnology, Pasadena Abstract. Liquid explosions, generated by rapid degassing of strongly supersaturated liquids, have been investigated inthe laboratory with a view to understanding the basic physical laX•sses operating during bubble nucleation and growth and the subsequent behavior ofthe expanding two-phase flow. Experimenkq are carried out inashock tube and ,me monitored by high-speed photography and pressure trm•sducers. Theoretical CO2 supersaturations up to 455 times the ambient saturation concentration ,are generated by a chemical reaction; K2CO3 solution issuddenly injected into an excess of HC1 solution insuch a way as to mix the two solutions rapidly. Immediately after file injection event, a bubble nucleation delay ofa few milliseconds isfollowed by rapid nucleation ,mid explosive expmlsion ofCO2 bubbles forming a highly heterogeneous foam. Enhanced diffusion due toadvection in the 11ow coupled with continuous mixing of tile reactants, and hence on-going bubble nucleation after injection, generates an increasingly accelerating flow until the reactants become depleted atpeak accelerations ofaround 150 gand velocities ofabout 15 ms -•. Stretching ofthe accelerating two-phase mixture enhances the mixing. Liberation ofCO2 vapor is spatially inhomogeneous leading toductile fragmentation occurring throughout the flow in regions of greatest gas release astheconsequence of thecollision and stretching of lluid streams. Tile violence of the eruptions iscontrolled by using different concentrations of tileHCI and K2CO 3 solutions, which alters the CO2 supersaturation and yield and also file efficiency of the mixing process. Peak acceleration is proportional to theoretical supersaturation. Pressure tneasurements at the base of the shock tube show aninitial nucleation delay and a pressure pulse related tothe onset ofexplosive bubble fortnation. These chemically induced explosions differ t¾om liquid explosions created in other experiments. In explosions caused by sudden depressurization of C02-saturated water, the bubbles nucleate uniformly fl•roughout the liquid in a single nucleation event. Subsequent bubble growth causes the two-phase mixture to beaccelerated upward atnearly constant accelerations. Explosively boiling liquids, in which heterogeneous nucleation is suppressed, experience anevaporation wave which propagates down intothe liquid column at constant average velocity. Fragtnentation occurs at the shin'ply dellned leading edge of the wavefront. Thechemical flows effectively simulate highly explosive volcanic eruptions as they arecomparable in terms of flow densities, velocities, accelerations, and inthe large range of scales present. The lm'ge accelm,'ations cause su'ong extensional strain and longitudinal deformation. Comparable delbrmation rates in volcanic systems could be sufficient toapproach conditions forbrittle l•,tgmentation. Tube pumice isa major component of plinian deposits and ignimbrites and preserves evidence of accelerating llowconditions. Introduction The flow conditions that occur in explosive volcanic eruptions are known tobeextreme. High-viscosity magma containing small mounts of dissolved gas becomes strongly supersaturated on approaching the Earth's surface. Gas bubbles nucleate andgrow explosively and the magma disintegrates into a two-phase mixture ofgas and pyroclasts that accelerates to velocities of order of a few hundred meters per second along volcanic conduits [Wilson etal., 1980; Dobran, !992]. Thetimescales for these processes Copyright !996 by fl•e American Geophysical Union. Paper number 95JB02515. 0!48.1227/96/95JB.025 [5505.00 are veryshort. For example, in theplinian eruption of Mount St. Helens on May 18, 1980, estimates of chamber depth, magma discharge rates, conduit dimensions and volatile contents [Carey et al., 1990] constrainthe time that it takes for an individual parcel of magma to movefrom the chamber to the Earth's surface as about !0 min.Due topressure variations most bubble growth is confined to the uppermost parts of the magmacolumn so the timescale for explosive degassing must be substantially less. Estimates from modeling studies [e.g., Kief[kr, 198!; Dobran, 1992; Proussevitch et al., !993; Sparks et aL, 1994]suggest that timescales for prefragmentation bubble growth in p!inian eruptions areof order !0 to I00 s. Explosive volcanic flows areunlikely to beobserved directly. Therefore the processes involvedcan only be studied by theoretical modeling, simulation in ana!ogue experiments, or 5547
Transcript of Dynamics of explosive degassing of magma: Observations of ...

JOURNAL OF GEOPHYSICAL RESEARCH, VOL. 101, NO. B3, PAGES 5547-5560, MARCH 10, 1996
Dynamics of explosive degassing of magma: Observations of fragmenting two-phase flows
H. M. Mader, J. C. Phillips and R. S. J. Sparks Department of Geology, University of Bristol, Bristol, England
B. Smrtevant
Graduate Aeronautical Laboratories, California Institute of Technology, Pasadena
Abstract. Liquid explosions, generated by rapid degassing of strongly supersaturated liquids, have been investigated in the laboratory with a view to understanding the basic physical laX•sses operating during bubble nucleation and growth and the subsequent behavior of the expanding two-phase flow. Experimenkq are carried out in a shock tube and ,me monitored by high-speed photography and pressure trm•sducers. Theoretical CO2 supersaturations up to 455 times the ambient saturation concentration ,are generated by a chemical reaction; K2CO3 solution is suddenly injected into an excess of HC1 solution in such a way as to mix the two solutions rapidly. Immediately after file injection event, a bubble nucleation delay of a few milliseconds is followed by rapid nucleation ,mid explosive expmlsion of CO2 bubbles forming a highly heterogeneous foam. Enhanced diffusion due to advection in the 11ow coupled with continuous mixing of tile reactants, and hence on-going bubble nucleation after injection, generates an increasingly accelerating flow until the reactants become depleted at peak accelerations of around 150 g and velocities of about 15 m s -•. Stretching of the accelerating two-phase mixture enhances the mixing. Liberation of CO2 vapor is spatially inhomogeneous leading to ductile fragmentation occurring throughout the flow in regions of greatest gas release as the consequence of the collision and stretching of lluid streams. Tile violence of the eruptions is controlled by using different concentrations of tile HCI and K2CO 3 solutions, which alters the CO2 supersaturation and yield and also file efficiency of the mixing process. Peak acceleration is proportional to theoretical supersaturation. Pressure tneasurements at the base of the shock tube show an initial nucleation delay and a pressure pulse related to the onset of explosive bubble fortnation. These chemically induced explosions differ t¾om liquid explosions created in other experiments. In explosions caused by sudden depressurization of C02-saturated water, the bubbles nucleate uniformly fl•roughout the liquid in a single nucleation event. Subsequent bubble growth causes the two-phase mixture to be accelerated upward at nearly constant accelerations. Explosively boiling liquids, in which heterogeneous nucleation is suppressed, experience an evaporation wave which propagates down into the liquid column at constant average velocity. Fragtnentation occurs at the shin'ply dellned leading edge of the wavefront. The chemical flows effectively simulate highly explosive volcanic eruptions as they are comparable in terms of flow densities, velocities, accelerations, and in the large range of scales present. The lm'ge accelm,'ations cause su'ong extensional strain and longitudinal deformation. Comparable delbrmation rates in volcanic systems could be sufficient to approach conditions for brittle l•,tgmentation. Tube pumice is a major component of plinian deposits and ignimbrites and preserves evidence of accelerating llow conditions.
Introduction
The flow conditions that occur in explosive volcanic eruptions are known to be extreme. High-viscosity magma containing small mounts of dissolved gas becomes strongly supersaturated on approaching the Earth's surface. Gas bubbles nucleate and grow explosively and the magma disintegrates into a two-phase mixture of gas and pyroclasts that accelerates to velocities of order of a few hundred meters per second along volcanic conduits [Wilson et al., 1980; Dobran, !992]. The timescales for these processes
Copyright !996 by fl•e American Geophysical Union. Paper number 95JB02515. 0!48.1227/96/95JB.025 [5505.00
are very short. For example, in the plinian eruption of Mount St. Helens on May 18, 1980, estimates of chamber depth, magma discharge rates, conduit dimensions and volatile contents [ Carey et al., 1990] constrain the time that it takes for an individual parcel of magma to move from the chamber to the Earth's surface as about !0 min. Due to pressure variations most bubble growth is confined to the uppermost parts of the magma column so the timescale for explosive degassing must be substantially less. Estimates from modeling studies [e.g., Kief[kr, 198!; Dobran, 1992; Proussevitch et al., !993; Sparks et aL, 1994] suggest that timescales for prefragmentation bubble growth in p!inian eruptions are of order !0 to I00 s.
Explosive volcanic flows are unlikely to be observed directly. Therefore the processes involved can only be studied by theoretical modeling, simulation in ana!ogue experiments, or
5547

5548 MADER ET AL.: FRAGMENTING 'IWO-PI IASE FI.OWS
examination of the geological record. All three approaches have their merits and limitations. Computer simulations [e.g., Sparks, 1978; Dobran, 1992; Proussevitch et aL, 1993] cannot yet take into account the very wide range of scales and interacting processes that characterize volcanic flows and are thus requh'ed to make approximations which preclude them fi'om recognizing the full richness of the physical phenomena that occur. Experhnental studies in analogue systems can identify complex phenomena that are as yet beyond the capacity for numerical simulation. Experimental simulations of high-speed flows have already provided new insights into explosive volcanism through the study of overpressured jets [Kieffer and Stunevant, 1984], valx•rization of superheated liquids [Hill and Sturtevant, 1990], and the decompression of two-phase solid-gas beds [Anilkumar et al., 1993]. However, there remain important problems of scaling laboratory experiments to the large-scale natural flows, particularly in high-speed two-phase flows where scaling laws are not well established. Both experimental and theoretical simulations provide the underlying conceptual framework for interpretation of observations. Geological data and observations provide the motivation and constraints for developing theory and choosing useful experimental analogues to study.
This paper describes experhnents on the behavior of strongly supersaturated aqueous solutions fortned by chemical reaction due to mixing reactant fluids in a shock tube. In the experiments,
I I 100 •
TC
P J.N$
PIS•
YL
Figure 1. (a) Scale drawing of the experimental apparatus (b) Photograph of the injector (INJ) sited in the empty test cell (TC).
Figure 1. (continued)
concentrated solutions of K2CO 3 and IIC1 me mixed rapidl) together by a computer-controlled injection system. Mixing occurs within a few milliseconds via 96 turbulent .jets. Large volumes of CO 2 m'e formed as a result of the reaction and the exsolves explosively to create a high-speed flow in the shock tube. The flows are monitored by high-speed photography and pressure transducers. Concenu'ations of CO 2 up to 455 times the ambient saturation concentration can be developed. This system was first used by Turner et al. [1983] to simulate volcanic degassing processes. The experiments colnplcment studies of the decompression of CO2-satm-ated aqueous solutions in shock tubes investigated at the California Institute of Technology [Mader ct al., 1994]. The chemical reaction experiments described here can create significantly larger supersaturations and stronger flows than this other set of experhnents and can investigate the effects of mixing fluids together. The effect of gas evolution in a mixing- limited system is important in volcanology as observations of mixed magmas containing several components with different chemical compositions is commonplace in volcanic deposits. It has been suggested that mixing of this sort could trigger explosbe eruptions [Sparks et al., 1977].
The paper first describes the experimental method and apparatus. Typical flows are described and data on velocities, accelerations, and pressure fluctuations are presented. Thc experimental results are discussed in terms of the expansion of a two-phase fluid under explosive conditions for bubble nucleation and growth and the chemical and physical mechanisms of CO2 production in the experiments. The scaling of the experi•nents to volcanic flows and the implications for explosive eruption processes are then discussed.
MADER ET AL.: FRAGMENTING 'IWO-Pt IASE FI.OWS 5549
drain
TC
carbonate in
t;IS
SOL1
CYL1
analog inputs
SOL2 air in
CYL2 a. ir
digital exhaust
REL2
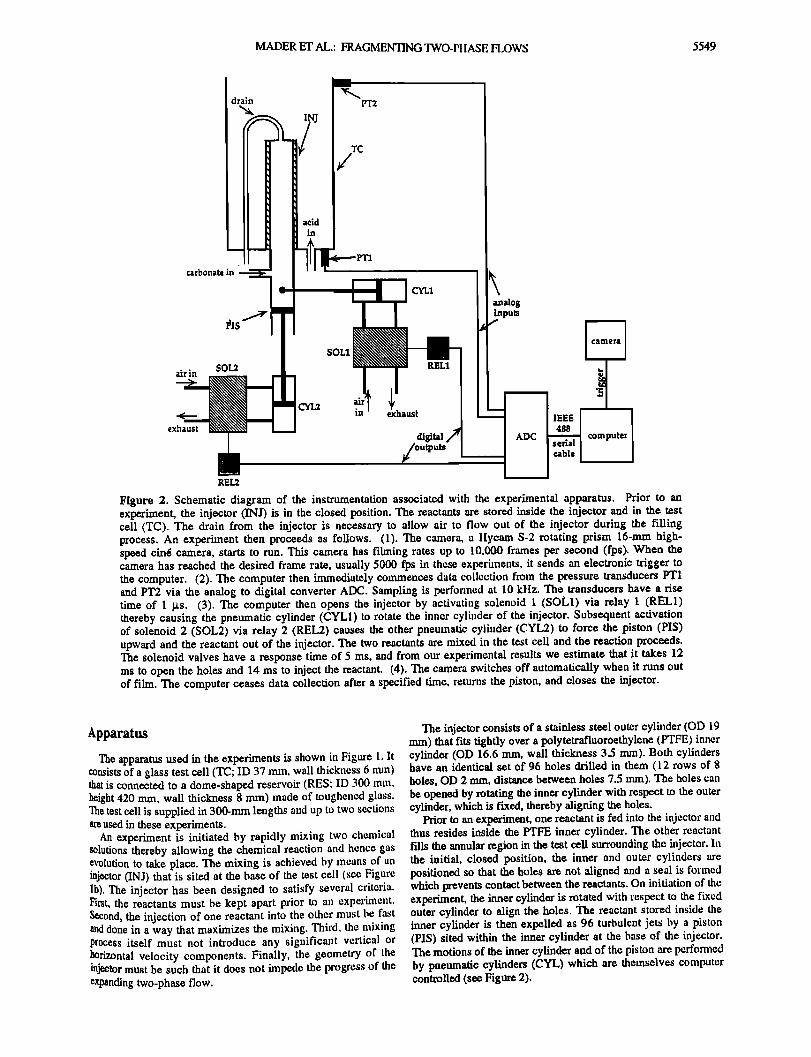
Figure 2. Schematic diagram of the instrumentation associated with the experimental apparatus. Prior to an experiment, the injector (iNJ) is in the closed position. The reactants are stored inside the injector and in the t•st cell (TC). The drain from the injector is necessary to allow air to flow out of the injector during the filling process. An experiment then proceeds as follows. (1). The camera, a flycam S-2 rotating prism 16-mm high- speed cin• camera, starts to run. This calnera has fihning rates up to 10,000 frames per second (fps). When the camera has reached the desired frame rate, usually 5000 fps in these experiments, it sends an electronic trigger to the computer. (2). The computer then iimnediately colmnence, s data collection fi'om the pressure transducers PT1 and PT2 via the analog to digital converter ADC. Sampling is performed at 10 kHz. The transducers have a rise time of 1 gs. (3). The computer then opens the injector by activating solenoid 1 (soL1) via relay 1 (REL1) thereby causing the pneumatic cylinder (CYL1) to rotate the inner cylinder of the injector. Subsequent activation of solenoid 2 (SOL2) via relay 2 (REL2) causes the other pneumatic cylinder (CYL2) to force the piston (PIS) upward and the reactant out of the injector. The two reactants are mixed in the test cell and the reaction proceeds. The solenoid valves have a response time of 5 ms, and from our experimental results we estimate that it takes !2 ms to open the holes and 14 ms to inject the reactant. (4). The camera switches off automatically when it runs out of film. The computer ceases data collection after a specified time, returns the piston, and closes the injector.
Apparatus
The apparatus used in the experiments is shown in Figure 1. It consists of a glass test ½ell (TC; ID 37 ram, wall thickness 6 ram) •hat is connected to a dome-shaped reservoff (RES; ID 300 height 420 ram, wall thickness 8 •mn) made of toughened glass. The test cell is supplied in 300-ram lengths and up to two sections are used in these experiments.
An experiment is initiated by rapidly mixing two chemical solutions thereby allowing the chemical reaction and hence gas evolution to take place. The mixing is achieved by m•ans of an injector (INJ) that is sited at the base of the test cell (see Figure lb). The injector has been designed to satisfy several criteria. First, the reactants must be kept apart prior to an experiment. S•½ond, the injection of one reactant into the other must be fast and done in a way that maximizes the mixing. Third, the mixing process itself must not introduce any significant vertical or horizontal velocity components. Finally, the geometry of the injector must be such that it does not impede the progress of the expanding two-phase flow.
The injector consists of a stainless steel outer cylinder (OD 19 ram) that fits tightly over a polytetrafluoroethylene (PTFE) inner cylinder (OD !6.6 mm, wall thickness 3.5 nun). Both cylinders have an identical set of 96 holes drilled in them (12 rows of 8 holes, OD 2 nun, distance between holes 7.5 lmu). The holes can be opened by rotating the inner cylinder with respect to the outer cylinder, which is fixed, thereby aligning the holes.
Prior to an experiment, one reactant is fed into the injector and thus resides inside the PTFE inner cylinder. The other reactant fills the annular region in the test cell surrounding the injector. In the initial, closed position, the inner and outer cylinders are positioned so that the holes are not aligned and a seal is formed which prevents contact between the reactants. On initiation of the experiment, the inner cylinder is rotated with respect to the fixed outer cylinder to align the holes. The reactant stored inside the inner cylinder is then expelled as 96 turbulent jets by a piston (P!S) sited within the inner cylinder at the base of the injector. The motions of the inner cylinder and of the piston are perfonned by pneumatic cylinders (CYL) which are themselves computer controlled (see Figure 2).
5550 MADER ET AL.: FRAGMENTING TWO-PHASE FLOWS
LS2
CAM
: 100mm
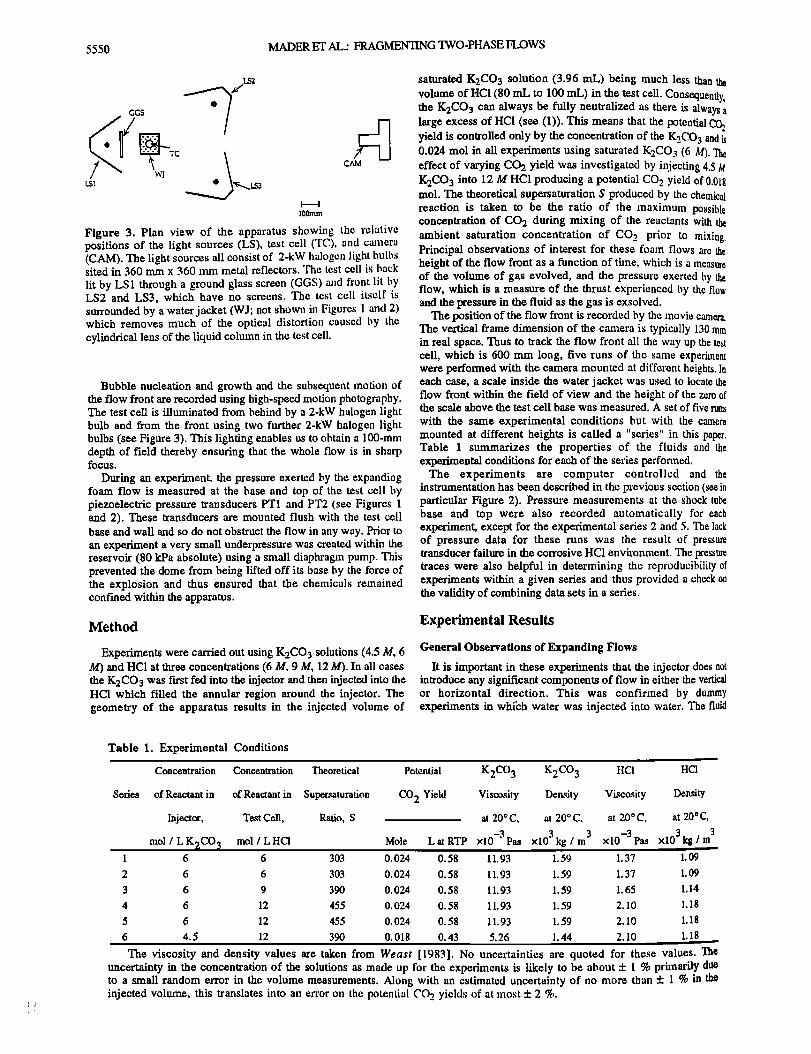
Figure 3. Plan view of the apparatus showing the relative positions of the light sources (LS), test cell (TC), and camera (CAM). The light sources all consist of 2-kW halogen light bulbs sited in 360 mmx 360 nm• metal reflectors. The test cell is back lit by LS1 through a ground glass screen (GGS) and fi'ont lit by LS2 and LS3, which have no screens. The test cell itself is surrounded by a water jacket (WJ; not shown in Figures 1 and 2) which removes much of the optical distortion caused by the cylindrical lens of the liquid column in the test cell.
Bubble nucleation and growth and the subsequent motion of the flow front are recorded using high-speed motion photography. The test cell is illuminated from behind by a 2-kW halogen light bulb and from the front using two further 2-kW halogen light bulbs (see Figure 3). This lighting enables us to obtain a 100qmn depth of field thereby ensuring that the whole flow is in sharp focus.
During an experiment, the pressure exerted by the expanding foam flow is measured at the base and top of the test cell by piezoelectric pressure transducers PT1 and PT2 (see Figures 1 and 2). These transducers are mounted flush with the test cell base and wall and so do not obstruct the flow in any way. Prior to an experiment a very small underpressure was created within the reservoir (80 kPa absolute) using a small diaphragm pump. This prevented the dome from being lifted off its base by the lbrce of the explosion and thus ensured that the chemicals remained confined within the apparatus.
Method
Experiments were carried out using K2CO 3 solutions (4.5 M, 6 M) and HC1 at three concentrations (6 M, 9 M, 12 M). In all cases the K2CO3 was first fed into the injector and then injected into the HCI which filled the annular region around the injector. The geometry of the apparatus results in the injected volume of
saturated K2CO3 solution (3.96 mL) being much less than the volume of HCI (80 mL to 100 mL) in the test cell. Consequently, the K2CO 3 can always be fully neutralized as there is always a large excess of HCI (see (1)). This means that the potential C• yield is controlled only by the concentration of the K2CO 3 and is 0.024 tool in all experiments using saturated K2CO 3 (6 M). The effect of varying CO2 yield was investigated by injecting 4.5 M K2CO 3 into 12 M HC1 producing a potential CO 2 yield of 0.018 tool. The theoretical supersaturation S produced by the chemical reaction is taken to be the ratio of the maximum possible concentration of CO2 during mixing of the reactants with the ambient saturation concentration of CO•_ prior to mixing. Principal observations of interest for these foam flows are the height of the flow front as a function of time, which is a measure of the volume of gas evolved, and the pressure exerted by the flow, which is a measure of the thrust experienced by the flow and the pressure in the fluid as the gas is exsolved.
The position of the flow h'ont is recorded by the movie cronera. The vertical frame dimension of the camera is typically 130 mm in real space. Thus to track the flow fi-ont all the way up the test cell, which is 600 mm long, five rutas of the same experhnent were performed with the camera mounted at different heights. in each case, a scale inside the water jacket was used to locate the flow front within the field of view and the height of the zero of the scale above the test cell base was measured. A set of five runs
with the same experimental conditions but with the camera mounted at different heights is called a "series" in this paper. Table 1 summarizes the properties of the fluids and the experimental conditions for each of the series performed.
The experiments are computer controlled and the instrumentation has been described in the previous section (see in particular Figure 2). Pressure measurements at the shock tube base and top were also recorded automatically for each experiment, except for the experimental series 2 and 5. The lack of pressure data for these runs was the result of pressure transducer failure in the con'osive HC1 envkonment. The pressure traces were also helpful in determining the reproducibility of experiments within a given series and thus provided a check on the validity of combining data sets in a series.
Experimental Results
General Observations of Expanding Flows
It is important in these experiments that the injector does not introduce any significant components of flow in either the vertical or horizontal direction. This was confirmed by dummy experiments in whii:h water was injected into water. The fluid
Table 1. Experimental Conditions
Concentration Concentration Theoretical Potential
Series of Reactant in of Reactant in Supersaturation CO 2 Yield
Injector, Test Cell, Ratio, S
mol / L KgCO• tool / L HCI Mole ,
'1 '' 6 6 ................. 303 .... 6.'"024 2 6 6 303 0.024
3 6 9 390 0.024
4 6 12 455 0.024
5 6 12 455 0.024
K2CO 3 K2CO 3 HCI HCI
Viscosity Density Viscosity Density
at 20 ø C, at 20 ø C, at 20 ø C, at 20 ø C, 3 3 LatRTP x10-3pas x103kg/m x10-3pas x103kg/m
0.58 .... 11.93 1.59 1.37 1.09 0.58 11.93 1.59 1.37 1.09
0.58 11.93 1.59 1.65 1.14
0.58 11.93 !.59 2.10 1.18 0.58 11.93 1.59 2.10 1.18
6 4.5 12 390 0.018 0.43 5.26 1.44 2.10 1.18
' The viscosity and density values are taken from Weast [1983]. No uncertainties are quoted for these values. The uncertainty in the concentration of the solutions as made up for the experiments is likely to be about :!: 1% prhnarily du• to a small random error in the volume measurements. Along with an estimated uncertainty of no more than :t: 1% in the injected volume, this translates into an error on the potential ('0 2 yields of at most + 2 %.
MADER ET AL.: FRAGMENTING rl•'O-Pl IASE 1"I OWS 5551
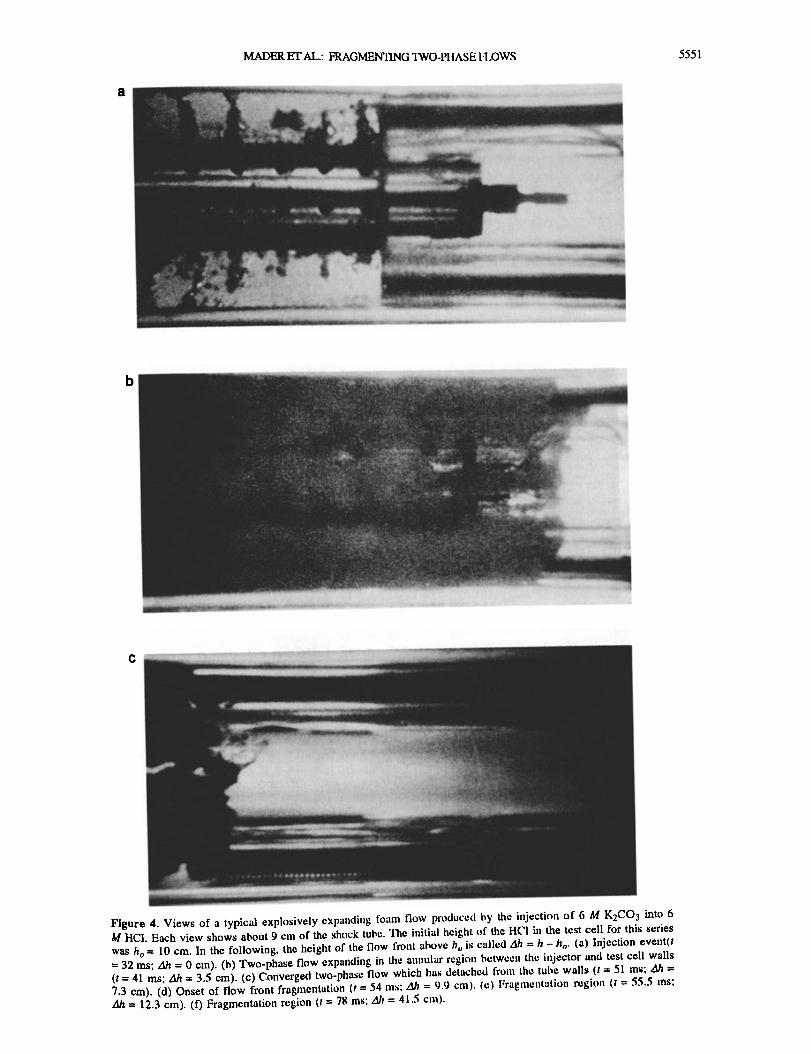
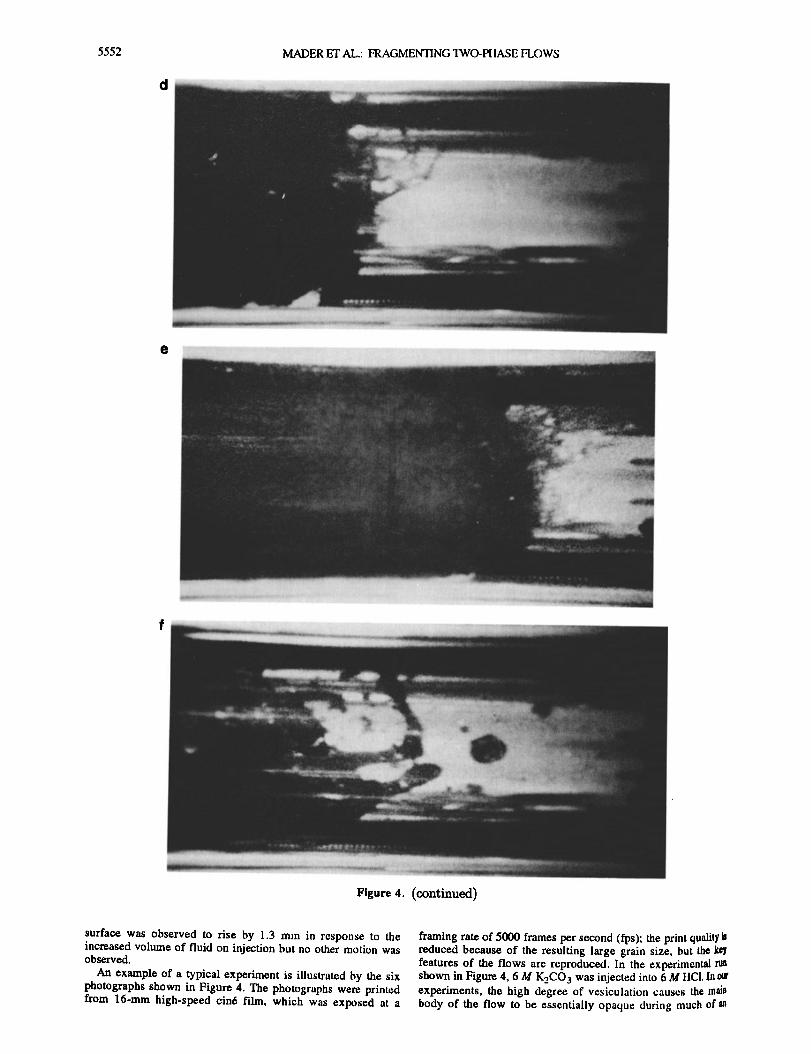
Figure 4. Views of a typical explosively expanding foam flow produced by the injectitm t•f 6 M K2CO3 into 6 M IIC1. Each view shows about 9 cm of the shock tube. The initial height of the I ICI in the test cell ft•r this series was h o = 10 cm. In the following, the height t•f the flow front abt•,,c h,, is called Ah = h - It o. (a) Injection evcnt(t = 32 ms; Ah = 0 cm). (b) Two-phase flow expanding in the annular region between the injector and test cell walls (t = 41 ms; Ah = 3.5 cm). (c) Converged two-phase how which has detached fi'mn the tube walls (t = 51 ms; zlh = 7.3 cm). (d) Onset of flow h'ont fragmentatit•n (t = 54 ms; gh = 9.9 tin). (e) Fragmentati{m region {t = 55.5 •ns; Ah = 12.3 cm). (f) Fragmentation region (t = 78 ms: ,.lb = 41.5 cm).
5552 MADER ET AL.: FRAGMENTING TWO-PIIASE H.OWS
Figure 4. (continued)
surface was observed to rise by 1.3 mm in response to the increased volume of fluid on injection but no other motion was observed.
An example of a typical experiment is illustrated by the six photographs shown in Figure 4. The photographs were printed from 16-ram high-speed cin6 fihn, which was exposed at a
framing rate of 5000 frames per second (fps); the print quality is reduced because of the resulting large grain size, but the features of the flows are reproduced. In the experiinental run shown in Figure 4, 6 M K2CO 3 was injected into 6 M IICI. In our experiments, the high degree of vesiculation causes the main body of the flow to be essentially opaque during much of an

MADER ET AL.: FRAGMENTING TWO-PHASE FLOWS 5553
experiment. In this section we describe the processes occurring •Sng injection and at the head of the flow where clear features can be identified.
Figure 4a shows the injection of the K2CO 3 into the IICI. When the injector is in the closed position, the seal between the two reactants is not perfect. Small amounts of leakage can occur leading to the formation of a few individual bubbles in the test cell near the injector prior to an experiment. The time t = 0 is taken as the time when the internal cylinder is rotated to open the injector holes and is therefore the time when the reactants are first lXoperly in contact. This occurs 50 ms after the camera has reached the desired framing rate. The plunger, which performs the injection stroke, is activated t = 20 •ns later. Figure 4a was taken at t = 32 ms and shows clearly the formation of turbulent jets from the injector holes. The jets are well developed at the base but are only in the initial stages of development 3 cm up the injector. This is because the injection process takes 14 •ns from the first appearance of the jets at the base to full development of turbulent jets at the top of the injector. Bubble nucleation is seen to commence within the turbulent jets after a delay of a few milliseconds. Thus bubble nucleation is clearly subject to both temporal inhomogeneity, due to the variation of injection time along the injector, and spatial inhomogeneity, due to nucleation being restricted to the region of the jets.
Figure 4b shows the flow front at t = 41 ms and a height Ah = 3.5 cm above the initial position of the liquid-ah' interface. The initial stages of the motion of the flow are controlled by flow around the injector. The flow propagates in the annular region defined by the test cell walls and the edge of the injector and remains in this region after flowing past the injector for some distance. Mixing across the test cell diameter occurs when the fl0w front reaches a height of approxhnately zlh = 8 cln. It is not possible to determine exactly the point of convergence because the flows are essentially opaque due to the extremely finely bubbled texture of these foams. Individual bubbles cannot be
resolved in the initial stages of the flow. Figure 4c shows the flow front at t = 51 ms and zlh = 7.3 cm.
The initially annular flow has converged at the tube center to form a plug flow regime. Near the flow front, the foam is detached from the tube walls. The height where the flows first become detached from the tube walls depends on how violent the expansion is; the fastest flows detach as much as 7 cm lower down the tube than the slowest. The void space introduced by the detachment of the flow from the walls is a small fraction of the
total volume of the flow (at most 15%). The flow front in Figure 4(: is in the initial stages of fi'agmentation with foam ligaments (about 1 mm in length) extending ahead of the propagating flow giving the flow front a roughened appearance. These ligalnents first appear at the point of convergence and are thought to arise from the collision of the foam streams.
Figures 4d (t = 54 ms, zih = 9.9 cm) and 4e (t = 55.5 ms, Ah = 12.3 cm) show the fragmentation of the foam at the flow fi'ont. The foam ligaments expand with the flow to a length of typically 3 cm before fragmentation occurs. Initially, the fragmentation products at the flow head are shorter ligaments of approximately 0.5 cm in length which then form droplets of liquid and foam with diameters of a few millimeters. The visible fragmentation region extends over a height range of approximately 5 cm.
Figure 4f shows the flow front at t = 78 ms and zlJ• = 41.5 cm. The flow front is now fully fragmented and a wide range of fragment sizes is evident. In this experimental run we observed foam ligaments extending up to 5 cm in length prior to breaking •wn into foam globules (diameters of order 1 cm) and liquid droplets (diameters of order 0.1 cm). No clear h'agmentation front is visible. Fragmentation occurs over a diffuse region which hereased in length with time. Accurate determination of the location of the flow front is made difficult by the frag•nents moving ahead of the main body of the flow. The highest point at which the flow appears as fully opaque is taken to be the flow front. As fragmentation occurs in a region detached fi'om the test
cell walls, wall shear stress cannot lhnit the extension of the foam ligaments. Ongoing mixing of the two reactants leads to spatially and temporally nonuniform bubble nucleation and growth. The result is the highly heterogeneous flow and fragmentation seen here.
Position of the Flow Front With Tilne
Figure 5 shows the position of the flow front with thne for the six series specified in Table 1. The data for each experhnent were digitized by hand from the fihns. The exact thne of injection for each run was not always known as the injector was only in view for one run in a given series. A smooth composite plot was obtained by adjusting the zero of time for each run. This procedure was considered legitimate since an analysis of the
(50
E 40 o
.? •' 20
0
0
60
E 40- v
.? • 20
0
60
E 40
.?
• 20
20 40 Time t (ms)
o 20 Time t (ms)
,,.
•o
40
0 ................... 0 20 40 60
Time t (ms)
Figure 5. Position of the flow fi'ont versus time for the six series specified in Table 1. The height plotted here is the height h above the base plate. The different symbols denote data fi'om different views of the test cell. tteights are accurate to :!: I mm and thnes to 0.2 ms (1 frame). Thus the error bars are about the size of the
symbols and so are not shown. (a) Series 1' 6 M K2CO 3 --o6 M HC1. (b) Series 2:6 M K•CO3 --> 6 M IICI. (c) Series 3:6 M K2CO 3 --,9 M HC1. (d) Series 4:6 M K2CO 3 --> 12 M IICI. (e) Series 5:6 M K2CO 3 -4 12 M HCI. (f) Series 6:4.5 M K2CO.• -4 12 M ttCI.

5554 MADER ET AL.: FRAGMENTING TWO-PHASE FLOWS
60
E 40
._o., e 20
0
0
6O
E 40
._o,
•: 20
-j
6O
E 40
.?
i
Time t (ms)
i
4O 6O
0 , , 0 20 40 6o
Time
'j ,(f)
0 2o 4o 60 Time t (ms)
Figure 5. (continued)
pressure traces from the runs suggested that conditions m'e highly repeatable in most experin'tents (see Pressure Traces). I Iowever, an exception is evident in the composite plot of series 5 (Figure 5e). The first two runs of this series do not join smoothly. This suggests that conditions were not strictly repeatable during these particular runs resulting in a difference in the acceleration experienced by the flow. As series 5 is one of the two series for which we have no pressure la'aces, it is not possible to make a clear statement about exactly how the conditions varied. nor is it possible to say which zf the fix'st two runs deviates most fi'om the others in the series.
Figure 6 shows the data from Figure 5 replotted in log-log form. The series are grouped in pairs according to their theoretical supersaturation. All graphs have pronounced linear sections during the initial stages of the flow with slopes of 2.36 to 3.26. This means that the acceleration over these regions is increasing with time; a slope of 2 implies constant acceleration and a slope of 3 con'esponds to a linearly increasing acceleration.
The motion of the flow front is principally influenced by the CO 2 supersaturation. This is supported by the comparison of series 6 (injection of 4.5 M K2CO 3 into 12 M iIC1) and series 3 (injection of 6 M K2CO3 into 9 M HC1) which show similar flow front evolution (Figure 6b). These flows have different potential CO 2 yields but the same theoretical CO 2 supersaturation,
Velocity and Acceleration
The velocity of the flow front as a function of time and height is shown in Figure 7. These plots were generated by drawing a smooth curve, fitted by eye, through the raw height-versus-tit•
0.6
_
- o • (o)' 0.8 1.0 1.2 1.4 1.6 1.8
Ioõ•ot/rns
E 1 -
-1
0.6 0.8 1.0 1.2 1.4 1.6 1.8
log •ot/ms
'-6 (• 0- .9
1 .. ...... , , . •, ß . . . , .
0.6 0.8 1.0 1.2 1.4 1.6 1.8
Iog•ot/ms
Figure 6. Log•ithmic plots of the position of the flow fm•t versus time for the six series specified in Table 1. in each the two composite series with the same theoretical supersaturatio• pressure are displayed together. A least squares fit of the initial linear part of the data was made to the function h- ho = where h o is the initial height of the liquid in the test cell, with • following results: (a) Theoretical supersaturation: S = 303, wh•re crosses are series 1' 6 M K2CO 3 ----> 6 M HC1. A = 1.49x10⁻³, b = 2.69, h o = 10.1 cm (fit shown); diamonds are series 2:6 K2CO 3 ----> 6 M HCI. A = 2.10x10 -3, b = 2.56, h o = 13.! cm. Theoretical supersaturation; S = 390, where crosses are series 3: 6M K2CO 3 --> 9 M HC1. A = 1.20x10⁻², b = 2.44, ho= 10.0m (fit shown); diamonds are series 6:4.5 M K2CO 3 --> 12 M HC[A = 1.69x10⁻², b = 2.36, h o = 10.1 cm. (c) Theoretic,fl supersaturation; S = 455, where crosses are series 4:6 M K,•C0• • 12 M HC1. A = 1.07x10 -3, b = 3.26, ho=10.1 cm (fit shown); diamonds are series 5:6 M K2CO3 ---> 12 M HCI. A = 3.80xI '•:•. b = 2.68, ho=12.9 cm. A line of slope = 8/3 = 2.67 is also in each graph for comparison.
MADER ET AL.: FRAGMENTING TWO-PItASE I•OWS 5555
•' )•12M
i I ! i i
0 20 40 60 Time (ms)
(b)
1
20 40 Height (cm)
ß 12kl
•9M
o 6• ,
60
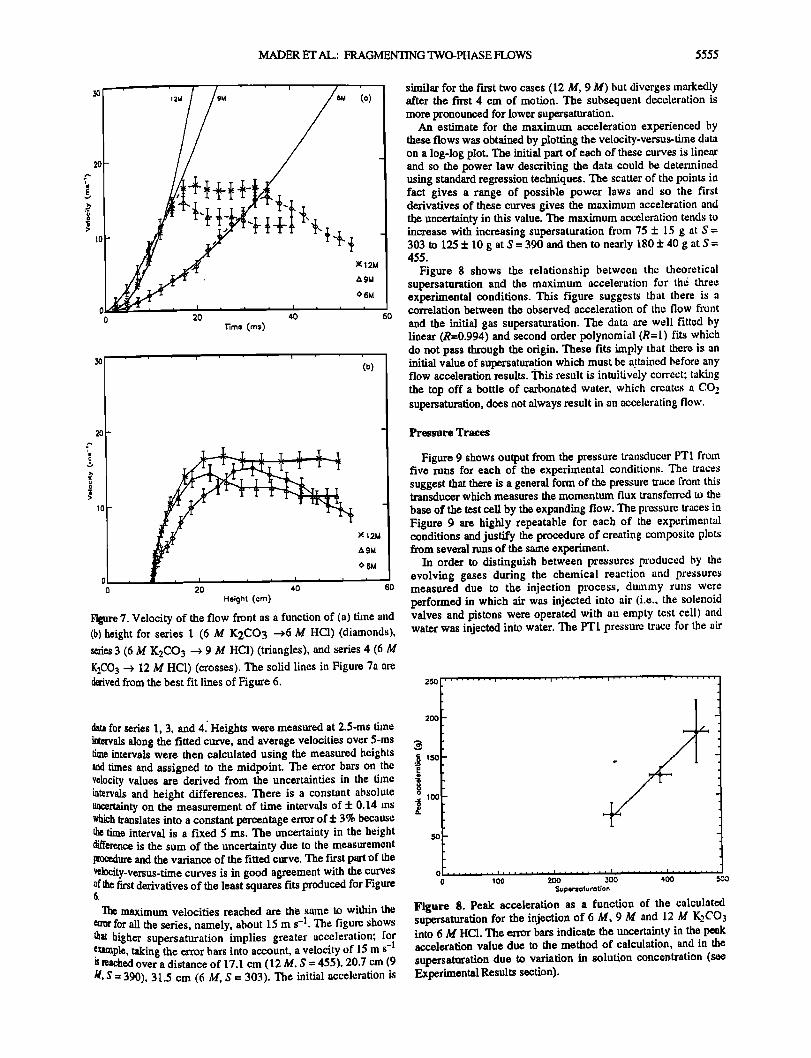
Figure 7. Velocity of the flow front as a function of (a) time and (b) height for series I (6 M K2CO3 -->6 M HC1) (diamonds), series 3 (6 M K2CO 3 ---> 9 M HC1) (triangles), and series 4 (6 M K2CO 3 --> 12 M HC1) (crosses). The solid lines in Figure 7a are derived from the best fit lines of Figure 6.
data for series !, 3, and 4[ Heights were measured at 2.5-ms time intervals along the fitted curve, and average velocities over 5-ms time intervals were then calculated using the measured heights and times and assigned to the midpoint. The error bars on the velocity values are derived from the uncertainties in the time intervals and height differences. There is a constant absolute uncertainty on the measurement of time intervals of :t: 0.14 ms which translates into a constant percentage en'or of + 3% because the time interval is a fixed 5 ms. The uncertainty in the height difference is the sum of the uncertainty due to the measurement procedure and the variance of the fitted curve. The first part of the velocity-versus-time curves is in good agreement with the curves of the first derivatives of the least squares fits produced for Figure 6.
Th, e maximum velocities reached are the same to within the error for all the series, namely, about 15 m s -1. The figure shows that higher supersaturation implies greater acceleration; for example, taking the error bars into account, a velocity of 15 m s -1 is reached over a distance of 17.1 cm (12 M, S = 455), 20.7 cm (9 M, $ = 390), 31.5 cm (6 M, S = 303). The initial acceleration is
similar for the first two cases (12 M, 9 M) but diverges ]narkedly after the first 4 cm of motion. The subsequent deceleration is more pronounced for lower supersaturation.
An estimate for the maximum acceleration experienced by these flows was obtained by plotting the velocity-versus-tune data on a log-log plot. The initial part of each of these curves is linear and so the power law describing the data could be determined using standard regression techniques. The scatter of the points in fact gives a range of possible power laws and so the first derivatives of these curves gives the maximum acceleration and the uncertainty in this value. The maxhnum acceleration tends to increase with increasing supersaturation fi'om 75 q- 15 g at S = 303 to 125 q- 10 g at S = 390 and then to nearly 180 q- 40 g at S = 455.
Figure 8 shows the relationship between the theoretical supersaturation and the maximran acceleration for the three experimental conditions. This figure suggests that there is a correlation between the observed acceleration of the flow fi'ont and the initial gas supersaturation. The data are well fitted by linear (R=0.994) and second order polynomial (R=[) fits which do not pass through the origin. These fits hatply that there is an initial value of supersaturation which must be attained before any flow acceleration results. This result is intuitively correct; taking the top off a bottle of carbonated water, which creates a CO 2 supersaturation, does not always result in an accelerating flow.
Pressure Traces
Figure 9 shows output from the pressure transducer PTI from five runs for each of the experi•nental conditions. The traces suggest that there is a general form of the pressure trace from this transducer which measures the momenttun flux transferred to the base of the test cell by the expanding flow. The pressure traces in Figure 9 are highly repeatable for each of the experimental conditions and justify the procedure of creating composite plots from several runs of the same experiment.
In order to distinguish between pressures produced by the evolving gases during the chemical reaction and pressures measured due to the injection process, dummy runs were performed in which air was injected into air (i.e., the solenoid valves and pistons were operated with an empty test cell) and water was injected in•o water. The PTI pressure trace for the air
250
,,, !00
200 . I/. .
C , , , , , , I , , , , , , , , I , , , , , i , 0 100 200 300 400 500
Supersoturotion
Figure 8. Peak acceleration as a function of the calculated supersaturation for the injection of 6 M, 9 M and 12 M K•.CO3 into 6 M HC1. The error bars indicate the uncertainty in the peak acceleration value due to the method of calculation, and in the supersaturation due to variation in solution concentration (sec Experhrtental Results section).
5556 MADER ET AL.: FRAGMENTING TWO-PHASE FLOWS
, .
'•øø i .... ' ..... ' ' ' (o) 80
•' 60 /,\
20 • •. . _•.. • 50 1 O0 150
Time (ms)
1 O0 ' ' ' ' ' ' ' 80
• 60 v
• ,to
20
o
io
I
- ,! :_._ - •, . .,• •,:_. -- :... -
100 150 200 Time (ms)
•' 60
• 40
100 f ' . . , , • ...... 80-
.
.
.
.
20
50 1 O0
Time (ms)
loo
80
• 60
• 40
2O
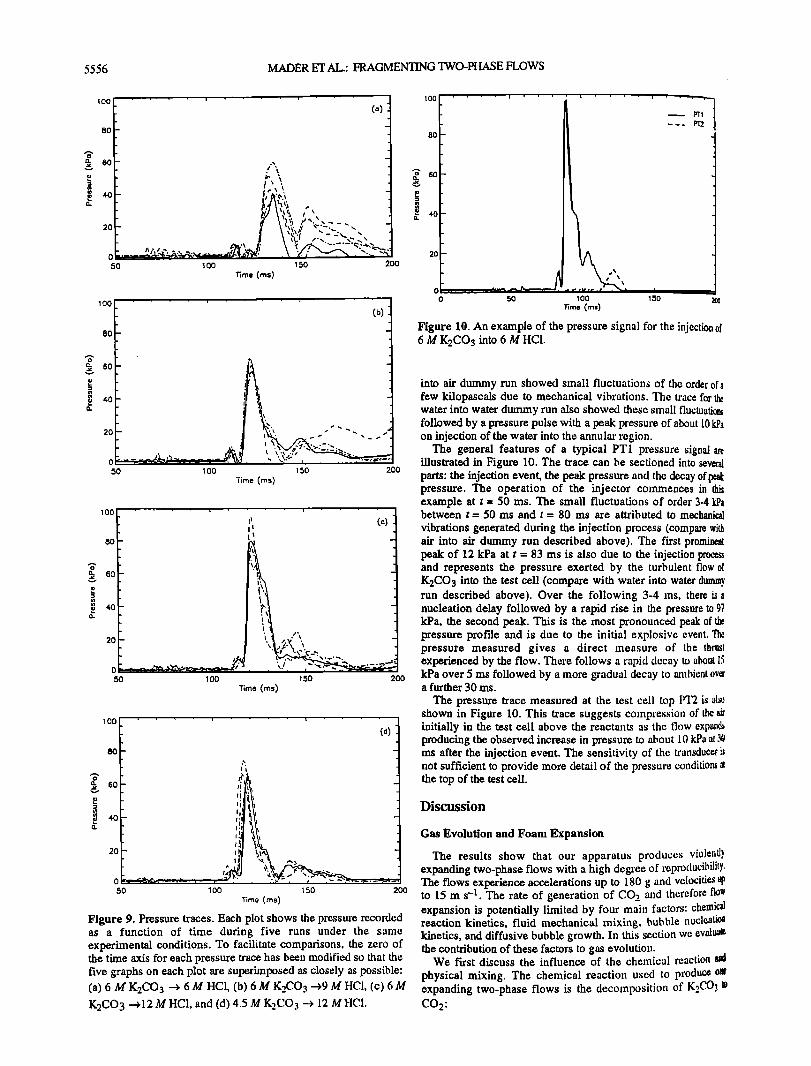
Figure 9. Pressure traces. Each plot shows the pressure recorded as a function of time during five runs under the same experimental conditions. To facilitate comparisons, the zero of the time axis for each pressure trace has been modified so that the five graphs on each plot are superhnposed as closely as possible: (a) 6 M K2CO 3 --• 6 M HC!, (b) 6 M K2CO 3 •9 M tICI, (c) 6 M K2CO3 • 12 M HC1, and (d) 4.5 M K2CO 3 --• 12 M IICl.
100 ' ' ' ' ' • ' ' ' ' i 'l ' ," , 80 ß
0 5O 1 O0 Time (ms)
1,50 200
Figure 10. An example of the pressure signal for the ittjection 0f 6 M K2CO• into 6 M HC1.
into air dummy run showed slnall fluctuations of the order of a few kilopascals due to mechanical vibrations. The trace for the water into water dmnmy run also showed these small fluctuatio•s followed by a pressure pulse with a peak pressure of about l0 kPa on injection of the water into the annular region.
The general features of a typical PT1 pressure signal are illustrated in Figure 10. The trace can be sectioned into several parts' the injection event, the peak pressure and the decay of • pressure. The operation of the injector commences in this example at t = 50 ms. The small fluctuations of order 3-4 kPa between t = 50 ms and t = 80 ms are attributed to mechanical
vibrations generated during the injection process (compare with air into air dummy run described above). The first prominent peak of 12 kPa at t = 83 ms is also due to the injection process and represents the pressure exerted by the turbulent flow of K2CO3 into the test cell (compare with water into water dummy run described above). Over the following 3-4 ms, there is a nucleation delay followed by a rapid rise in the pressure to 97 kPa, the second peak. This is the most pronounced peak of the pressure profile and is due to the initial explosive event. Tile pressure measured gives a direct measure of the thrust experienced by the flow. There follows a rapid decay to about 15 kPa over 5 ms followed by a •nore gradual decay to zunbient ova a further 30 ms.
The pressure trace measured at the test cell top PT2 is als0 shown in Figure 10. This trace suggests comp,'ession of the air initially in the test cell above the reactants as the flow expands producing the observed increase in pressure to about 10 kPa at.% ms after the injection evere. The sensitivity of the tran.',;duceris not sufficient to provide more detail of the pressure conditions at the top of the test cell.
Discussion
Gas Evolution and Foam Expansion
The results show that our apparatus produces violently expanding two-phase flows with a high degree of reproclucibility. The flows experience accelerations up to 180 g and velocities to 15 m s -1. The rate of generation of CO 2 and therefore expansion is potentially limited by four main factors: chemical reaction kinetics, fluid mechanical mixing, bubble nucl'½atk•n kinetics, and diffusive bubble growth. In this section we evalua:• the contribution of these factors to gas evolution.
We first discuss the influence of the chemical reaction physical mixing. The chemical reaction used to produce expanding two-phase flows is the decoinposition of K2CO3 C02:
MADER ET AL.: FRAGMENTING 'IWO-PHASE FI.OWS 5557
K2CO 3 + 2HC1 = 2KC1 + CO 2 + I{20. (1)
The rapid forward reaction in the decomposition of carbonate can occur via the following reaction [Barnford and Tripper, 1969]
H + - + HCO 3 = H2CO3 = CO2 + tI2o (2)
The first stage of this reaction is second order in IICO 3 consumption with a forward reaction rate constant of k = 4.7x101ø L mo1-1 s-1 [Bamford and Tripper, 1969], which for practical purposes is instantaneous. The second stage of the reaction is first order in H2CO3 consumption and has a rate constant of k = 15 s -1 [Bamford and Tripper, 1969]. To analyze the chemical reactions in our experiments, we model the test cell as a stirred-tank reactor. If we assume standard dilute reaction kinetics, then for this first-order reaction we have
NH=CO • = -'kNH=co • (3)
where Ni.t 2 co 3 is the number of moles of I-IlCO 3 in the reactor. Hence
NI•=C03 = N,,e -et (4) where No is the initial number of moles of 112cO 3. We have here furthermore assumed that the reactants are homogeneously pre mixed in which case N o is also the total number of moles of H2CO3 available in the system for conversion into CO2. The thne taken for the concentration of H2CO3 to fall to 1/eth of its initial concentration is t = 66 ins. The fonxtation of CO2 is thus the rate limiting step in the chemical reaction. Now, by (2)
•CO• = kNI-I•COa (5) and so
NCO 2 =No(1-e-la). (6) In Figure ! 1 we compare the increase of CO 2 volume with time for our experiments, with the COo_ production predicted on the basis of the above dilute reaction kinetics and the assumption that the reactants are homogeneously pre mixed. The graph clearly shows that the evolution of CO 2 in our experhnents is different
1 ! " " .- -- .................. I I --
.
0 •, , I , • ......... • ' ' ..... 0 100 200 300 ' •400
Time (ms)
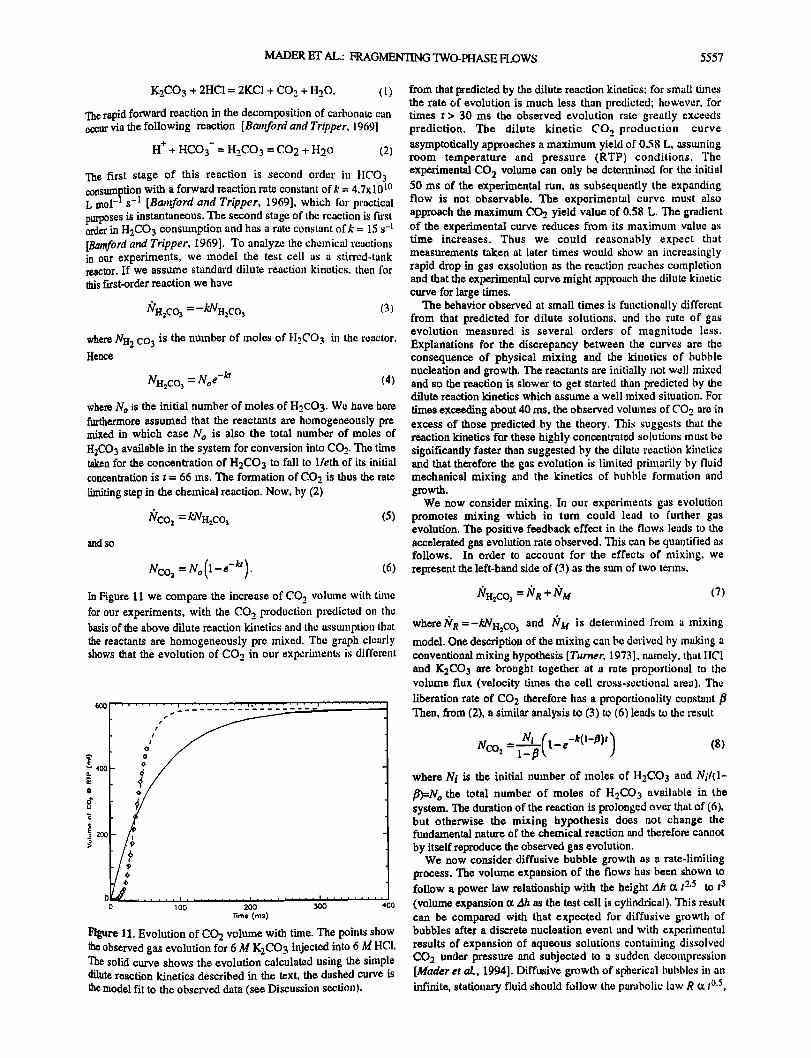
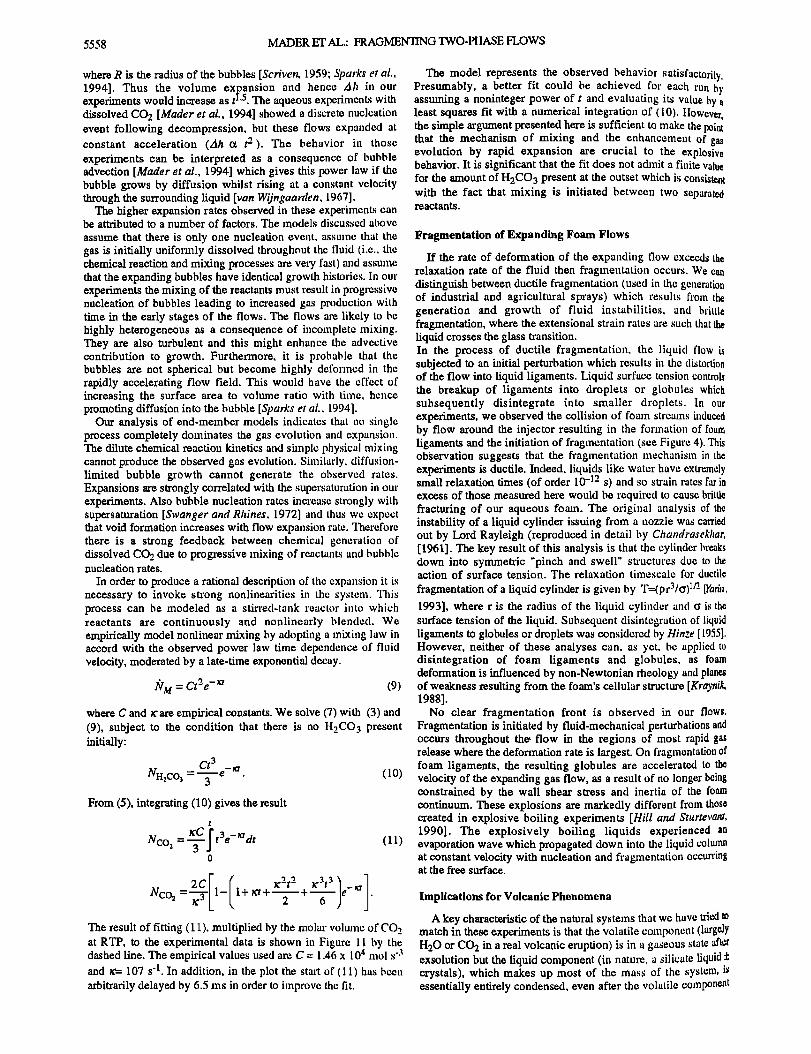
Figure 1!. Evolution of CO2 volume with thne. The points show the observed gas evolution for 6 M K2CO 3 injected into 6 M }!C1. The solid curve shows the evolution calculated using the simple dilute reaction kinetics described in the text, the dashed curve is the model fit to the observed data (see Discussion section).
200
from that predicted by the dilute reaction kinetics; for small thnes the rate of evolution is much less than predicted; however, for times t > 30 ms the observed evolution rate greatly exceeds prediction. The dilute kinetic CO 2 production curve asymptotically approaches a maximum yield of 0.58 L, asstuning room temperature and pressure (RTP) conditions. The experimental CO 2 volume can only be determined for the initial 50 ms of the experimental run, as subsequently the expanding flow is not observable. The experimental curve must also approach the maximum CO2 yield value of 0.58 L. The gradient of the experimental curve reduces fi'om its maximum value as time increases. Thus we could reasonably expect that measurements taken at later times would show an increasingly rapid drop in gas exsolution as the reaction reaches completion and that the experimental curve might approach the dilute kinetic curve for large thnes.
The behavior observed at small times is functionally different from that predicted for dilute solutions, and the rate of gas evolution measured is several orders of magnitude less. Explanations for the discrepancy between the curves are the consequence of physical mixing and the kinetics of bubble nucleation and growth. The reactants are initially not well mixed and so the reaction is slower to get started than predicted by the dilute reaction kinetics which assume a well mixed situation. For
times exceeding about 40 ms, the observed volumes of CO 2 are in excess of those predicted by the theory. This suggests that the reaction kinetics for these highly concentrated solutions must be significantly faster than suggested by the dilute reaction kinetics and that therefore the gas evolution is limited primarily by fluid mechanical mixing and the kinetics of bubble formation and growth.
We now consider mixing. In our experiments gas evolution promotes mixing which in turn could lead to further gas evolution. The positive feedback effect in the flows leads to the accelerated gas evolution rate observed. This can be quantified as follows. In order to account for the effects of mixing, we represent the left-hand side of (3) as the stun of two terms.
/9i.i,CO.• =/9 R +/9 M (7)
where./q/i =-kNH=co3 and /9M is determined from a mixing model. One description of the mixing can be derived by making a conventional mixing hypothesis [Tunwr, 1973], nmnely, that IICI and K2CO 3 are brought together at a rate proportional to the volume flux (velocity times the cell cross-sectional area). The liberation rate of COg therefore has a proportionality constant fi Then, from (2), a similar analysis to (3) to (6) leads to the result
Nco = = l•(l- e-k(1-/l)t) (8) where Ni is the initial number of moles of H2CO3 and Nii(1- fi)=N o the total number of moles of It2CO 3 available in the system. The duration of the reaction is prolonged over that of (6), but otherwise the mixing hypothesis does not change the fundamental nature of the chemical reaction and therefore cannot by itself reproduce the observed gas evolution.
We now consider diffusive bubble growth as a rate-limiting process. The volrune expansion of the flows has been shown to follow a power law relationship with the height zlh o• t 2'• to t 3 (volume expansion ot 3h as the test cell is cylindrical). This result can be compared with that expected for diffusive growth of bubbles after a discrete nucleation event and with experimental results of expansion of aqueous solutions containing dissolved COg under pressure and subjected to a sudden decompression [Mader eta/., 1994]. Diffusive growth of spherical bubbles in an infinite, stationary fluid should follow the parabolic law Rot t ø.5,
5558 MADER ET AL.: FRAGMENTING TWO-P!IASE FLOWS
where R is the radius of the bubbles [Scriven, 1959; $]t)arks etal., 1994]. Thus the volume expansion and hence All in our
as t '-. The aqueous experiments with experiments would increase dissolved CO2 [Mader etal., 1994] showed a discrete nucleation event following decompression, but these flows expanded at constant acceleration (zih ct t o-- ). The behavior in those experiments can be interpreted as a consequence of bubble advection [Mader et el., 1994] which gives this power law if the bubble grows by diffusion whilst rising at a constant velocity through the surrounding liquid [van Wijngaarden. 1967].
The higher expansion rams observed in these experiments can be attributed to a number of factors. The models discussed above
assume that there is only one nucleation event, assume that the gas is initially uniformly dissolved throughout the fluid (i.e., the chemical reaction and mixing processes are very fast) and assume that the expanding bubbles have identical growth histories. In our experiments the mixing of the reactants must result in progressive nucleation of bubbles leading to increased gas production with time in the early stages of the flows. The flows are likely to be highly heterogeneous as a consequence of incomplete mixing. They are also turbulent and this might enhance the advective contribution to growth. Furthermore, it is probable that the bubbles are not spherical but become highly deformed in the rapidly accelerating flow field. This would [lave the effect of increasing the surface area to volume ratio with time, hence promoting diffusion into the bubble [3•arks etal.. 1994].
Our analysis of end-member models indicates that no single process completely dominates the gas evolution and expansion. The dilute chemical reaction kinetics and shnple physical mixing cannot produce the observed gas evolution. Similarly, diffusion- limited bubble growth cannot generate the observed rates. Expansions are strongly correlated with the supersaturation in our experiments. Also bubble nucleation rams increase strongly with supersaturation [Swanger and Rhines, 1972] and thus we expect that void formation increases with flow expansion rate. Therefore there is a strong feedback between chemical generation of dissolved CO 2 due to progressive mixing of reactants and bubble nucleation rates.
In order to produce a rational description of the expansion it is necessary to invoke stxong non!inearities in the syste•n. This process can be modeled as a stirred-tank reactor into which reactants are continuously and nonlinearly blended. We empirically model nonlinear mixing by adopting a mixing law in accord with the observed power law time dependence of fluid velocity, moderated by a late-time exponential decay.
1• M = Ct2e -• (9)
where C and •' are empixical constants. We solve (7) with (3) and (9), subject to the condition that there is no H2CO 3 present initially:
Ct 3 = .e-17 (10) NH2C% 3 '
From (5), integrating (10) gives the result
NCO2 =/qC f ,3e- 17dr 3 J 0
I /c2t2 K'313 ) NCo 2 =2-•.•CII- 1+•+ + . e -•a . 2 6
(11)
The result of fitting (11), multiplied by the molar volume of CO 2 at RTP, to the experhnental data is shown in Figure 11 by the dashed line. The emph'ical values used are C = 1.46 x [0 4 tool s '3 and •- 107 s 't. In addition, in the plot the start of ( 11 ) has been arbitrarily delayed by 6.5 ms in order to improve the fit.
The model represents the observed behavior satisfactorily. Presumably, a better fit could be achieved for each run by assuming a noninteger power of t and evaluating its value by a least squares fit with a numerical integration of (10). tIowever, the simple argument presented here is sufficient to make the point that the mechanism of mixing and the enhancement of gas evolution by rapid expansion are crucial to the explosive behavior. It is significant that the fit does not admit a fitlite value for the amount of H2CO 3 present at the outset which is consisteat with the fact that mixing is initiated between two separated reactants.
Fragmentation of Expanding Foam Flows
If the rate of deformation of the expanding flow exceeds the relaxation rate of the fluid then fragmentation occurs. We can distinguish between ductile fragtnentation (used in the generation of industrial and agricultural sprays) which results from the generation and growth of fluid instabilities, and brittle fragmentation, where the extensional strain rates are such that the liquid crosses the glass transition. In the process of ductile fragmentation, the liquid flow is subjected to an initial perturbation which results in the distortion of the flow into liquid ligaments. Liquid surface tension controls the breakup of ligaments into droplets or globules which subsequently disintegrate into smaller droplets. in our experiments, we observed the collision of foam streams induced by flow around the injector resulting in the formation of foam ligaments and the initiation of fragmentation (see Figure 4). This obgervation suggests that the fragmentation mechanism in the experiments is ductile. Indeed, liquids like water have extremely small relaxation times (of order 10 -12 s) and so stxain rates far in excess of those measm'ed here would be required to cause brittle fracturing of our aqueous foam. The original analysis of the instability of a liquid cylinder issuing from a nozzle was carried out by Lord Rayleigh (reproduced in detail by Chandrasekhar, [1961]. The key result of this analysis is that the cylinder breaks down into sytrunetxic "pinch and swell" structures due to the action of surface tension. The relaxation timescale for ductile
fragmentation of a liquid cylinder is given by T=(pr3/•) It'- [l•in, 1993], where r is the radius of the liquid cylinder and {• is the surface tension of the liquid. Subsequent disintegration of liquid ligaments to globules or droplets was considered by Hinze [1955]. However, neither of these analyses can, as yet, be applied to disintegration of foam ligaments and globules, as foam deformation is influenced by non-Newtonian rheology and planes of weakness resulting from the foam's cellular structure [Kraynik, 1988].
No clear fragmentation front is observed in our flows. Fragmentation is initiated by fluid-mechanical perturbations and occurs throughout the• flow in the regions of most rapid gas release where the deformation rate is largest. On fragmentation of foam ligaments, the resulting globules are accelerated to the velocity of the expanding gas flow, as a result of no longer being constrained by the wall shear stress and inertia of the foam continuum. These explosions are markedly different froIn those created in explosive boiling experiments [Hill and Sturtevant, 1990]. The explosively boiling liquids experienced an evaporation wave which propagated down into the liquid column at constant velocity with nucleation and fragmentation occun'ing at the free surface.
Implications for Volcanic Phenomena
A key characteristic of the natural systems that we have txied to match in these experiments is that the volatile component (largely H20 or CO2 in a real volcanic eruption) is in a gaseous state after exsolution but the liquid component (in nature, a silicate liquid • crystals), which makes up most of the mass of the system, is essentially entirely condensed, even after the volatile component

MADER ET ALL.: FRAGMENTING 'IWO.PHASE I,I.OWS 5559
has nearly completely exsolved. In these respects, the system in these experiments differs significantly from one-component systems [Hill and Sturtevant, 1990] and two-component systems that completely or nearly completely evaporate on decompression.
In order to ensure that the physical processes of explosive volcanism are properly modeled by laboratory simulations, the experiments must be conducted with similar velocities, accelerations and flow densities to those in large-scale natural flows. Velocities in our experhnents approach those of vt)lcanic flows (~10 to 100 ms-•), as do the accelerations (-10 to 100 g' note that gravity (! g) is unimportant in flows that experience such large accelerations). The high velocities and accelerations experienced by these flows mean that inertial rather than viscous forces control the dynamics. If the velocities of the laboratory experiments and natural flows are similar, then a necessary consequence is that the timescales in the smaller scale laboratm'y system are much smaller than the natural timescales. It is indeed the case that the experiments reported here have appropriately short times to scale to typical volcanic flows. The pressure ratio for the experiments ranges from 50 to I00, con•pal'ab!e magmas with a few percent dissolved water (supersaturation pressures .-- 50 to 100 MPa) that disrupt explosively at a few megapascals [Sparks, 1978; Wilson, 1980].
Obviously, the length scales of the volcanic system cannot be reproduced in the laboratory. However, it is accepted practice in the study of bubbly liquids and dusty gases that if the transverse dimension of the flow channel is much larger than the smallest bubbles or particles, as it is in our experiments and in the natural flows, then the long-range dynzunica! interactions between phases that generate a variety of flow scales will be fi'ee to act.
Bubble nucleation and growth are ulthnately the processes that drive the accelerations observed in ore' experhnents, st) scaling of our results to nature requires an evaluation of how they may differ in supersaturated magmas. Molar fractions of voletiles in our experiments (up to 0.1 CO 2) are comparable to those of intermediate to silicic magmas (0.02-0.06 lI20), so the ratio gas to condensed matter is comparable in the experiments and nature. The diffusivity of CO,_. in H20 (2x10 -9 m 2 s -'• at 20 øC) is about 200x larger than that of It20 in concentrations of about 0.03 in magma at 850øC (~ 10 -• m 2 s-•). The difl'usively controlled volume growth rate of voids during degassing is proportional to the product of diffusivity and concentration, which could be locally as much as 200x larger than in the magma. The viscosity of water is also many orders of magnitude less than that of magma in explosive eruptions. flowever, provided the flow regime is inertial, viscosity does not affect the bulk flow dynamics and is therefore not a relevant parameter. Moreover, numerical calculations [Dobran, 1992; Proussevitch et el., 1993; Sparks et el., 1994; Thomas et el., 1994; Barclay et al., 1995] indicate that, even under the conditions of explosive eruption, diffusive bubble growth is not retarded by viscous effects unless magma viscosities exceed about 109 Pa s. In the fragmentation region, with pressures of a few megapascals, magmas are not fully degasseal and a few tenths of a percent of residual dissolved water are sufficient to keep viscosities at values that would not inhibit explosive expansion rates. Bubble densities in these experiments are thought to be locally higher than the 109 nl- 3 measured in decompression experiments [Mader et el., 1994! but are still likely to be significantly less than the 2x10 observed in laboratory experiments on volcanic glasses [Htm•,itz. and Navon, 1994], and the nucleation densities of 3x10 TM 3X10¹⁶ m -3 inferred from observations of putnice [Whitham trod Spar'ks, 1986; Sparks and Brazier, 1982]. That bubble densities in the present experi.ments are possibly several orders el' magnitude •mal!er than in nature and in decompression experiments magmatic compositions suggests that gas evolutkm rates and accelerations in natural events could be even greater than it• these flows.
A possible difference between the experi•nents and nature concerns the rates of decompression. !n the experiments the ambient pressure is 0.1 MPa and the bubbles form frcun a strongly supersaturated liquid as a consequence of the chemical reaction. The experiments are thus analogous to a sudden large pressure drop and so effectively simulate certain kinds of explosive eruptions such as discrete vulcanian explosions of lava domes. In the case of more sustained eruptions, such as plinian events, decompression occurs progressively as the magma ascends. However, recent experimental data on bubble nucleation in rhyolites [Hurwitz and Nayon, 1994] and modeling of the flow regimes in conduits [Sparks et el., !994] suggest that bubble expansion occurs under conditions of large supersaturations and very rapid decompressions even in sustained eruptions, which make conditions in the experiments closely comparable to those
observed in nature. For exmn•le, Sparks et el. [1994] calculate that pressure drops of order 10" MPa can occur in time periods of order 10 s in plinian eruptions.
Evidence for the extreme conditions of bubble nucleation and
growth in volcanic eruptions can be found in putnice. Bubble densities of 10 TM to 10 t5 m -3 are typical with a wide range of sizes [Sparks and Brazier, 1982; Whirham and Spark's, 1986]. Many pumice clasts in plinian deposits and ignimbrites display elongate cylindrical or tube vesicles. In extreme cases they form fibrous or woody pumice. We suggest that such textures are the direct consequence of the large accelerations that the foamy magma experiences during explosive bubble growth, which results in an elongation of the bubbles as they grow.
In our experiments, water fragments into a spray in the liquid state, demonstrating that ductile fragmentation induced by rapid expansion can occur and may provide the fragmentation mechanism in volcanic eruptions also. Foam flows exhibit viscoplastic behavior in that they possess a yield stress below which they do not deform. At shear stresses above this value. the viscosity is shear stress dependent [Kraynik, 1988]. We observed accelerations to 15 m s -• in distances of less than 0.5 •n producing extensional strain rates of order 30 s "I. Our exper're'rental liquids are very different to magmas in terms of intrinsic viscosity and surface tension. Assuming that the dynamics of the experhnental flows are sitnilar to tht)se ft)und in explosive volcanic eruptions, as suggested above, we would expect the deformation rate in the lm'ge-scale flows to be of the same order as those seen in our experiments. Silicic magmas exhibit viscoelastic behavior at strain rates comparable to those observed in our experiments [Dingwel! and Webb, 1989]. The Maxwell model of linear viscoelastic materials provides a relaxation time t=tz/G,,,, where m is the shear viscosity and G** is the shear modulus [Yarin, !993]. For a magma with a few weight percent dissolved water at eruption temperature St = 109 Pa s and G,,o = 1010 Pa so t = 0.1 s which is of the same order as the inverse strain rate in rapid exsolution. Thus the deformation rate could be sufficient to cause magma to cross the glass transition and so the fragmentation mechanism in an explosive eruption could be brittle.
Models of explosive volcanism have Ix)stulated that magma fragments at a simple downward-propagating front in almost static foams with vesicularities of 0.7 to 0.8 [Spart,'s, 1978; Wilson et el., 1980]. In these models flow acccleratk>n occurs after fragmentation. Our experimental simulations cast doubt on this concept. Foam acceleration precedes fragmentation rather than the reverse.
In these flows large gradients of I!CI concentration in the neighborhood of the injection .jets generate lt•cally large supersaturation gradients and spatJelly inhomogeneous liberation of CO 2 vapor. Fragmentation occurs throughout the fit•w in the regions of most violent gas release. Thus these chetnically generated two-phase flows are intrinsically heterogeneous, and hence model inhomogeneities occurring in real, natural systems

5560 MADER ET AL.: FRAGME•G 'IWO-PHASE FLOWS
well. Evidence of heterogeneous vesiculation is common in pyroclastic materials.
Summary and Conclusions
The experiments discussed here produce violently expanding and fragmenting flows with a high degree of reproducibility. They reveal several aspects of the physics of violetat degassing within a mixing-limited system. We have shown that the dynamics of the laboratory flows are similar in a nmnber of hnportant respects to the dynmnics expected in explosive volcanic eruptions allowing conclusions for the large-scale flows to be drawn. In particular, the results demonstrate the importance of the interaction between mixing and bubble nucleation. The rate of gas evolution is also strongly determined by components clue to advection and bubble deformation and in this respect can be regarded as a function of the local flow conditions rather than the fluid properties. Although both the nucleation process and advection may in some respects be different in magmatic systems, degassing in explosively expanding liquids will in general be significantly enhanced by these effects and they should therefore be included in models of explosive eruptiotas. Furthermore, models of fragmentation in explosive eruptions [Sparks, 1978; Wilson et el., 1980] must be ranended to take account of the fact that foam acceleration accompanies fragmentation and that fragmentation may not occur at a well-defined fi'agmentatiot, surface.
Acknowledgements. We would like to thank E. Stolper, Y. Zhang, K. V. Cashman, and an anonymous reviewer for their helpful comments on the manuscript. This work and the salary of J. C. Phillips was funded by grant GR3/8620 from the Natural Environment Research Council. England, and by EC grant PL910499.
References
Anillmmar, A. V., R. S. J. Sparks and B. Sturtevant, Geological implications and applications of high velocity two-phase flow experiments, J. Volctmol. Geothet,n. Res., 56, 145-160. 1993.
Barnford, C. H., and C. F. H. Tripper (Eds.), Comprehensive Chemical Kinetics, Elsevier, New York, 1969.
Barclay, J., D. S. Riley, and R. S. J. Sparks, Analytical models for bubble growth during decompression of high viscosity magmas, Bull. Voicenot., in press, 1995.
Carey, S. N., J. Gardner, H. Sigurdsson, and W. Criswell, Variations in column height and magma discharge during the May 18, 1980, eruption of Mount St. Helens, J. Volcanol. Geotherm. Res., 43, 99- 112, 1990.
Chandrasekhar, S., Hydrodynamic and ttydromagnetic Stability, Clarendon, Oxford, 1961.
Dingwell, D. B., and S. L. Webb, Structural relaxation in silicate melts and non-Newtonian melt theology in geologic processes, Phys. Chem. Miner., 16, 508-516, 1989.
Dobran, F., Nonequilibrium flow in volcanic conduits and application to the eruption of Mr. St. Helens on May 18, 1980, and Vesuvius in AD79, J. Volcanol. Geotherm. Res., 49, 285-311. 1992.
Hill, L. G., and B. Sturtevant, An experimental s•udy of evaporation waves in a superheated liquid, in Adiabatic tVaves in Liquid-Vapor Systems. IUTAM Symposium G6ttingen, Germany, 1989, ediled by G.
E. A. Meier and P. A. Thompson, pp.25-37. Springer-Verlag, New York, 1990.
Hinze, J. O., Fundamentals of the hydrodynamic mechanism of splitting in dispersion processes, AIChE J., !,289-295, 1955. Hurwitz, S., and O. Nayon, Bubble nucleation in rhyolitic
Experiments at high pressure, temperature and water content, Earth Planet. Sci. Lett., 122, 267-280, 1994.
Kieffer, S. W., Fluid dynamics of the May 18 bla-qt at Mount St. Heleas, U.S. Geol. Surv. Prof Pap., 1250, 379-400. 1981.
Kieffer, S. W., and B. Sturtevant, Laboratory studies of volcanic jets• J. Geophys. Res., 89, 8253-8268, 1984.
Kraynik, A.M., Foam flows, Annu. Rev. Fluid Mech., 20, 325-357, 19•8!1, Mader, H. M., Y. Zhang, J. C. Phillips, R. S. J. Sparks, B. Sturlevant,
E. Stolper, Experimental simulations of explosive degassing of magna, Nature, 372, 85-88, 1994.
Proussevitch, A. A., D.C. Sahagian, and A. T. Anderson, Dynamie.n af diffusive bubble growth in magmas: Isofi•ermal case, J. Geophys. Res., 98, 22,283-22,308, 1993.
Scriven, L. E., On the dynanfics of phase growth. Chem. Eng. SoL. I0, 1- 13, 1959.
Sparks, R. S. J., The dynanfics of bubble formation and growth magmas: A review and analysis, J. Volcanol. Geotherm. Res., 3, 1-37, 1978.
Sparks, R. S. J., and S. Brazier, New evidence for degassing proces.qe.n during explosive eruptions, Nature, 295, 218-220, 1982.
Sparks, R. S. J., H. S igurdsson, and L. Wilson, Magma mixing: A medianism for triggering acid explosive eruptions. Nature. 267, 315- 318, 1977.
Sparks, R. S. J., J. Barclay, C. Jaupart, H. M. Mader. J. Phillips, aM Sturtevant, Physical aspects of magma degassing, I. Experimental a•! theoretical constraints on vesiculation, Mineral. Soc. Am. Rev., 413-445, 1994.
Swanget, L. A., and W. C. Rhines, On the necessary conditions homogeneous nucleation of gas bubbles in liquids.. J. Cryst. 12, 323-326, 1972.
Thonl•q, N., C. Jaupart and S. Vergniolle. On the vesicularity of pum/ce. J. Geophys. Res., 99, 15,633-15,644, 1994.
Turner, J. S., Buoyancy Effects in Fluids, Cambridge Univ. Press, New York, 1973.
Turner, J. S., H. E. Huppert, and R. S. J. Sparks, An experimeml investigation of volatile exsolution in evolving magma chambers, J. Votcanol. Geotherm. Res., 16, 263-277, 1983.
van Wijngaarden, L., On the growth of small cavitation bubble• by convective diffusion, btt. J. tleat Mass Trtmsfer, tO, 127-134, 1967.
Weast, R.C. (Ed.), CRC Handbook t• Cbemist•.3, t,ul Physics (64th CRC Press, Florida, 1983.
Whitham, A. G., and R. S. J. Sparks, Pumice, Bull. Voh"anol., 48, 209- 223, 1986.
Wilson, L., Relationships between pressure, volatile content and ejeaa velocity in three types of volca,tic explosion, J. Vo]canol. Geothem•. Res., 8, 297-313, 1980.
Wilson, L., R. S. J. Sparks, and G. P. L Walker, Explosive volcam eruptions, IV, The control of magma properties and conduit geometry on eruption colunto behaviour. Geophys. J. R. Astron. Soc., 63. 117- 148, 1980.
Yarin, A. L., Free LiquM Jets wtd Films: Hydrodymtmics and Rheott•gy, Longman, White Plains, N.Y., 1993.
H. M. Mader, J.C.Plfillips, and R. S. J. Sparks, Deparlment of Geology, University of Bristol, Bristol BS8 1RJ, England. (e-mail: H.M.Madertg bristol.ac.uk; J.C.Plfillips @b•Sstol.ac.uk; Steve. [email protected])
B. Sturtevant, Graduate Aeronautical Laboratories, California Institme of Technology, Pasadena, CA 91125. (e-mail: [email protected]•.edu')
(Received September 23, 1994; revised July 31, 1995; accepted August 10, 1995.)