Dynamics and implementation patterns of large-scale land acquisitions – Evidence from the Land...
13
Dynamics and implementation patterns of large-scale land acquisitions – Evidence from the Land Matrix Global Observatory Land Matrix Initiative (LMI) Christof Althoff, Ward Anseeuw, Markus Giger, Jann Lay, Kerstin Nolte, Martin Ostermeier
-
Upload
trevor-montgomery -
Category
Documents
-
view
218 -
download
0
Transcript of Dynamics and implementation patterns of large-scale land acquisitions – Evidence from the Land...

Dynamics and implementation patterns of large-scale land acquisitions –
Evidence from the Land Matrix Global ObservatoryLand Matrix Initiative (LMI)
Christof Althoff, Ward Anseeuw, Markus Giger, Jann Lay, Kerstin Nolte, Martin Ostermeier

The Land Matrix Initiative
• The LMI is a global and independent land monitoring initiative• Aim of the LMI: Promote transparency and open data in decision-
making over land and investment• Set up to respond to the lack of data on large-scale land
acquisitions• Recently: Process of decentralization – since July 2014 five
Regional Focal Points are supporting the LMI on regional level data collection for the Land Matrix Global Observatory database

Database characteristics of the Land Matrix Global Observatory
• Records intended, concluded or failed land acquisitions (land acquired by purchase, lease or concession)– In low and middle income countries– For agricultural production, forestry, carbon trading, industry,
renewable energy production, conservation and tourism
• Land deals in the database …– Entail a transfer of rights to use, control or ownership of land through
sale, lease or concession– Have been initiated since 2000– Cover an area of 200 hectares or more– Imply the potential conversion of land from smallholder production,
local community use or important ecosystem service provision to commercial use

Database sourcesData collection methods• Data sourcing/entry through LM partners / Regional Focal
Points based on i) company sources, ii) contracts, iii) official government records, iv) personal information, v) media reports, vi) research papers / policy reports
• Establishment of extensive networks of key information sources (governments, farmers organizations, academics, civil society, international co-operations etc.)
• Collaboration with existing land observatories• For Africa: Cooperation with the Land Policy Initiative and its
Focal Points• Crowd sourcing

Database content
• Information on location, investor (origin, type), deal (production intention, size…), target region (former land use) etc.
• Attempt to capture dynamics, two key variables (year based)– Negotiation status
• (1) Expression of interest, (2) Under negotiation• (3) Oral agreement, (4) Contract signed• (5) Negotiations failed, (6) Contract cancelled
– Implementation status• (1) Project not started• (2) Startup phase (no production), (3) In operation (production)• (4) Project abandoned
• Important note: Different area size variables („intended size“ = announced size, „size under contract“, „size under operation”)

Data overview
High area sizes under concluded deals Aggregate global demand for land is very high indicating a large number of pending deals Intentions/announcements still exceed actual contract size by far Quite some failure at negotiation and concluded stage (contract cancelled)
International large-scale land acquisitions according to negotiation status Number of
casesIntended size Size under contract
(In million ha) (In million ha)
Oral agreement 77
4,3
1,8
Contract signed 964
59,9
36,5
Concluded deals 1.041
64,2
38,2
Expression of interest 47
6,2 n.a.
Under negotiation 147
9,8 n.a.
Intended deals 194
16,0 n.a.
Negotiations failed 56
5,5 n.a.
Contract cancelled 28
2,1
1,9
Failed deals 84
7,6
1,9
No Information 85 Note: Data as of Feb 14, 2015

Dynamics of international large-scale land acquisitions according to negotiation status Number of deals Intended size Size under contract (in million ha) (in million ha)
Jun2013
Sep2014
Feb2015
∆ Jun13-Feb 15
Jun2013
Sep2014
Feb2015
∆ Jun13-Feb 15
Jun2013
Sep2014
Feb2015
∆ Jun13-Feb 15
Concluded deals 755 983 1041 38% 54.9 62.3 64.2 17% 32.6 37.3 38.2 17%
Intended deals 145 186 194 34% 10.8 14.8 16.0 48% n.a. n.a. n.a. n.a.
Failed deals 50 79 84 68% 4.9 7.45 7.6 55% 1.1 1.9 1.9 68%
Clear trend of ongoing investments in land: Deals are being concluded reflecting a continued high demand on land
Data consolidation: No major changes in data patterns, but more deals added across all negotiation statuses
However, not only new entries, also updates of deals and quality improvements: dynamics of data entry and dynamics on the ground are difficult to detangle
Data trends and dynamics: Data consolidation, continuing high demand for land and ongoing investments
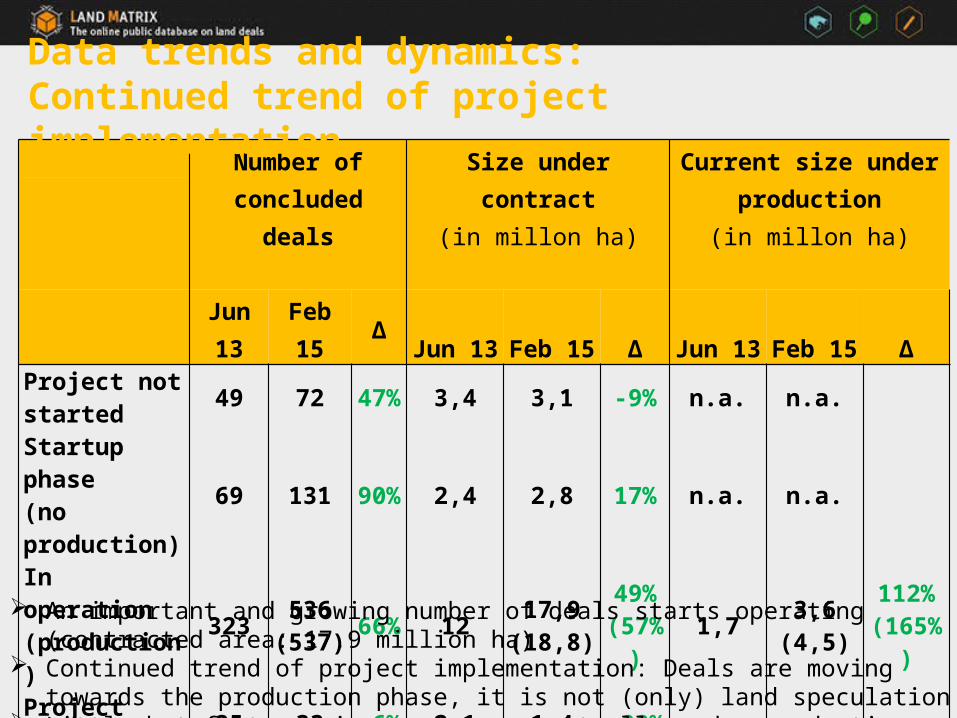
Number of
concluded dealsSize under contract
(in millon ha)Current size under
production(in millon ha)
Jun 13 Feb 15 Δ Jun 13 Feb 15 Δ Jun 13 Feb 15 ΔProject not started 49 72 47% 3,4 3,1 -9% n.a. n.a.
Startup phase (no production) 69 131 90% 2,4 2,8 17% n.a. n.a.
In operation (production) 323 536
(537) 66% 12 17,9(18,8)
49%(57%) 1,7 3,6
(4,5)112%
(165%)Project abandoned 35 33 -6% 2,1 1,4 -33% n.a. n.a.
No information 279 269 -4% 12,4 13,1 6% n.a. n.a.
Total 755 1041 38% 32,3 38,2 18% 1,7 3,6 112%
Data trends and dynamics: Continued trend of project implementation
An important and growing number of deals starts operating (contracted area: 17.9 million ha) Continued trend of project implementation: Deals are moving towards the production phase,
it is not (only) land speculation Little but fast growing area comes actually under production

Implementation patterns according to deal size
All concluded Deals
Concluded Deals (implementation status known)
Concluded deals started (in startup phase or in operation)
Number of Deals Number of Deals
Number of Deals Percentage
200 to 2.000 191 144 124 86%2.001 to 5.000 142 115 100 87%5.001 to 10.000 249 174 153 88%10.001 to 20.000 143 103 89 86%20.000 to 50.000 139 111 96 86%50.000 to 200.000 104 84 75 89%more than 200.000 33 21 15 71%no information 40 20 15 75%Total 1.041 772 667 86%
Implementation patterns of international land acquisitions according to the contract size of concluded deals
Deals of a contract size of more than 200,000 hectares are the least likely to be implemented (71 per cent).
All other deals have similar chances of being implemented (86 – 89 per cent).

Implementation status of top 12 target countries according to contract size of concluded deals
PNG IDN SSD COD MOZ COG RUS UKR LBR SDN SLE BRA0
500000
1000000
1500000
2000000
2500000
3000000
3500000
4000000
No information
Project abandoned
In operation (production)
Startup phase (no production)
Project not started
Different patterns of implementation in top 12 target countries

Closer look at successful implementation of top target countries
Rank
Concluded ProjectsProject started (start-up phase + in operation) Project in operation
Country
hectare size under contract (in 1000 ha) # of deals
hectare size under contract (in 1000 ha) # of deals
hectare size in production (in 1000 ha) # of deals
1 PNG 3,799 39 1,176 19 118 162 IDN 3,636 120 2,410 69 625 653 SSD 3,491 9 305 5 2 34 COD 2,765 11 2,414 6 22 45 MOZ 2,204 71 1,702 40 55 316 COG 2,132 7 672 5 3 47 RUS 1,732 18 1,585 17 24 158 UKR 1,600 11 1,350 10 745 109 LBR 1,341 14 463 9 26 7
10 SDN 1,269 19 395 10 4 811 SLE 1,241 20 358 11 3 812 BRA 1,057 48 1,014 42 708 41
Some countries tend to be more succesful in moving towards the production stage

Determinants of success: Different patterns for type of investor
Private
company
Stockex-change listed
company
Indivi-dual
entre-preneur
Invest-ment fund
Semi state-
owned company
State-/ govern-ment(-owned) Other
No informati
on
Total (deals or hectares)
Concluded deals
# of deals 333 236 10 57 21 34 4 77 772hectare size in 1000 ha 12,100 8,479 219 2,006 332 793 93 1,108 25,130
All started deals
# of deals 278 213 10 53 20 25 4 64 667∆ 83% 90% 100% 93% 95% 74% 100% 83% 86%hectare size in 1000 ha 8,865 7,794 219 1,956 323 501 93 975 20,726∆ 73% 92% 100% 98% 97% 63% 100% 88% 82%
Investor type of started projects (start-up phase and in operation)
The majority of successful projects are operated by private companies and stock-exchange listed companies, followed by investment funds
However most successful in terms of the share of projects that move towards production are those projects operated by individual entrepreneurs (100 per cent), investment funds (93 per cent), and semi-state-owned companies (95 per cent).
Nolte, Kerstin
hier müsste man sich mal überlegen welche Länder man zeigen will. Das sind jetzt die Länder, die in der vorigen Kategorie besonders auffällig waren, evtl. auch das allgemeine noch einmal raus... ich fürchte aber soviel spannendes ergibt sich hier auch noch nciht.

http://www.landmatrix.org