Dynamic Scaling of the Generalized Complementary ...
12
Dynamic Scaling of the Generalized Complementary Relationship Improves Long-term Tendency Estimates in Land Evaporation Jozsef SZILAGYI * 1,2 , Richard CRAGO 3 , and Ning MA 4 1 Department of Hydraulic and Water Resources Engineering, Budapest University of Technology H-1111, Budapest Hungary 2 Conservation and Survey Division, School of Natural Resources, University of Nebraska-Lincoln, Lincoln, Nebraska 68583, USA 3 Department of Civil and Environmental Engineering, Bucknell University, Lewisburg, Pennsylvania 17837, USA 4 Key Laboratory of Water Cycle and Related Land Surface Processes, Institute of Geographic Sciences and Natural Resources Research, Chinese Academy of Sciences, Beijing 100101, China (Received 23 March 2020; revised 18 June 2020; accepted 28 June 2020) ABSTRACT Most large-scale evapotranspiration (ET) estimation methods require detailed information of land use, land cover, and/or soil type on top of various atmospheric measurements. The complementary relationship of evaporation (CR) takes advantage of the inherent dynamic feedback mechanisms found in the soil−vegetation−atmosphere interface for its estimation of ET rates without the need of such biogeophysical data. ET estimates over the conterminous United States by a new, globally calibrated, static scaling (GCR-stat) of the generalized complementary relationship (GCR) of evaporation were compared to similar estimates of an existing, calibration-free version (GCR-dyn) of the GCR that employs a temporally varying dynamic scaling. Simplified annual water balances of 327 medium and 18 large watersheds served as ground-truth ET values. With long-term monthly mean forcing, GCR-stat (also utilizing precipitation measurements) outperforms GCR-dyn as the latter cannot fully take advantage of its dynamic scaling with such data of reduced temporal variability. However, in a continuous monthly simulation, GCR-dyn is on a par with GCR-stat, and especially excels in reproducing long-term tendencies in annual catchment ET rates even though it does not require precipitation information. The same GCR-dyn estimates were also compared to similar estimates of eight other popular ET products and they generally outperform all of them. For this reason, a dynamic scaling of the GCR is recommended over a static one for modeling long-term behavior of terrestrial ET. Key words: land−atmosphere interactions, land evaporation, evapotranspiration, complementary relationship of evapo- ration Citation: Szilagyi, J., R. Crago, and N. Ma, 2020: Dynamic scaling of the generalized complementary relationship improves long-term tendency estimates in land evaporation. Adv. Atmos. Sci., 37(9), 975−986, https://doi.org/10. 1007/s00376-020-0079-6. Article Highlights: • A temporally variable dynamic scaling of the GCR yields better long-term behavior than a static one. • The dynamic scaling accounts for the aridity of the environment in each time step and thus improves land evaporation estimates. • The dynamic scaling does not require precipitation information. 1. Introduction Land surface evapotranspiration (ET) is a central compon- ent in the Earth’s energy, water, and carbon cycles (Wang and Dickinson, 2012; Fisher et al., 2017). Accurate ET information is therefore essential for a better understanding of land−atmosphere interactions (Seneviratne et al., 2006) and the biosphere’s water−carbon coupling (Biederman et al., 2016; Feng et al., 2016). It also improves drought predic- tions (Pendergrass et al., 2020) and helps to find answers to water resources sustainability issues (Condon et al., 2020). * Corresponding author: Jozsef SZILAGYI Email: [email protected] ADVANCES IN ATMOSPHERIC SCIENCES, VOL. 37, SEPTEMBER 2020, 975–986 • Original Paper • © The Author(s) 2020. This article is published with open access at link.springer.com.
Transcript of Dynamic Scaling of the Generalized Complementary ...

Dynamic Scaling of the Generalized Complementary RelationshipImproves Long-term Tendency Estimates in Land Evaporation
Jozsef SZILAGYI12 Richard CRAGO3 and Ning MA4
1Department of Hydraulic and Water Resources Engineering Budapest University of
Technology H-1111 Budapest Hungary2Conservation and Survey Division School of Natural Resources University of
Nebraska-Lincoln Lincoln Nebraska 68583 USA3Department of Civil and Environmental Engineering Bucknell University Lewisburg Pennsylvania 17837 USA
4Key Laboratory of Water Cycle and Related Land Surface Processes Institute of Geographic Sciences and
Natural Resources Research Chinese Academy of Sciences Beijing 100101 China
(Received 23 March 2020 revised 18 June 2020 accepted 28 June 2020)
ABSTRACT
Most large-scale evapotranspiration (ET) estimation methods require detailed information of land use land coverandor soil type on top of various atmospheric measurements The complementary relationship of evaporation (CR) takesadvantage of the inherent dynamic feedback mechanisms found in the soilminusvegetationminusatmosphere interface for itsestimation of ET rates without the need of such biogeophysical data ET estimates over the conterminous United States by anew globally calibrated static scaling (GCR-stat) of the generalized complementary relationship (GCR) of evaporationwere compared to similar estimates of an existing calibration-free version (GCR-dyn) of the GCR that employs atemporally varying dynamic scaling Simplified annual water balances of 327 medium and 18 large watersheds served asground-truth ET values With long-term monthly mean forcing GCR-stat (also utilizing precipitation measurements)outperforms GCR-dyn as the latter cannot fully take advantage of its dynamic scaling with such data of reduced temporalvariability However in a continuous monthly simulation GCR-dyn is on a par with GCR-stat and especially excels inreproducing long-term tendencies in annual catchment ET rates even though it does not require precipitation informationThe same GCR-dyn estimates were also compared to similar estimates of eight other popular ET products and theygenerally outperform all of them For this reason a dynamic scaling of the GCR is recommended over a static one formodeling long-term behavior of terrestrial ET
Key words landminusatmosphere interactions land evaporation evapotranspiration complementary relationship of evapo-ration
Citation Szilagyi J R Crago and N Ma 2020 Dynamic scaling of the generalized complementary relationshipimproves long-term tendency estimates in land evaporation Adv Atmos Sci 37(9) 975minus986 httpsdoiorg101007s00376-020-0079-6
Article Highlights
bull A temporally variable dynamic scaling of the GCR yields better long-term behavior than a static onebull The dynamic scaling accounts for the aridity of the environment in each time step and thus improves land evaporation
estimatesbull The dynamic scaling does not require precipitation information
1 Introduction
Land surface evapotranspiration (ET) is a central compon-
ent in the Earthrsquos energy water and carbon cycles (Wang
and Dickinson 2012 Fisher et al 2017) Accurate ETinformation is therefore essential for a better understandingof landminusatmosphere interactions (Seneviratne et al 2006)and the biospherersquos waterminuscarbon coupling (Biederman etal 2016 Feng et al 2016) It also improves drought predic-tions (Pendergrass et al 2020) and helps to find answers towater resources sustainability issues (Condon et al 2020)
Corresponding author Jozsef SZILAGYI
Email jszilagyi1unledu
ADVANCES IN ATMOSPHERIC SCIENCES VOL 37 SEPTEMBER 2020 975ndash986 bull Original Paper bull
copy The Author(s) 2020 This article is published with open access at linkspringercom
While the globally distributed eddy-covariance flux towershave contributed significantly to our knowledge of ETacross a wide range of ecosystems [see a recent review by Bal-docchi (2020)] the spatiotemporal variation of global ETand its response to the changing climate remains highly uncer-tain (Mueller et al 2011 Liu et al 2016) because the estima-tion of long-term spatially resolved ET is yet laden by diffi-culties in parameterizing the biophysical processes (egroot water uptake stomatal resistance and its response toCO2 concentration changes) that control ET in the currentland surface models (LSMs) (Ukkola et al 2016 Ma et al2017) and remote sensing algorithms (Vinukollu et al2011 Velpuri et al 2013) In addition to possible modelstructural errors the uncertainties in the estimated ET canalso arise from errors in their gridded vegetation (Fang etal 2019) and soil (Zheng and Yang 2016) parameters dueto the large degree of complexityheterogeneity found in ter-restrial ecosystems For example most LSMs withinNLDAS-2 (the North American Land Data Assimilation Sys-tem phase 2) still utilize the NOAA normalized differencevegetation index data developed by Gutman and Ignatov(1998) on a five-year-mean monthly basis without any interan-nual variation as input (Xia et al 2012) failing to reason-ably capture the impact of vegetation changes on ETBesides a recent sensitivity study by Li et al (2018) demon-strated that the Noah-MP LSM cannot always capture theeffect of spatial changes in forest andor soil types on the sim-ulated ET because of the inherent uncertainties in multipleland cover and soil texture data
As an alternative the complementary relationship (CR)(Bouchet 1963) of evaporation inherently accounts for thedynamic feedback mechanisms found in the soilminusvegeta-tionminusatmosphere interface and thus provides a viablerobust alternative for land ET estimation relying solely onstandard atmospheric forcing without the need for any soilor vegetation data The description in the next two para-graphs of the applied CR method parallels that of Ma and Szil-agyi (2019)
The generalized nonlinear version of the complement-ary relationship (GCR) by Brutsaert (2015) relates twoscaled variables x = Ew Ep
minus1 and y = E Epminus1 as
y = (2minus x) x2 (1)
Here E (mm dminus1) is the actual ET rate while Ep (mm dminus1)is the potential ET rate ie the ET rate of a plot-sized wetarea in a drying (ie not completely wet) environment typic-ally specified by the Penman (1948) equation as
Ep =∆ (RnminusG)∆+γ
+γ fu (elowastminus e)∆+γ
(2)
∆where (hPa degCminus1) is the slope of the saturation vapor pres-sure curve at air temperature T (degC) and γ is the psychromet-ric constant (hPa degCminus1) Rn and G are net radiation at theland surface and soil heat flux into the ground respectively
(the latter is typically negligible on a daily or longer timescale) in water equivalent of mm dminus1 The e term denotesthe saturation while e [= e(Td)] is the actual vapor pres-sure of the air [hPa their difference is called the vapor pres-sure deficit (VPD)] Td is the dewpoint temperature and fuis a wind function often formulated (eg Brutsaert 1982) as
fu = 026(1+054u2) (3)
where u2 (m sminus1) is the 2-m horizontal wind speedThe so-called wet-environment ET rate Ew (mm dminus1)
of a well-watered land surface having a regionally signific-ant areal extent is specified by the Priestley and Taylor(1972) equation
Ew = α∆(T w)∆(T w)+γ
(RnminusG) (4)
The dimensionless PriestleyminusTaylor (PT) coefficient αin Eq (4) normally attains values in the range of [11minus132](Morton 1983) For large-scale model applications of grid-ded data Szilagyi et al (2017) proposed a method of find-ing a value for α thus avoiding the need for any calibration
Very soon after the publication of the GCR Crago etal (2016) and Szilagyi et al (2017) introduced a necessaryscaling into Eq (1) by means of a time-varying wetnessindex w = (Epmax minus Ep)(Epmax minus Ew)minus1 to define the dimen-sionless variable X as X = wx by which Eq (1) keeps its ori-ginal nonlinear form ie
y = (2minusX)X2 (5)
Note that Eq (4) in Priestley and Taylor (1972) wasdesigned with measurements under wet environmental condi-tions therefore Δ should be evaluated at the wet-environ-ment air temperature Tw (degC) instead of the typical drying-environment air temperature T (Szilagyi and Jozsa 2008Szilagyi 2014) By making use of a mild vertical air temperat-ure gradient (de Vries 1959 Szilagyi and Jozsa 2009 Szil-agyi 2014) observable in wet environments (as Rn is con-sumed predominantly by the latent heat flux at the expenseof the sensible one and water representing an unusuallyhigh latent heat of the vaporization value found in nature)Tw can be approximated by the wet surface temperature Tws
(degC) Note that Tws may still be larger than the drying-environ-ment air temperature T when the air is close to saturationbut the same is not true for Tw due to the cooling effect ofevaporation In such cases the estimated value of Tw shouldbe capped by the actual air temperature T (Szilagyi 2014Szilagyi and Jozsa 2018) Szilagyi and Schepers (2014)demonstrated that Tws is independent of the size of the wetarea Thus Tws can be obtained through iterations from theBowen ratio (β) of the sensible and latent heat fluxes(Bowen 1926) when applied over a small plot-sized wetpatch (by the necessary assumption that the available energyfor the wet patch is close to that for the drying surface) thePenman equation is valid for ie
976 DYNAMIC SCALING IMPROVES EVAPORATION ESTIMATES VOLUME 37
β =RnminusGminusEp
Epasymp γ TwsminusT
elowast (Tws)minus elowast (Td) (6)
Epmax in the definition of X within Eq (5) is the maximumvalue that Ep can achieve (under unchanging availableenergy for the surface) during a complete dry-out (iewhen e becomes close to zero) of the environment ie
Epmax asymp∆(Tdry
)(RnminusG)
∆(Tdry
)+γ
+γ fuelowast
(Tdry
)∆(Tdry
)+γ (7)
in which Tdry (degC) is the so-achieved dry-environment air tem-perature The latter can be estimated from the (isoenthalp)adiabat of an air layer in contact with the drying surface (Szil-agyi 2018a) ie
Tdry = Twb+elowast (Twb)γ
(8)
where Twb (degC) is the wet-bulb temperature Twb can beobtained with the help of another iteration of writing out theBowen ratio for adiabatic changes (eg Szilagyi 2014)such as
γ (TwbminusT )elowast (Twb)minus elowast (Td)
= minus1 (9)
For a graphical illustration of the saturation vapor pres-sure curve the different temperatures and the related ETrates defined please refer to Ma and Szilagyi (2019) Thesame source also includes a brief description of how the CRevolved into Eq (5) over the past 40 years Additionally itplots selected historical CR functions over sample data andexplains how assigning a value of α is performed withoutresorting to any calibration A sensitivity analysis of the ETrates in Eq (5) to their atmospheric forcing is found in Maet al (2019)
While Brutsaert et al (2020) realized the necessity ofscaling x with the help of a static aridity index Crago et al(2016) Szilagyi et al (2017) Szilagyi (2018a b) Szilagyiand Jozsa (2018) Ma and Szilagyi (2019) and Ma et al(2019) performed one (and the same one) via a dynamic wet-ness index Whereas the wetness index assigns increasing val-ues to wetter environmental conditions the aridity indexdoes the same to drier ones Brutsaert et al (2020) did notinclude this dynamic wetness index method in their studyand therefore the present work was initiated to fill this gap
2 Model applications
The time-varying (and thus dynamic) scaling of x(Crago et al 2016 Szilagyi et al 2017) by the wetnessindex w [= (Epmax minus Ep)(Epmax minus Ew)minus1] in Eq (5) is neces-sary because the GCR of Brutsaert (2015) unrealistically pre-dicts near-zero land evaporation only when Ew in x itselfapproaches zero This is because the potential evaporationrate Ep in the denominator of x always assumes well-
bounded values due to physical limits on the range of its con-stituents ie net radiation soil heat flux air temperaturewind speed and VPD
An alternative static scaling of x by Brutsaert et al(2020) takes place via an adjustable parameter αc that actsas the PT-α value for wet environments Since Eq (4) canalso be written as Ew = αEe where Ee is the equilibrium evap-oration rate of Slatyer and Mcllroy (1961) thus the scaledvariable X becomes X = αc Ee Ep
minus1 = αcxαminus1 The spatiallyvariable (but constant through time at a given location)value of αc was then related to a long-term aridity index byBrutsaert et al (2020) with the latter defined as the ratio ofthe mean annual Ep and rain depth and globally calibratedwith the help of additional water-balance data requiring alto-gether seven parameters in highly nonlinear equations
Note that the X = wx scaling by Crago et al (2016) andSzilagyi et al (2017) requires only the forcing variables (RnG T u2 and VPD) without the need for external precipita-tionrain data which is significant as precipitation is pos-sibly the most uncertain meteorological variable to predictin climate models It is important to mention that w changeswith each value of x unlike αc As Szilagyi et al (2017)demonstrated a (temporally and spatially) constant value ofthe PT α necessary for x can be set by the sole use of the for-cing variables without resorting to additional water-bal-ance data of precipitation and stream discharge thus mak-ing the approach calibration-free on a large scale (Szilagyi2018b Ma et al 2019 Ma and Szilagyi 2019) where wet-environmental conditions necessary for setting the value ofα can likely be found Note that setting a constant value ofα is also necessary for Brutsaert et al (2020) in order toforce their spatially variable but temporally constant αc val-ues to reach a predetermined value of about 13 under wetconditions Despite almost half a century of research follow-ing publication of the Priestley and Taylor (1972) equationthere is still no consensus about what environmental vari-ables (atmospheric radiative andor surficial properties)and exactly how their spatial and temporal averaging influ-ence the value of the PT α Until compelling information isavailable on these variables a spatially and temporally con-stant α value may suffice for modeling purposes
As was found by Szilagyi (2018b) the value of the PTα depends slightly on the temporal averaging of the forcingdata ie whether or not the monthly values are long-termaverages [yielding α = 113 (Szilagyi et al 2017) and 115(Szilagyi 2018b) respectively] Therefore here it is testedif such is the case for the globally calibrated model of Brut-saert et al (2020) Namely if its performance is affected bysimilar changes (from long-term mean monthly values tomonthly values) in the inputforcing variables then some cau-tion must be exercised during its routine future applicationand recalibration of its seven parameters may be necessaryNote that besides the different scaling of x everything is thesame (including data requirements) in the two GCR modelversions applied here except that Δ in Ee is evaluated at themeasured air temperature in Brutsaert et al (2020) while the
SEPTEMBER 2020 SZILAGYI ET AL 977
same in Ew (= αEe) is evaluated at an estimated wet-environ-ment air temperature (Szilagyi et al 2017) explainedabove
Both model versions (denoted for brevity by GCR-statand GCR-dyn respectively) were tested over the contermin-ous United States first with long-term averages(1981minus2010) of monthly 32-km resolution North AmericanRegional Reanalysis (NARR) (Mesinger et al 2006) radi-ation and 10-m wind (u10) data [reduced to 2-m values viau2 = u10 (210)17 (Brutsaert 1982)] as well as with 42-kmPRISM air and dewpoint temperature values (Daly et al1994) followed by a continuous 37-year simulation ofmonthly values over the 1979minus2015 period The NARRdata were resampled to the PRISM grid by the nearest neigh-bor method Monthly soil heat fluxes were considered negli-gible Evaluation of the model estimates were performed bywater-balance estimates of basin-representative evaporationrates (Ewb) with the help of United States Geological Sur-vey two- and six-digit Hydrologic Unit Code (HUC2 andHUC6) basin (Fig 1) discharge data (Q) together withbasin-averaged PRISM precipitation (P) values as Ewb = P minusQ either on an annual (for trend analysis) or long-termmean annual basis The application of a simplified water bal-ance is justifiable as soil-moisture and groundwater-storagechanges are typically negligible over an annual (or longer)scale (Senay et al 2011) for catchments with no signific-ant trend in the groundwater-table elevation values
3 Results and discussion
With the long-term mean monthly data GCR-stat per-formed slightly but consistently better than GCR-dyn (Fig 2)reflected best in the NashminusSutcliffe model efficiency (NSE)and root-mean-square error (RMSE) values both modelsproviding unbiased basin-averaged mean annual ET estim-
ates This outcome is unsurprising as GCR-stat takes advant-age of measured precipitation while GCR-dyn does not
However the picture changes when switching fromlong-term mean monthly forcing values to monthly valuesin a continuous simulation (Fig 3) GCR-dyn with aslightly changed PT-α value [from 113 to 115 using the pro-cedure of Szilagyi et al (2017)] continues to produceunbiased estimates of basin-averaged mean annual evapora-tion values However the globally calibrated GCR-statmodel underestimates the water-balance-derived values byabout 10 [ie relative bias (RB) of minus009 for both basinscales] and produces reduced interannual variability (see thehorizontally elongated ldquocrosses rdquo for the HUC2 basins inFig 3) in comparison with GCR-dyn Reduced model per-formance of GCR-stat is also apparent in the long-term lin-ear tendencies (obtained as least-squares fitted linear trends)of the basin-averaged annual evaporation values (Fig 4) bybeing less effective than GCR-dyn in reproducing theobserved linear trends in the water-balance data
As on a mean-annual basis GCR-stat performs betterthan (with mean monthly values) or about equal to (in a con-tinuous simulation) GCR-dyn by exploiting precipitationdata (which on the watershed scale naturally serves as anupper bound for land ET) its weakened performance intrends can only be explained by the same reliance on thelong-term means of the precipitation (and Ep) rates in the(therefore) static αc values that will hinder its response toslow (decadal) changes in aridity The same problem can-not occur in GCR-dyn since its wetness index (w) isupdated in each step of calculations
The current GCR-dyn model has already been shown to(a) yield correlation coefficient values in excess of 09 withlocal measurements of latent heat fluxes across diverse cli-mates in China (Ma et al 2019) in spite of large differ-ences in spatial representativeness (ie grid resolution vsflux measurement footprint) and (b) outperform several popu-
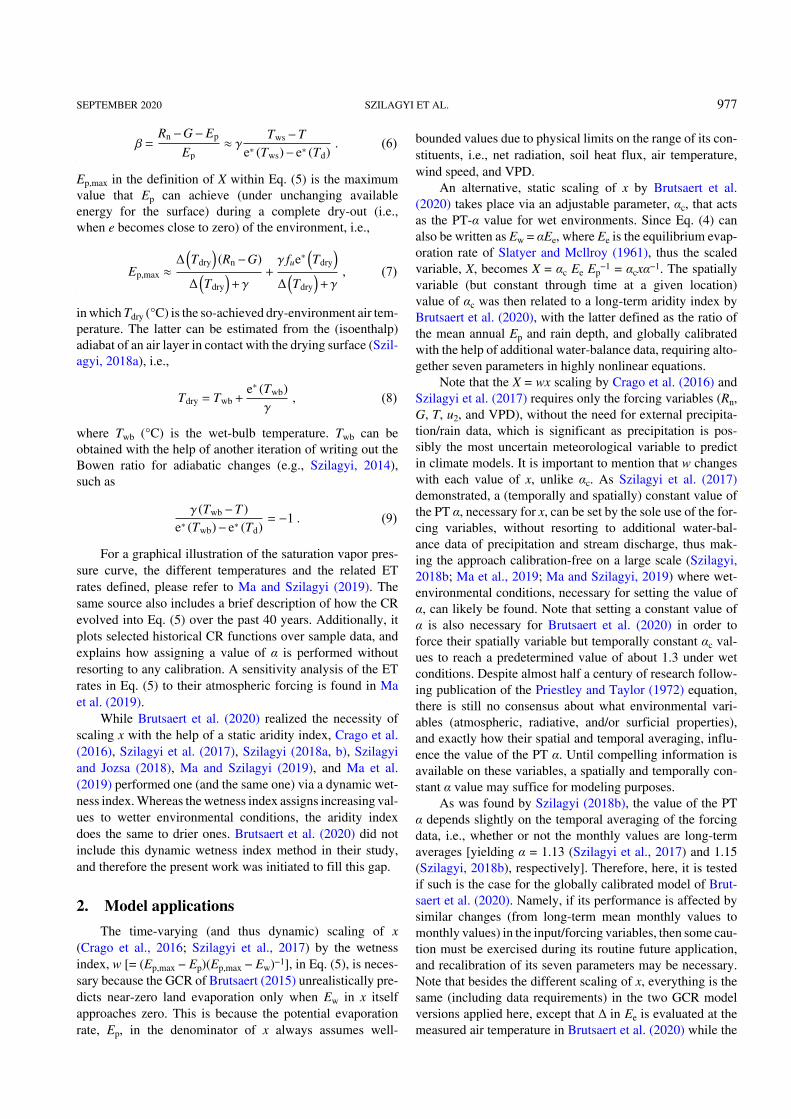
Fig 1 Distribution of the 18 HUC2 (outlined in red) and 334 HUC6 basinsacross the conterminous United States Seven HUC6 basins marked bygreen yielded outlying water-balance-derived evaporation estimates and wereleft out of model comparisons
978 DYNAMIC SCALING IMPROVES EVAPORATION ESTIMATES VOLUME 37
lar large-scale ET products over the conterminous UnitedStates (Ma and Szilagyi 2019) These products includethree LSMsmdashnamely Noah (Chen and Dudhia 2001) VIC(Liang et al 1994) and Mosaic (Koster and Suarez 1996)two reanalysis productsmdashnamely NCEP-II (Kanamitsu etal 2002) and ERA-Interim (Dee et al 2011) another tworemote-sensing based approachesmdashnamely GLEAM (Mir-alles et al 2011 Martens et al 2017) and PML (Zhang etal 2017 Leuning et al 2008) and a spatially upscalededdy-covariance measurement product FLUXNET-MTE(Jung et al 2011) In a comparison with water-balancedata GCR-dyn turns out to produce even better statistics onthe HUC2 scale than the spatially interpolated eddy-covari-
ance measured ET fluxes (Fig 5) which is remarkable froma calibration-free approach GCR-dyn especially excels inthe long-term linear tendency estimates of the HUC2 ETrates demonstrated by Figs 6 and 7 As FLUXNET-MTEemploys several temporally static variables for its spatial inter-polation method its ability to capture long-term trends issomewhat limited (Jung et al 2011) On the contrary thedynamic scaling inherent in GCR-dyn automatically adaptsto such trends and identifies them rather accurately
Among the different popular large-scale ET modelsGCR-dyn produces multi-year mean annual ET rates clos-est in its spatial distribution to those of FLUXNET-MTE(Fig 8) with a spatially averaged ET value almost identical
Fig 2 Regression plots of model estimates [ES (a c) from GCR-dyn EB (b d) from GCR-stat) against water-balance (Ewb)evaporation rates Long-term mean (1981minus2010) monthly values served as model forcing α = 113 in GCR-dyn (a c) NSENashminusSutcliffe model efficiency R linear correlation coefficient RB relative bias RMSE root-mean-square error (mm) SR ratioof standard deviations of the mean annual model and water-balance values
SEPTEMBER 2020 SZILAGYI ET AL 979
(both in its spatial average and standard deviation) to that ofGLEAM (Fig 8) which is a remote-sensing based approachNote that all models of the comparison (except GCR-dyn)rely on precipitation data as input which greatly aids ETestimations as on a regional scale and long-term basis precip-itation forms an upper bound for terrestrial ET rates plusit may drive any required soil-moisture water-balance calcula-tions
The spatial distribution of the modeled multi-year lin-ear ET trends is displayed in Fig 9 Again GCR-dyn pro-duces results closest in spatial distribution to FLUXNET-MTE in terms of the statistically significant trends and to
GLEAM in general For a more detailed discussion ofmodel comparisons (including additional model descrip-tions) please refer to Ma and Szilagyi (2019)
In conclusion it can be stated that the GCR of evapora-tion (Brutsaert 2015) is a very effective tool in land ET mod-eling as it requires only a few largely meteorological for-cing variables and avoids the need for detailed soil-mois-ture and land-cover information Although attractive as its(altogether seven) parameters have already been globally pre-calibrated the GCR model version (GCR-stat) of Brutsaertet al (2020) may however not perform optimally in estimat-ing long-term tendencies in basin-wide ET rates This is par-
Fig 3 Regression plots of model estimates [ES (a c) from GCR-dyn EB (b d) from GCR-stat] against water-balance (Ewb)evaporation rates Monthly (1979minus2015) values served as model forcing for the continuous simulation of monthly evaporationrates α = 115 in GCR-dyn (a c) The vertical and horizontal bars represent the standard deviation of the annual modeled andwater-balance HUC2 values respectively The large number of data points hinders a similar plot for the HUC6 values
980 DYNAMIC SCALING IMPROVES EVAPORATION ESTIMATES VOLUME 37
ticularly the case in comparison to an earlier calibration-free version (GCR-dyn) having no precalibrated parametervalues but requiring that its sole temporallyminusandspatiallyminusconstant parameter (ie the PT coefficient) be setusing the actual forcing data through a largely automatedmethod described in Szilagyi et al (2017) Since in a continu-ous monthly simulation both models performed about thesame while the GCR-dyn produced better long-term tenden-cies a dynamic scaling of Ew Ep
minus1 is recommended over a
static one in future applications of the GCR of evaporationAs has been recommended before (Szilagyi 2018b Szil-
agyi and Jozsa 2018 Ma and Szilagyi 2019) it is reiter-ated here that GCR-dyn due to its minimal data require-ment calibration-free nature and dynamic scaling may con-tinue to serve as a diagnostic and benchmarking tool formore complex and data-intensive models of terrestrial ETrates including calibrationverification (for past values) andreality checking (for future scenario values) of the LSM-
Fig 4 Regression plots of the linear trends (1979minus2015) in annual modeled [ES (a c) from GCR-dyn EB (b d) from GCR-stat]and water-balance values The vertical and horizontal bars represent the standard error in the trend-value estimates for themodeled and water-balance HUC2 values (a b) respectively The large number of data points hinders a similar plot of theHUC6 values (c d) RMSE is now in mm yrminus1
SEPTEMBER 2020 SZILAGYI ET AL 981
Fig 5 Regression plots of the HUC2-averaged multiyear mean annual ET rates (Emod) of GCR-dyn (a) andeight other (bminusi) popular large-scale ET models against the simplified water-balance (Ewb) estimatesTemporal averaging follows the availability of data displayed in parentheses for each product The length ofthe whiskers denotes the standard deviation of the HUC2-basin averaged annual ET values The long blue linerepresents a 11 relationship while the least-squares fitted linear relationships are shown in maroon color(after Ma and Szilagyi 2019)
Fig 6 Regression plots of the linear trend values (mm yrminus1) in modeled HUC2-averaged annual ET sums(Emod) against those in Ewb over 1979minus2015 The length of the whiskers denotes the standard error in theestimated slope value The long blue line represents a 11 relationship while the least-squares fitted linearrelationships are shown in maroon color (after Ma and Szilagyi 2019)
982 DYNAMIC SCALING IMPROVES EVAPORATION ESTIMATES VOLUME 37
Fig 7 Regression plots of the linear trend values (mm yrminus1) in GLEAM- PML- and FLUXNET-MTE-modeled (aminusc) HUC2-averaged annual ET sums (Emod) against those in Ewb over the different modelperiods (shown in parentheses) For comparison regressions for the GCR-dyn ET values over the sameperiods are also displayed (dminusf) The length of the whiskers denotes the standard error in the estimatedslope value The long blue line represents a 11 relationship while the least-squares fitted linearrelationships are shown in maroon color (after Ma and Szilagyi 2019)
Fig 8 Spatial distribution of the multiyear (1979minus2015) mean annual ET (mm) rates (Emod) by GCR-dyn andeight other popular large-scale ET models (aminusi) and their spatially averaged (j) values plusminus standarddeviations (after Ma and Szilagyi 2019) The 18 HUC2 basins are also outlined
SEPTEMBER 2020 SZILAGYI ET AL 983
predicted ET rates of existing regional and general circula-tion models
Acknowledgements All data used in this study can beaccessed from the following websites NARR data wwwesrlnoaagovpsddatagriddeddatanarrhtml PRISM temperaturehumidity and precipitation prismoregonstateedu USGS HUC2and HUC6 runoff waterwatchusgsgov id=wwds_runoff NoahET data discgsfcnasagovdatasetsNLDAS_NOAH0125_M_V002summarykeywords=NLDAS VIC ET data discgsfcxnasagovdatasetsNLDAS_VIC0125_M_V002summarykeywords=NLDAS Mosaic ET data discgsfcnasagovdatasetsNLDAS_MOS0125_M_V002summarykeywords=NLDAS NCEP-II ETdata wwwesrlnoaagovpsddatagriddeddatancepreanalysis2html ERA-Interim ET data wwwecmwfintenforecastsdatasetsreanalysis-datasetsera-interim GLEAM ET data httpgleameuhome PML ET data datacsiroaudaplandingpagepid=csiro17375ampv= 202ampd=true FLUXNET-MTE ET data climate-dataguideucareduclimate-datafluxnet-mte-multi-tree-ensembleThe GCR-dyn modeled ET rates and the HUC2- and HUC6-aver-aged Ewb P Q data are available from httpsdigitalcommonsunledunatrespapers986 This research was supported by a BME-Water Sciences and Disaster Prevention FIKP grant of EMMI(BME FIKP-VIZ)
Open Access This article is distributed under the terms of thecreative commons attribution 40 international license (httpcreat-ivecommonsorglicensesby40) which permits unrestricted usedistribution and reproduction in any medium provided you giveappropriate credit to the original author(s) and the source providea link to the creative commons license and indicate if changeswere made
REFERENCES
Baldocchi D D 2020 How eddy covariance flux measure-ments have contributed to our understanding of GlobalChange Biology Global Change Biol 26 242minus260httpsdoiorg101111gcb14807
Biederman J A and Coauthors 2016 Terrestrial carbon bal-ance in a drier world The effects of water availability in south-western North America Global Change Biol 221867minus1879 httpsdoiorg101111gcb13222
Bouchet R J 1963 Evapotranspiration reacuteelle et potentielle signi-fication climatique Int Assoc Sci Hydrol 62 134minus142
Bowen I S 1926 The ratio of heat losses by conduction and byevaporation from any water surface Phys Rev 27779minus787 httpsdoiorg101103PhysRev27779
Brutsaert W 1982 Evaporation into the Atmosphere Theory His-tory and Applications Springer 302 pp httpsdoiorg101007978-94-017-1497-6
Brutsaert W 2015 A generalized complementary principle withphysical constraints for land- surface evaporation WaterResour Res 51 8087minus8093 httpsdoiorg1010022015WR017720
Brutsaert W L Cheng and L Zhang 2020 Spatial distributionof global landscape evaporation in the early twenty-first cen-tury by means of a generalized complementary approach JHydromet 21 287minus298 httpsdoiorg101175JHM-D-19-02081
Chen F and J Dudhia 2001 Coupling an advanced land sur-face‐hydrology model with the Penn State‐NCAR MM5modeling system Part I Model implementation and sensitiv-ity Mon Wea Rev 129(4) 569minus585 httpsdoiorg1011751520-0493(2001)129lt0569CAALSHgt20CO2
Condon L E A L Atchley and R M Maxwell 2020 Evapo-transpiration depletes groundwater under warming over the
Fig 9 Spatial distribution of the linear tendencies (mm yrminus1) in annual ET sums of GCR-dyn and eight other popular large-scale ET products The stippling denotes trends that are statistically significant (p lt 5) in the Studentrsquos t-test (after Ma andSzilagyi 2019)
984 DYNAMIC SCALING IMPROVES EVAPORATION ESTIMATES VOLUME 37
contiguous United States Nature Comm 11 873httpsdoiorg101038s41467-020-14688-0
Crago R J Szilagyi R Qualls and J Huntington 2016 Rescal-ing the complementary relationship for land surface evapora-tion Water Resour Res 52 8461minus8471 httpsdoiorg1010022016WR019753
Daly C R P Neilson and D L Phillips 1994 A statistical-topo-graphic model for mapping climatological precipitation overmountainous terrain J Appl Meteorol 33 140minus158httpsdoiorg1011751520-0450(1994)033lt0140AST-MFMgt20CO2
de Vries D A 1959 The influence of irrigation on the energybalance and the climate near the ground J Meteorol 16256minus270 httpsdoiorg1011751520-0469(1959)016lt0256TIOIOTgt20CO2
Dee D P and Coauthors 2011 The ERA-Interim reanalysis Con-figuration and performance of the data assimilation systemQuart J Roy Meteorol Soc 137(656) 553minus597httpsdoiorg101002qj828
Fang H L F Baret S Plummer and G Schaepman-Strub2019 An overview of global leaf area Index (LAI) Meth-ods products validation and applications Rev Geophys57 739minus799 httpsdoiorg1010292018rg000608
Feng X M and Coauthors 2016 Revegetation in ChinarsquosLoess Plateau is approaching sustainable water resource lim-its Nat Clim Change 6 1019minus1022 httpsdoiorg101038nclimate3092
Fisher J B and Coauthors 2017 The future of evapotranspira-tion Global requirements for ecosystem functioning car-bon and climate feedbacks agricultural management andwater resources Water Resour Res 53 2618minus2626httpsdoiorg1010022016wr020175
Gutman G and A Ignatov 1998 The derivation of the greenvegetation fraction from NOAAAVHRR data for use innumerical weather prediction models Int J Remote Sens19 1533minus1543 httpsdoiorg101080014311698215333
Jung M and Coauthors 2011 Global patterns of land-atmo-sphere fluxes of carbon dioxide latent heat and sensibleheat derived from eddy covariance satellite and meteorolo-gical observations J Geophys Res 116 G00J07httpsdoiorg1010292010jg001566
Kanamitsu M W Ebisuzaki J Woollen S-K Yang J JHnilo M Fiorino and G L Potter 2002 NCEP‐ DOEAMIP-II reanalysis (R-2) Bull Amer Meteorol Soc 83(11) 1631minus1644 httpsdoiorg101175BAMS-83-11-1631
Koster R D and M J Suarez 1996 Energy and water balancecalculations in the Mosaic LSM NASA Technical Memor-andum 104606
Leuning R Y Q Zhang A Rajaud H Cleugh and K Tu2008 A simple surface conductance model to estimateregional evaporation using MODIS leaf area index and thePenman-Monteith equation Water Resour Res 44W10419 httpsdoiorg1010292007WR006562
Li J D F Chen G Zhang M Barlage Y J Gan Y F Xinand C Wang 2018 Impacts of land cover and soil textureuncertainty on land model simulations over the CentralTibetan Plateau J Adv Model Earth Syst 10 2121minus2146httpsdoiorg1010292018MS001377
Liang X D P Lettenmaier E F Wood and S J Burges 1994A simple hydrologically based model of land surface waterand energy fluxes for general circulation models J Geo-phys Res 99(D7) 14415minus14428 httpsdoiorg101029
94JD00483
Liu W B L Wang J Zhou Y Z Li F B Sun G B Fu X PLi and Y-F Sang 2016 A worldwide evaluation of basin-scale evapotranspiration estimates against the water balancemethod J Hydrol 538 82minus95 httpsdoiorg101016jjhy-drol201604006
Ma N and J Szilagyi 2019 The CR of evaporation A calibra-tion-free diagnostic and benchmarking tool for large-scale ter-restrial evapotranspiration modeling Water Resour Res55(8) 7246minus7274 httpsdoiorg1010292019WR024867
Ma N G-Y Niu Y L Xia X T Cai Y S Zhang Y M Maand Y H Fang 2017 A systematic evaluation of Noah-MPin simulating land-atmosphere energy water and carbonexchanges over the continental United States J GeophysRes 122(22) 12245minus12268 httpsdoiorg1010022017JD027597
Ma N J Szilagyi Y S Zhang and W B Liu 2019 Comple-mentary-relationship-based modeling of terrestrial evapotran-spiration across China during 1982-2012 Validations and spa-tiotemporal analyses J Geophys Res 124 4326minus4351httpsdoiorg1010292018JD029850
Martens B and Coauthors 2017 GLEAM v3 Satellite-basedland evaporation and root-zone soil moisture Geosci ModelDev 10(5) 1903minus1925 httpsdoiorg105194gmd-10-1903-2017
Mesinger F and Coauthors 2006 North American regional reanal-ysis Bull Amer Meteorol Soc 87 343minus360 httpsdoiorg101175BAMS-87-3-343
Miralles D G T R H Holmes R A M De Jeu J H Gash AG C A Meesters and A J Dolman 2011 Global land-sur-face evaporation estimated from satellite-based observa-tions Hydrol Earth Syst Sci 15(2) 453minus469 httpsdoiorg105194hess-15-453-2011
Morton F I 1983 Operational estimates of areal evapotranspira-tion and their significance to the science and practice of hydro-logy J Hydrol 66 1minus76 httpsdoiorg1010160022-1694(83)90177-4
Mueller B and Coauthors 2011 Evaluation of global observa-tions-based evapotranspiration datasets and IPCC AR4 simula-tions Geophys Res Lett 38 L06402 httpsdoiorg1010292010gl046230
Pendergrass A G and Coauthors 2020 Flash droughts presenta new challenge for subseasonal-to-seasonal prediction NatClim Change 10 191minus199 httpsdoiorg101038s41558-020-0709-0
Penman H L 1948 Natural evaporation from open water baresoil and grass Proc Royal Soc A Math Phys Engin Sci193 120minus145 httpsdoiorg101098rspa19480037
Priestley C H B and R J Taylor 1972 On the assessment ofsurface heat flux and evaporation using large-scale paramet-ers Mon Wea Rev 100(2) 81minus92 httpsdoiorg1011751520-0493(1972)100lt0081OTAOSHgt23CO2
Senay G B S Leake P L Nagler G Artan J Dickinson J TCordova and E P Glenn 2011 Estimating basin scale evapo-transpiration (ET) by water balance and remote sensing meth-ods Hydrol Process 25(26) 4037minus4049 httpsdoiorg101002hyp8379
Seneviratne S I D Luumlthi M Litschi and C Schaumlr 2006Land-atmosphere coupling and climate change in EuropeNature 443 205minus209 httpsdoiorg101038nature05095
Slatyer R O and I C Mcllroy 1961 Practical Microclimato-logy CSIRO 310 pp
SEPTEMBER 2020 SZILAGYI ET AL 985
Szilagyi J 2014 Temperature corrections in the Priestley-Taylor equation of evaporation J Hydrol 519 455minus464httpsdoiorg101016jjhydrol201407040
Szilagyi J 2018a Anthropogenic hydrological cycle disturb-ance at a regional scale State-wide evapotranspirationtrends (1979minus2015) across Nebraska USA J Hydrol 557600minus612 httpsdoiorg101016jjhydrol201712062
Szilagyi J 2018b A calibration-free robust estimation ofmonthly land surface evapotranspiration rates for contin-ental-scale hydrology Hydrol Res 49(3) 648minus657httpsdoiorg102166nh2017078
Szilagyi J and J Jozsa 2008 New findings about the comple-mentary relationship-based evaporation estimation methodsJ Hydrol 354 171minus186 httpsdoiorg101016jjhydrol200803008
Szilagyi J and J Jozsa 2009 Analytical solution of the coupled2-D turbulent heat and vapor transport equations and the com-plementary relationship of evaporation J Hydrol 37261minus67 httpsdoiorg101016jjhydrol200903035
Szilagyi J and A Schepers 2014 Coupled heat and vapor trans-port The thermostat effect of a freely evaporating land sur-face Geophys Res Lett 41 435minus441 httpsdoiorg1010022013GL058979
Szilagyi J and J Jozsa 2018 Evapotranspiration trends (1979minus2015) in the Central Valley of California USA Contrastingtendencies during 1981minus2007 Water Resour Res 545620minus5635 httpsdoiorg1010292018WR022704
Szilagyi J R Crago and R Qualls 2017 A calibration-free for-mulation of the complementary relationship of evaporationfor continental-scale hydrology J Geophys Res 122264minus278 httpsdoiorg1010022016jd025611
Ukkola A M M G De Kauwe A J Pitman M J Best GAbramowitz V Haverd M Decker and N Haughton
2016 Land surface models systematically overestimate theintensity duration and magnitude of seasonal-scale evaporat-ive droughts Environ Res Lett 11(10) 104012 httpsdoiorg1010881748-93261110104012
Velpuri N M G B Senay R K Singh S Bohms and J PVerdin 2013 A comprehensive evaluation of two MODISevapotranspiration products over the conterminous UnitedStates Using point and gridded FLUXNET and water bal-ance ET Remote Sens Environ 139 35minus49 httpsdoiorg101016jrse201307013
Vinukollu R K E F Wood C R Ferguson and J B Fisher2011 Global estimates of evapotranspiration for climate stud-ies using multi-sensor remote sensing data Evaluation ofthree process-based approaches Remote Sens Environ115 801minus823 httpsdoiorg101016jrse201011006
Wang K C and R E Dickinson 2012 A review of global ter-restrial evapotranspiration Observation modeling climato-logy and climatic variability Rev Geophys 50 RG2005httpsdoiorg1010292011rg000373
Xia Y L and D Coauthors 2012 Continental-scale water andenergy flux analysis and validation for the North AmericanLand Data Assimilation System project phase 2(NLDAS-2)1 Intercomparison and application of model products J Geop-hys Res 117 D03109 httpsdoiorg1010292011jd016048
Zhang Y Q F H S Chiew J Pentildea-Arancibia F B Sun H XLi and R Leuning 2017 Global variation of transpirationand soil evaporation and the role of their major climatedrivers J Geophys Res 122 6868minus6881 httpsdoiorg1010022017JD027025
Zheng H and Z-L Yang 2016 Effects of soil-type datasets onregional terrestrial water cycle simulations under different cli-matic regimes J Geophys Res 121 14387minus14402httpsdoiorg1010022016JD025187
986 DYNAMIC SCALING IMPROVES EVAPORATION ESTIMATES VOLUME 37

While the globally distributed eddy-covariance flux towershave contributed significantly to our knowledge of ETacross a wide range of ecosystems [see a recent review by Bal-docchi (2020)] the spatiotemporal variation of global ETand its response to the changing climate remains highly uncer-tain (Mueller et al 2011 Liu et al 2016) because the estima-tion of long-term spatially resolved ET is yet laden by diffi-culties in parameterizing the biophysical processes (egroot water uptake stomatal resistance and its response toCO2 concentration changes) that control ET in the currentland surface models (LSMs) (Ukkola et al 2016 Ma et al2017) and remote sensing algorithms (Vinukollu et al2011 Velpuri et al 2013) In addition to possible modelstructural errors the uncertainties in the estimated ET canalso arise from errors in their gridded vegetation (Fang etal 2019) and soil (Zheng and Yang 2016) parameters dueto the large degree of complexityheterogeneity found in ter-restrial ecosystems For example most LSMs withinNLDAS-2 (the North American Land Data Assimilation Sys-tem phase 2) still utilize the NOAA normalized differencevegetation index data developed by Gutman and Ignatov(1998) on a five-year-mean monthly basis without any interan-nual variation as input (Xia et al 2012) failing to reason-ably capture the impact of vegetation changes on ETBesides a recent sensitivity study by Li et al (2018) demon-strated that the Noah-MP LSM cannot always capture theeffect of spatial changes in forest andor soil types on the sim-ulated ET because of the inherent uncertainties in multipleland cover and soil texture data
As an alternative the complementary relationship (CR)(Bouchet 1963) of evaporation inherently accounts for thedynamic feedback mechanisms found in the soilminusvegeta-tionminusatmosphere interface and thus provides a viablerobust alternative for land ET estimation relying solely onstandard atmospheric forcing without the need for any soilor vegetation data The description in the next two para-graphs of the applied CR method parallels that of Ma and Szil-agyi (2019)
The generalized nonlinear version of the complement-ary relationship (GCR) by Brutsaert (2015) relates twoscaled variables x = Ew Ep
minus1 and y = E Epminus1 as
y = (2minus x) x2 (1)
Here E (mm dminus1) is the actual ET rate while Ep (mm dminus1)is the potential ET rate ie the ET rate of a plot-sized wetarea in a drying (ie not completely wet) environment typic-ally specified by the Penman (1948) equation as
Ep =∆ (RnminusG)∆+γ
+γ fu (elowastminus e)∆+γ
(2)
∆where (hPa degCminus1) is the slope of the saturation vapor pres-sure curve at air temperature T (degC) and γ is the psychromet-ric constant (hPa degCminus1) Rn and G are net radiation at theland surface and soil heat flux into the ground respectively
(the latter is typically negligible on a daily or longer timescale) in water equivalent of mm dminus1 The e term denotesthe saturation while e [= e(Td)] is the actual vapor pres-sure of the air [hPa their difference is called the vapor pres-sure deficit (VPD)] Td is the dewpoint temperature and fuis a wind function often formulated (eg Brutsaert 1982) as
fu = 026(1+054u2) (3)
where u2 (m sminus1) is the 2-m horizontal wind speedThe so-called wet-environment ET rate Ew (mm dminus1)
of a well-watered land surface having a regionally signific-ant areal extent is specified by the Priestley and Taylor(1972) equation
Ew = α∆(T w)∆(T w)+γ
(RnminusG) (4)
The dimensionless PriestleyminusTaylor (PT) coefficient αin Eq (4) normally attains values in the range of [11minus132](Morton 1983) For large-scale model applications of grid-ded data Szilagyi et al (2017) proposed a method of find-ing a value for α thus avoiding the need for any calibration
Very soon after the publication of the GCR Crago etal (2016) and Szilagyi et al (2017) introduced a necessaryscaling into Eq (1) by means of a time-varying wetnessindex w = (Epmax minus Ep)(Epmax minus Ew)minus1 to define the dimen-sionless variable X as X = wx by which Eq (1) keeps its ori-ginal nonlinear form ie
y = (2minusX)X2 (5)
Note that Eq (4) in Priestley and Taylor (1972) wasdesigned with measurements under wet environmental condi-tions therefore Δ should be evaluated at the wet-environ-ment air temperature Tw (degC) instead of the typical drying-environment air temperature T (Szilagyi and Jozsa 2008Szilagyi 2014) By making use of a mild vertical air temperat-ure gradient (de Vries 1959 Szilagyi and Jozsa 2009 Szil-agyi 2014) observable in wet environments (as Rn is con-sumed predominantly by the latent heat flux at the expenseof the sensible one and water representing an unusuallyhigh latent heat of the vaporization value found in nature)Tw can be approximated by the wet surface temperature Tws
(degC) Note that Tws may still be larger than the drying-environ-ment air temperature T when the air is close to saturationbut the same is not true for Tw due to the cooling effect ofevaporation In such cases the estimated value of Tw shouldbe capped by the actual air temperature T (Szilagyi 2014Szilagyi and Jozsa 2018) Szilagyi and Schepers (2014)demonstrated that Tws is independent of the size of the wetarea Thus Tws can be obtained through iterations from theBowen ratio (β) of the sensible and latent heat fluxes(Bowen 1926) when applied over a small plot-sized wetpatch (by the necessary assumption that the available energyfor the wet patch is close to that for the drying surface) thePenman equation is valid for ie
976 DYNAMIC SCALING IMPROVES EVAPORATION ESTIMATES VOLUME 37
β =RnminusGminusEp
Epasymp γ TwsminusT
elowast (Tws)minus elowast (Td) (6)
Epmax in the definition of X within Eq (5) is the maximumvalue that Ep can achieve (under unchanging availableenergy for the surface) during a complete dry-out (iewhen e becomes close to zero) of the environment ie
Epmax asymp∆(Tdry
)(RnminusG)
∆(Tdry
)+γ
+γ fuelowast
(Tdry
)∆(Tdry
)+γ (7)
in which Tdry (degC) is the so-achieved dry-environment air tem-perature The latter can be estimated from the (isoenthalp)adiabat of an air layer in contact with the drying surface (Szil-agyi 2018a) ie
Tdry = Twb+elowast (Twb)γ
(8)
where Twb (degC) is the wet-bulb temperature Twb can beobtained with the help of another iteration of writing out theBowen ratio for adiabatic changes (eg Szilagyi 2014)such as
γ (TwbminusT )elowast (Twb)minus elowast (Td)
= minus1 (9)
For a graphical illustration of the saturation vapor pres-sure curve the different temperatures and the related ETrates defined please refer to Ma and Szilagyi (2019) Thesame source also includes a brief description of how the CRevolved into Eq (5) over the past 40 years Additionally itplots selected historical CR functions over sample data andexplains how assigning a value of α is performed withoutresorting to any calibration A sensitivity analysis of the ETrates in Eq (5) to their atmospheric forcing is found in Maet al (2019)
While Brutsaert et al (2020) realized the necessity ofscaling x with the help of a static aridity index Crago et al(2016) Szilagyi et al (2017) Szilagyi (2018a b) Szilagyiand Jozsa (2018) Ma and Szilagyi (2019) and Ma et al(2019) performed one (and the same one) via a dynamic wet-ness index Whereas the wetness index assigns increasing val-ues to wetter environmental conditions the aridity indexdoes the same to drier ones Brutsaert et al (2020) did notinclude this dynamic wetness index method in their studyand therefore the present work was initiated to fill this gap
2 Model applications
The time-varying (and thus dynamic) scaling of x(Crago et al 2016 Szilagyi et al 2017) by the wetnessindex w [= (Epmax minus Ep)(Epmax minus Ew)minus1] in Eq (5) is neces-sary because the GCR of Brutsaert (2015) unrealistically pre-dicts near-zero land evaporation only when Ew in x itselfapproaches zero This is because the potential evaporationrate Ep in the denominator of x always assumes well-
bounded values due to physical limits on the range of its con-stituents ie net radiation soil heat flux air temperaturewind speed and VPD
An alternative static scaling of x by Brutsaert et al(2020) takes place via an adjustable parameter αc that actsas the PT-α value for wet environments Since Eq (4) canalso be written as Ew = αEe where Ee is the equilibrium evap-oration rate of Slatyer and Mcllroy (1961) thus the scaledvariable X becomes X = αc Ee Ep
minus1 = αcxαminus1 The spatiallyvariable (but constant through time at a given location)value of αc was then related to a long-term aridity index byBrutsaert et al (2020) with the latter defined as the ratio ofthe mean annual Ep and rain depth and globally calibratedwith the help of additional water-balance data requiring alto-gether seven parameters in highly nonlinear equations
Note that the X = wx scaling by Crago et al (2016) andSzilagyi et al (2017) requires only the forcing variables (RnG T u2 and VPD) without the need for external precipita-tionrain data which is significant as precipitation is pos-sibly the most uncertain meteorological variable to predictin climate models It is important to mention that w changeswith each value of x unlike αc As Szilagyi et al (2017)demonstrated a (temporally and spatially) constant value ofthe PT α necessary for x can be set by the sole use of the for-cing variables without resorting to additional water-bal-ance data of precipitation and stream discharge thus mak-ing the approach calibration-free on a large scale (Szilagyi2018b Ma et al 2019 Ma and Szilagyi 2019) where wet-environmental conditions necessary for setting the value ofα can likely be found Note that setting a constant value ofα is also necessary for Brutsaert et al (2020) in order toforce their spatially variable but temporally constant αc val-ues to reach a predetermined value of about 13 under wetconditions Despite almost half a century of research follow-ing publication of the Priestley and Taylor (1972) equationthere is still no consensus about what environmental vari-ables (atmospheric radiative andor surficial properties)and exactly how their spatial and temporal averaging influ-ence the value of the PT α Until compelling information isavailable on these variables a spatially and temporally con-stant α value may suffice for modeling purposes
As was found by Szilagyi (2018b) the value of the PTα depends slightly on the temporal averaging of the forcingdata ie whether or not the monthly values are long-termaverages [yielding α = 113 (Szilagyi et al 2017) and 115(Szilagyi 2018b) respectively] Therefore here it is testedif such is the case for the globally calibrated model of Brut-saert et al (2020) Namely if its performance is affected bysimilar changes (from long-term mean monthly values tomonthly values) in the inputforcing variables then some cau-tion must be exercised during its routine future applicationand recalibration of its seven parameters may be necessaryNote that besides the different scaling of x everything is thesame (including data requirements) in the two GCR modelversions applied here except that Δ in Ee is evaluated at themeasured air temperature in Brutsaert et al (2020) while the
SEPTEMBER 2020 SZILAGYI ET AL 977
same in Ew (= αEe) is evaluated at an estimated wet-environ-ment air temperature (Szilagyi et al 2017) explainedabove
Both model versions (denoted for brevity by GCR-statand GCR-dyn respectively) were tested over the contermin-ous United States first with long-term averages(1981minus2010) of monthly 32-km resolution North AmericanRegional Reanalysis (NARR) (Mesinger et al 2006) radi-ation and 10-m wind (u10) data [reduced to 2-m values viau2 = u10 (210)17 (Brutsaert 1982)] as well as with 42-kmPRISM air and dewpoint temperature values (Daly et al1994) followed by a continuous 37-year simulation ofmonthly values over the 1979minus2015 period The NARRdata were resampled to the PRISM grid by the nearest neigh-bor method Monthly soil heat fluxes were considered negli-gible Evaluation of the model estimates were performed bywater-balance estimates of basin-representative evaporationrates (Ewb) with the help of United States Geological Sur-vey two- and six-digit Hydrologic Unit Code (HUC2 andHUC6) basin (Fig 1) discharge data (Q) together withbasin-averaged PRISM precipitation (P) values as Ewb = P minusQ either on an annual (for trend analysis) or long-termmean annual basis The application of a simplified water bal-ance is justifiable as soil-moisture and groundwater-storagechanges are typically negligible over an annual (or longer)scale (Senay et al 2011) for catchments with no signific-ant trend in the groundwater-table elevation values
3 Results and discussion
With the long-term mean monthly data GCR-stat per-formed slightly but consistently better than GCR-dyn (Fig 2)reflected best in the NashminusSutcliffe model efficiency (NSE)and root-mean-square error (RMSE) values both modelsproviding unbiased basin-averaged mean annual ET estim-
ates This outcome is unsurprising as GCR-stat takes advant-age of measured precipitation while GCR-dyn does not
However the picture changes when switching fromlong-term mean monthly forcing values to monthly valuesin a continuous simulation (Fig 3) GCR-dyn with aslightly changed PT-α value [from 113 to 115 using the pro-cedure of Szilagyi et al (2017)] continues to produceunbiased estimates of basin-averaged mean annual evapora-tion values However the globally calibrated GCR-statmodel underestimates the water-balance-derived values byabout 10 [ie relative bias (RB) of minus009 for both basinscales] and produces reduced interannual variability (see thehorizontally elongated ldquocrosses rdquo for the HUC2 basins inFig 3) in comparison with GCR-dyn Reduced model per-formance of GCR-stat is also apparent in the long-term lin-ear tendencies (obtained as least-squares fitted linear trends)of the basin-averaged annual evaporation values (Fig 4) bybeing less effective than GCR-dyn in reproducing theobserved linear trends in the water-balance data
As on a mean-annual basis GCR-stat performs betterthan (with mean monthly values) or about equal to (in a con-tinuous simulation) GCR-dyn by exploiting precipitationdata (which on the watershed scale naturally serves as anupper bound for land ET) its weakened performance intrends can only be explained by the same reliance on thelong-term means of the precipitation (and Ep) rates in the(therefore) static αc values that will hinder its response toslow (decadal) changes in aridity The same problem can-not occur in GCR-dyn since its wetness index (w) isupdated in each step of calculations
The current GCR-dyn model has already been shown to(a) yield correlation coefficient values in excess of 09 withlocal measurements of latent heat fluxes across diverse cli-mates in China (Ma et al 2019) in spite of large differ-ences in spatial representativeness (ie grid resolution vsflux measurement footprint) and (b) outperform several popu-
Fig 1 Distribution of the 18 HUC2 (outlined in red) and 334 HUC6 basinsacross the conterminous United States Seven HUC6 basins marked bygreen yielded outlying water-balance-derived evaporation estimates and wereleft out of model comparisons
978 DYNAMIC SCALING IMPROVES EVAPORATION ESTIMATES VOLUME 37
lar large-scale ET products over the conterminous UnitedStates (Ma and Szilagyi 2019) These products includethree LSMsmdashnamely Noah (Chen and Dudhia 2001) VIC(Liang et al 1994) and Mosaic (Koster and Suarez 1996)two reanalysis productsmdashnamely NCEP-II (Kanamitsu etal 2002) and ERA-Interim (Dee et al 2011) another tworemote-sensing based approachesmdashnamely GLEAM (Mir-alles et al 2011 Martens et al 2017) and PML (Zhang etal 2017 Leuning et al 2008) and a spatially upscalededdy-covariance measurement product FLUXNET-MTE(Jung et al 2011) In a comparison with water-balancedata GCR-dyn turns out to produce even better statistics onthe HUC2 scale than the spatially interpolated eddy-covari-
ance measured ET fluxes (Fig 5) which is remarkable froma calibration-free approach GCR-dyn especially excels inthe long-term linear tendency estimates of the HUC2 ETrates demonstrated by Figs 6 and 7 As FLUXNET-MTEemploys several temporally static variables for its spatial inter-polation method its ability to capture long-term trends issomewhat limited (Jung et al 2011) On the contrary thedynamic scaling inherent in GCR-dyn automatically adaptsto such trends and identifies them rather accurately
Among the different popular large-scale ET modelsGCR-dyn produces multi-year mean annual ET rates clos-est in its spatial distribution to those of FLUXNET-MTE(Fig 8) with a spatially averaged ET value almost identical
Fig 2 Regression plots of model estimates [ES (a c) from GCR-dyn EB (b d) from GCR-stat) against water-balance (Ewb)evaporation rates Long-term mean (1981minus2010) monthly values served as model forcing α = 113 in GCR-dyn (a c) NSENashminusSutcliffe model efficiency R linear correlation coefficient RB relative bias RMSE root-mean-square error (mm) SR ratioof standard deviations of the mean annual model and water-balance values
SEPTEMBER 2020 SZILAGYI ET AL 979
(both in its spatial average and standard deviation) to that ofGLEAM (Fig 8) which is a remote-sensing based approachNote that all models of the comparison (except GCR-dyn)rely on precipitation data as input which greatly aids ETestimations as on a regional scale and long-term basis precip-itation forms an upper bound for terrestrial ET rates plusit may drive any required soil-moisture water-balance calcula-tions
The spatial distribution of the modeled multi-year lin-ear ET trends is displayed in Fig 9 Again GCR-dyn pro-duces results closest in spatial distribution to FLUXNET-MTE in terms of the statistically significant trends and to
GLEAM in general For a more detailed discussion ofmodel comparisons (including additional model descrip-tions) please refer to Ma and Szilagyi (2019)
In conclusion it can be stated that the GCR of evapora-tion (Brutsaert 2015) is a very effective tool in land ET mod-eling as it requires only a few largely meteorological for-cing variables and avoids the need for detailed soil-mois-ture and land-cover information Although attractive as its(altogether seven) parameters have already been globally pre-calibrated the GCR model version (GCR-stat) of Brutsaertet al (2020) may however not perform optimally in estimat-ing long-term tendencies in basin-wide ET rates This is par-
Fig 3 Regression plots of model estimates [ES (a c) from GCR-dyn EB (b d) from GCR-stat] against water-balance (Ewb)evaporation rates Monthly (1979minus2015) values served as model forcing for the continuous simulation of monthly evaporationrates α = 115 in GCR-dyn (a c) The vertical and horizontal bars represent the standard deviation of the annual modeled andwater-balance HUC2 values respectively The large number of data points hinders a similar plot for the HUC6 values
980 DYNAMIC SCALING IMPROVES EVAPORATION ESTIMATES VOLUME 37
ticularly the case in comparison to an earlier calibration-free version (GCR-dyn) having no precalibrated parametervalues but requiring that its sole temporallyminusandspatiallyminusconstant parameter (ie the PT coefficient) be setusing the actual forcing data through a largely automatedmethod described in Szilagyi et al (2017) Since in a continu-ous monthly simulation both models performed about thesame while the GCR-dyn produced better long-term tenden-cies a dynamic scaling of Ew Ep
minus1 is recommended over a
static one in future applications of the GCR of evaporationAs has been recommended before (Szilagyi 2018b Szil-
agyi and Jozsa 2018 Ma and Szilagyi 2019) it is reiter-ated here that GCR-dyn due to its minimal data require-ment calibration-free nature and dynamic scaling may con-tinue to serve as a diagnostic and benchmarking tool formore complex and data-intensive models of terrestrial ETrates including calibrationverification (for past values) andreality checking (for future scenario values) of the LSM-
Fig 4 Regression plots of the linear trends (1979minus2015) in annual modeled [ES (a c) from GCR-dyn EB (b d) from GCR-stat]and water-balance values The vertical and horizontal bars represent the standard error in the trend-value estimates for themodeled and water-balance HUC2 values (a b) respectively The large number of data points hinders a similar plot of theHUC6 values (c d) RMSE is now in mm yrminus1
SEPTEMBER 2020 SZILAGYI ET AL 981
Fig 5 Regression plots of the HUC2-averaged multiyear mean annual ET rates (Emod) of GCR-dyn (a) andeight other (bminusi) popular large-scale ET models against the simplified water-balance (Ewb) estimatesTemporal averaging follows the availability of data displayed in parentheses for each product The length ofthe whiskers denotes the standard deviation of the HUC2-basin averaged annual ET values The long blue linerepresents a 11 relationship while the least-squares fitted linear relationships are shown in maroon color(after Ma and Szilagyi 2019)
Fig 6 Regression plots of the linear trend values (mm yrminus1) in modeled HUC2-averaged annual ET sums(Emod) against those in Ewb over 1979minus2015 The length of the whiskers denotes the standard error in theestimated slope value The long blue line represents a 11 relationship while the least-squares fitted linearrelationships are shown in maroon color (after Ma and Szilagyi 2019)
982 DYNAMIC SCALING IMPROVES EVAPORATION ESTIMATES VOLUME 37
Fig 7 Regression plots of the linear trend values (mm yrminus1) in GLEAM- PML- and FLUXNET-MTE-modeled (aminusc) HUC2-averaged annual ET sums (Emod) against those in Ewb over the different modelperiods (shown in parentheses) For comparison regressions for the GCR-dyn ET values over the sameperiods are also displayed (dminusf) The length of the whiskers denotes the standard error in the estimatedslope value The long blue line represents a 11 relationship while the least-squares fitted linearrelationships are shown in maroon color (after Ma and Szilagyi 2019)
Fig 8 Spatial distribution of the multiyear (1979minus2015) mean annual ET (mm) rates (Emod) by GCR-dyn andeight other popular large-scale ET models (aminusi) and their spatially averaged (j) values plusminus standarddeviations (after Ma and Szilagyi 2019) The 18 HUC2 basins are also outlined
SEPTEMBER 2020 SZILAGYI ET AL 983
predicted ET rates of existing regional and general circula-tion models
Acknowledgements All data used in this study can beaccessed from the following websites NARR data wwwesrlnoaagovpsddatagriddeddatanarrhtml PRISM temperaturehumidity and precipitation prismoregonstateedu USGS HUC2and HUC6 runoff waterwatchusgsgov id=wwds_runoff NoahET data discgsfcnasagovdatasetsNLDAS_NOAH0125_M_V002summarykeywords=NLDAS VIC ET data discgsfcxnasagovdatasetsNLDAS_VIC0125_M_V002summarykeywords=NLDAS Mosaic ET data discgsfcnasagovdatasetsNLDAS_MOS0125_M_V002summarykeywords=NLDAS NCEP-II ETdata wwwesrlnoaagovpsddatagriddeddatancepreanalysis2html ERA-Interim ET data wwwecmwfintenforecastsdatasetsreanalysis-datasetsera-interim GLEAM ET data httpgleameuhome PML ET data datacsiroaudaplandingpagepid=csiro17375ampv= 202ampd=true FLUXNET-MTE ET data climate-dataguideucareduclimate-datafluxnet-mte-multi-tree-ensembleThe GCR-dyn modeled ET rates and the HUC2- and HUC6-aver-aged Ewb P Q data are available from httpsdigitalcommonsunledunatrespapers986 This research was supported by a BME-Water Sciences and Disaster Prevention FIKP grant of EMMI(BME FIKP-VIZ)
Open Access This article is distributed under the terms of thecreative commons attribution 40 international license (httpcreat-ivecommonsorglicensesby40) which permits unrestricted usedistribution and reproduction in any medium provided you giveappropriate credit to the original author(s) and the source providea link to the creative commons license and indicate if changeswere made
REFERENCES
Baldocchi D D 2020 How eddy covariance flux measure-ments have contributed to our understanding of GlobalChange Biology Global Change Biol 26 242minus260httpsdoiorg101111gcb14807
Biederman J A and Coauthors 2016 Terrestrial carbon bal-ance in a drier world The effects of water availability in south-western North America Global Change Biol 221867minus1879 httpsdoiorg101111gcb13222
Bouchet R J 1963 Evapotranspiration reacuteelle et potentielle signi-fication climatique Int Assoc Sci Hydrol 62 134minus142
Bowen I S 1926 The ratio of heat losses by conduction and byevaporation from any water surface Phys Rev 27779minus787 httpsdoiorg101103PhysRev27779
Brutsaert W 1982 Evaporation into the Atmosphere Theory His-tory and Applications Springer 302 pp httpsdoiorg101007978-94-017-1497-6
Brutsaert W 2015 A generalized complementary principle withphysical constraints for land- surface evaporation WaterResour Res 51 8087minus8093 httpsdoiorg1010022015WR017720
Brutsaert W L Cheng and L Zhang 2020 Spatial distributionof global landscape evaporation in the early twenty-first cen-tury by means of a generalized complementary approach JHydromet 21 287minus298 httpsdoiorg101175JHM-D-19-02081
Chen F and J Dudhia 2001 Coupling an advanced land sur-face‐hydrology model with the Penn State‐NCAR MM5modeling system Part I Model implementation and sensitiv-ity Mon Wea Rev 129(4) 569minus585 httpsdoiorg1011751520-0493(2001)129lt0569CAALSHgt20CO2
Condon L E A L Atchley and R M Maxwell 2020 Evapo-transpiration depletes groundwater under warming over the
Fig 9 Spatial distribution of the linear tendencies (mm yrminus1) in annual ET sums of GCR-dyn and eight other popular large-scale ET products The stippling denotes trends that are statistically significant (p lt 5) in the Studentrsquos t-test (after Ma andSzilagyi 2019)
984 DYNAMIC SCALING IMPROVES EVAPORATION ESTIMATES VOLUME 37
contiguous United States Nature Comm 11 873httpsdoiorg101038s41467-020-14688-0
Crago R J Szilagyi R Qualls and J Huntington 2016 Rescal-ing the complementary relationship for land surface evapora-tion Water Resour Res 52 8461minus8471 httpsdoiorg1010022016WR019753
Daly C R P Neilson and D L Phillips 1994 A statistical-topo-graphic model for mapping climatological precipitation overmountainous terrain J Appl Meteorol 33 140minus158httpsdoiorg1011751520-0450(1994)033lt0140AST-MFMgt20CO2
de Vries D A 1959 The influence of irrigation on the energybalance and the climate near the ground J Meteorol 16256minus270 httpsdoiorg1011751520-0469(1959)016lt0256TIOIOTgt20CO2
Dee D P and Coauthors 2011 The ERA-Interim reanalysis Con-figuration and performance of the data assimilation systemQuart J Roy Meteorol Soc 137(656) 553minus597httpsdoiorg101002qj828
Fang H L F Baret S Plummer and G Schaepman-Strub2019 An overview of global leaf area Index (LAI) Meth-ods products validation and applications Rev Geophys57 739minus799 httpsdoiorg1010292018rg000608
Feng X M and Coauthors 2016 Revegetation in ChinarsquosLoess Plateau is approaching sustainable water resource lim-its Nat Clim Change 6 1019minus1022 httpsdoiorg101038nclimate3092
Fisher J B and Coauthors 2017 The future of evapotranspira-tion Global requirements for ecosystem functioning car-bon and climate feedbacks agricultural management andwater resources Water Resour Res 53 2618minus2626httpsdoiorg1010022016wr020175
Gutman G and A Ignatov 1998 The derivation of the greenvegetation fraction from NOAAAVHRR data for use innumerical weather prediction models Int J Remote Sens19 1533minus1543 httpsdoiorg101080014311698215333
Jung M and Coauthors 2011 Global patterns of land-atmo-sphere fluxes of carbon dioxide latent heat and sensibleheat derived from eddy covariance satellite and meteorolo-gical observations J Geophys Res 116 G00J07httpsdoiorg1010292010jg001566
Kanamitsu M W Ebisuzaki J Woollen S-K Yang J JHnilo M Fiorino and G L Potter 2002 NCEP‐ DOEAMIP-II reanalysis (R-2) Bull Amer Meteorol Soc 83(11) 1631minus1644 httpsdoiorg101175BAMS-83-11-1631
Koster R D and M J Suarez 1996 Energy and water balancecalculations in the Mosaic LSM NASA Technical Memor-andum 104606
Leuning R Y Q Zhang A Rajaud H Cleugh and K Tu2008 A simple surface conductance model to estimateregional evaporation using MODIS leaf area index and thePenman-Monteith equation Water Resour Res 44W10419 httpsdoiorg1010292007WR006562
Li J D F Chen G Zhang M Barlage Y J Gan Y F Xinand C Wang 2018 Impacts of land cover and soil textureuncertainty on land model simulations over the CentralTibetan Plateau J Adv Model Earth Syst 10 2121minus2146httpsdoiorg1010292018MS001377
Liang X D P Lettenmaier E F Wood and S J Burges 1994A simple hydrologically based model of land surface waterand energy fluxes for general circulation models J Geo-phys Res 99(D7) 14415minus14428 httpsdoiorg101029
94JD00483
Liu W B L Wang J Zhou Y Z Li F B Sun G B Fu X PLi and Y-F Sang 2016 A worldwide evaluation of basin-scale evapotranspiration estimates against the water balancemethod J Hydrol 538 82minus95 httpsdoiorg101016jjhy-drol201604006
Ma N and J Szilagyi 2019 The CR of evaporation A calibra-tion-free diagnostic and benchmarking tool for large-scale ter-restrial evapotranspiration modeling Water Resour Res55(8) 7246minus7274 httpsdoiorg1010292019WR024867
Ma N G-Y Niu Y L Xia X T Cai Y S Zhang Y M Maand Y H Fang 2017 A systematic evaluation of Noah-MPin simulating land-atmosphere energy water and carbonexchanges over the continental United States J GeophysRes 122(22) 12245minus12268 httpsdoiorg1010022017JD027597
Ma N J Szilagyi Y S Zhang and W B Liu 2019 Comple-mentary-relationship-based modeling of terrestrial evapotran-spiration across China during 1982-2012 Validations and spa-tiotemporal analyses J Geophys Res 124 4326minus4351httpsdoiorg1010292018JD029850
Martens B and Coauthors 2017 GLEAM v3 Satellite-basedland evaporation and root-zone soil moisture Geosci ModelDev 10(5) 1903minus1925 httpsdoiorg105194gmd-10-1903-2017
Mesinger F and Coauthors 2006 North American regional reanal-ysis Bull Amer Meteorol Soc 87 343minus360 httpsdoiorg101175BAMS-87-3-343
Miralles D G T R H Holmes R A M De Jeu J H Gash AG C A Meesters and A J Dolman 2011 Global land-sur-face evaporation estimated from satellite-based observa-tions Hydrol Earth Syst Sci 15(2) 453minus469 httpsdoiorg105194hess-15-453-2011
Morton F I 1983 Operational estimates of areal evapotranspira-tion and their significance to the science and practice of hydro-logy J Hydrol 66 1minus76 httpsdoiorg1010160022-1694(83)90177-4
Mueller B and Coauthors 2011 Evaluation of global observa-tions-based evapotranspiration datasets and IPCC AR4 simula-tions Geophys Res Lett 38 L06402 httpsdoiorg1010292010gl046230
Pendergrass A G and Coauthors 2020 Flash droughts presenta new challenge for subseasonal-to-seasonal prediction NatClim Change 10 191minus199 httpsdoiorg101038s41558-020-0709-0
Penman H L 1948 Natural evaporation from open water baresoil and grass Proc Royal Soc A Math Phys Engin Sci193 120minus145 httpsdoiorg101098rspa19480037
Priestley C H B and R J Taylor 1972 On the assessment ofsurface heat flux and evaporation using large-scale paramet-ers Mon Wea Rev 100(2) 81minus92 httpsdoiorg1011751520-0493(1972)100lt0081OTAOSHgt23CO2
Senay G B S Leake P L Nagler G Artan J Dickinson J TCordova and E P Glenn 2011 Estimating basin scale evapo-transpiration (ET) by water balance and remote sensing meth-ods Hydrol Process 25(26) 4037minus4049 httpsdoiorg101002hyp8379
Seneviratne S I D Luumlthi M Litschi and C Schaumlr 2006Land-atmosphere coupling and climate change in EuropeNature 443 205minus209 httpsdoiorg101038nature05095
Slatyer R O and I C Mcllroy 1961 Practical Microclimato-logy CSIRO 310 pp
SEPTEMBER 2020 SZILAGYI ET AL 985
Szilagyi J 2014 Temperature corrections in the Priestley-Taylor equation of evaporation J Hydrol 519 455minus464httpsdoiorg101016jjhydrol201407040
Szilagyi J 2018a Anthropogenic hydrological cycle disturb-ance at a regional scale State-wide evapotranspirationtrends (1979minus2015) across Nebraska USA J Hydrol 557600minus612 httpsdoiorg101016jjhydrol201712062
Szilagyi J 2018b A calibration-free robust estimation ofmonthly land surface evapotranspiration rates for contin-ental-scale hydrology Hydrol Res 49(3) 648minus657httpsdoiorg102166nh2017078
Szilagyi J and J Jozsa 2008 New findings about the comple-mentary relationship-based evaporation estimation methodsJ Hydrol 354 171minus186 httpsdoiorg101016jjhydrol200803008
Szilagyi J and J Jozsa 2009 Analytical solution of the coupled2-D turbulent heat and vapor transport equations and the com-plementary relationship of evaporation J Hydrol 37261minus67 httpsdoiorg101016jjhydrol200903035
Szilagyi J and A Schepers 2014 Coupled heat and vapor trans-port The thermostat effect of a freely evaporating land sur-face Geophys Res Lett 41 435minus441 httpsdoiorg1010022013GL058979
Szilagyi J and J Jozsa 2018 Evapotranspiration trends (1979minus2015) in the Central Valley of California USA Contrastingtendencies during 1981minus2007 Water Resour Res 545620minus5635 httpsdoiorg1010292018WR022704
Szilagyi J R Crago and R Qualls 2017 A calibration-free for-mulation of the complementary relationship of evaporationfor continental-scale hydrology J Geophys Res 122264minus278 httpsdoiorg1010022016jd025611
Ukkola A M M G De Kauwe A J Pitman M J Best GAbramowitz V Haverd M Decker and N Haughton
2016 Land surface models systematically overestimate theintensity duration and magnitude of seasonal-scale evaporat-ive droughts Environ Res Lett 11(10) 104012 httpsdoiorg1010881748-93261110104012
Velpuri N M G B Senay R K Singh S Bohms and J PVerdin 2013 A comprehensive evaluation of two MODISevapotranspiration products over the conterminous UnitedStates Using point and gridded FLUXNET and water bal-ance ET Remote Sens Environ 139 35minus49 httpsdoiorg101016jrse201307013
Vinukollu R K E F Wood C R Ferguson and J B Fisher2011 Global estimates of evapotranspiration for climate stud-ies using multi-sensor remote sensing data Evaluation ofthree process-based approaches Remote Sens Environ115 801minus823 httpsdoiorg101016jrse201011006
Wang K C and R E Dickinson 2012 A review of global ter-restrial evapotranspiration Observation modeling climato-logy and climatic variability Rev Geophys 50 RG2005httpsdoiorg1010292011rg000373
Xia Y L and D Coauthors 2012 Continental-scale water andenergy flux analysis and validation for the North AmericanLand Data Assimilation System project phase 2(NLDAS-2)1 Intercomparison and application of model products J Geop-hys Res 117 D03109 httpsdoiorg1010292011jd016048
Zhang Y Q F H S Chiew J Pentildea-Arancibia F B Sun H XLi and R Leuning 2017 Global variation of transpirationand soil evaporation and the role of their major climatedrivers J Geophys Res 122 6868minus6881 httpsdoiorg1010022017JD027025
Zheng H and Z-L Yang 2016 Effects of soil-type datasets onregional terrestrial water cycle simulations under different cli-matic regimes J Geophys Res 121 14387minus14402httpsdoiorg1010022016JD025187
986 DYNAMIC SCALING IMPROVES EVAPORATION ESTIMATES VOLUME 37
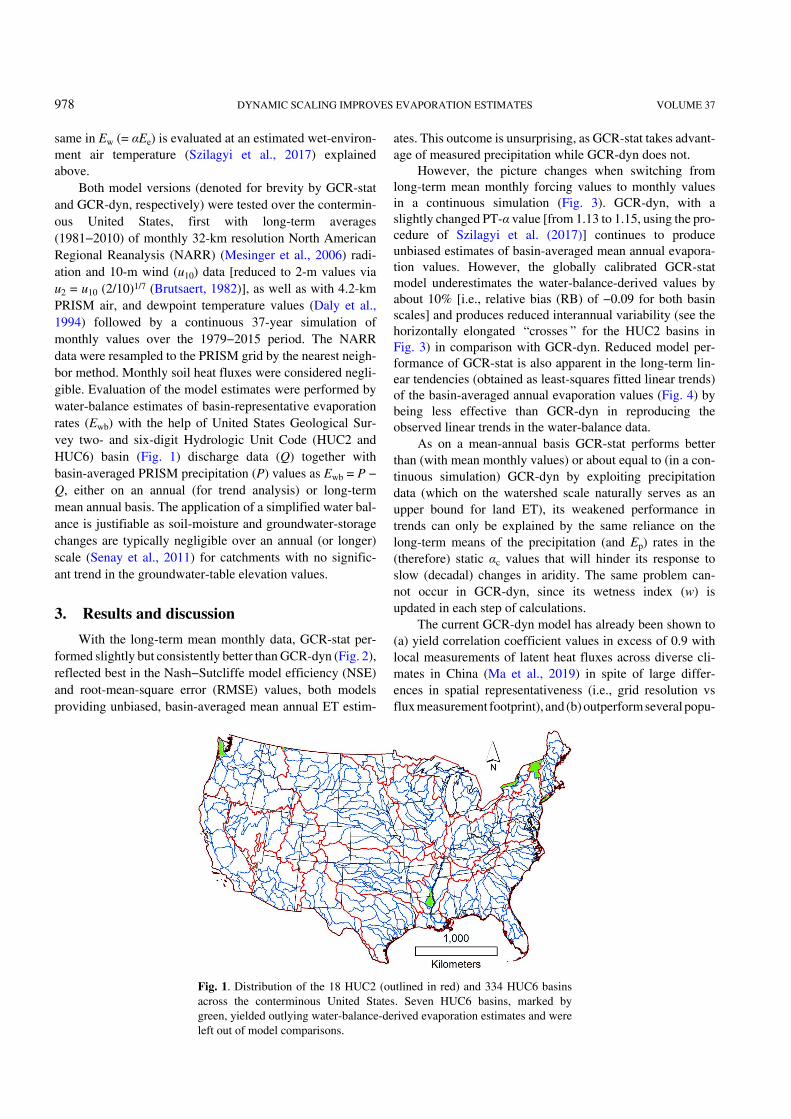
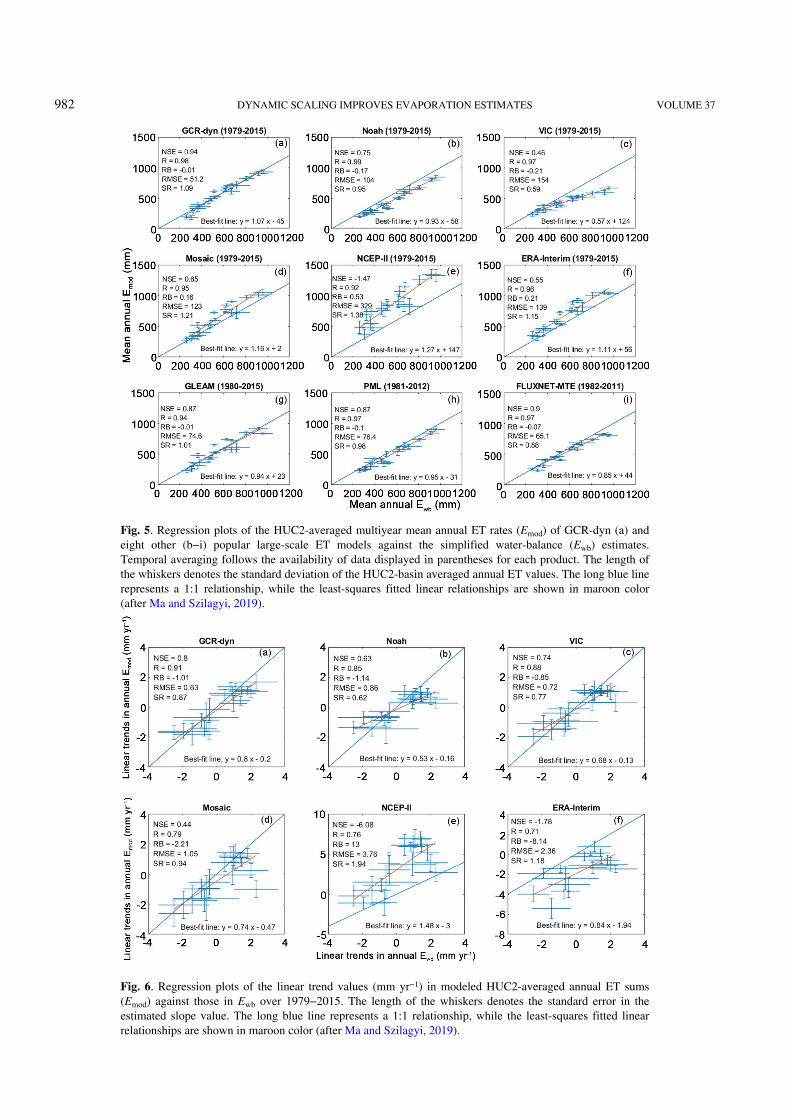
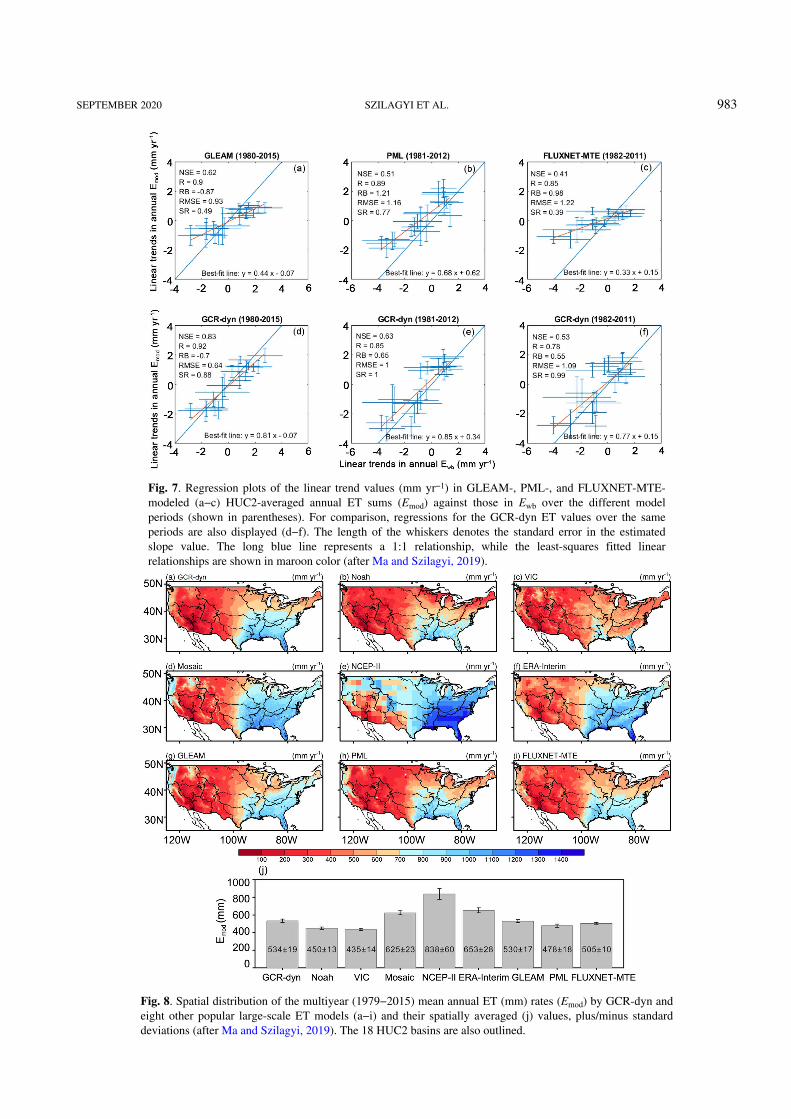
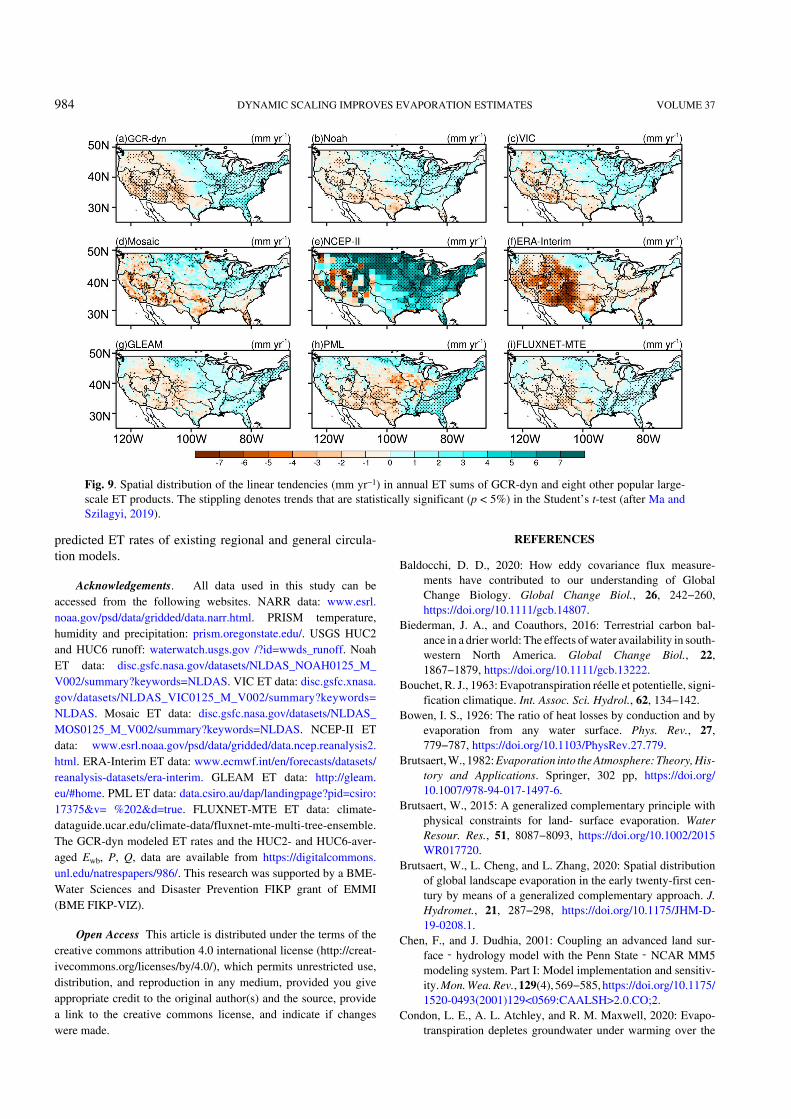