Dynamic responses of tree‐ring growth to multiple ...
11
PRIMARY RESEARCH ARTICLE Dynamic responses of tree‐ring growth to multiple dimensions of drought Shan Gao 1,2,3 | Ruishun Liu 4 | Tao Zhou 1,2 | Wei Fang 3 | Chuixiang Yi 3,5 | Ruijie Lu 1 | Xiang Zhao 6 | Hui Luo 1,2 1 State Key Laboratory of Earth Surface Processes and Resource Ecology, Faculty of Geographical Science, Beijing Normal University, Beijing, China 2 Key Laboratory of Environmental Change and Natural Disaster of Ministry of Education, Academy of Disaster Reduction and Emergency Management, Beijing Normal University, Beijing, China 3 School of Earth and Environmental Sciences, Queens College, City University of New York, Queens, New York 4 College of Resources and Environment, Northwest A&F University, Yangling, China 5 Earth and Environmental Sciences Department, the Graduate Center of the City University of New York, New York City, New York 6 State Key Laboratory of Remote Sensing Science, Jointly Sponsored by Beijing Normal University and Institute of Remote Sensing and Digital Earth of Chinese Academy of Sciences, Beijing, China Correspondence Tao Zhou, State Key Laboratory of Earth Surface Processes and Resource Ecology, Faculty of Geographical Science, Beijing Normal University, Beijing 100875, China. Email: [email protected] Funding information National Natural Science Foundation of China, Grant/Award Number: 41571185, 41621061; Fundamental Research Funds for the Central University, Grant/Award Number: 2015KJJCB33; China Scholarship Council; City University of New York, Grant/ Award Number: PSC‐CUNY ENHC‐48‐33, PSC‐CUNY CIRG‐ 80209‐08 22 Abstract Droughts, which are characterized by multiple dimensions including frequency, dura- tion, severity, and onset timing, can impact tree stem radial growth profoundly. Differ- ent dimensions of drought influence tree stem radial growth independently or jointly, which makes the development of accurate predictions a formidable challenge. Mea- surement‐based tree‐ring data have obvious advantages for studying the drought responses of trees. Here, we explored the use of abundant tree‐ring records for quanti- fying regional response patterns to key dimensions of drought. Specifically, we designed a series of regional‐scaled “natural experiments,” based on 357 tree‐ring chronologies from Southwest USA and location‐matched monthly water balance anomalies, to reveal how tree‐ring responds to each dimension of drought. Our results showed that tree‐ring was affected significantly more by the water balance condition in the current hydrological year than that in the prior hydrological year. Within the current hydrological year, increased drought frequency (number of dry months) and duration (maximum number of consecutive dry months) resulted in “cumulative effects” which amplified the impacts of drought on trees and reduced the drought resistance of trees. Drought events that occurred in the pregrowing seasons strongly affected subsequent tree stem radial growth. Both the onset timing and severity of drought increased “le- gacy effects” on tree stem radial growth, which reduced the drought resilience of trees. These results indicated that the drought impact on trees is a dynamic process: even when the total water deficits are the same, differences among the drought processes could lead to considerably different responses from trees. This study thus provides a conceptual framework and probabilistic patterns of tree‐ring growth response to multi- ple dimensions of drought regimes, which in turn may have a wide range of implications for predictions, uncertainty assessment, and forest management. KEYWORDS cumulative effect, drought dimensions, legacy effect, probabilistic patterns of tree growth, response to drought process, tree‐ring, water balance 1 | INTRODUCTION Drought is one of the most economically and ecologically disruptive extreme events, one that impacts terrestrial ecosystem processes profoundly especially under the current warming climate (Allen, Bres- hears, & McDowell, 2015; Anderegg et al., 2015, 2016; Choat et al., 2012; Cook, Ault, & Smerdon, 2015; Yi et al., 2012). Higher air Received: 29 January 2018 | Accepted: 7 June 2018 DOI: 10.1111/gcb.14367 Glob Change Biol. 2018;1–12. wileyonlinelibrary.com/journal/gcb © 2018 John Wiley & Sons Ltd | 1
Transcript of Dynamic responses of tree‐ring growth to multiple ...

P R IMA R Y R E S E A R CH A R T I C L E
Dynamic responses of tree‐ring growth to multipledimensions of drought
Shan Gao1,2,3 | Ruishun Liu4 | Tao Zhou1,2 | Wei Fang3 | Chuixiang Yi3,5 |
Ruijie Lu1 | Xiang Zhao6 | Hui Luo1,2
1State Key Laboratory of Earth Surface
Processes and Resource Ecology, Faculty of
Geographical Science, Beijing Normal
University, Beijing, China
2Key Laboratory of Environmental Change
and Natural Disaster of Ministry of
Education, Academy of Disaster Reduction
and Emergency Management, Beijing
Normal University, Beijing, China
3School of Earth and Environmental
Sciences, Queens College, City University
of New York, Queens, New York
4College of Resources and Environment,
Northwest A&F University, Yangling, China
5Earth and Environmental Sciences
Department, the Graduate Center of the
City University of New York, New York
City, New York
6State Key Laboratory of Remote Sensing
Science, Jointly Sponsored by Beijing
Normal University and Institute of Remote
Sensing and Digital Earth of Chinese
Academy of Sciences, Beijing, China
Correspondence
Tao Zhou, State Key Laboratory of Earth
Surface Processes and Resource Ecology,
Faculty of Geographical Science, Beijing
Normal University, Beijing 100875, China.
Email: [email protected]
Funding information
National Natural Science Foundation of
China, Grant/Award Number: 41571185,
41621061; Fundamental Research Funds for
the Central University, Grant/Award
Number: 2015KJJCB33; China Scholarship
Council; City University of New York, Grant/
Award Number: PSC‐CUNY ENHC‐48‐33,PSC‐CUNY CIRG‐ 80209‐08 22
Abstract
Droughts, which are characterized by multiple dimensions including frequency, dura-
tion, severity, and onset timing, can impact tree stem radial growth profoundly. Differ-
ent dimensions of drought influence tree stem radial growth independently or jointly,
which makes the development of accurate predictions a formidable challenge. Mea-
surement‐based tree‐ring data have obvious advantages for studying the drought
responses of trees. Here, we explored the use of abundant tree‐ring records for quanti-fying regional response patterns to key dimensions of drought. Specifically, we
designed a series of regional‐scaled “natural experiments,” based on 357 tree‐ringchronologies from Southwest USA and location‐matched monthly water balance
anomalies, to reveal how tree‐ring responds to each dimension of drought. Our results
showed that tree‐ring was affected significantly more by the water balance condition in
the current hydrological year than that in the prior hydrological year. Within the current
hydrological year, increased drought frequency (number of dry months) and duration
(maximum number of consecutive dry months) resulted in “cumulative effects” which
amplified the impacts of drought on trees and reduced the drought resistance of trees.
Drought events that occurred in the pregrowing seasons strongly affected subsequent
tree stem radial growth. Both the onset timing and severity of drought increased “le-gacy effects” on tree stem radial growth, which reduced the drought resilience of trees.
These results indicated that the drought impact on trees is a dynamic process: even
when the total water deficits are the same, differences among the drought processes
could lead to considerably different responses from trees. This study thus provides a
conceptual framework and probabilistic patterns of tree‐ring growth response to multi-
ple dimensions of drought regimes, which in turn may have a wide range of implications
for predictions, uncertainty assessment, and forest management.
K E YWORD S
cumulative effect, drought dimensions, legacy effect, probabilistic patterns of tree growth,
response to drought process, tree‐ring, water balance
1 | INTRODUCTION
Drought is one of the most economically and ecologically disruptive
extreme events, one that impacts terrestrial ecosystem processes
profoundly especially under the current warming climate (Allen, Bres-
hears, & McDowell, 2015; Anderegg et al., 2015, 2016; Choat et al.,
2012; Cook, Ault, & Smerdon, 2015; Yi et al., 2012). Higher air
Received: 29 January 2018 | Accepted: 7 June 2018
DOI: 10.1111/gcb.14367
Glob Change Biol. 2018;1–12. wileyonlinelibrary.com/journal/gcb © 2018 John Wiley & Sons Ltd | 1

temperature causes a greater atmospheric demand for water, which
exacerbates the water stress upon vegetation during a drought
(Novick et al., 2016). Among all vegetation types, forests are poten-
tially the most susceptible to drought based on the hydraulic corol-
lary of vascular plant physiology (McDowell & Allen, 2015).
Increasing focus has been placed on widespread drought‐inducedtree mortality and forest declines that cause a significant reduction
in carbon flux from the atmosphere to the land (Wei, Yi, Fang, &
Hendrey, 2017; Yi, Pendall, & Ciais, 2015; Yi et al., 2010), which
have been investigated from diverse perspectives and on different
scales using a wide variety of approaches (Adams et al., 2009; Allen
et al., 2015; Barbeta et al., 2015; Bhuyan, Zang, Vicente‐Serrano, &Menzel, 2017; Dobbertin, 2005; Dorman, Svoray, Perevolotsky, &
Sarris, 2013; González‐Cásares, Pompa‐García, & Camarero, 2017;
He et al., 2017; Huang et al., 2015; Luo et al., 2018; Xu et al., 2018;
Yi et al., 2018). However, detailed and locally specific conclusions
and hypothetical mechanisms derived from in situ experiments or
event‐based observations are difficult to be applied at the regional
to global scales, while regional‐ to global‐scaled studies tend to sim-
plify or abstract the processes of climate–vegetation interplay, which
may cause uncertainties or even paradoxes. These hold back the
development of process‐based models and leave unclear the
dynamic patterns of forest responses to drought and their underlying
mechanisms.
Drought is a multiscalar phenomenon and thus it is difficult to be
quantified (Mckee, Doesken, & Kleist, 1993; Vicente‐Serrano et al.,
2013; Wei et al., 2014; Zargar, Sadiq, Naser, & Khan, 2011). Multiple
dimensions, namely severity, frequency, duration, timing, and geo-
graphic extent have been used to characterize drought (Zargar et al.,
2011), and each dimension could plausibly affect tree stem radial
growth to some extent. Drought has been predicted to be longer,
more frequent, more severe and more unseasonal during ongoing
global climate change (Cook et al., 2015; Halwatura, Lechner, &
Arnold, 2015; Spinoni, Naumann, Carrao, Barbosa, & Vogt, 2014; Yi
et al., 2015). It is therefore urgent that we quantify how tree stem
radial growth responds dynamically to each dimension of drought, so
that more accurate modeling and predictions could be developed.
It is crucial but challenging to quantify the impact of each dimen-
sion of drought on trees. Observations give an overall picture of the
patterns of forests respond to drought dimensions (Allen et al.,
2010, 2015). Extreme droughts affect trees’ vigor and structure con-
siderably (Rosbakh et al., 2017). In addition to these immediate
impacts, their long‐lasting legacy effects could delay trees’ recovery,and increase vulnerability to future droughts (Anderegg et al., 2013,
2015; Wu et al., 2017). Increase of drought frequency exposes trees
to drought more frequently, which may augment the risk of forest
die‐off (Mueller et al., 2005). Droughts with longer duration could
cause accumulated hydraulic deterioration, which may lead to mor-
tality. In situ controlled experiments provide insight into the physio-
logical mechanisms of tree responses to drought; we could monitor
selected physiological indicators of saplings for their changes over
time under the controlled water stress conditions (Anderegg &
Anderegg, 2012; Barbeta et al., 2015; Ditmarova, Kurjak, Palmroth,
Kmet, & Strelcova, 2009; Ryan, 2011). However, varied responses
were reported among saplings (Ambrose et al., 2015; Rosbakh et al.,
2017; Ryan, 2011), which attest to the difficulty in predicting indi-
vidual drought responses. Moreover, the disparate physiological
responses to drought between saplings and mature trees (Anderegg
& Anderegg, 2012; Bennett, McDowell, Allen, & Anderson‐Teixeira,2015), in addition to limited specimens and experimental durations,
make it difficult to generate regional‐scaled predictions.
In regional‐ to global‐scaled studies, drought indices are preferred
for characterizing drought since they are readily usable numerical
values that are calculated by assimilating drought indicators (Mckee
et al., 1993; Vicente‐Serrano, Beguería, & López‐Moreno, 2010; Zar-
gar et al., 2011; Zhou, Yi, Bakwin, & Zhu, 2008). Correlation and
regression analyses between drought indices and indicators of forest
vitality or tree growth have been the most common methods used
to date in exploring how forests respond to drought (Breshears et
al., 2005; Vicente‐Serrano et al., 2013) and other important topics
such as the dominant timescales (Andujar, Krakauer, Yi, & Kogan,
2017; Vicente‐Serrano, Camarero, & Azorin‐Molina, 2014; Vicente‐Serrano et al., 2013), biome sensitivities (González‐Cásares et al.,
2017), time‐lag effects (Wu et al., 2015), while consensus was rarely
achieved. Although severity of drought has received the most atten-
tion among all drought dimensions in such analyses, it is worth not-
ing that drought is a process. A complete process contains extensive
and complex information that goes beyond a single value. Therefore,
more detailed process‐based research is needed at the regional
scale.
In this study, we sought to clarify how tree stem radial growth
responds to each dimension of drought by designing a series of
regional‐scaled “natural experiments,” based on 357 tree‐ringchronologies from southwest USA and location‐matched monthly
water balance anomalies. Southwest USA is an ideal region for
drought related research. Ring width indices (RWI) were used to
indicate tree stem radial growth while monthly water balance
anomalies were used to quantify the key dimensions of drought.
Specifically, we reassembled tree‐ring specimens based on a series
of drought scenarios with chosen drought dimensions and the corre-
sponding patterns of tree‐ring growth were analyzed. The contrast-
ing distribution patterns of RWIs under different drought scenarios
should shed new light on our understanding of drought regimes at
the regional scale.
2 | MATERIALS AND METHODS
2.1 | Study region
The study region, located in the southwest of United States, includes
the states of Utah, Colorado, Arizona and New Mexico (Figure 1).
The topography is mainly comprised of the Colorado Plateau, which
is surrounded by mountains and deserts. The climate of the region
depends mainly on elevation and topography, therefore has large
spatial gradients in both temperature and precipitation (Allen, Betan-
court, & Swetnam, 1998; Biederman et al., 2017); low elevation is
2 | GAO ET AL.

arid desert climate, while higher elevations feature alpine climates
and have large tracts of alpine trees. Southwest USA is a typical
region for researching tree‐ring response to drought since forests
there are mainly limited by water deficits.
2.2 | Tree‐ring data
A total of 357 tree‐ring chronologies of three major tree species
(Pseudotsuga menziesii, Pinus ponderosa, Pinus edulis) were obtained
from the International Tree‐Ring Data Bank (https://www.ncdc.noaa.
gov/data-access/paleoclimatology-data/datasets/tree-ring; Table 1).
These trees were mainly distributed at the elevation range of 1,300–3,200 m. Tree‐ring growth patterns across species and space are
generally coherence (Williams et al., 2012). Standard chronologies
were obtained directly from the International Tree‐Ring Data Bank or
developed from raw tree‐ring width when they were unavailable. To
develop standard chronologies, long‐term trends caused by aging
and increasing trunk diameter were removed mostly by negative
exponential curves using ARSTAN program (Cook, 1985). After
standardization, all chronologies were scaled to a standard
mean (RWI = 1,000) and comparable variance, therefore spatial
heterogeneities among tree‐ring sites were largely eliminated.
Processed chronologies after the year 1902 were selected for further
analyses.
2.3 | Climate data
Monthly gridded climate data (precipitation [P] and potential evapo-
transpiration [PET]) from 1901 to 2013 for each tree‐ring site were
obtained from the Climate Research Unit, TS v.4.01 (https://crudata.
uea.ac.uk/cru/data/hrg/). We calculated the monthly water balance
(Dm) of each site (Equation 1) and its annual water balance (Dy)
(Equation 2). In this research, hydrological year—beginning in Octo-
ber of the previous year and ending in September of the current
year—was used (Fang, Frank, Zhao, Zhou, & Seppa, 2015; Salzer &
Kipfmueller, 2005; Williams, Michaelsen, Leavitt, & Still, 2010) to
obtain a more reasonable correspondence between hydrological pro-
cesses and tree phenology. To explore how water balance variability
controls tree‐ring growth, we used monthly and annual water bal-
ance anomalies (respectively, Dmanomaly and Dyanomaly), which
were calculated by Equations 3 and 4. Water balance anomalies
described the departure from a long‐term average, which effectively
normalizes the data, thus enabling more meaningful comparisons to
be made with respect to normality, both for different sites within a
region and different periods within a hydrological year.
Djmi
¼ Pji � PETji; (1)
Dyj ¼ ∑12i¼1D
jmi; (2)
Dmanomalyji ¼ Djmi
� Djmi; (3)
Dyanomalyj ¼ ∑12i¼1Dmanomalyji: (4)
For the ith month of a hydrological year at the jth tree‐ring site,
Djmi
represents 113‐hydrological year‐mean (from year 1901 to
2013) water balance for ith month at jth site.
2.4 | Dimensions of droughts
Drought can be characterized by multiple dimensions, that include
its severity, duration, frequency, and timing (Zargar et al., 2011). In
our study, we used monthly water balance anomaly condition to
quantify each dimension of droughts.
Severity: Monthly water balance anomaly (Dmanomaly) equal to
or below a drought threshold.
Frequency: Number of months within a hydrological year (i.e.,
from October of the previous to September of the current year) that
have a monthly water balance anomaly below a threshold.
Duration: Number of consecutive months within a hydrological
year that monthly water balance anomaly below a certain severity.
Timing: Onset time of drought within a hydrological year.
F IGURE 1 Distribution of tree‐ringsites used in Southwest USA. A total of357 tree‐ring sites of three major treespecies (Pseudotsuga menziesii, Pinusponderosa, Pinus edulis) were included
GAO ET AL. | 3
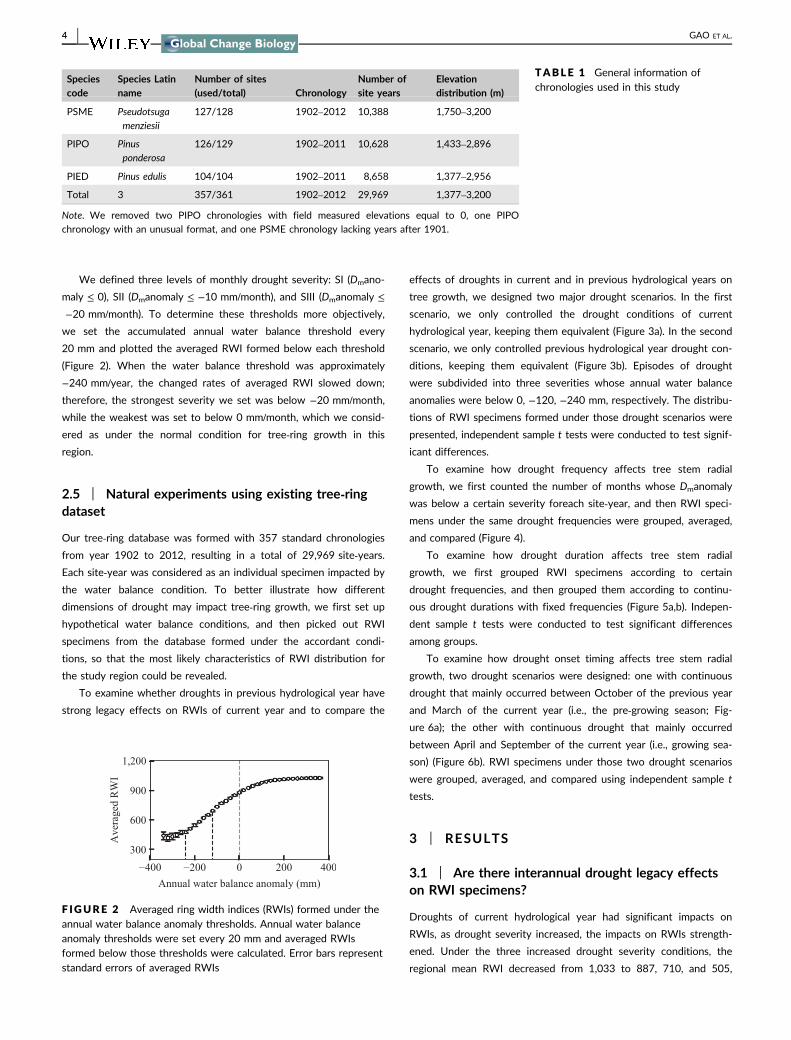
We defined three levels of monthly drought severity: SI (Dmano-
maly ≤ 0), SII (Dmanomaly ≤ −10 mm/month), and SIII (Dmanomaly ≤
−20 mm/month). To determine these thresholds more objectively,
we set the accumulated annual water balance threshold every
20 mm and plotted the averaged RWI formed below each threshold
(Figure 2). When the water balance threshold was approximately
−240 mm/year, the changed rates of averaged RWI slowed down;
therefore, the strongest severity we set was below −20 mm/month,
while the weakest was set to below 0 mm/month, which we consid-
ered as under the normal condition for tree‐ring growth in this
region.
2.5 | Natural experiments using existing tree‐ringdataset
Our tree‐ring database was formed with 357 standard chronologies
from year 1902 to 2012, resulting in a total of 29,969 site‐years.Each site‐year was considered as an individual specimen impacted by
the water balance condition. To better illustrate how different
dimensions of drought may impact tree‐ring growth, we first set up
hypothetical water balance conditions, and then picked out RWI
specimens from the database formed under the accordant condi-
tions, so that the most likely characteristics of RWI distribution for
the study region could be revealed.
To examine whether droughts in previous hydrological year have
strong legacy effects on RWIs of current year and to compare the
effects of droughts in current and in previous hydrological years on
tree growth, we designed two major drought scenarios. In the first
scenario, we only controlled the drought conditions of current
hydrological year, keeping them equivalent (Figure 3a). In the second
scenario, we only controlled previous hydrological year drought con-
ditions, keeping them equivalent (Figure 3b). Episodes of drought
were subdivided into three severities whose annual water balance
anomalies were below 0, −120, −240 mm, respectively. The distribu-
tions of RWI specimens formed under those drought scenarios were
presented, independent sample t tests were conducted to test signif-
icant differences.
To examine how drought frequency affects tree stem radial
growth, we first counted the number of months whose Dmanomaly
was below a certain severity foreach site‐year, and then RWI speci-
mens under the same drought frequencies were grouped, averaged,
and compared (Figure 4).
To examine how drought duration affects tree stem radial
growth, we first grouped RWI specimens according to certain
drought frequencies, and then grouped them according to continu-
ous drought durations with fixed frequencies (Figure 5a,b). Indepen-
dent sample t tests were conducted to test significant differences
among groups.
To examine how drought onset timing affects tree stem radial
growth, two drought scenarios were designed: one with continuous
drought that mainly occurred between October of the previous year
and March of the current year (i.e., the pre‐growing season; Fig-
ure 6a); the other with continuous drought that mainly occurred
between April and September of the current year (i.e., growing sea-
son) (Figure 6b). RWI specimens under those two drought scenarios
were grouped, averaged, and compared using independent sample t
tests.
3 | RESULTS
3.1 | Are there interannual drought legacy effectson RWI specimens?
Droughts of current hydrological year had significant impacts on
RWIs, as drought severity increased, the impacts on RWIs strength-
ened. Under the three increased drought severity conditions, the
regional mean RWI decreased from 1,033 to 887, 710, and 505,
Speciescode
Species Latinname
Number of sites(used/total) Chronology
Number ofsite years
Elevationdistribution (m)
PSME Pseudotsuga
menziesii
127/128 1902–2012 10,388 1,750–3,200
PIPO Pinus
ponderosa
126/129 1902–2011 10,628 1,433–2,896
PIED Pinus edulis 104/104 1902–2011 8,658 1,377–2,956
Total 3 357/361 1902–2012 29,969 1,377–3,200
Note. We removed two PIPO chronologies with field measured elevations equal to 0, one PIPO
chronology with an unusual format, and one PSME chronology lacking years after 1901.
TABLE 1 General information ofchronologies used in this study
F IGURE 2 Averaged ring width indices (RWIs) formed under theannual water balance anomaly thresholds. Annual water balanceanomaly thresholds were set every 20 mm and averaged RWIsformed below those thresholds were calculated. Error bars representstandard errors of averaged RWIs
4 | GAO ET AL.

respectively (Figure 3c). Compared to the impacts on RWIs from cur-
rent hydrological years, previous hydrological year drought appar-
ently had smaller impacts, and an increase in drought severity did
not make much differences, as the regional mean RWI varied around
1,000 at no more than 50 above and below that value (Figure 3d).
3.2 | How does drought frequency in differentseverities affect tree‐ring growth?
Ring width indices specimens formed under the same drought fre-
quency condition in SI severity condition were grouped and pre-
sented (Figure 4a). Regional mean RWI generally decreased with an
increase of drought frequency within a hydrological year. As
droughts occurred for more than 7 months within a hydrological
year, regional mean RWI started to drop below the standard mean
(RWI = 1,000) and as droughts occurred for more than 9 months
within a hydrological year, the missing rings (RWI = 0) appeared
more regularly.
Severity of drought amplified the effect of drought frequency on
RWI specimens. Droughts with high frequency but low severity
could have similar effects on RWIs as droughts with low frequency
but with high severity. For example, a RWI mean of c. 1,000 could
be formed under a 7‐month/year frequency in SI severity droughts,
but for SII severity droughts it only required a 5‐month/year
frequency; similarly, for SIII severity droughts only 3‐month/year
frequency was needed (Figure 4b).
3.3 | How does drought duration affect tree‐ringgrowth?
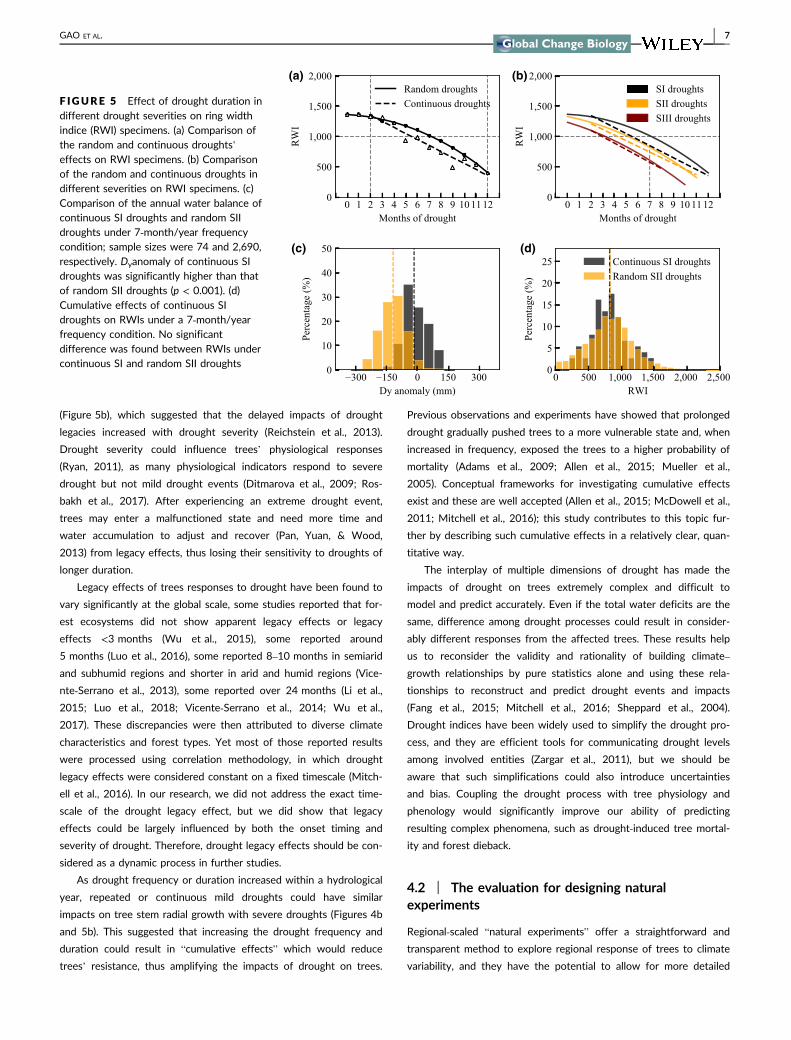
We compared the effects of continuous droughts and random
droughts on RWIs (Figure 5a,b). Given the same drought frequency
(number of dry months of the hydrological year), RWIs that formed
under continuous droughts (indicated by the dashed lines) were gen-
erally lower than those formed under random droughts (indicated by
the solid lines). This suggested that continuous droughts tend to
have a stronger impact on RWIs. Weaker droughts of longer dura-
tion could have a similar impact on RWIs as stronger droughts do.
For instance, under a 7‐month/year drought frequency condition,
continuous SI droughts resulted in a regional mean RWI of 820,
(a1) (a2) (b1) (b2)
(a3) (a4) (b3) (b4)
(c) (d)
F IGURE 3 Contrasting impacts of the annual water balance condition (Dyanomaly) of the current and previous hydrological year on tree‐ring growth (RWIs). To assess the impact of Dyanomaly of the current hydrological year on tree‐ring growth, scenarios a1–a4 were designed,holding the Dyanomaly of the previous hydrological year constant while that of the current hydrological year had four severity levels (= a1 ascontrol, and a2–a4 representing an increasing severity of drought). The a2, a3 and a4 conditions were current hydrological year water balanceanomalies below 0, −120, and −240 mm respectively. Sample sizes for the a1–a4 conditions were 29,313, 15,538, 4,497, and 562,respectively. To access the impact of Dyanomaly of the previous hydrological year on tree stem radial growth, scenarios b1–b4 were designed,keeping Dyanomaly of the current hydrological year constant while that of the previous hydrological year had four severity levels (= b1 ascontrol, and b2–b4 representing an increasing severity of drought). The b2, b3, and b4 conditions were previous hydrological year waterbalance anomalies below 0, −120, −240 mm respectively. The sample sizes of b1–b4 condition were 29,313, 15,831, 4,749, and 650,respectively. (c) Effect of the current hydrological year drought with varying severities on tree stem radial growth. Independent sample t testswere conducted, and significant differences were found between RWIs under a1 condition and those under the a2–a4 conditions (p < 0.001).(d) Effect of the previous hydrological year drought with varying severities on tree stem radial growth. Significant differences were foundbetween RWIs under the b1 condition and those under b2–b4 conditions (p < 0.001)
GAO ET AL. | 5

similar to that of random SII droughts (RWI = 826; Figure 5d),
despite the mean Dyanomaly of random SII droughts (orange dashed
line) being 102 mm lower than that of continuous SI droughts (black
dashed line, Figure 5c). Under the same drought frequency condi-
tion, as drought severity became stronger, the difference between
the effects of continuous droughts (dashed lines in Figure 5b) and
random droughts (solid lines in Figure 5b) on RWIs gradually dissi-
pated, which points to legacy effects.
3.4 | How does the timing of drought affect tree‐ring growth?
To examine how timing of drought may affect regional RWIs, we
designed two hypothetical intra‐annual water balance conditions:
continuous droughts mainly occurred in pregrowing season (Fig-
ure 6a) or in growing season (Figure 6b). RWI specimens were
reassembled accordingly under both scenarios. Although the mean
value for the Dyanomaly of pregrowing season droughts was compa-
rable to those of growing season droughts (blue vs. orange dashed
lines in Figure 6c,e,g), the adverse impact of pregrowing season
droughts on RWIs was much larger than the impact of growing
season droughts (blue vs. orange dashed lines in Figure 6d). This dis-
parity increased with greater drought severity—regional mean RWI
decreased from 642 under SI droughts to 397 under SII droughts
and 311 under SIII droughts (Figure 6f,h)—while for growing season
droughts, increase of severity of droughts had little impacts on regio-
nal mean RWI (Figure 6d,f,h).
4 | DISCUSSION
4.1 | Tree stem radial growth responses to droughtdimensions
Having drought in the hydrological years immediately prior to the
current ones exerted certain impacts on tree‐ring growth of the cur-
rent year. Our results showed that regional mean RWI was reduced
from an average of 1,033 to 970 (Figure 3d), which is comparable to
the studies of interannual legacy effects from Anderegg et al. (2015)
and Wu et al. (2017). Previous studies reported that correlations
between vegetation indices (e.g., RWI, NDVI) and drought indices
(e.g., SPEI) were tested significant at a timescale over 24 months (Li
et al., 2015; Luo et al., 2018; Vicente‐Serrano et al., 2014). Never-
theless, even when the previous hydrological year was under
extreme drought conditions, its impact on current year RWIs were
much less than the impact from drought in the current hydrological
year (Figure 3c). This result underscores the critical importance of
the current year's water balance condition on tree stem radial
growth.
Within a hydrological year, drought legacies of the pregrowing
seasons had significantly higher impacts on current year RWI forma-
tion than that of the growing seasons, and these legacy effects
increased with an increasing drought severity (Figure 6). This result,
echoing previous studies, suggests that tree‐ring width is primarily
determined by the water condition of pregrowing season (Barnes et
al., 2016; Fang et al., 2015; Hagedorn et al., 2014; Rigling, Bräker,
Schneiter, & Schweingruber, 2002). We speculate that if there is
enough water accumulation in the pregrowing season, a tree can
effectively turn stored nonstructural carbon (NSC) into new tissue
when reaching the suitable temperature for growth, therefore, wider
early wood could be formed; otherwise the NSC would be con-
sumed. Studies on seasonal wood formation showed that early wood
width was positively correlated with precipitation from the previous
winter and current spring to early summer, which could affect late
wood formation and make the early wood more sensitive than late
wood to drought (Julio Camarero, Miguel Olano, & Parras, 2010;
Pasho, Julio Camarero, & Vicente‐Serrano, 2012)—this is consistent
with our speculation. Early wood is generally wider and brighter than
late wood, which likely means wider ring widths, and so pregrowing
season droughts could have larger impacts on tree‐ring formation.
Here, we also want to emphasize that the relatively small impacts of
growing season droughts on tree‐ring width do not necessarily mean
that growing season droughts have less impact on tree physiology.
Our result also showed that as drought severity increased, the
impact of drought duration became harder to be detected
(a)
(b)
F IGURE 4 Effect of drought frequency in different droughtseverities on ring width indices (RWI) specimens. (a) Boxplots ofRWI specimens under different drought frequency in the SI severitycondition. On each box, the central bar indicates the median, theblack dot indicates RWI mean, the bottom and top edges indicatethe 25th and 75th percentiles; the whiskers extend to all data pointsexcept outliers (which are plotted individually using “+”). (b) Effect ofdrought frequency in different drought severity on RWI specimens,where dots represent RWI means formed under different droughtfrequencies and error bars represent their standard deviations. SI,SII, and SIII drought severity levels indicate monthly water balanceanomalies below 0, −10, −20 mm, respectively
6 | GAO ET AL.
(Figure 5b), which suggested that the delayed impacts of drought
legacies increased with drought severity (Reichstein et al., 2013).
Drought severity could influence trees’ physiological responses
(Ryan, 2011), as many physiological indicators respond to severe
drought but not mild drought events (Ditmarova et al., 2009; Ros-
bakh et al., 2017). After experiencing an extreme drought event,
trees may enter a malfunctioned state and need more time and
water accumulation to adjust and recover (Pan, Yuan, & Wood,
2013) from legacy effects, thus losing their sensitivity to droughts of
longer duration.
Legacy effects of trees responses to drought have been found to
vary significantly at the global scale, some studies reported that for-
est ecosystems did not show apparent legacy effects or legacy
effects <3 months (Wu et al., 2015), some reported around
5 months (Luo et al., 2016), some reported 8–10 months in semiarid
and subhumid regions and shorter in arid and humid regions (Vice-
nte‐Serrano et al., 2013), some reported over 24 months (Li et al.,
2015; Luo et al., 2018; Vicente‐Serrano et al., 2014; Wu et al.,
2017). These discrepancies were then attributed to diverse climate
characteristics and forest types. Yet most of those reported results
were processed using correlation methodology, in which drought
legacy effects were considered constant on a fixed timescale (Mitch-
ell et al., 2016). In our research, we did not address the exact time-
scale of the drought legacy effect, but we did show that legacy
effects could be largely influenced by both the onset timing and
severity of drought. Therefore, drought legacy effects should be con-
sidered as a dynamic process in further studies.
As drought frequency or duration increased within a hydrological
year, repeated or continuous mild droughts could have similar
impacts on tree stem radial growth with severe droughts (Figures 4b
and 5b). This suggested that increasing the drought frequency and
duration could result in “cumulative effects” which would reduce
trees’ resistance, thus amplifying the impacts of drought on trees.
Previous observations and experiments have showed that prolonged
drought gradually pushed trees to a more vulnerable state and, when
increased in frequency, exposed the trees to a higher probability of
mortality (Adams et al., 2009; Allen et al., 2015; Mueller et al.,
2005). Conceptual frameworks for investigating cumulative effects
exist and these are well accepted (Allen et al., 2015; McDowell et al.,
2011; Mitchell et al., 2016); this study contributes to this topic fur-
ther by describing such cumulative effects in a relatively clear, quan-
titative way.
The interplay of multiple dimensions of drought has made the
impacts of drought on trees extremely complex and difficult to
model and predict accurately. Even if the total water deficits are the
same, difference among drought processes could result in consider-
ably different responses from the affected trees. These results help
us to reconsider the validity and rationality of building climate–growth relationships by pure statistics alone and using these rela-
tionships to reconstruct and predict drought events and impacts
(Fang et al., 2015; Mitchell et al., 2016; Sheppard et al., 2004).
Drought indices have been widely used to simplify the drought pro-
cess, and they are efficient tools for communicating drought levels
among involved entities (Zargar et al., 2011), but we should be
aware that such simplifications could also introduce uncertainties
and bias. Coupling the drought process with tree physiology and
phenology would significantly improve our ability of predicting
resulting complex phenomena, such as drought‐induced tree mortal-
ity and forest dieback.
4.2 | The evaluation for designing naturalexperiments
Regional‐scaled “natural experiments” offer a straightforward and
transparent method to explore regional response of trees to climate
variability, and they have the potential to allow for more detailed
(a) (b)
(c) (d)
F IGURE 5 Effect of drought duration indifferent drought severities on ring widthindice (RWI) specimens. (a) Comparison ofthe random and continuous droughts’effects on RWI specimens. (b) Comparisonof the random and continuous droughts indifferent severities on RWI specimens. (c)Comparison of the annual water balance ofcontinuous SI droughts and random SIIdroughts under 7‐month/year frequencycondition; sample sizes were 74 and 2,690,respectively. Dyanomaly of continuous SIdroughts was significantly higher than thatof random SII droughts (p < 0.001). (d)Cumulative effects of continuous SIdroughts on RWIs under a 7‐month/yearfrequency condition. No significantdifference was found between RWIs undercontinuous SI and random SII droughts
GAO ET AL. | 7

analyses (such as interspecies comparisons) when data are abundant.
Inspired by the experimental approach with clear control and ran-
domized design, natural experiments are observational studies with
ad hoc designs. Full spectrum of spatial and temporal dynamics in
natural condition resembles a complete randomized exposure, while
the ad hoc designs of drought scenarios allow us to test the effect
of the focal factor while controlling other factors (Dunning, 2008;
Petticrew et al., 2005; Rutter, 2007). In our case, the normalized
tree‐ring data (RWIs) was the dependent variable and the water bal-
ance condition was the independent factor that we could control
with ad hoc design/selection.
Tree‐rings, formed under a variable climate, are suitable for dis-
cerning the impacts of drought process since they are direct mea-
sures of stem growth and have both advantages of data availability
and continuity, spatially and temporally. Hence, using tree‐rings to
conduct regional‐scaled “natural experiments” could generate ten-
able results. Nevertheless, the accuracy of this approach will be
affected by the quantity and distribution of tree‐ring sites. Therefore,
on the basis of existing International Tree Ring Data Bank (ITRDB),
updated regularly, adding new sites to develop a more evenly dis-
tributed network could improve our ability to conduct regional‐ to
global‐scale explorations.
Southwest USA is an ideal region for investigating how tree stem
radial growth responds to drought process, not only because of its
densely distributed tree‐ring sites, but also owing to its characteristic
intra‐annual water balance conditions (Supporting Information Fig-
ure S2). First of all, water deficit is the most limiting factor for tree
stem radial growth in the Southwest USA (Adams & Kolb, 2005;
Hidalgo, Dracup, MacDonald, & King, 2001; Kolb, 2015), and this
was basis of our study approach. Second, the correlation between
monthly water balance anomalies (Dmanomaly) and RWIs is mostly
positive (Supporting Information Figure S2a), suggesting that water
deficit limits tree‐ring growth there all year round. This is also impor-
tant because inconsistent limiting effects would cause interference
when studying the impacts of drought processes. Third, variation in
the monthly water balance anomaly (Dmanomaly) was roughly
(a) (b)
(c) (d)
(e) (f)
(g) (h)
F IGURE 6 Effect of onset timing andseverity of drought on ring width indices(RWIs). (a) Monthly water balancecondition of continuous SI droughts in thepregrowing season (blue center linesindicate medians, the bottom and topedges indicate the 25th and 75thpercentiles, the whiskers extend to all datapoints except outliers which are plottedindividually using “+”). (b) Monthly waterbalance condition of continuous SIdroughts in the growing season (orangecenter lines indicate medians). (c, e, g)Comparison of annual water balanceDyanomalies of pregrowing season (bluebars) and growing season (orange bars)drought scenarios under SI, SII, and SIIIlevels of drought severity. A significantdifference in the Dyanomaly betweenpregrowing and growing seasons wasfound under each severity. (d, f, h) Impactof drought onset timing on RWIs for SI,SII, and SIII severity. A significantdifference in the RWIs betweenpregrowing and growing seasons wasfound under each severity level. Samplesizes for the pregrowing season andgrowing season for SI were 1,731 and1,485 (c, d), for SII they were 279 and 284(e, f), for SIII they were 127 and 48 (g, h),respectively
8 | GAO ET AL.
constant within a hydrological year (Supporting Information Fig-
ure S2b), suggesting that each month could be treated equally when
designing drought scenarios. Finally, a variable climate could result in
diverse tree‐ring samples, which are helpful for reducing bias in natu-
ral experiments (Rutter, 2007). With these “near‐standard” water
balance characteristics, it was reasonable to extract relatively general
response patterns of tree stem radial growth to drought process.
Nevertheless, might these patterns also be found in other regions
with different climate types?
Mediterranean climate areas, for instance, with hot, dry summers
and cool, wet winters, are very different from Southwest USA where
the climate is driven by a summer monsoon. After examining interan-
nual water balance conditions (Supporting Information Figures S1, S3
and S5), California with Mediterranean climate (Köppen, 2011) is
suitable in general for testing response patterns of tree‐ring to
drought process (Supporting Information Figures S4, S5 and
Table S2), but still the variations of monthly water balance anomaly
differ greatly within a hydrological year (Supporting Information Fig-
ure S5b). Nevertheless, the response pattern of tree‐ring growth to
different dimensions of drought in California did show similarity to
that in Southwest USA (Supporting Information Figure S6), which
strengthened our initial conclusions.
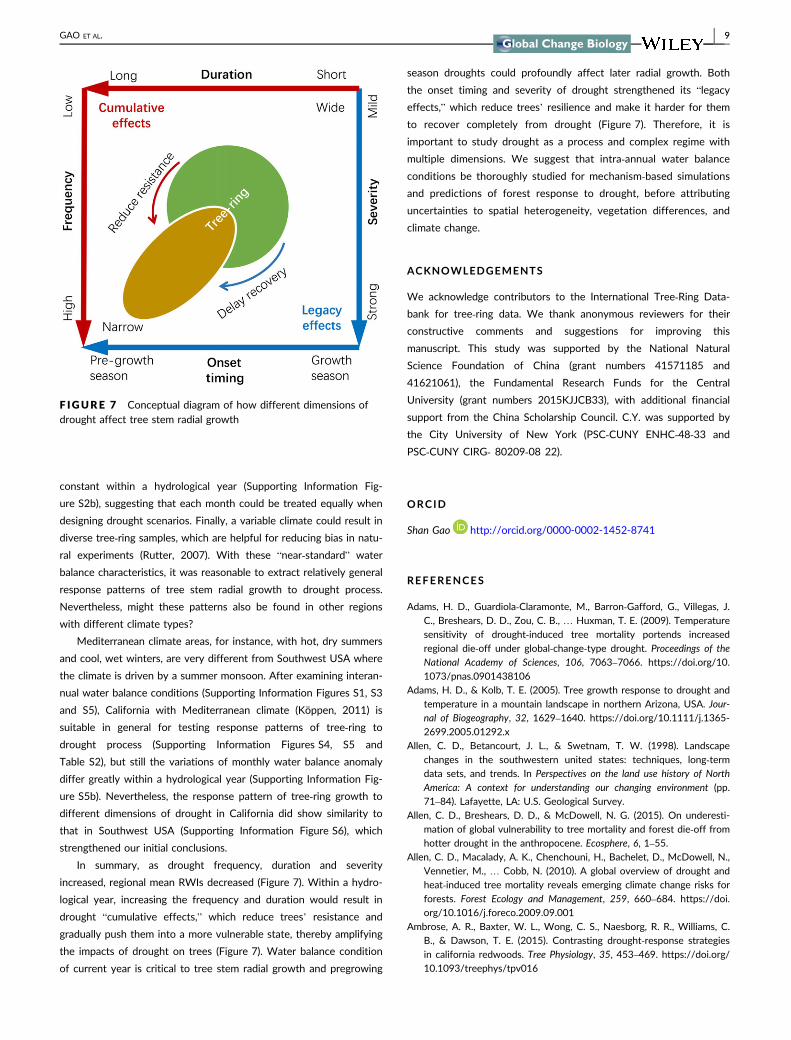
In summary, as drought frequency, duration and severity
increased, regional mean RWIs decreased (Figure 7). Within a hydro-
logical year, increasing the frequency and duration would result in
drought “cumulative effects,” which reduce trees’ resistance and
gradually push them into a more vulnerable state, thereby amplifying
the impacts of drought on trees (Figure 7). Water balance condition
of current year is critical to tree stem radial growth and pregrowing
season droughts could profoundly affect later radial growth. Both
the onset timing and severity of drought strengthened its “legacyeffects,” which reduce trees’ resilience and make it harder for them
to recover completely from drought (Figure 7). Therefore, it is
important to study drought as a process and complex regime with
multiple dimensions. We suggest that intra‐annual water balance
conditions be thoroughly studied for mechanism‐based simulations
and predictions of forest response to drought, before attributing
uncertainties to spatial heterogeneity, vegetation differences, and
climate change.
ACKNOWLEDGEMENTS
We acknowledge contributors to the International Tree‐Ring Data-
bank for tree‐ring data. We thank anonymous reviewers for their
constructive comments and suggestions for improving this
manuscript. This study was supported by the National Natural
Science Foundation of China (grant numbers 41571185 and
41621061), the Fundamental Research Funds for the Central
University (grant numbers 2015KJJCB33), with additional financial
support from the China Scholarship Council. C.Y. was supported by
the City University of New York (PSC‐CUNY ENHC‐48‐33 and
PSC‐CUNY CIRG‐ 80209‐08 22).
ORCID
Shan Gao http://orcid.org/0000-0002-1452-8741
REFERENCES
Adams, H. D., Guardiola‐Claramonte, M., Barron‐Gafford, G., Villegas, J.C., Breshears, D. D., Zou, C. B., … Huxman, T. E. (2009). Temperature
sensitivity of drought‐induced tree mortality portends increased
regional die‐off under global‐change‐type drought. Proceedings of the
National Academy of Sciences, 106, 7063–7066. https://doi.org/10.
1073/pnas.0901438106
Adams, H. D., & Kolb, T. E. (2005). Tree growth response to drought and
temperature in a mountain landscape in northern Arizona, USA. Jour-
nal of Biogeography, 32, 1629–1640. https://doi.org/10.1111/j.1365-2699.2005.01292.x
Allen, C. D., Betancourt, J. L., & Swetnam, T. W. (1998). Landscape
changes in the southwestern united states: techniques, long‐termdata sets, and trends. In Perspectives on the land use history of North
America: A context for understanding our changing environment (pp.
71–84). Lafayette, LA: U.S. Geological Survey.Allen, C. D., Breshears, D. D., & McDowell, N. G. (2015). On underesti-
mation of global vulnerability to tree mortality and forest die‐off fromhotter drought in the anthropocene. Ecosphere, 6, 1–55.
Allen, C. D., Macalady, A. K., Chenchouni, H., Bachelet, D., McDowell, N.,
Vennetier, M., … Cobb, N. (2010). A global overview of drought and
heat‐induced tree mortality reveals emerging climate change risks for
forests. Forest Ecology and Management, 259, 660–684. https://doi.org/10.1016/j.foreco.2009.09.001
Ambrose, A. R., Baxter, W. L., Wong, C. S., Naesborg, R. R., Williams, C.
B., & Dawson, T. E. (2015). Contrasting drought‐response strategies
in california redwoods. Tree Physiology, 35, 453–469. https://doi.org/10.1093/treephys/tpv016
F IGURE 7 Conceptual diagram of how different dimensions ofdrought affect tree stem radial growth
GAO ET AL. | 9

Anderegg, W. R. L., & Anderegg, L. D. L. (2012). Hydraulic and carbohy-
drate changes in experimental drought induced mortality of saplings
in two conifer species. Tree Physiology, 33, 252–260.Anderegg, W. R. L., Klein, T., Bartlett, M., Sack, L., Pellegrini, A. F. A., Choat,
B., & Jansen, S. (2016). Meta‐analysis reveals that hydraulic traits
explain cross‐species patterns of drought‐induced tree mortality across
the globe. Proceedings of the National Academy of Sciences, 113, 5024–5029. https://doi.org/10.1073/pnas.1525678113
Anderegg, W. R. L., Plavcová, L., Anderegg, L. D. L., Hacke, U. G., Berry,
J. A., & Field, C. B. (2013). Drought's legacy: Multiyear hydraulic
deterioration underlies widespread aspen forest die‐off and portends
increased future risk. Global Change Biology, 19, 1188–1196.https://doi.org/10.1111/gcb.12100
Anderegg, W. R. L., Schwalm, C., Biondi, F., Camarero, J. J., Koch, G., Lit-
vak, M., … Pacala, S. (2015). Pervasive drought legacies in forest
ecosystems and their implications for carbon cycle models. Science,
349, 528–532. https://doi.org/10.1126/science.aab1833Andujar, E., Krakauer, N. Y., Yi, C., & Kogan, F. (2017). Ecosystem
drought response timescales from thermal emission versus shortwave
remote sensing. Advances in Meteorology, 2017, 1–10. https://doi.
org/10.1155/2017/8434020
Barbeta, A., Mejía‐Chang, M., Ogaya, R., Voltas, J., Dawson, T. E., &
Peñuelas, J. (2015). The combined effects of a long‐term experimen-
tal drought and an extreme drought on the use of plant‐water
sources in a mediterranean forest. Global Change Biology, 21, 1213–1225. https://doi.org/10.1111/gcb.12785
Barnes, M. L., Moran, M. S., Scott, R. L., Kolb, T. E., Ponce‐Campos, G. E.,
Moore, D. J. P., … Dore, S. (2016). Vegetation productivity responds
to sub‐ annual climate conditions across semiarid biomes. Ecosphere,
7, e01339. https://doi.org/10.1002/ecs2.1339
Bennett, A. C., McDowell, N. G., Allen, C. D., & Anderson‐Teixeira, K. J.(2015). Larger trees suffer most during drought in forests worldwide.
Nature Plants, 1, 15139. https://doi.org/10.1038/nplants.2015.139
Bhuyan, U., Zang, C., Vicente‐Serrano, S., & Menzel, A. (2017). Exploring
relationships among tree‐ring growth, climate variability, and seasonal
leaf activity on varying timescales and spatial resolutions. Remote
Sensing, 9, 526. https://doi.org/10.3390/rs9060526
Biederman, J. A., Scott, R. L., Bell, T. W., Bowling, D. R., Dore, S., Gara-
tuza‐Payan, J., … Goulden, M. L. (2017). CO2 exchange and evapo-
transpiration across dryland ecosystems of southwestern north
America. Global Change Biology, 23, 4204–4221. https://doi.org/10.1111/gcb.13686
Breshears, D. D., Cobb, N. S., Rich, P. M., Price, K. P., Allen, C. D., Balice,
R. G., … Meyer, C. W. (2005). Regional vegetation die‐off in response
to global‐change‐type drought. Proceedings of the National Academy
of Sciences, 102, 15144–15148. https://doi.org/10.1073/pnas.
0505734102
Choat, B., Jansen, S., Brodribb, T. J., Cochard, H., Delzon, S., Bhaskar, R.,
… Zanne, A. E. (2012). Global convergence in the vulnerability of for-
ests to drought. Nature, 491, 752–756. https://doi.org/10.1038/nature11688
Cook, E. R. (1985). a time series analysis approach to tree ring standardiza-
tion. Tucson, AZ: University of Arizona.
Cook, B. I., Ault, T. R., & Smerdon, J. E. (2015). Unprecedented 21st cen-
tury drought risk in the american southwest and central plains.
Science Advances, 1, e1400082.
Ditmarova, L., Kurjak, D., Palmroth, S., Kmet, J., & Strelcova, K. (2009).
Physiological responses of norway spruce (picea abies) seedlings to
drought stress. Tree Physiology, 30, 205–213.Dobbertin, M. (2005). Tree growth as indicator of tree vitality and of tree
reaction to environmental stress: A review. European Journal of Forest
Research, 124, 319–333. https://doi.org/10.1007/s10342-005-0085-3Dorman, M., Svoray, T., Perevolotsky, A., & Sarris, D. (2013). Forest per-
formance during two consecutive drought periods: Diverging long‐term trends and short‐term responses along a climatic gradient.
Forest Ecology and Management, 310, 1–9. https://doi.org/10.1016/j.foreco.2013.08.009
Dunning, T. (2008). Improving causal inference–strengths and limitations
of natural experiments. Political Research Quarterly, 61, 282–293.https://doi.org/10.1177/1065912907306470
Fang, K., Frank, D., Zhao, Y., Zhou, F., & Seppa, H. (2015). Moisture
stress of a hydrological year on tree growth in the tibetan plateau
and surroundings. Environmental Research Letters, 10, 034010.
https://doi.org/10.1088/1748-9326/10/3/034010
González‐Cásares, M., Pompa‐García, M., & Camarero, J. J. (2017). Differ-
ences in climate–growth relationship indicate diverse drought toler-
ances among five pine species coexisting in northwestern mexico.
Trees, 31, 531–544. https://doi.org/10.1007/s00468-016-1488-0Hagedorn, F., Shiyatov, S. G., Mazepa, V. S., Devi, N. M., Grigor'ev, A. A.,
Bartish, A. A., … Moiseev, P. A. (2014). Treeline advances along the
Urals mountain range – driven by improved winter conditions? Global
Change Biology, 20, 3530–3543. https://doi.org/10.1111/gcb.12613Halwatura, D., Lechner, A. M., & Arnold, S. (2015). Drought severity–du-
ration–frequency curves: A foundation for risk assessment and plan-
ning tool for ecosystem establishment in post‐mining landscapes.
Hydrology and Earth System Sciences, 19, 1069–1091. https://doi.org/10.5194/hess-19-1069-2015
He, M., Shishov, V., Kaparova, N., Yang, B., Bräuning, A., & Grießinger, J.(2017). Process‐based modeling of tree‐ring formation and its rela-
tionships with climate on the tibetan plateau. Dendrochronologia, 42,
31–41. https://doi.org/10.1016/j.dendro.2017.01.002Hidalgo, H. C., Dracup, J. A., MacDonald, G. M., & King, J. A. (2001).
Comparison of tree species sensitivity to high- and low-extreme
hydroclimatic events. Physical Geography, 22, 115–134.Huang, K., Yi, C., Wu, D., Zhou, T., Zhao, X., Blanford, W. J., … Li, Z.
(2015). Tipping point of a conifer forest ecosystem under severe
drought. Environmental Research Letters, 10, 024011. https://doi.org/
10.1088/1748-9326/10/2/024011
Julio Camarero, J., Miguel Olano, J., & Parras, A. (2010). Plastic bimodal xylo-
genesis in conifers from continental Mediterranean climates. New Phytolo-
gist, 185, 471–480. https://doi.org/10.1111/j.1469-8137.2009.03073.xKolb, T. E. (2015). A new drought tipping point for conifer mortality.
Environmental Research Letters, 10, 031002. https://doi.org/10.1088/
1748-9326/10/3/031002
Köppen, W. (2011). The thermal zones of the earth according to the
duration of hot, moderate and cold periods and to the impact of heat
on the organic world. Meteorologische Zeitschrift, 20, 351–360.https://doi.org/10.1127/0941-2948/2011/105
Li, Z., Zhou, T., Zhao, X., Huang, K., Gao, S., Wu, H., & Luo, H. (2015).
Assessments of drought impacts on vegetation in China with the
optimal time scales of the climatic drought index. International Journal
of Environmental Research and Public Health, 12, 7615–7634.https://doi.org/10.3390/ijerph120707615
Luo, H., Zhou, T., Wu, H., Zhao, X., Wang, Q., Gao, S., & Li, Z. (2016).
Contrasting responses of planted and natural forests to drought
intensity in yunnan, china. Remote Sensing, 8, 635. https://doi.org/10.
3390/rs8080635
Luo, H., Zhou, T., Yi, C., Xu, P., Zhao, X., Gao, S., & Liu, X. (2018). Stock
volume dependency of forest drought responses in yunnan, china.
Forests, 9, 209. https://doi.org/10.3390/f9040209
McDowell, N. G., & Allen, C. D. (2015). Darcy's law predicts widespread
forest mortality under climate warming. Nature Climate Change, 5,
669–672. https://doi.org/10.1038/nclimate2641
McDowell, N. G., Beerling, D. J., Breshears, D. D., Fisher, R. A., Raffa, K.
F., & Stitt, M. (2011). The interdependence of mechanisms underlying
climate‐driven vegetation mortality. Trends in Ecology & Evolution, 26,
523–532. https://doi.org/10.1016/j.tree.2011.06.003Mckee, T. B., Doesken, N. J., & Kleist, J. (1993). The relationship of
drought frequency and duration to time scales. Eighth Conference on
Applied Climatology, 17, 179–184.
10 | GAO ET AL.

Mitchell, P. J., O'Grady, A. P., Pinkard, E. A., Brodribb, T. J., Arndt, S. K.,
Blackman, C. J., … Tissue, D. T. (2016). An ecoclimatic framework for
evaluating the resilience of vegetation to water deficit. Global Change
Biology, 22, 1677–1689. https://doi.org/10.1111/gcb.13177Mueller, R. C., Scudder, C. M., Porter, M. E., TrotterIII, R. T., Gehring, C. A., &
Whitham, T. G. (2005). Differential tree mortality in response to severe
drought: Evidence for long‐term vegetation shifts. Journal of Ecology, 93,
1085–1093. https://doi.org/10.1111/j.1365-2745.2005.01042.xNovick, K. A., Ficklin, D. L., Stoy, P. C., Williams, C. A., Bohrer, G., Oishi,
A. C., … Phillips, R. P. (2016). The increasing importance of atmo-
spheric demand for ecosystem water and carbon fluxes. Nature Cli-
mate Change, 6, 1023–1027. https://doi.org/10.1038/nclimate3114
Pan, M., Yuan, X., & Wood, E. F. (2013). A probabilistic framework for
assessing drought recovery. Geophysical Research Letters, 40, 3637–3642. https://doi.org/10.1002/grl.50728
Pasho, E., Julio Camarero, J., & Vicente‐Serrano, S. M. (2012). Climatic
impacts and drought control of radial growth and seasonal wood for-
mation in pinus halepensis. Trees, 26, 1875–1886. https://doi.org/10.1007/s00468-012-0756-x
Petticrew, M., Cummins, S., Ferrell, C., Findlay, A., Higgins, C., Hoy, C., …Sparks, L. (2005). Natural experiments: An underused tool for public
health? Public Health, 119, 751–757. https://doi.org/10.1016/j.puhe.2004.11.008
Reichstein, M., Bahn, M., Ciais, P., Frank, D., Mahecha, M. D., Seneviratne,
S. I., … Wattenbach, M. (2013). Climate extremes and the carbon cycle.
Nature, 500, 287–295. https://doi.org/10.1038/nature12350Rigling, A., Bräker, O., Schneiter, G., & Schweingruber, F. (2002). Intra‐an-
nual tree‐ring parameters indicating differences in drought stress of
pinus sylvestris forests within the erico‐pinion in the valais (switzer-
land). Plant Ecology, 163, 105–121. https://doi.org/10.1023/A:
1020355407821
Rosbakh, S., Leingärtner, A., Hoiss, B., Krauss, J., Steffan‐Dewenter, I., &
Poschlod, P. (2017). Contrasting effects of extreme drought and
snowmelt patterns on mountain plants along an elevation gradient.
Frontiers in Plant Science, 8, 01478. https://doi.org/10.3389/fpls.
2017.01478
Rutter, M. (2007). Proceeding from observed correlation to causal inference–the use of natural experiments. Perspectives On Psychological Science, 2,
377–395. https://doi.org/10.1111/j.1745-6916.2007.00050.xRyan, M. G. (2011). Tree responses to drought. Tree Physiology, 31, 237–
239. https://doi.org/10.1093/treephys/tpr022
Salzer, M. W., & Kipfmueller, K. F. (2005). Reconstructed temperature
and precipitation on a millennial timescale from tree‐rings in the
southern Colorado Plateau, U.S.A. Climatic Change, 70, 465–487.https://doi.org/10.1007/s10584-005-5922-3
Sheppard, P. R., Tarasov, P. E., Graumlich, L. J., Heussner, K. U., Wagner,
M., Sterle, H., & Thompson, L. G. (2004). Annual precipitation since
515 BC reconstructed from living and fossil juniper growth of north-
eastern qinghai province, china. Climate Dynamics, 23, 869–881.https://doi.org/10.1007/s00382-004-0473-2
Spinoni, J., Naumann, G., Carrao, H., Barbosa, P., & Vogt, J. (2014). World
drought frequency, duration, and severity for 1951‐2010. Interna-
tional Journal of Climatology, 34, 2792–2804. https://doi.org/10.
1002/joc.3875
Vicente‐Serrano, S. M., Beguería, S., & López‐Moreno, J. I. (2010). A mul-
tiscalar drought index sensitive to global warming: The standardized
precipitation evapotranspiration index. Journal of Climate, 23, 1696–1718. https://doi.org/10.1175/2009JCLI2909.1
Vicente‐Serrano, S. M., Camarero, J. J., & Azorin‐Molina, C. (2014).
Diverse responses of forest growth to drought time‐scales in the
northern hemisphere. Global Ecology and Biogeography, 23, 1019–1030. https://doi.org/10.1111/geb.12183
Vicente‐Serrano, S. M., Gouveia, C., Camarero, J. J., Beguería, S., Trigo,
R., López‐Moreno, J. I., … Sanchez‐Lorenzo, A. (2013). Response of
vegetation to drought time‐scales across global land biomes.
Proceedings of the National Academy of Sciences, 110, 52–57.https://doi.org/10.1073/pnas.1207068110
Wei, S., Yi, C., Fang, W., & Hendrey, G. (2017). A global study of GPP
focusing on light‐use efficiency in a random forest regression model.
Ecosphere, 8, e01724. https://doi.org/10.1002/ecs2.1724
Wei, S., Yi, C., Hendrey, G., Eaton, T., Rustic, G., Wang, S., … Valentini, R.
(2014). Data‐based perfect‐deficit approach to understanding climate
extremes and forest carbon assimilation capacity. Environmental Research
Letters, 9, 065002. https://doi.org/10.1088/1748-9326/9/6/065002
Williams, A. P., Allen, C. D., Macalady, A. K., Griffin, D., Woodhouse, C.
A., Meko, D. M., … McDowell, N. G. (2012). Temperature as a potent
driver of regional forest drought stress and tree mortality. Nature Cli-
mate Change, 3, 292–297.Williams, A. P., Michaelsen, J., Leavitt, S. W., & Still, C. J. (2010). Using
tree rings to predict the response of tree growth to climate change
in the continental united states during the twenty‐first century. EarthInteractions, 14, 1–20. https://doi.org/10.1175/2010EI362.1
Wu, X., Liu, H., Li, X., Ciais, P., Babst, F., Guo, W., … Ma, Y. (2017). Dif-
ferentiating drought legacy effects on vegetation growth over the
temperate northern hemisphere. Global Change Biology, 24, 504–516.Wu, D., Zhao, X., Liang, S., Zhou, T., Huang, K., Tang, B., & Zhao, W.
(2015). Time‐lag effects of global vegetation responses to climate
change. Global Change Biology, 21, 3520–3531. https://doi.org/10.
1111/gcb.12945
Xu, P., Zhou, T., Zhao, X., Luo, H., Gao, S., Li, Z., & Cao, L. (2018). Diverse
responses of different structured forest to drought in Southwest
China through remotely sensed data. International Journal of Applied
Earth Observation and Geoinformation, 69, 217–225. https://doi.org/10.1016/j.jag.2018.03.009
Yi, C., Mu, G., Hendrey, G., Vicente‐Serrano, S. M., Fang, W., Zhou, T., …Xu, P. (2018). Bifurcated response of a regional forest to drought.
Expert Opinion on Environmental Biology, 7(2), 1000153.
Yi, C., Pendall, E., & Ciais, P. (2015). Focus on extreme events and the
carbon cycle. Environmental Research Letters, 10, 070201. https://doi.
org/10.1088/1748-9326/10/7/070201
Yi, C., Ricciuto, D., Li, R., Wolbeck, J., Xu, X., Nilsson, M., … Zhao, X.
(2010). Climate control of terrestrial carbon exchange across biomes
and continents. Environmental Research Letters, 5, 034007. https://
doi.org/10.1088/1748-9326/5/3/034007
Yi, C., Rustic, G., Xu, X., Wang, J., Dookie, A., Wei, S., … Pinter, K.
(2012). Climate extremes and grassland potential productivity. Envi-
ronmental Research Letters, 7, 035703. https://doi.org/10.1088/1748-
9326/7/3/035703
Zargar, A., Sadiq, R., Naser, B., & Khan, F. I. (2011). A review of drought
indices. Environmental Reviews, 19, 333–349. https://doi.org/10.
1139/a11-013
Zhou, T., Yi, C., Bakwin, P. S., & Zhu, L. (2008). Links between global
CO2 variability and climate anomalies of biomes. Science in China Ser-
ies D: Earth Sciences, 51, 740–747.
SUPPORTING INFORMATION
Additional supporting information may be found online in the
Supporting Information section at the end of the article.
How to cite this article: Gao S, Liu R, Zhou T, et al. Dynamic
responses of tree‐ring growth to multiple dimensions of
drought. Glob Change Biol. 2018;00:1–12. https://doi.org/10.1111/gcb.14367
GAO ET AL. | 11