Dynamic Progressive Collapse of an RC Assemblage … Progressive Collapse of an RC Assemblage...
22
submitted to Journal of Structural Engineering, ASCE (2013) 1 Dynamic Progressive Collapse of an RC Assemblage Induced by Contact Detonation Jun Yu a,b , Tassilo Rinder a , Alexander Stolz a,1 , Kang-Hai Tan b , Werner Riedel a a Dept. Safety Technology and Protective Structures, Fraunhofer Institute for High-Speed Dynamics, Ernst-Mach-Institut, Am Klingelberg 1, D-79588 Efringen-Kirchen, Germany b Protection Technology and Research Center, School of Civil and Environmental Engineering, Nanyang Technological University, 50 Nanyang Avenue, Singapore 639798 ________________________________________________________________________________ Abstract The nature of progressive collapse is a dynamic event caused by accidental or intentional extraordinary loading. Most published experimental programs are conducted statically, without consideration of the accidental loading and regarding progressive collapse as event-independent. This paper demonstrates the more realistic process of progressive collapse in an experimental program on reinforced concrete sub-assemblages collapsed by a combination of dead weight loading and contact detonation. The dynamic results are represented systematically at different aspects and compared with previous published quasi-static experiments in terms of structural mechanisms, crack patterns and local failure modes. Moreover, the dynamic increase factor (DIF) of reinforcing bars and the dynamic load amplification factor (DLAF) are investigated and discussed. Following the above comparisons and the findings in the dynamic tests, previous quasi- static test results can be linked to actual progressive collapse behavior more convincingly. Finally, the dynamic tests also highlight the effect of contact detonation on structures, which are often not considered in quasi-static tests and design guidelines. The test results indicate that contact detonation cause the uplift and the out-of-plane actions to the sub-assemblage before their downward movement under gravity load, in which the strain rate of reinforcement is between 10 -2 /s to 10 -1 /s. Moreover, the structural mechanisms are similar in both quasi-static and dynamic tests. Keywords: Progressive collapse, detonation, reinforced concrete, dynamic increase factor, dynamic load amplification factor, compressive arch action, catenary action ________________________________________________________________________________ 1 Introduction The partial collapse of Ronan Point apartment in London in 1968, the severe damage on Murrah Federal Building in Oklahoma City in 1995 due to terrorist attack and the 9/11 WTC event in 2001 sequentially raise public concerns and intensify research interests on progressive collapse of buildings. The design methodology in current building guidelines (DoD 2010; GSA 2003) and codes (ASCE 2005; EN 1996-1-7 2006) against progressive collapse is broadly divided into indirect 1 corresponding author: [email protected]
Transcript of Dynamic Progressive Collapse of an RC Assemblage … Progressive Collapse of an RC Assemblage...
submitted to Journal of Structural Engineering, ASCE (2013)
1
Dynamic Progressive Collapse of an RC Assemblage Induced by Contact Detonation
Jun Yua,b, Tassilo Rindera, Alexander Stolza,1, Kang-Hai Tanb, Werner Riedela
aDept. Safety Technology and Protective Structures, Fraunhofer Institute for High-Speed Dynamics, Ernst-Mach-Institut, Am Klingelberg 1, D-79588 Efringen-Kirchen, Germany
bProtection Technology and Research Center, School of Civil and Environmental Engineering, Nanyang Technological University, 50 Nanyang Avenue, Singapore 639798
________________________________________________________________________________
Abstract
The nature of progressive collapse is a dynamic event caused by accidental or intentional extraordinary loading. Most published experimental programs are conducted statically, without consideration of the accidental loading and regarding progressive collapse as event-independent. This paper demonstrates the more realistic process of progressive collapse in an experimental program on reinforced concrete sub-assemblages collapsed by a combination of dead weight loading and contact detonation. The dynamic results are represented systematically at different aspects and compared with previous published quasi-static experiments in terms of structural mechanisms, crack patterns and local failure modes. Moreover, the dynamic increase factor (DIF) of reinforcing bars and the dynamic load amplification factor (DLAF) are investigated and discussed. Following the above comparisons and the findings in the dynamic tests, previous quasi-static test results can be linked to actual progressive collapse behavior more convincingly. Finally, the dynamic tests also highlight the effect of contact detonation on structures, which are often not considered in quasi-static tests and design guidelines. The test results indicate that contact detonation cause the uplift and the out-of-plane actions to the sub-assemblage before their downward movement under gravity load, in which the strain rate of reinforcement is between 10-2/s to 10-1/s. Moreover, the structural mechanisms are similar in both quasi-static and dynamic tests.
Keywords: Progressive collapse, detonation, reinforced concrete, dynamic increase factor, dynamic load amplification factor, compressive arch action, catenary action
________________________________________________________________________________
1 Introduction
The partial collapse of Ronan Point apartment in London in 1968, the severe damage on Murrah Federal Building in Oklahoma City in 1995 due to terrorist attack and the 9/11 WTC event in 2001 sequentially raise public concerns and intensify research interests on progressive collapse of buildings. The design methodology in current building guidelines (DoD 2010; GSA 2003) and codes (ASCE 2005; EN 1996-1-7 2006) against progressive collapse is broadly divided into indirect
1 corresponding author: [email protected]

Yu J., Rinder T., Stolz A., Tan K.H., Riedel W., Dynamic Progressive Collapse of an RC Assemblage Induced by Contact Detonation
2
and direct methods. The indirect method specifies prescriptive ‘tying force’ provisions which are deemed sufficient for avoiding progressive collapse. Depending on whether the damage in columns is allowed, the direct method is further categorized into alternate load path (ALP) approach and specific load resistance method. ALP method is applied by removing one column at each time and check the structural resistance of remaining buildings through structural analysis, including linear static, nonlinear static or nonlinear dynamic analysis (NLD). Since progressive collapse essentially involves material nonlinearity and dynamic effects, NLD analysis is the most accurate. However, NLD analysis using Finite-Element-Methods is so computationally-demanding and time-consuming (Marjanishvili 2004) so that practicing engineers are reluctant to use it. As an alternative, “Applied Element Methods (AEM)” for efficient NLD collapse simulation are being developed and are recently available in commercial software (Helmy et al. 2012; Tagel-Din 2009), but this approach has not widespread in day-to-day building design. Therefore, static analysis is still by far the most preferred approach, but the results should be modified by linear increase factor (LIF) and dynamic increase factor (DIF), respectively, to relate linear and nonlinear static procedures to NLD procedures (DoD 2010). To avoid confusing the DIF for material strength in dynamic loading, the DIF for structural capacity is replaced by dynamic load amplification factor (DLAF) in this paper, further explained in section 4.
To validate design methods and investigate structural performance of reinforced concrete (RC) frames at large deformations, many quasi-static tests on RC frames or sub-assemblages have been carried out under column removal scenarios (Orton et al. 2009; Sadek et al. 2011; Sasani and Kropelnicki 2008; Su et al. 2009; Yi et al. 2008; Yu and Tan 2011; 2012). The experimental results show that with adequate horizontal restraints, RC frames can develop compressive arch action and catenary action, of which structural capacities greatly exceed flexural capacities. Otherwise, structural resistance is mainly dominated by flexure. Izzuddin et al. (2008) have proposed a framework to convert available nonlinear static structural behavior into dynamic capacities based on energy equilibrium. Furthermore, the dynamic performances of small-scaled RC frames under sudden removal of corner columns (Kai and Li 2012) and steel frames under sudden removal of middle columns (Liu et al. 2012) are reported, providing valuable information on structural dynamic performance. However, all the aforementioned tests decoupled the initial damage of columns and the structural performance of remaining structures, which may not represent real situations in the actual accident or event. Two in-situ tests on RC buildings with explosively removed columns are reported in the literature (Sasani et al. 2007; Sasani and Sagiroglu 2008), but the maximum deflections of the beams above removed columns in the two tests were only 6.6 mm and 6.1 mm, respectively. They are not representative for structural behavior under large deformations.
In this paper, therefore, a dynamic test with large dead load and with explosive removal of the middle column was conducted to investigate:
(1) the difference between event-independent tests and the blast test (2) structural dynamic behavior up to a large deformation (3) whether high strain rates are induced to increase material strength (4) the dynamic load amplification factor DLAF.
In particular, the specimen detailing was the same as in previous detailed static investigations of the same author (Yu and Tan 2011) in order to highlight the differences in dynamic response.
submitted to Journal of Structural Engineering, ASCE (2013)
3
2 Test Preparations
2.1 Specimen Design
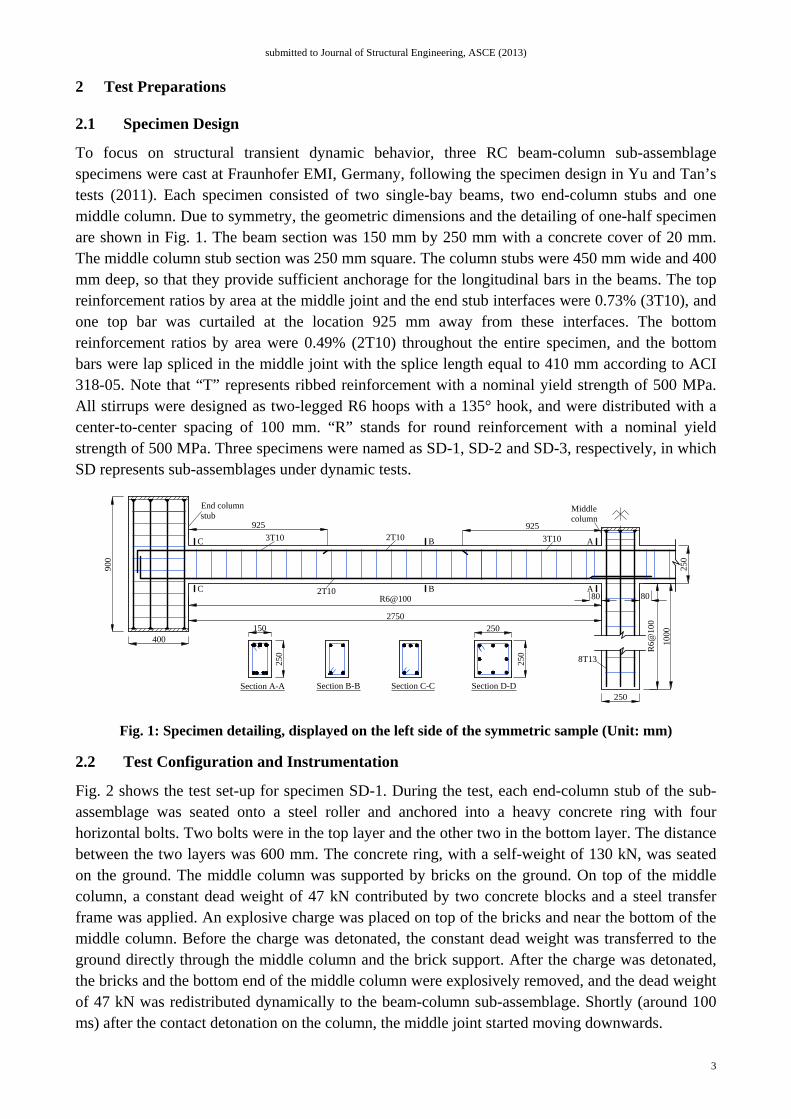
To focus on structural transient dynamic behavior, three RC beam-column sub-assemblage specimens were cast at Fraunhofer EMI, Germany, following the specimen design in Yu and Tan’s tests (2011). Each specimen consisted of two single-bay beams, two end-column stubs and one middle column. Due to symmetry, the geometric dimensions and the detailing of one-half specimen are shown in Fig. 1. The beam section was 150 mm by 250 mm with a concrete cover of 20 mm. The middle column stub section was 250 mm square. The column stubs were 450 mm wide and 400 mm deep, so that they provide sufficient anchorage for the longitudinal bars in the beams. The top reinforcement ratios by area at the middle joint and the end stub interfaces were 0.73% (3T10), and one top bar was curtailed at the location 925 mm away from these interfaces. The bottom reinforcement ratios by area were 0.49% (2T10) throughout the entire specimen, and the bottom bars were lap spliced in the middle joint with the splice length equal to 410 mm according to ACI 318-05. Note that “T” represents ribbed reinforcement with a nominal yield strength of 500 MPa. All stirrups were designed as two-legged R6 hoops with a 135° hook, and were distributed with a center-to-center spacing of 100 mm. “R” stands for round reinforcement with a nominal yield strength of 500 MPa. Three specimens were named as SD-1, SD-2 and SD-3, respectively, in which SD represents sub-assemblages under dynamic tests.
Fig. 1: Specimen detailing, displayed on the left side of the symmetric sample (Unit: mm)
2.2 Test Configuration and Instrumentation
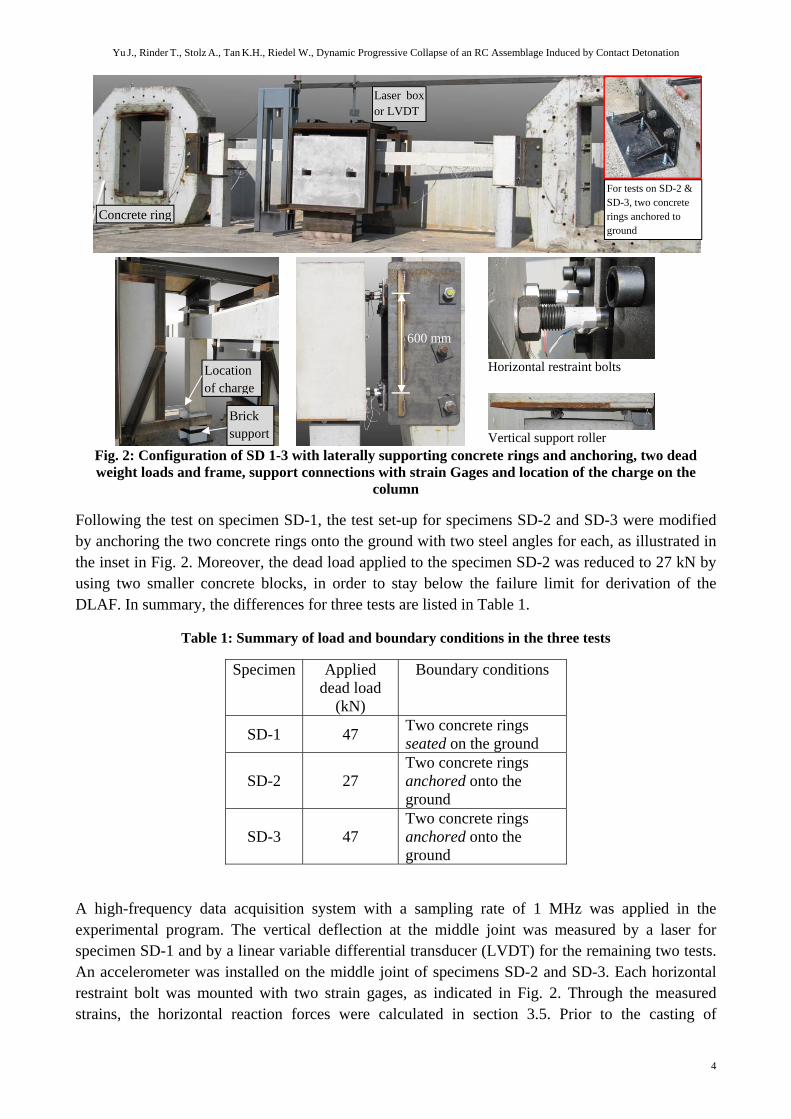
Fig. 2 shows the test set-up for specimen SD-1. During the test, each end-column stub of the sub-assemblage was seated onto a steel roller and anchored into a heavy concrete ring with four horizontal bolts. Two bolts were in the top layer and the other two in the bottom layer. The distance between the two layers was 600 mm. The concrete ring, with a self-weight of 130 kN, was seated on the ground. The middle column was supported by bricks on the ground. On top of the middle column, a constant dead weight of 47 kN contributed by two concrete blocks and a steel transfer frame was applied. An explosive charge was placed on top of the bricks and near the bottom of the middle column. Before the charge was detonated, the constant dead weight was transferred to the ground directly through the middle column and the brick support. After the charge was detonated, the bricks and the bottom end of the middle column were explosively removed, and the dead weight of 47 kN was redistributed dynamically to the beam-column sub-assemblage. Shortly (around 100 ms) after the contact detonation on the column, the middle joint started moving downwards.
80
Section A-A Section B-B
2T103T10 3T10
2T10
Section C-C Section D-D
250
150
250
250
250
8T13
925 925
2750
900
400
R6@100
C
C
B
B
A
A
End columnstub
Middlecolumn
1000
R6@
100
250
80
Yu J., Rinder T., Stolz A., Tan K.H., Riedel W., Dynamic Progressive Collapse of an RC Assemblage Induced by Contact Detonation
4
Horizontal restraint bolts
Vertical support roller
Fig. 2: Configuration of SD 1-3 with laterally supporting concrete rings and anchoring, two dead weight loads and frame, support connections with strain Gages and location of the charge on the
column
Following the test on specimen SD-1, the test set-up for specimens SD-2 and SD-3 were modified by anchoring the two concrete rings onto the ground with two steel angles for each, as illustrated in the inset in Fig. 2. Moreover, the dead load applied to the specimen SD-2 was reduced to 27 kN by using two smaller concrete blocks, in order to stay below the failure limit for derivation of the DLAF. In summary, the differences for three tests are listed in Table 1.
Table 1: Summary of load and boundary conditions in the three tests
Specimen Applied dead load
(kN)
Boundary conditions
SD-1 47 Two concrete rings seated on the ground
SD-2 27 Two concrete rings anchored onto the ground
SD-3 47 Two concrete rings anchored onto the ground
A high-frequency data acquisition system with a sampling rate of 1 MHz was applied in the experimental program. The vertical deflection at the middle joint was measured by a laser for specimen SD-1 and by a linear variable differential transducer (LVDT) for the remaining two tests. An accelerometer was installed on the middle joint of specimens SD-2 and SD-3. Each horizontal restraint bolt was mounted with two strain gages, as indicated in Fig. 2. Through the measured strains, the horizontal reaction forces were calculated in section 3.5. Prior to the casting of
Concrete ring
600 mm
Brick support
Laser box or LVDT
Location of charge
For tests on SD-2 & SD-3, two concrete rings anchored to ground
submitted to Journal of Structural Engineering, ASCE (2013)
5
specimens, 20 strain gages were attached onto steel reinforcing bars. During the test, the variations of bar strains at critical beam sections were recorded to shed light on the force transfer mechanism within the specimen.
2.3 Material Properties of the Structural Specimens
All specimens were cured more than 28 days. Immediately following the structural tests, three 150 mm concrete cubes were tested to obtain the concrete strength for each specimen. The cube compressive strengths were 36 / 41 / 50 MPa for specimens SD-1 to 3, respectively (cylinder strengths 26 / 31 / 40 MPa according to (EN 1992-1-1 2004)).
Uniaxial tensile tests were conducted on four reinforcing bar samples with gage length of 200 mm to determine the material properties of reinforcing bars used in three sub-assemblage specimens. The yield and the tensile strengths were 528 and 607 MPa, respectively, based on the nominal cross-section area. The technical strain at ultimate tensile strength was 15.4%.
3 Experimental Results
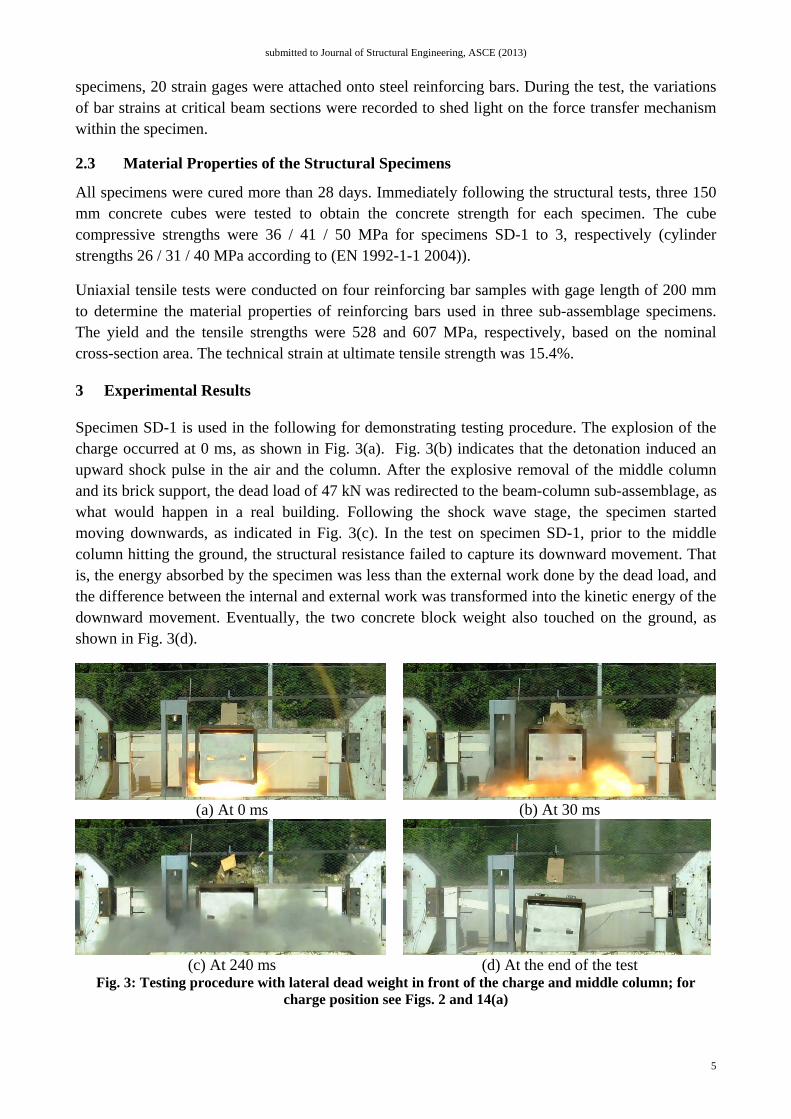
Specimen SD-1 is used in the following for demonstrating testing procedure. The explosion of the charge occurred at 0 ms, as shown in Fig. 3(a). Fig. 3(b) indicates that the detonation induced an upward shock pulse in the air and the column. After the explosive removal of the middle column and its brick support, the dead load of 47 kN was redirected to the beam-column sub-assemblage, as what would happen in a real building. Following the shock wave stage, the specimen started moving downwards, as indicated in Fig. 3(c). In the test on specimen SD-1, prior to the middle column hitting the ground, the structural resistance failed to capture its downward movement. That is, the energy absorbed by the specimen was less than the external work done by the dead load, and the difference between the internal and external work was transformed into the kinetic energy of the downward movement. Eventually, the two concrete block weight also touched on the ground, as shown in Fig. 3(d).
(a) At 0 ms
(b) At 30 ms
(c) At 240 ms
(d) At the end of the test
Fig. 3: Testing procedure with lateral dead weight in front of the charge and middle column; for charge position see Figs. 2 and 14(a)
Yu J., Rinder T., Stolz A., Tan K.H., Riedel W., Dynamic Progressive Collapse of an RC Assemblage Induced by Contact Detonation
6
With improved boundary conditions and a smaller applied dead load, the downward movement of specimen SD-2 was arrested by the structural resistance during the redirection process of loads. However, the load of 47 kN still caused specimen SD-3 to move down to contact with the ground. Detailed test results for three specimens will be illustrated in the following subsections.
3.1 Contact Detonation Damage of the three Middle Columns
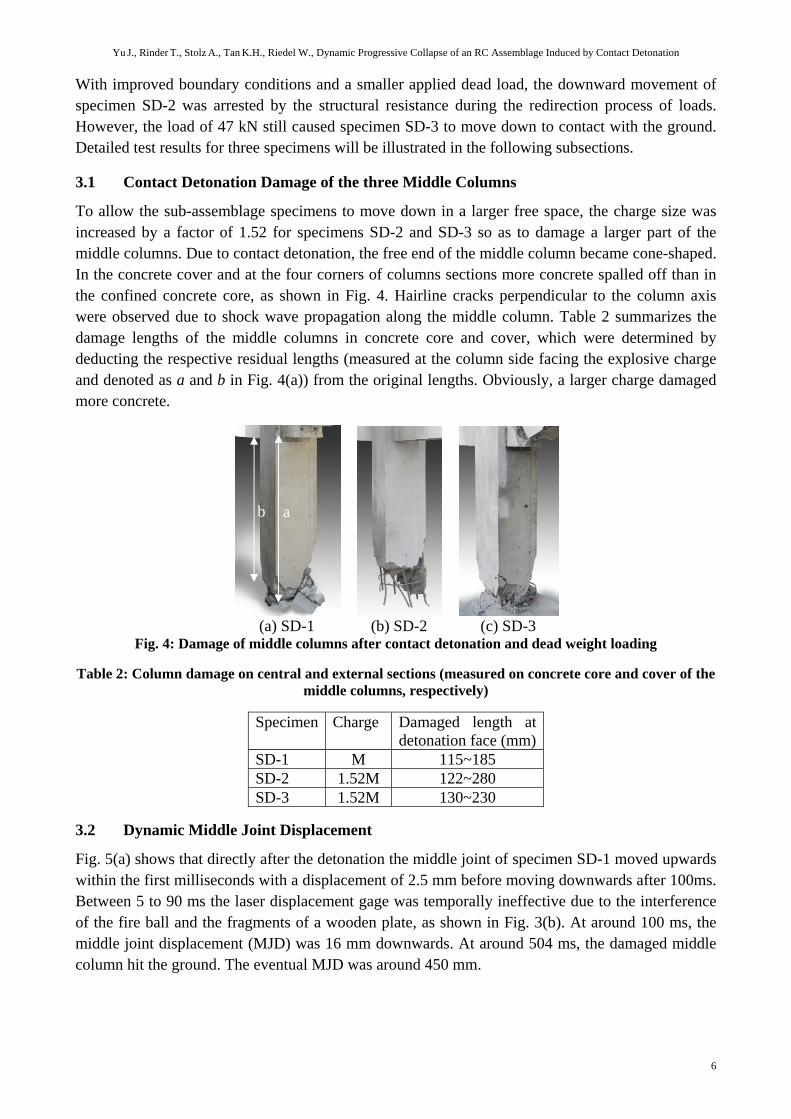
To allow the sub-assemblage specimens to move down in a larger free space, the charge size was increased by a factor of 1.52 for specimens SD-2 and SD-3 so as to damage a larger part of the middle columns. Due to contact detonation, the free end of the middle column became cone-shaped. In the concrete cover and at the four corners of columns sections more concrete spalled off than in the confined concrete core, as shown in Fig. 4. Hairline cracks perpendicular to the column axis were observed due to shock wave propagation along the middle column. Table 2 summarizes the damage lengths of the middle columns in concrete core and cover, which were determined by deducting the respective residual lengths (measured at the column side facing the explosive charge and denoted as a and b in Fig. 4(a)) from the original lengths. Obviously, a larger charge damaged more concrete.
(a) SD-1
(b) SD-2
(c) SD-3
Fig. 4: Damage of middle columns after contact detonation and dead weight loading
Table 2: Column damage on central and external sections (measured on concrete core and cover of the middle columns, respectively)
Specimen Charge Damaged length at detonation face (mm)
SD-1 M 115~185 SD-2 1.52M 122~280 SD-3 1.52M 130~230
3.2 Dynamic Middle Joint Displacement
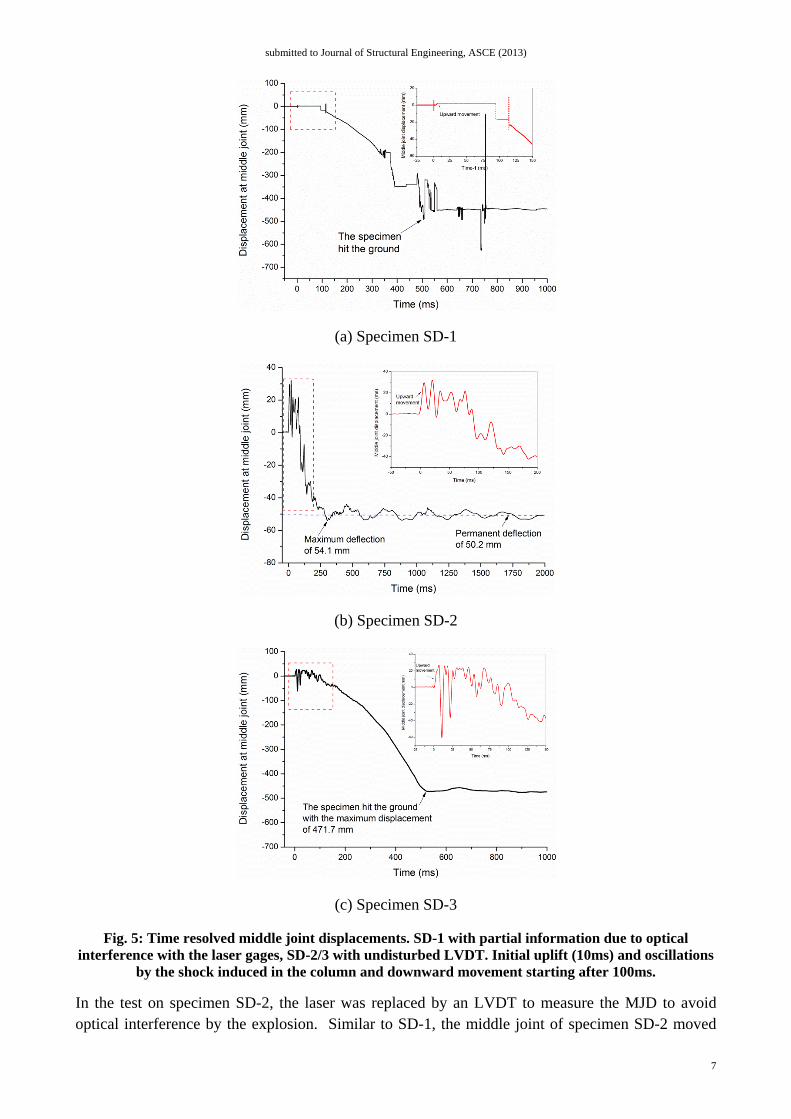
Fig. 5(a) shows that directly after the detonation the middle joint of specimen SD-1 moved upwards within the first milliseconds with a displacement of 2.5 mm before moving downwards after 100ms. Between 5 to 90 ms the laser displacement gage was temporally ineffective due to the interference of the fire ball and the fragments of a wooden plate, as shown in Fig. 3(b). At around 100 ms, the middle joint displacement (MJD) was 16 mm downwards. At around 504 ms, the damaged middle column hit the ground. The eventual MJD was around 450 mm.
b a
submitted to Journal of Structural Engineering, ASCE (2013)
7
(a) Specimen SD-1
(b) Specimen SD-2
(c) Specimen SD-3
Fig. 5: Time resolved middle joint displacements. SD-1 with partial information due to optical interference with the laser gages, SD-2/3 with undisturbed LVDT. Initial uplift (10ms) and oscillations
by the shock induced in the column and downward movement starting after 100ms.
In the test on specimen SD-2, the laser was replaced by an LVDT to measure the MJD to avoid optical interference by the explosion. Similar to SD-1, the middle joint of specimen SD-2 moved

Yu J., R
upwards uwave propshock wavapplied loa302 ms. Taround 50
In the testdetonationthe appliedmm at abou
3.3 Cra
(c) Fa
Fig. 6: Co
After the f47 kN prioThe overalbeam endsindicating
Rinder T., Stolz A
up to 30 mmpagating in ves had decad of 27 kN
Thereafter, tmm.
t on specim. Beyond 10
d load of 47ut 525 ms, a
ack Pattern
(b) Crack pa
ailure mode
omparisons
full dynamicor to hittingll crack patt connected the mobili
A., Tan K.H., Ried
m within abthe middleayed at aro
N. The movthe free vib
men SD-3, t00 ms, the
7 kN until thas shown in
ns and Com
(a) Fail
atterns of spe
e of specime
of failure mme
c response, g the groundterns in twoto end coluization of
Region of recut-off poin
del W., Dynamic
bout 10 ms column ca
ound 80 msvement was bration of S
the middle center of thhe specimenn Fig. 5(c).
mparisons w
lure mode o
ecimen SD-3
en with non
modes in dynechanism be
Specimensd with the c specimens
umns stubs oa larger be
ebar nt
Progressive Coll
after the daused the ms, specimen
arrested wSD-2 was d
joint initiahe specimenn hit the gro
with Static
of specimen
3 with equiva
n-seismic de
namic and stecause of ide
s SD-1 and crack patterwere simila
of Specimenending mo
apse of an RC As
etonation, amiddle joint
SD-2 startwith a maximdecaying w
ally moved n then permound with a
Tests
n SD-1 in dy
alent deform
etailing in st
tatic tests inentical detail
SD-3 eventrns shown inar, but the cn SD-3 wer
oment at co
ssemblage Induce
as shown int to oscillated moving
mum displacwith a perma
upwards wmanently mo
maximum
ynamic tests
ation mechan
tatic tests (Y
ndicates veryling
tually failedn Figs. 6(a)cracks and ce more seveompressive
ed by Contact De
n Fig. 5(b). te verticallydownward
acement of 5anent displ
within 10 moved downw
displaceme
s
nisms as in S
Yu and Tan
y similar def
d to sustain ) and (b), reconcrete spaere than tho
arch actio
etonation
8
The shocky. After thes under the54.1 mm atacement of
ms after thewards underent of 471.7
SD-1
2011)
formation
the load ofespectively.alling at the
ose in SD-1,on stage in
8
k e e t f
e r 7
f . e , n
specimen Sthe region
A comparithe dynamifor comparextensivelyMoreover, plastic hingthe free enduring the
After the rwith the mtest. At theevident conentire beamand positiv
3.4 Acc
An accelertop free enaround 36oscillation to derive tloading exinvestigatiobut they prSD-3 indicextremely reinforcingacceleratio
SD-3 due tonear cutting
ison betweeic test wererison had thy distribute
the beam-ges with fle
nds of lap-sptest, sugges
removal of maximum dye beam segmncrete crushm sections. Tve bending m
celeration M
rometer wasnd of the m00 m/s, soat about 2.6
the dynamixceeded theon. Thereforovide the tcated three s
large acceg bars at oons correspo
subm
o improved g-off point i
en Figs. 6(a)e very similahe same ded along the-column coexural crackpliced bottosting that on
the middleynamic deflments near hing. Near tThese weremoments. B
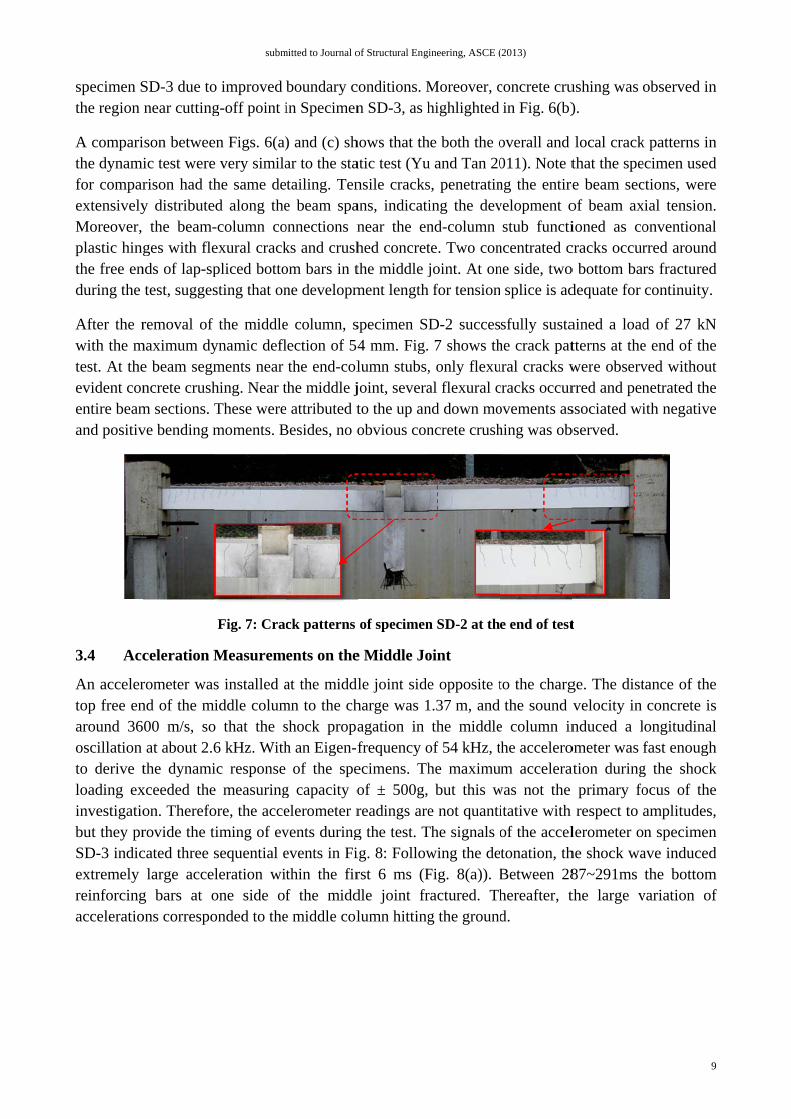
Fig. 7: Crac
Measurem
s installed aiddle colum
o that the s6 kHz. Withic response e measuringore, the accetiming of evsequential eleration wione side ofonded to the
mitted to Journal o
boundary cin Specimen
) and (c) shar to the statailing. Tene beam spaonnections nks and crushom bars in tne developm
e column, slection of 54the end-col
the middle je attributed tBesides, no o
ck patterns
ents on the
at the middlmn to the chshock propah an Eigen-f
of the speg capacity oelerometer rvents duringevents in Fithin the firf the midde middle col
of Structural Engi
conditions. Mn SD-3, as h
hows that thatic test (Yunsile cracksans, indicatinear the enhed concretthe middle jment length
specimen SD4 mm. Fig.lumn stubs,joint, severato the up anobvious con
of specimen
e Middle Jo
dle joint sideharge was 1agation in frequency oecimens. Thof ± 500g, readings areg the test. Tig. 8: Followrst 6 ms (Fdle joint frlumn hitting
ineering, ASCE (
Moreover, chighlighted
he both the ou and Tan 20s, penetratining the devnd-column te. Two conjoint. At onfor tension
D-2 succes7 shows th
, only flexual flexural cnd down moncrete crush
n SD-2 at th
oint
e opposite t1.37 m, and
the middleof 54 kHz, the maximu
but this we not quanti
The signals owing the deFig. 8(a)). Bractured. Thg the ground
(2013)
concrete cruin Fig. 6(b)
overall and 011). Note tng the entirevelopment ostub functi
ncentrated cne side, two
splice is ad
sfully sustahe crack patural cracks wcracks occurovements ashing was ob
e end of test
to the chargthe sound
e column inhe accelerom accelera
was not the itative with of the acceltonation, thBetween 28hereafter, td.
ushing was o).
local crackthat the spe
re beam secof beam axioned as cocracks occuro bottom bardequate for
ained a loadtterns at thewere observrred and penssociated wibserved.
t
ge. The distvelocity in nduced a l
ometer was fation during
primary forespect to a
lerometer ohe shock wa87~291ms the large v
9
observed in
k patterns inecimen usedctions, werexial tension.onventionalrred aroundrs fracturedcontinuity.
d of 27 kNe end of theved withoutnetrated theith negative
tance of theconcrete isongitudinalfast enough
g the shockocus of theamplitudes,n specimen
ave inducedthe bottom
variation of
9
n
n d e . l d d
N e t e e
e s l h k e ,
n d
m f

Yu J., Rinder T., Stolz A., Tan K.H., Riedel W., Dynamic Progressive Collapse of an RC Assemblage Induced by Contact Detonation
10
Fig. 8: Qualitative acceleration recordings on the top of middle column SD-3 clearly indicate the timing of shock waves, bar fracture and impact on the ground.
3.5 Dynamic Horizontal Reaction Forces
As illustrated in Fig. 2, the strains of the horizontal restraint bars were recorded during the test. The measured strains were then used to determine the corresponding reaction force provided by each bar. Fig. 9 shows the time histories of horizontal reaction forces of specimens SD-2 and SD-3. The horizontal reaction was equal to the sum of reactions along the four restraint bars. The negative and positive values correspond to the development of axial compression and tension in the two-bay beam, respectively (Yu and Tan 2011).
In specimen SD-2, only beam axial compression was mobilized during the test, indicating that the structural mechanism to redistribute the load was compressive arch action (CAA). The maximum negative horizontal reaction was around 55.04 kN at the time of 221 ms. In specimen SD-3, both beam axial compression and tension were mobilized, indicating the development of CAA and catenary action. However, Fig. 9 shows that the main structural mechanism in specimen SD-3 was still CAA. At 443.5 ms, the beam axial tension was mobilized, indicating the onset of catenary action, but the development of catenary action was terminated due to the contact of the residual middle column with the ground.
Fig. 9: Time history of horizontal reactions: SD-2 shows only compressive arch action subjected to 27kN dead weight load; SD3 shows both compressive arch and catenary action subject to 47kN.
submitted to Journal of Structural Engineering, ASCE (2013)
11
The relationship of horizontal reaction force and the middle joint displacement (MJD) in specimen SD-3 are shown in Fig. 10(a), which indicates that catenary action was mobilized at a MJD of 357 mm. To compare the differences in dynamic and static performances of RC sub-assemblages, the variation of horizontal reaction force of Specimen S2 in static tests (Yu and Tan 2011) is added in Fig. 10(b). It should be repeated that both static and dynamic specimens had the same detailing as shown in Fig. 1.
(a) In dynamic tests
0 100 200 300 400 500 600
-200
-150
-100
-50
0
50
100
150
200
Catenary action
Compressive arch action
Ho
rizon
tal r
eact
ion
forc
es
(kN
)
Middle joint displacement (mm)
Specimen S2
(b) In static test
Fig. 10: Variations of horizontal reaction forces in tests: negative and positive values correspond to beam axial compression and tension, respectively.
Yu J., Rinder T., Stolz A., Tan K.H., Riedel W., Dynamic Progressive Collapse of an RC Assemblage Induced by Contact Detonation
12
A comparison between Figs. 10(a) and (b) indicates that similar to the static test, both CAA (associated with axial compression) and catenary action (associated with axial tension) were sequentially mobilized in the dynamic test on specimen SD-3. However, the peak horizontal reaction force at CAA stage in the dynamic test was smaller than that in the static test, respectively. At CAA stage, provided that the same boundary conditions were achieved in both quasi-static and dynamic tests, due to load amplification effect in dynamic tests, a smaller axial compression of SD-3 in the dynamic test could be equivalent to a larger axial compression of S2 in the quasi-static test. Moreover, the boundary conditions in the dynamic tests were actually weaker than those in the quasi-static tests, further reducing the maximum axial compression. At catenary action stage, adequate space was provided in the quasi-static test to allow Specimen S2 to deform to its limit so that large beam axial tension can be mobilized. However, the development of catenary action of Specimen SD-3 in the dynamic test was terminated due to the residual column hitting the ground. At that moment, beam axial tension was still relatively small. This situation is very possible under explosive removal scenarios in the real world.
3.6 Shock Uplift, Torque and Structural Movement at the Beam-Column Interfaces
Bar strains of RC sub-assemblages were extensively studied and explained in the quasi-static tests (Yu and Tan 2011; 2012). However, to find out the differences between event-independent tests and the dynamic tests under blast loading, the strain Gage readings in specimen SD-1 are systematically analyzed in the following. Due to similarity, the strain gage readings in the other two specimens are not shown in this paper.
The layout of strain Gages within the RC sub-assemblage is shown in Fig. 11. The sections near the middle joint interfaces (Section 3 and 4), the end-column stub interfaces (Section 1 and 6) and at the mid-span of the single-bay beams (denoted as Section 2 and 5) were selected as critical sections. At each critical section, the strains at both top and bottom bars were measured. All recordings are displayed at a small (0-50ms) and a large time scale (0-1s) to investigate the different dynamic loading domains of shock/stress waves and dynamic structural response, respectively.
Fig. 11: Layout of strain gages in all samples with critical sections close to middle and end columns and at mid-span of the beams.
submitted to Journal of Structural Engineering, ASCE (2013)
13
(a) Section 3 at small time scale (b) Section 3 at large time scale
(c) Section 4 at small time scale (d) Section 4 at large time scale Fig. 12: Time histories of bar strains at middle joint interfaces (MJI) of SD-1: Negative bending
moment during shock-driven uplift of the middle joints up to 20 ms, positive bending and bottom bar yielding in the following structural response beyond 100 ms. Earlier and higher strains on the bars of
the contact loaded side indicate eccentric moment induced by the lateral charge.
Fig. 12 shows the time histories of bar strains at the middle joint interfaces (sections 3 and 4). These two sections were nearest to the explosive charge throughout the entire beams. It can be observed in Fig. 12(a) that following the detonation, the oscillations of the strains were severe due to shock and stress waves. Moreover, in the shock wave stage, the top bar (indicated as gage 3a) was in tension and the bottom bar (denoted as gage 3c) in compression, indicating a negative bending moment at the middle joint region. This phenomenon can be more clearly observed in Fig. 12(c). In contrast, the middle joint in the static tests was subjected to positive bending moment directly after applying load (Yu and Tan 2011). The occurrence of negative bending moment between 2 and 30 ms in Fig. 12(c) suggests that the middle joint sustained a large upward force due to the initial upward acceleration of the middle joint, as shown in Fig. 5. However, during the subsequent slower structural response, tensile strains in the bottom bars exceeded the top bars and yielded first (at 160 ms), and the top bar reversed to compression, as shown in Figs. 12(b) and (d). These clearly pointed out the development of a positive bending moment while the specimen was moving down due to the gravity loads. The timing agrees very well with the dynamic middle joint displacement shown in Fig. 5.
Strain gages 3c and 4c were mounted on the side of the middle joint, which was laterally loaded by the contact charge. The detonation of the eccentric charge caused not only in-plane action but also out-of-plane action, including bending moment and torque, to the two-bay beam. Therefore, strain gages 3b and 4b experienced earlier and larger tension than gages 3c and 4c, respectively, as shown in Figs. 12(a) and (c), and this trend remained until the yielding of two bottom bars occurred. At

Yu J., Rinder T., Stolz A., Tan K.H., Riedel W., Dynamic Progressive Collapse of an RC Assemblage Induced by Contact Detonation
14
around 150ms, two bottom bars at sections 3 and 4 yielded, as a sharp spike indicated in Figs. 12(b) and (d). After the yielding, the strain gages were spoiled, so the drop of tensile strains in gages 3b, 3c, 4b and 4c (indicated as dash thinner lines in Figs. 12(b) and (d)) could not reflect the actual situations. Moreover, the bottom bars fractured at the same side of section 3, resulting in a sudden reduction of strain in the top bar at around 330 ms, as shown in Fig. 12(b).
(a) Section 1 at small time scale (b) Section 1 at large time scale
(c) Section 6 at small time scale (d) Section 6 at large time scale Fig. 13: Time histories of bar strains at end-column stub interfaces of SD-1: Positive bending moment induced by shock-driven uplift of the middle joints up to around 15 ms, negative bending and top bar yielding in the following structural response beyond 100 ms. One bottom bar in tension and the other
in compression caused by out-of-plane actions
Fig. 13 shows the evolution of bar strains at the end-column stub interfaces. Fig. 13(a) illustrates that following the detonation, two bottom bars were in tension and the top bar in compression, indicating a positive bending moment at the end-column stub interface. However, the static counterpart was subjected to a negative bending moment right from the beginning of the loading (Yu and Tan 2011). The positive bending moment can also be found at section 6 prior to the time of around 10 ms. This phenomenon confirmed that the specimen was subjected to an upward force due to the upward acceleration of the middle column induced by shock. Besides, Figs. 13(a) and (c) show that at the bottom layer of reinforcement, gages 1c and 6c experienced tension whereas gages 1b and 6b sustained compression between 10 and 50 ms. This was attributed to out-of-plane action caused by the eccentric charge. Figs. 13(b) and (d) demonstrate that after around 100 ms, gages 1c and 6c worked together with gages 1b and 6b in compression, respectively. After around 20 ms, the tension in top bars became more dominant in the entire beam section, indicating the development of negative bending moment. At around 250 ms, corresponding to a MJD of about 150mm (see Fig. 5(a)), the top bars at both sections 1 and 6 yielded. The following Gage readings after the peak
submitted to Journal of Structural Engineering, ASCE (2013)
15
tensile yield strains (indicated as dash thinner lines in Figs. 13(b) and (d)) may not reflect the real conditions due to subsequently damaged strain gage.
In summary, the bending moments of the beam-column interfaces in X-Y plane from the shock-driven upward movement within the first 20 ms, as shown in Fig. 14(a), was opposite to those at the progressive collapse stage between 100-500 ms, as illustrated in Fig. 14(b). Therefore, the top bars in the middle joint region sustained tension initially followed by compression, and the top bars at the end-column stub interfaces underwent compression initially and then tension. Moreover, the explosion-induced torque and out-of-plane (i.e. X-Z plane) bending moment on the two-bay beam, as elucidated in Fig. 14(a), resulted in tensile strains of 3b and 4b greater than 3c and 4c at the early stage, respectively. Similarly, the tensile strains of 1c and 6c exceeded those of 1b and 6b, respectively, at the shock-driven stage. It is worthwhile to note that the static tests could only simulate the progressive collapse stage.
(a) Bending moments at the shock wave stage from 2 – 20 ms
(b) Bending moments at the progressive collapse stage from 100 – 500 ms Fig. 14: Sketches of bending moment diagrams in dynamic test for the shock driven uplift and out-of-plane bending (or torque) on the middle column and the later downward structural response due to
dead weight load
3.7 Dynamic Catenary Action at Mid-Span Bars of the Single-bay Beams
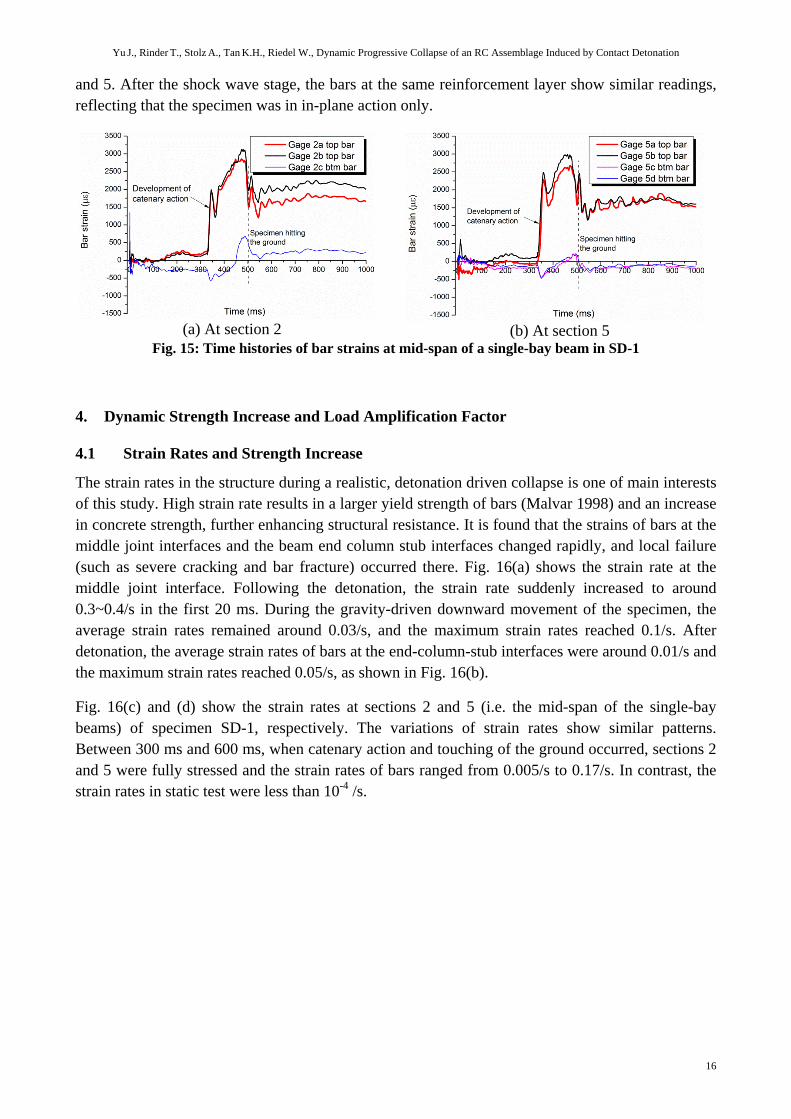
Sections 2 and 5 were located near the contra-flexure points of both in-plane and out-of-plane bending moment diagrams, that is, the bending moments at these two sections were very small. Therefore, only small strains developed at sections 2 and 5 prior to around 325 ms, as shown in Fig. 15. At the time of around 325 ms, the tensile strains at the two top bars soared, suggesting the development of catenary action. Moreover, the top reinforcement was not continuous. At sections 2 and 5, there were only two top bars in contrast to three top bars at the beam-column joint and end-column-stub interfaces. Under the same axial tension throughout the entire beam, the strains of top bars at sections 2 and 5 increased much faster than at the sections with three top bars. Finally, a comparison of strain histories in Figs. 15(a) and (b) indicates the symmetry in behavior at sections 2
Z
Y
Explosivecharge
Horizontal forcecauses bendingmoment in X-Z plane
Horizontal forcein column causestorque in beam
Upward force causesbending moment in X-Yplane
Brick support
X
Y
Bending moment in X-Y planeinduced by shock-driven upward
movement
Z
X
Bending moment in X-Z planeinduced by eccentric charge
4c
4b
6c
6b
3c
3b
1c
1b
Z
Y
Dead weight causesbending moment inX-Y plane
Bending moment in X-Y planeinduced by dead weight
X
Y
Yu J., Rinder T., Stolz A., Tan K.H., Riedel W., Dynamic Progressive Collapse of an RC Assemblage Induced by Contact Detonation
16
and 5. After the shock wave stage, the bars at the same reinforcement layer show similar readings, reflecting that the specimen was in in-plane action only.
(a) At section 2
(b) At section 5
Fig. 15: Time histories of bar strains at mid-span of a single-bay beam in SD-1
4. Dynamic Strength Increase and Load Amplification Factor
4.1 Strain Rates and Strength Increase
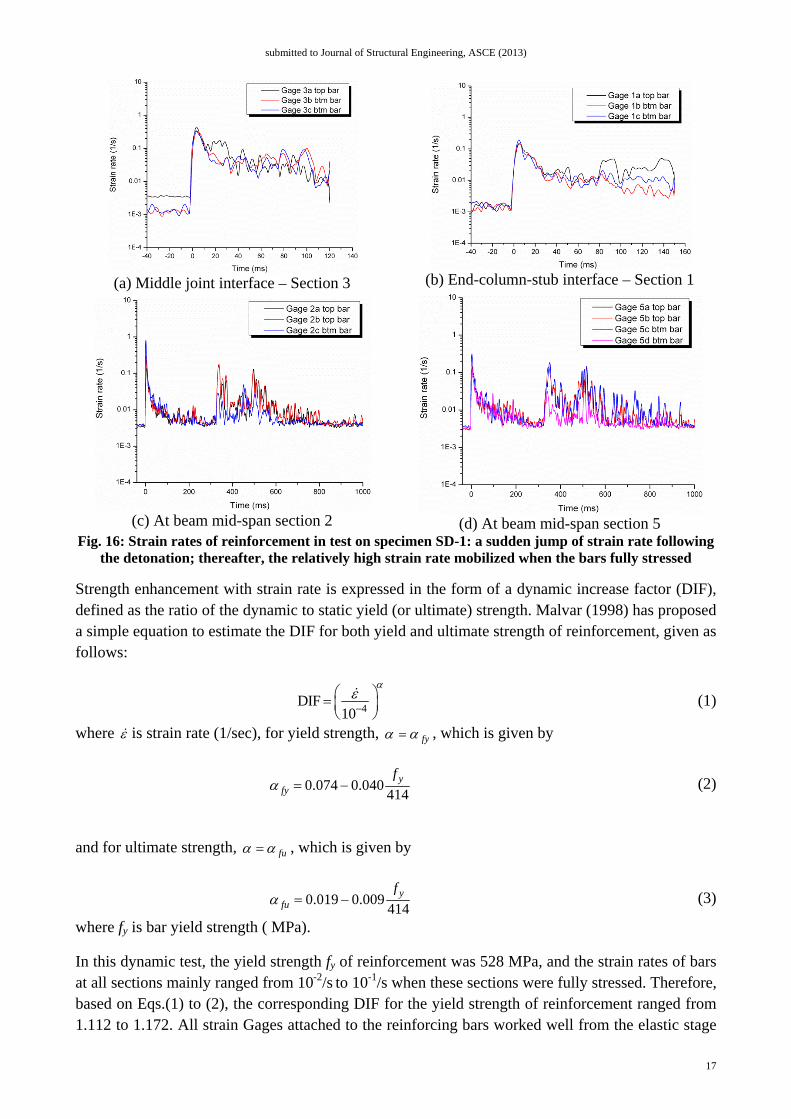
The strain rates in the structure during a realistic, detonation driven collapse is one of main interests of this study. High strain rate results in a larger yield strength of bars (Malvar 1998) and an increase in concrete strength, further enhancing structural resistance. It is found that the strains of bars at the middle joint interfaces and the beam end column stub interfaces changed rapidly, and local failure (such as severe cracking and bar fracture) occurred there. Fig. 16(a) shows the strain rate at the middle joint interface. Following the detonation, the strain rate suddenly increased to around 0.3~0.4/s in the first 20 ms. During the gravity-driven downward movement of the specimen, the average strain rates remained around 0.03/s, and the maximum strain rates reached 0.1/s. After detonation, the average strain rates of bars at the end-column-stub interfaces were around 0.01/s and the maximum strain rates reached 0.05/s, as shown in Fig. 16(b).
Fig. 16(c) and (d) show the strain rates at sections 2 and 5 (i.e. the mid-span of the single-bay beams) of specimen SD-1, respectively. The variations of strain rates show similar patterns. Between 300 ms and 600 ms, when catenary action and touching of the ground occurred, sections 2 and 5 were fully stressed and the strain rates of bars ranged from 0.005/s to 0.17/s. In contrast, the strain rates in static test were less than 10-4 /s.
submitted to Journal of Structural Engineering, ASCE (2013)
17
(a) Middle joint interface – Section 3
(b) End-column-stub interface – Section 1
(c) At beam mid-span section 2
(d) At beam mid-span section 5
Fig. 16: Strain rates of reinforcement in test on specimen SD-1: a sudden jump of strain rate following the detonation; thereafter, the relatively high strain rate mobilized when the bars fully stressed
Strength enhancement with strain rate is expressed in the form of a dynamic increase factor (DIF), defined as the ratio of the dynamic to static yield (or ultimate) strength. Malvar (1998) has proposed a simple equation to estimate the DIF for both yield and ultimate strength of reinforcement, given as follows:
4DIF
10
(1)
where is strain rate (1/sec), for yield strength, fy , which is given by
0.074 0.040414
yfy
f (2)
and for ultimate strength, fu , which is given by
0.019 0.009414
yfu
f (3)
where fy is bar yield strength ( MPa).
In this dynamic test, the yield strength fy of reinforcement was 528 MPa, and the strain rates of bars at all sections mainly ranged from 10-2/s to 10-1/s when these sections were fully stressed. Therefore, based on Eqs.(1) to (2), the corresponding DIF for the yield strength of reinforcement ranged from 1.112 to 1.172. All strain Gages attached to the reinforcing bars worked well from the elastic stage
Yu J., R
to yieldingTherefore, on SD-1. Iwill vary bconclusionincorporateprogressive
4.2 Dis
The dynamsame deforanalysis. Bprogressiveformula topointed oucontrast, Izstatic struc- into dyna
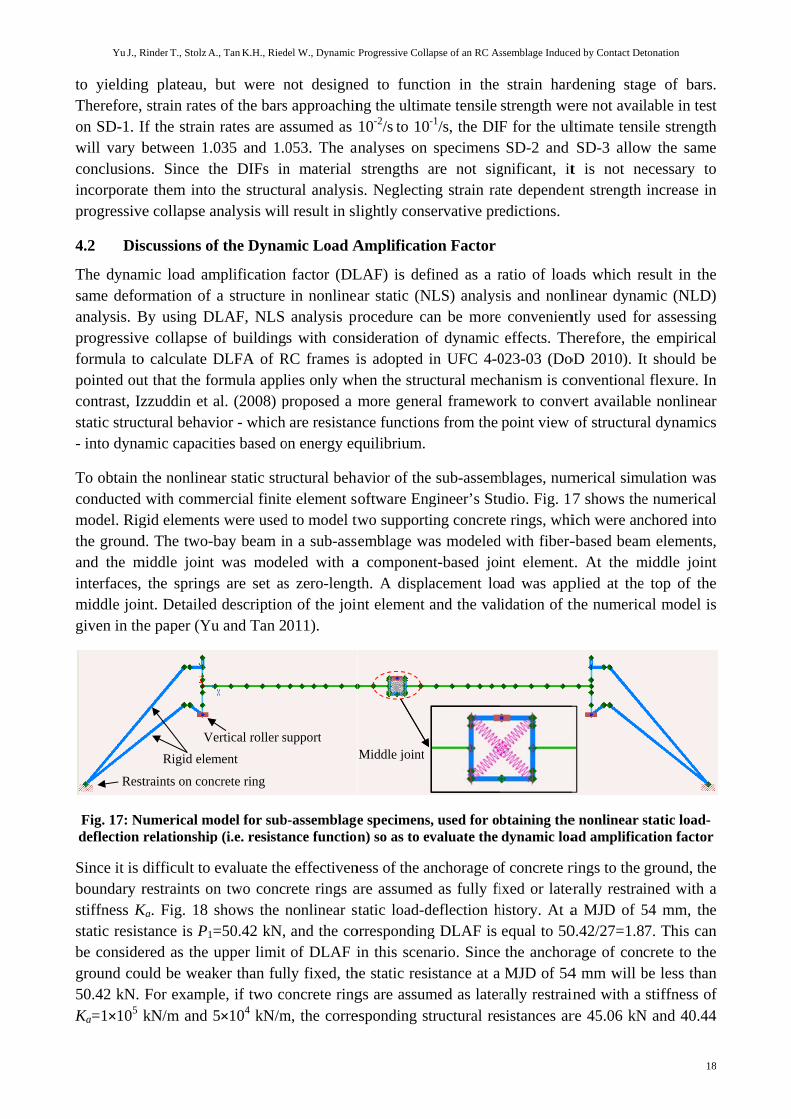
To obtain tconducted model. Rigthe groundand the minterfaces, middle joingiven in th
Fig. 17: Nudeflection
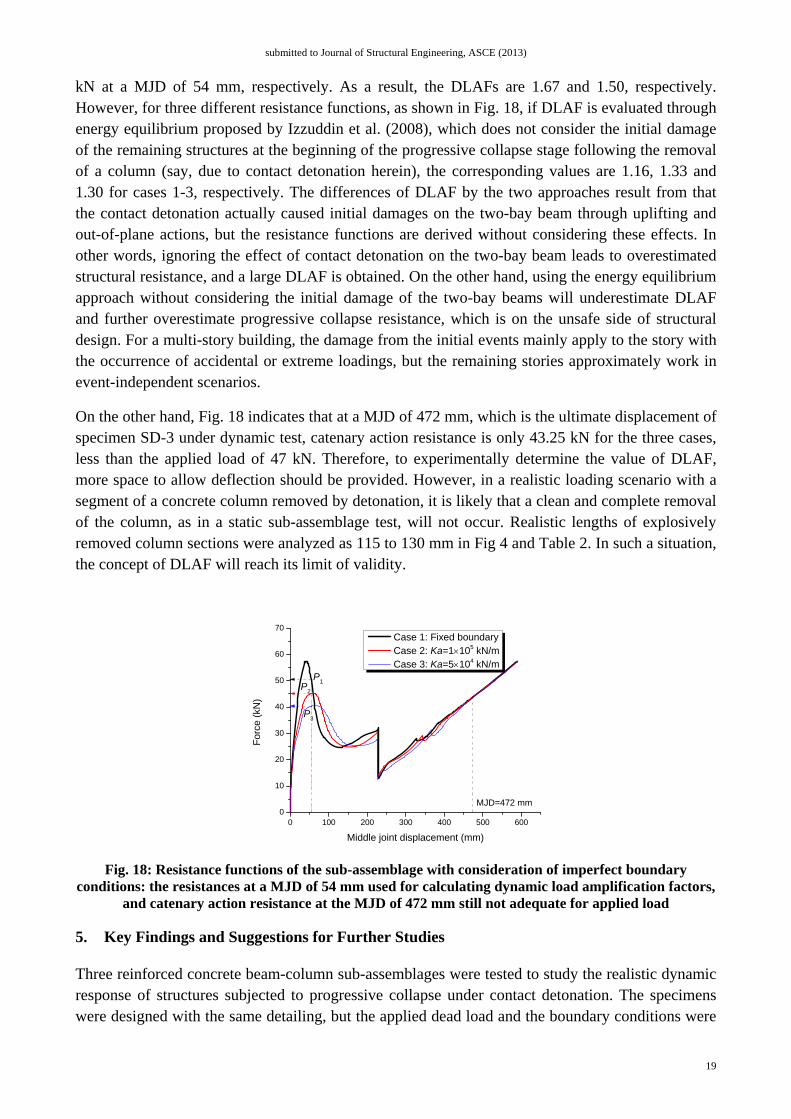
Since it is dboundary rstiffness Kstatic resisbe consideground cou50.42 kN. Ka=1×10⁵ k
Rest
Rinder T., Stolz A
g plateau, strain rates
If the strainbetween 1.0
ns. Since the them intoe collapse a
scussions of
mic load amrmation of
By using De collapse o
o calculate Dut that the fozzuddin et actural behavamic capacit
the nonlinewith comm
gid elementsd. The two-b
middle joint the spring
nt. Detailedhe paper (Yu
umerical morelationship
difficult to restraints on
Ka. Fig. 18 tance is P1=
ered as the uuld be weakFor examplkN/m and 5
Rigid elem
traints on con
Ve
A., Tan K.H., Ried
but were ns of the barsn rates are a035 and 1.0he DIFs in
o the structuanalysis will
f the Dynam
mplificationa structure LAF, NLS of buildingDLFA of Rormula applal. (2008) p
vior - which ties based o
ar static strumercial finites were usedbay beam in
was modes are set as
d descriptionu and Tan 2
odel for subp (i.e. resista
evaluate then two concshows the n=50.42 kN, upper limit ker than fulle, if two co5×104 kN/m
ment
crete ring
ertical roller s
del W., Dynamic
not designes approachinassumed as 053. The ann material ural analysil result in sl
mic Load A
factor (DLin nonlineaanalysis pr
s with consRC frames ilies only whproposed a m
are resistanon energy eq
uctural behae element s
d to model twn a sub-asseled with as zero-lengtn of the join011).
b-assemblageance function
e effectivenrete rings anonlinear sand the coof DLAF i
lly fixed, thoncrete ring
m, the corre
support
Progressive Coll
ed to functng the ultim10-2/s to 10
analyses on strengths as. Neglectinlightly cons
Amplificati
LAF) is defar static (Nrocedure casideration ois adopted hen the strumore genernce functionquilibrium.
avior of theoftware Enwo supportemblage wa
a componenth. A displnt element
e specimensn) so as to e
ness of the aare assumedtatic load-d
orrespondingin this scen
he static resigs are assumesponding st
Middle joint
apse of an RC As
tion in the mate tensile
-1/s, the DIFspecimens
are not signg strain raservative pre
ion Factor
fined as a rNLS) analysan be moreof dynamic in UFC 4-0
uctural mechral framewons from the
e sub-assemgineer’s Stuing concretas modelednt-based joiacement loand the val
s, used for obevaluate the
anchorage od as fully fideflection hg DLAF is
nario. Since istance at a med as latertructural re
ssemblage Induce
strain hardstrength weF for the ulSD-2 and
gnificant, itate dependenedictions.
ratio of loadis and nonl
e convenieneffects. Th
023-03 (Dohanism is coork to convepoint view
mblages, numudio. Fig. 17e rings, whi
d with fiber-int elementad was appidation of t
btaining thedynamic loa
f concrete rixed or late
history. At aequal to 50the anchorMJD of 54
rally restrainsistances ar
ed by Contact De
rdening stagere not availtimate tensSD-3 allow
t is not nent strength
ds which relinear dyna
ntly used foherefore, thoD 2010). Itonventionalert availablof structura
merical simu7 shows theich were an-based beamt. At the mplied at thethe numeric
e nonlinear sad amplifica
rings to the erally restraia MJD of 50.42/27=1.8rage of con4 mm will bined with a re 45.06 kN
etonation
18
ge of bars.lable in test
sile strengthw the sameecessary toincrease in
esult in themic (NLD)
or assessinge empiricalt should bel flexure. Inle nonlinearal dynamics
ulation wase numerical
nchored intom elements,middle jointe top of thecal model is
static load-ation factor
ground, theined with a54 mm, the7. This cancrete to thebe less thanstiffness of
N and 40.44
8
. t h e o n
e ) g l e n r s
s l o , t e s
e a e n e n f 4
submitted to Journal of Structural Engineering, ASCE (2013)
19
kN at a MJD of 54 mm, respectively. As a result, the DLAFs are 1.67 and 1.50, respectively. However, for three different resistance functions, as shown in Fig. 18, if DLAF is evaluated through energy equilibrium proposed by Izzuddin et al. (2008), which does not consider the initial damage of the remaining structures at the beginning of the progressive collapse stage following the removal of a column (say, due to contact detonation herein), the corresponding values are 1.16, 1.33 and 1.30 for cases 1-3, respectively. The differences of DLAF by the two approaches result from that the contact detonation actually caused initial damages on the two-bay beam through uplifting and out-of-plane actions, but the resistance functions are derived without considering these effects. In other words, ignoring the effect of contact detonation on the two-bay beam leads to overestimated structural resistance, and a large DLAF is obtained. On the other hand, using the energy equilibrium approach without considering the initial damage of the two-bay beams will underestimate DLAF and further overestimate progressive collapse resistance, which is on the unsafe side of structural design. For a multi-story building, the damage from the initial events mainly apply to the story with the occurrence of accidental or extreme loadings, but the remaining stories approximately work in event-independent scenarios.
On the other hand, Fig. 18 indicates that at a MJD of 472 mm, which is the ultimate displacement of specimen SD-3 under dynamic test, catenary action resistance is only 43.25 kN for the three cases, less than the applied load of 47 kN. Therefore, to experimentally determine the value of DLAF, more space to allow deflection should be provided. However, in a realistic loading scenario with a segment of a concrete column removed by detonation, it is likely that a clean and complete removal of the column, as in a static sub-assemblage test, will not occur. Realistic lengths of explosively removed column sections were analyzed as 115 to 130 mm in Fig 4 and Table 2. In such a situation, the concept of DLAF will reach its limit of validity.
Fig. 18: Resistance functions of the sub-assemblage with consideration of imperfect boundary conditions: the resistances at a MJD of 54 mm used for calculating dynamic load amplification factors,
and catenary action resistance at the MJD of 472 mm still not adequate for applied load
5. Key Findings and Suggestions for Further Studies
Three reinforced concrete beam-column sub-assemblages were tested to study the realistic dynamic response of structures subjected to progressive collapse under contact detonation. The specimens were designed with the same detailing, but the applied dead load and the boundary conditions were
0 100 200 300 400 500 6000
10
20
30
40
50
60
70
P2
P3
For
ce (
kN)
Middle joint displacement (mm)
Case 1: Fixed boundary Case 2: Ka=1105 kN/m Case 3: Ka=5104 kN/m
MJD=472 mm
P1

Yu J., Rinder T., Stolz A., Tan K.H., Riedel W., Dynamic Progressive Collapse of an RC Assemblage Induced by Contact Detonation
20
different. Furthermore the same detailing was used as in the static tests (Yu and Tan 2011) to allow direct comparison.
The displacement and rebar strain measurements clearly show that a shock-driven acceleration initially uplifted the middle column above the explosive charge in the first 2-20 ms. The measurements also highlight out-of-plane bending moment and torsion acting at the beam sections in the same timeframe. After the shock wave stage, the sub-assemblage started falling down due to applied gravity loads in the time range of 100 – 500ms.
Subjected to a large dead load of 47 kN, compressive arch action (CAA) and catenary action were sequentially mobilized in the dynamic downward motion of specimens SD-1 and SD-3, associated with the development of beam axial compression and tension, respectively. These two assemblages moved down until the residual middle columns hit the ground. However, subjected to a smaller dead load of 27 kN, the downward movement of specimen SD-2 was arrested by CAA at a relatively small deflection (around 50 mm). The crack patterns and local failure modes, such as bar fracture and concrete crushing, were very similar to those observed in quasi-static tests (Yu and Tan 2011).
During the moving down of the sub-assemblages, the strain rates of reinforcing bars in the beams ranged from 10-2/s to 10-1/s, slightly enhancing the yield strength of bars by 10% to 17%. Therefore, the dynamic increase factor (DIF) of material strength is small or can be conservatively ignored for column removal scenarios.
Through a combined experimental and numerical approach the dynamic load amplification factor (DLAF) in specimen SD-2 under 27 kN was analyzed with an upper bound of 1.86. The high DLAF resulted from that the contact detonation actually caused initial damages on the two-bay beam through uplifting and out-of-plane actions, but the resistance functions are derived without considering any initial damage on the two-bay beam. Therefore, using the energy equilibrium approach without considering the initial damage will underestimate DLAF and further overestimate progressive collapse resistance, which is on the unsafe side of structural design.
In the current tests, the development of catenary action was terminated due to the residual column hitting the ground. This situation is realistic under explosive removal scenarios in the real world, but compromises the analysis of the dynamic load amplification factor (DLAF) in the catenary action stage. Therefore, if the research interest is to find out the DLAF at catenary action stage, the middle columns should be designed such that a much greater length of it could be removed.
During the tests, the horizontal restraint bars were subjected to both axial force and bending moments. Therefore, to obtain the horizontal reaction accurately, at least two strain gages should be symmetrically mounted at one bar section.
Laser displacement measurements are sensitive to the fire ball and ensuing dust cloud. Alternatively, other displacement transducers with high Eigen-frequencies can be used to avoid the noises from the resonance of the transducers. In addition, accelerometers should be installed directly on a specimen rather than on other auxiliary parts attached to the specimen.
submitted to Journal of Structural Engineering, ASCE (2013)
21
Acknowledgements
The work in this paper was part of the project AURIS, funded by the German Federal Ministry of Education and Research and financially supported by the Protective Technology Research Center of Nanyang Technological University, Singapore.
References
American Society of Civil Engineers (ASCE). (2005). "Minimum Design Loads for Buildings and Other Structures." American Society of Civil Engineers, Reston, Virginia.
Department of Defense (DOD). (2010). "Design of Buildings to Resist Progressive Collapse." Unified Facilities Criteria (UFC) 4-023-03, 27 January.
European Committee for Standardization. (2004). "EN 1992-1-1: Eurocode 2: Design of concrete structures -- Part 1.1: General rules and rules for buildings." CEN, Brussels.
European Committee for Standardization. (2006). "EN 1991-2-7: Eurocode 1 - Actions on structures - Part 1-7: General actions - Accidental actions." CEN, Brussels.
General Services Administration (GSA). (2003). "Progressive Collapse Analysis and Design Guidelines for New Federal Office Buildings and Major Modernization Projects."
Helmy, H. M., Elfouly, A. K., and Salem, H. M. (2012). "Numerical simulation of demolition of perna seca hospital using the applied element method." ASCE Structures Congress, Chicago, Illinois, 279-294.
Izzuddin, B. A., Vlassis, A. G., Elghazouli, A. Y., and Nethercot, D. A. (2008). "Progressive collapse of multi-storey buildings due to sudden column loss -- Part I: Simplified assessment framework." Engineering Structures, 30, 1308-1318.
Kai, Q., and Li, B. (2012). "Dynamic performance of RC beam-column substructures under the scenario of the loss of a corner column—Experimental results." Engineering Structures, 42, 154-167.
Liu, C., Tan, K. H., and Fung, T. C. (2012). "Experimental studies on dynamic behaviour of flush end plate beam-column connections subjected to sudden column removal scenario." The Fourth Internation Conference on Design and Analysis of Protective Structures, Jeju, Korea, Paper #T9-7 in Proceedings Disc.
Malvar, L. J. (1998). "Review of Static and Dynamic Properties of Steel Reinforcing Bars." ACI Materials Journal, 95(5), 609-616.
Marjanishvili, S. M. (2004). "Progressive Analysis Procedure for Progressive Collapse." Journal of Performance of Constructed Facilities, 18(2), 79-85.
Orton, S., Jirsa, J., and Bayrak, O. (2009). "Carbon Fiber-Reinforced Polymer for Continuity in Existing Reinforced Cocnrete Buildings Vulnerable to Collapse." ACI Structural Journal, 106(5), 608-616.
Sadek, F., Main, J. A., Lew, H. S., and Bao, Y. (2011). "Testing and Analysis of Steel and Concrete Beam-Column Assemblies under a Column Removal Scenario." J. Struct. Eng., 137(9), 881-892.
Sasani, M., Bazan, M., and Sagiroglu, S. (2007). "Experimental and analytical progressive collapse evaluation of actual reinforced concrete structure." ACI Structural Journal, 104(6), 731-739.
Sasani, M., and Kropelnicki, J. (2008). "Progressive collapse analysis of an RC structure." The Structural Design of Tall and Special Buildings, 17(4), 757-771.
Sasani, M., and Sagiroglu, S. (2008). "Progressive collapse resistance of hotel San Diego." Journal of Structural Engineering, 134(3), 474-488.
Su, Y., P., Tian, Y., and Song, X. S. (2009). "Progressive collapse resistance of axially-restrained frame beams." ACI Structural Journal, 106(5), 600-607.
Tagel-Din, H. (2009). "High Fidelity Modeling of Building Collapse with Realistic Visualization of Resulting Damage and Debirs Using the Applied Element Method." HDTRA1-09-P-0006, Applied Science International, LLC.

Yu J., Rinder T., Stolz A., Tan K.H., Riedel W., Dynamic Progressive Collapse of an RC Assemblage Induced by Contact Detonation
22
Yi, W. J., He, Q. F., Xiao, Y., and Kunnath, S. K. (2008). "Experimental study on progressive collapse-resistant behavior of reinforced concrete frame structures." ACI Structural Journal, 105(4), 433-439.
Yu, J., and Tan, K. H. (2011). "Experimental and numerical investigation on progressive collapse resistance of reinforced concrete beam column sub-assemblages." Engineering Structures, (Online).
Yu, J., and Tan, K. H. (2012). "Structural behavior of reinforced concrete beam-column sub-assemblages under a middle column removal scenario." Journal of Structural Engineering, (Online).