
Dynamic of population growth and migration in georgia
16
DYNAMIC OF POPULATION GROWTH AND MIGRATION IN GEORGIA Natia Mestvirishvili
-
Upload
natia-mestvirishvili -
Category
Documents
-
view
409 -
download
0
Transcript of Dynamic of population growth and migration in georgia
DYNAMIC OF POPULATION GROWTH AND MIGRATION IN
GEORGIANatia Mestvirishvili
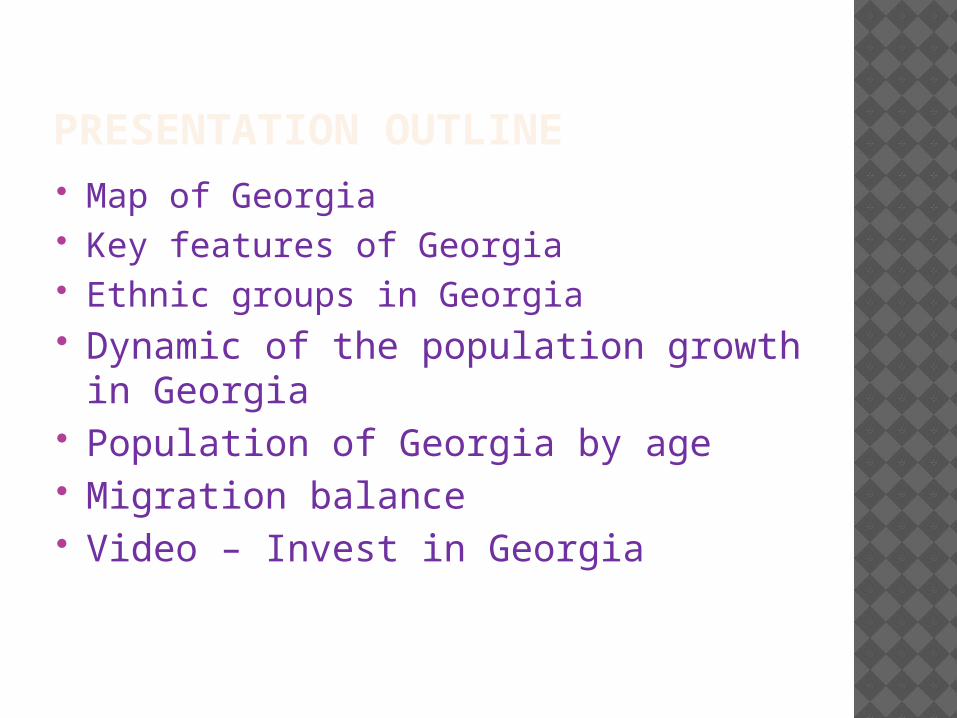
PRESENTATION OUTLINE Map of Georgia Key features of Georgia Ethnic groups in Georgia Dynamic of the population growth in
Georgia Population of Georgia by age Migration balance Video – Invest in Georgia

MAP OF GEORGIA
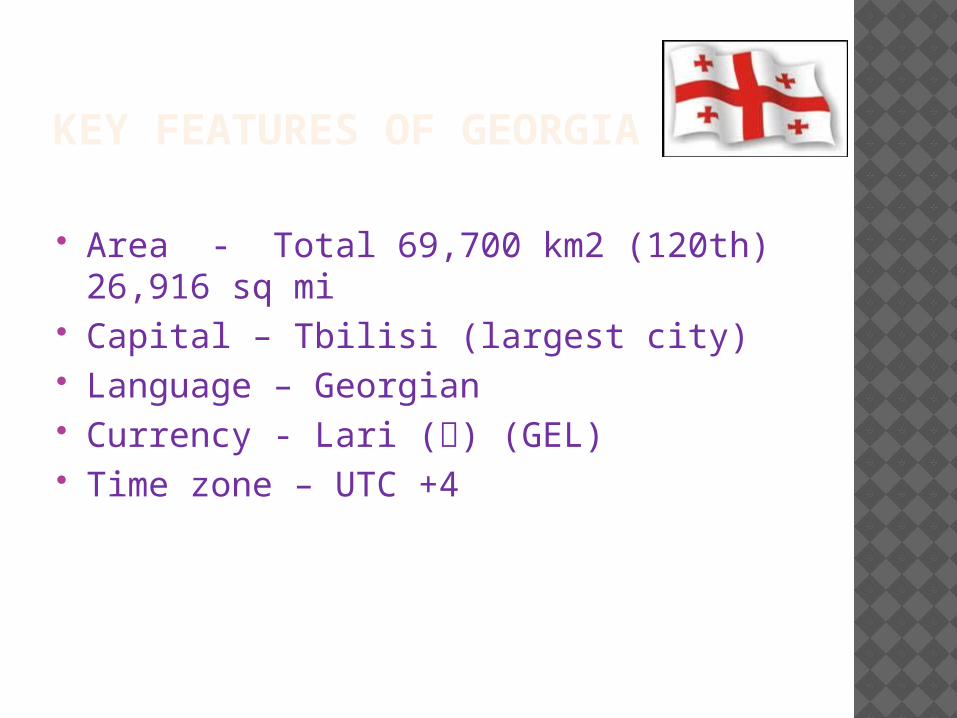
KEY FEATURES OF GEORGIA
Area - Total 69,700 km2 (120th)26,916 sq mi
Capital – Tbilisi (largest city) Language – Georgian Currency - Lari (ლ) (GEL) Time zone – UTC +4

ETHNIC GROUPS IN GEORGIA AS OF 2002 YEAR
Georgians 3,661,173.00 83.8%
Azerbaijani 284,761.00 6.5%
Armenians 248,929.00 5.7%
Russians 67,671.00 1.5%
Osethians 38,028.00 0.9%
Iezids 18,328.00 0.4%
Greeks 15,166.00 0.3%
Qists 7,110.00 0.2%
Ukrainians 7,039.00 0.2%
Jewish 3,772.00 0.1%
Abkhazians 3,527.00 0.1%
Kurdis 2,514.00 0.1%
Others 13,516.00 0.3%
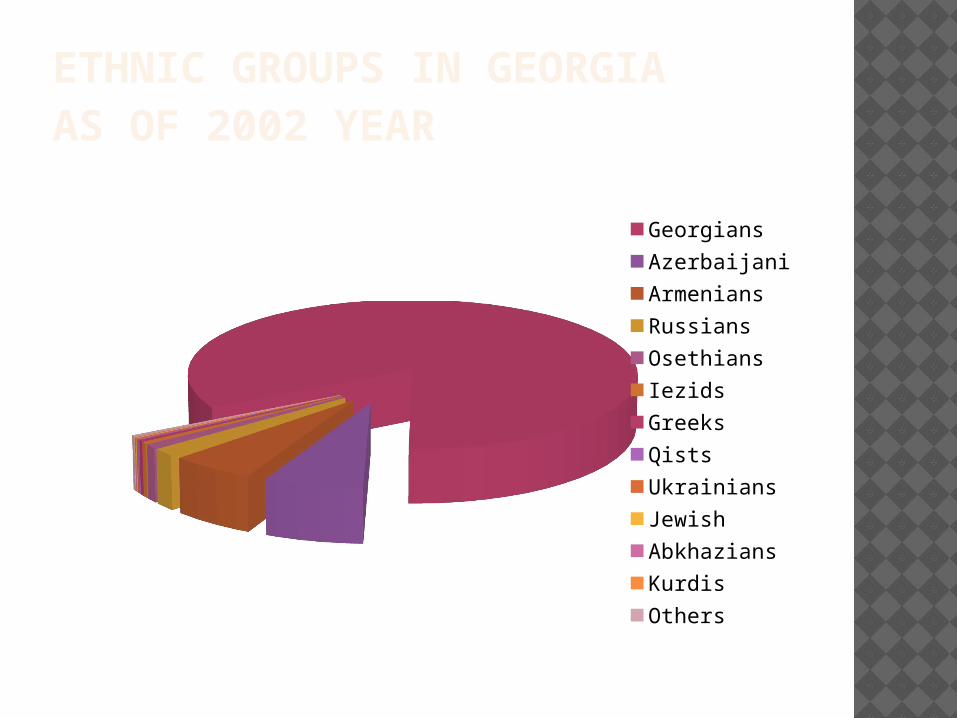
ETHNIC GROUPS IN GEORGIA AS OF 2002 YEAR
GeorgiansAzerbaijaniArmeniansRussiansOsethiansIezidsGreeksQistsUkrainiansJewishAbkhaziansKurdisOthers
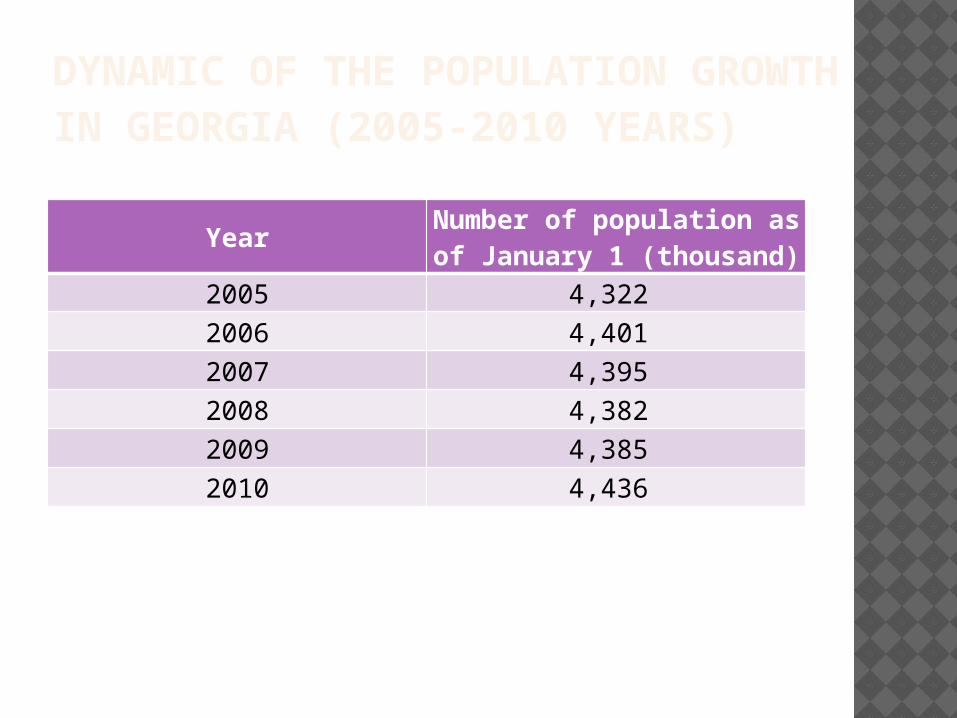
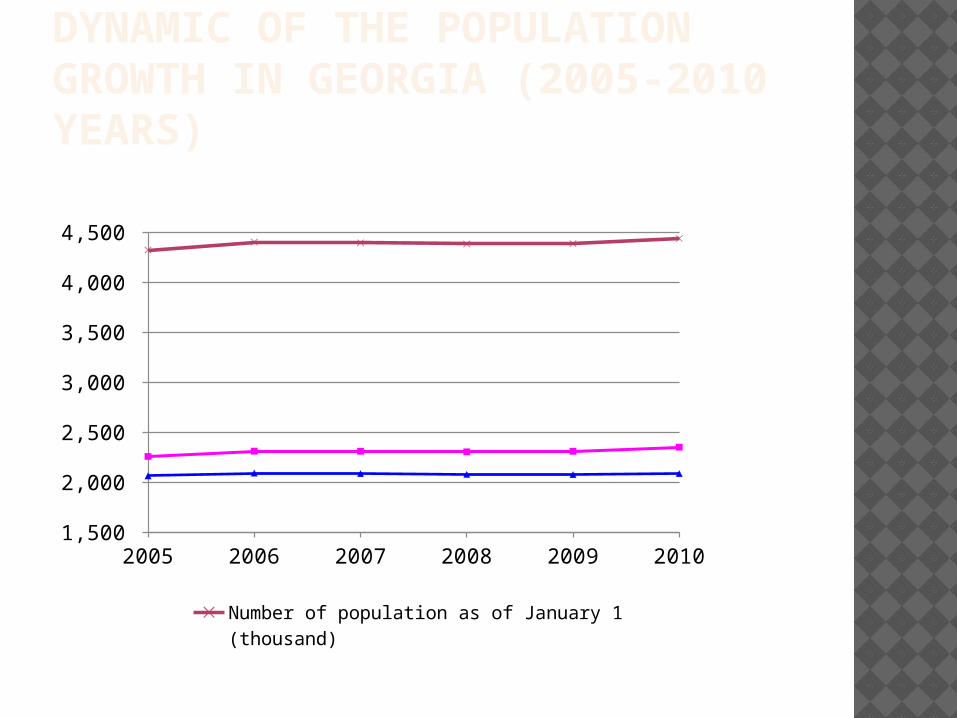
DYNAMIC OF THE POPULATION GROWTH IN GEORGIA (2005-2010 YEARS)
YearNumber of population as of January 1 (thousand)
2005 4,322
2006 4,401
2007 4,395
2008 4,382
2009 4,385
2010 4,436
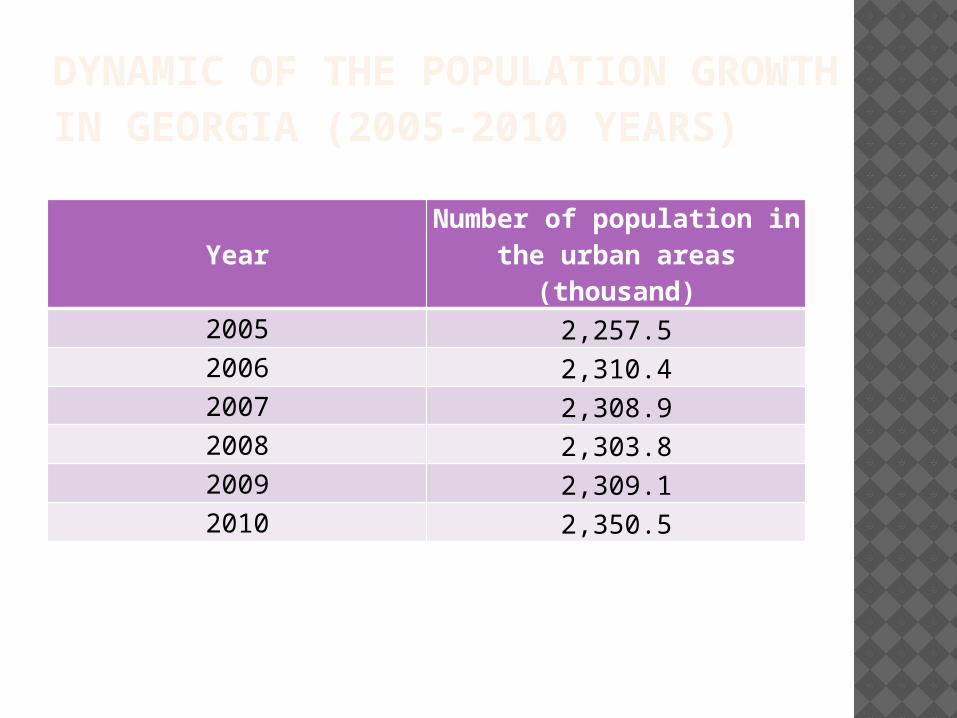
DYNAMIC OF THE POPULATION GROWTH IN GEORGIA (2005-2010 YEARS)
YearNumber of population in
the urban areas (thousand)
2005 2,257.52006 2,310.42007 2,308.92008 2,303.82009 2,309.12010 2,350.5
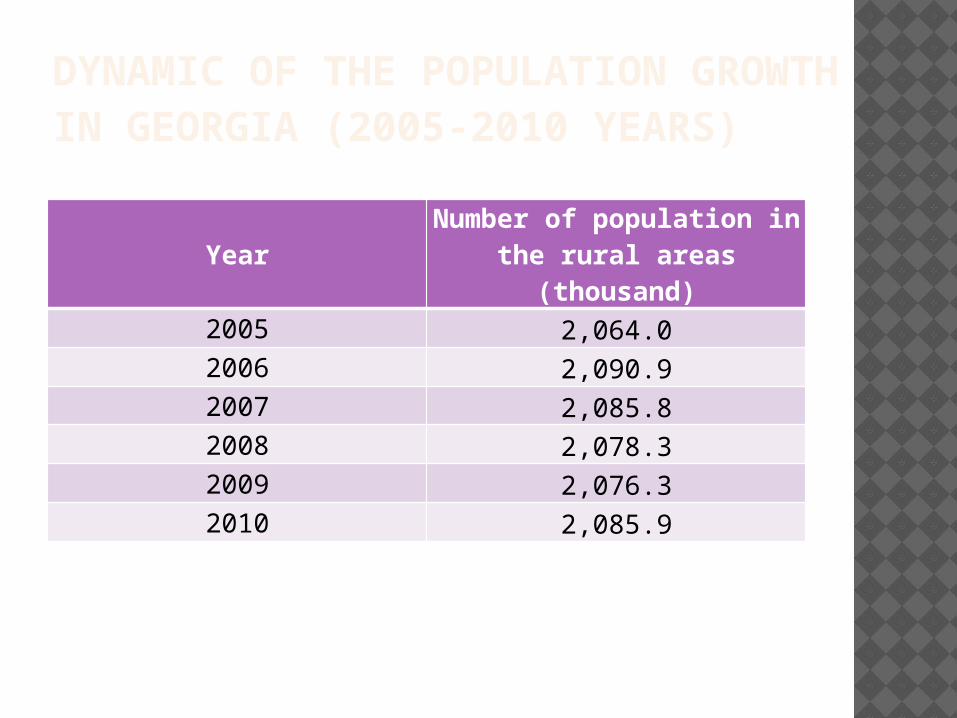
DYNAMIC OF THE POPULATION GROWTH IN GEORGIA (2005-2010 YEARS)
YearNumber of population in
the rural areas (thousand)
2005 2,064.02006 2,090.92007 2,085.82008 2,078.32009 2,076.32010 2,085.9
DYNAMIC OF THE POPULATION GROWTH IN GEORGIA (2005-2010 YEARS)
2005 2006 2007 2008 2009 2010 1,500
2,000
2,500
3,000
3,500
4,000
4,500
Number of population as of January 1 (t-housand)
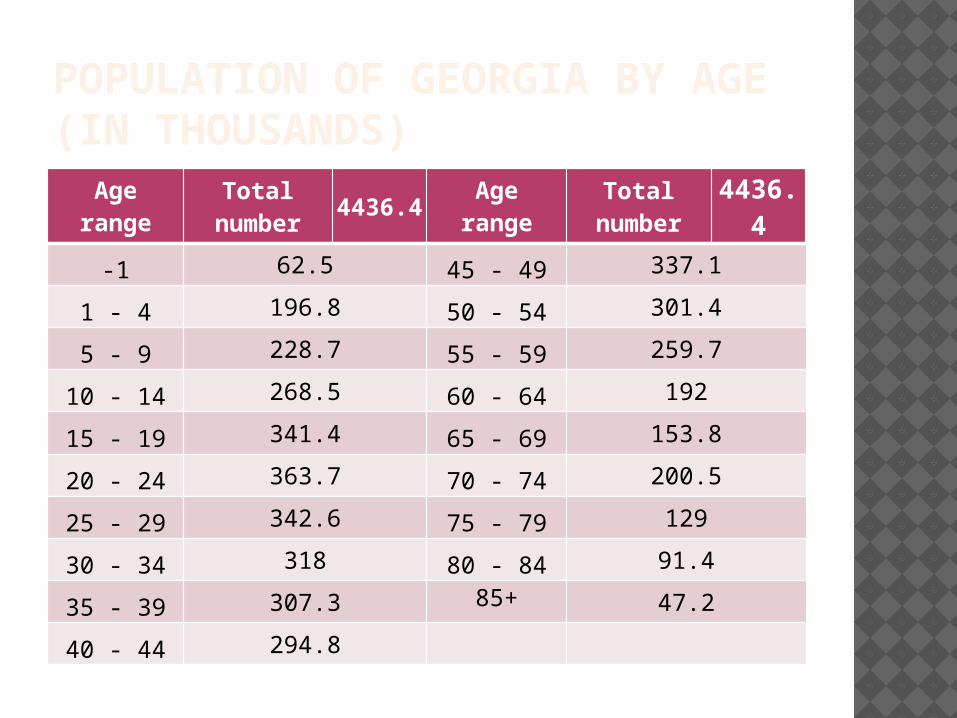
POPULATION OF GEORGIA BY AGE(IN THOUSANDS)
Age range
Total number 4436.4
Age range
Total number
4436.4
-1 62.5 45 - 49 337.1
1 - 4 196.8 50 - 54 301.4
5 - 9 228.7 55 - 59 259.7
10 - 14 268.5 60 - 64 192
15 - 19 341.4 65 - 69 153.8
20 - 24 363.7 70 - 74 200.5
25 - 29 342.6 75 - 79 129
30 - 34 318 80 - 84 91.4
35 - 39 307.3 85+ 47.2
40 - 44 294.8

POPULATION OF GEORGIA BY AGE(IN THOUSANDS)
1% 4%
5%
6%
8%
8%
8%
7%
7%7%
8%
7%
6%
4%
3%
5%3% 2% 1%
-1 1 - 4 5 - 9 10 - 14 15 - 19 20 - 24 25 - 29 30 - 34 35 - 3940 - 44 45 - 49 50 - 54 55 - 59 60 - 64 65 - 69 70 - 74 75 - 79 80 - 84

BALANCE OF MIGRATION(IN THOUSANDS)
2000
2001
2002
2003
2004
2005
2006
2007
2008
2009
-60
-40
-20
0
20
40
60
80
100
Balance of Migration
REFERENCE
http://www.geostat.ge/

THANK YOU