Case Report Multidetector Computed Tomography Angiography ...
Upload
watalinCategory
view
49download
0
BAGIAN ILMU RADIOLOGI
FAKULTAS KEDOKTERAN
UNIVERSITAS PATTIMURA
Dynamic multidetector computed tomography
findings of hepatocellular carcinoma of hepatitis
B virus-positive and -negative patients
JOURNAL READING
January 2015
Disusun oleh :
Rahel Laritmas
(2008-83-022)
Pembimbing
dr. H. M. Manuputty, Sp. Rad
DIBAWAKAN DALAM RANGKA TUGAS KEPANITERAAN KLINIK PADA
BAGIAN ILMU RADIOLOGI FAKULTAS KEDOKTERAN UNIVERSITAS
PATTIMURA
AMBON
2014
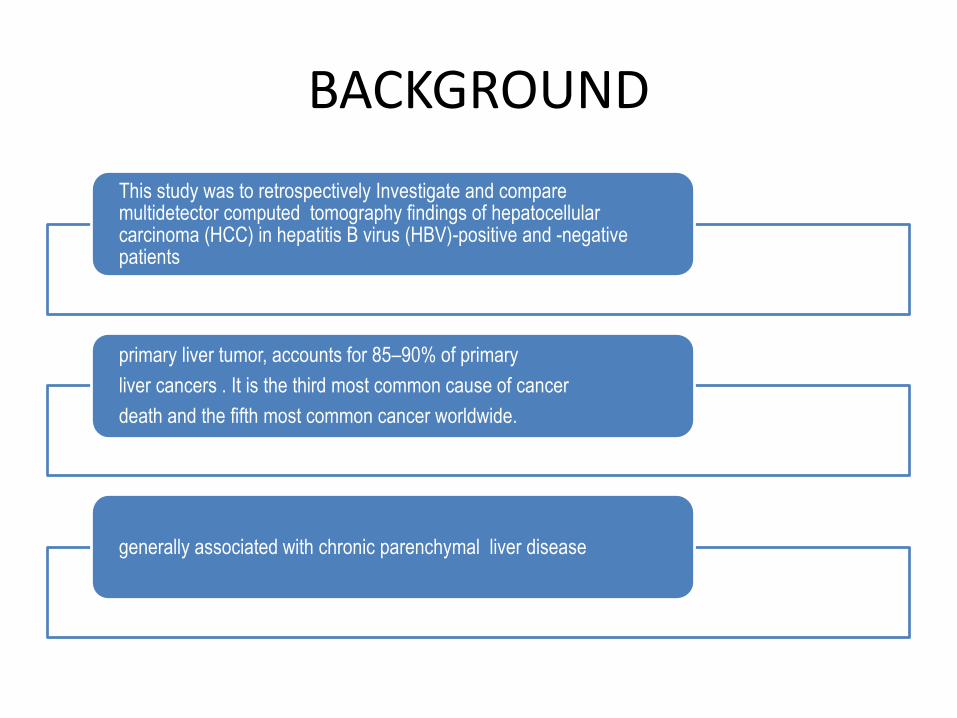
BACKGROUND
This study was to retrospectively Investigate and compare multidetector computed tomography findings of hepatocellularcarcinoma (HCC) in hepatitis B virus (HBV)-positive and -negative patients
primary liver tumor, accounts for 85–90% of primary
liver cancers . It is the third most common cause of cancer
death and the fifth most common cancer worldwide.
generally associated with chronic parenchymal liver disease

Chronic infection HBV is the primary risk factor
development of HCC worldwide
non-viral causes of HCC iron overload syndromes, alcohol use, tobacco use, oral contraceptive use, and aflatoxin exposure
increased body mass index and diabetes with the subsequent development of non-alcoholic steatohepatitis (NASH)

Hepatocellularcarcinomas are
generally hypervascular
highest degree of contrast during the
arterial phase
arterial phase, is essential for the detection of HCC
Portal venous phase imaging
detectinghypovascular liver
tumors
metastatic tumors from
the colorectum, because the liver parenchyma is
enhancedmaximally during this
phase

Methods
Triphasic (arterial, portal
venous, and delayed
phases) dynamic
multidetector computed
tomography (CT)
performed in 83 patients
with HCC
CT imaging findings (68
patients)
Histopathological evaluation
(15 patients).
48 of whom were
HBV-positive.
Distribution of HCC
solitary, multiple,
and diffuse HCC, portal/hepatic vein
thrombosis, metastasis, and patients with
high alpha-fetoprotein levels in the HBV-
positive and -negative groups
Lesion size, alpha-fetoprotein
levels, arterial, portal, delayed enhancement,
and washout of lesions were compared
Kolmogorov–
Smirnov test.
Student’s t-test.

Results and discussion

• All patients with HCC had at least one of the following CT findings thatshowed evidence of chronic parenchymal liver disease:
irregular liver contours
hepatic volume loss
volume redistribution
coarse nodular liver parenchyma

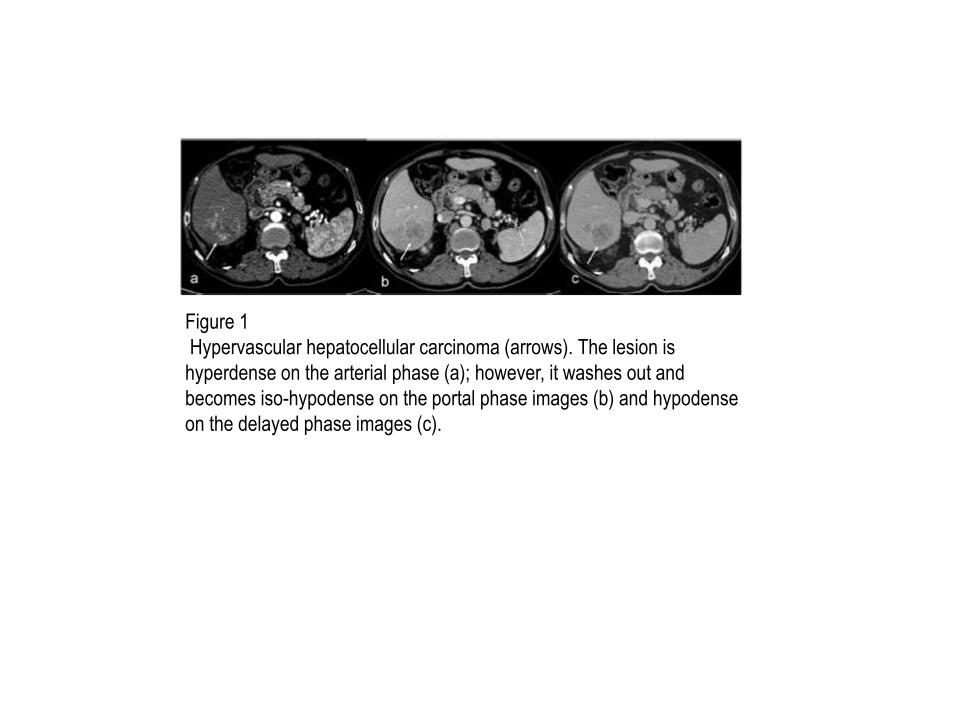
Figure 1
Hypervascular hepatocellular carcinoma (arrows). The lesion is
hyperdense on the arterial phase (a); however, it washes out and
becomes iso-hypodense on the portal phase images (b) and hypodense
on the delayed phase images (c).

Figure 2:
Hypovascular hepatocellular carcinoma (arrows). The lesion is
hypodense and remains unenhanced on arterial (a), portal (b), and
delayed (c) images.

Figure 3
Diffusely infiltrative hepatocellular carcinoma contains nodular
fat (arrows). The large lesion invading both lobes of the liver
heterogeneously enhances on the arterial phase (a), and
becomes isodense with focal hypodense areas on the portal
venous phase (b).

Figure 4
Diffusely infiltrative hepatocellular carcinoma. The
heterogeneous lesion invades both lobes of the liver and
mildly enhances on the arterial phase (a). The portal
venous phase image (b) shows a hypodense, infiltrative
lesion with multiple small hypodense satellite nodules.

Conclusion
• HCCs of HBV-positive and -negative patients were alike. In this study, weobserved that the frequency of elevated alphafetoprotein was notdifferent between HBV-positive and -negative patients; however, themean alpha-fetoprotein value of the HBV-positive patients was higher.
• Portal/ hepatic vein thrombosis and metastasis were more frequent inHBV-positive patients.

Figure 5
Multiple hepatocellular carcinomas. Two lesions in
the right lobe of the liver are hyperdense on the
arterial phase (a); however, they wash out and
become hypodense on the delayed phase image
(b). The patient also had two lesions in the left lobe
of the liver (not shown).

Figure 6
Portal vein thrombosis (black arrows) and periportal-
paraceliac lymphadenopathies (white arrows). On the
arterial phase (a), lymphadenopathies are hypervascular
similar to the hepatocellular carcinoma in the right lobe of
the liver (asterisk). The hepatocellular carcinoma and
lymphadenopathies wash out on the portal venous phase
(b).

Figure 7
Measurements of computed tomography (CT) attenuations
(in Hounsfield units) of a hypervascular hepatocellular
carcinoma on arterial (a) and delayed (b) phase CT
images.

TERIMAKASIH