Dynamic Inconsistency in Food Choice: Experimental...
35
Electronic copy available at: http://ssrn.com/abstract=2572821 Dynamic Inconsistency in Food Choice: Experimental Evidence from a Food Desert Sally Sadoff ⇤ University of California, San Diego Anya Samek † University of Wisconsin-Madison Charles Sprenger ‡ University of California, San Diego September, 2014 This Version: January 31, 2015 Abstract Despite the great deal of research on dynamic inconsistency in time pref- erences, few studies have ventured into investigating the question in a natural context. To address this gap, we conduct a natural field experiment with over 200 customers at a grocery store to investigate dynamic inconsistency and the demand for commitment in food choice. Over a 3 week time period, subjects are invited to allocate and re-allocate food items received as part of a grocery deliv- ery program. We observe substantial dynamic inconsistency in our experiment, as well as a demand for commitment among a non-negligible number of subjects. Interestingly, individuals who demand commitment are more likely to be dynam- ically consistent in their prior behavior. For academics, our work provides direct evidence of dynamic inconsistency in consumption choices in the field and points towards potential extensions to models of temptation. For policy-makers, our findings provide insights on innovations to alter food choices. JEL classifications: C91, D12, D81 Keywords : temptation, dynamic inconsistency, commitment demand, field experiment ⇤ University of California at San Diego, Rady School of Management, 9500 Gilman Drive, La Jolla, CA 92093; sadoff@ucsd.edu. † University of Wisconsin-Madison, School of Human Ecology, 1300 Linden Drive, Madison WI 53706; [email protected] ‡ University of California at San Diego, Rady School of Management and Department of Economics, 9500 Gilman Drive, La Jolla, CA 92093; [email protected].
Transcript of Dynamic Inconsistency in Food Choice: Experimental...
Electronic copy available at: http://ssrn.com/abstract=2572821
Dynamic Inconsistency in Food Choice:
Experimental Evidence from a Food Desert
Sally Sadoff
⇤
University of California, San DiegoAnya Samek
†
University of Wisconsin-Madison
Charles Sprenger
‡
University of California, San Diego
September, 2014
This Version: January 31, 2015
Abstract
Despite the great deal of research on dynamic inconsistency in time pref-erences, few studies have ventured into investigating the question in a naturalcontext. To address this gap, we conduct a natural field experiment with over200 customers at a grocery store to investigate dynamic inconsistency and thedemand for commitment in food choice. Over a 3 week time period, subjects areinvited to allocate and re-allocate food items received as part of a grocery deliv-ery program. We observe substantial dynamic inconsistency in our experiment,as well as a demand for commitment among a non-negligible number of subjects.Interestingly, individuals who demand commitment are more likely to be dynam-ically consistent in their prior behavior. For academics, our work provides directevidence of dynamic inconsistency in consumption choices in the field and pointstowards potential extensions to models of temptation. For policy-makers, ourfindings provide insights on innovations to alter food choices.
JEL classifications: C91, D12, D81
Keywords : temptation, dynamic inconsistency, commitment demand, field experiment
⇤University of California at San Diego, Rady School of Management, 9500 Gilman Drive, La Jolla,CA 92093; [email protected].
†University of Wisconsin-Madison, School of Human Ecology, 1300 Linden Drive, Madison WI53706; [email protected]
‡University of California at San Diego, Rady School of Management and Department of Economics,9500 Gilman Drive, La Jolla, CA 92093; [email protected].
Electronic copy available at: http://ssrn.com/abstract=2572821
1 Introduction
Models incorporating temptation impulses and self-control are among the most promi-nent in behavioral economics (Laibson, 1997; O’Donoghue and Rabin, 1999a; Gul andPesendorfer, 2001; Fudenberg and Levine, 2006). The dynamic inconsistencies pre-dicted by these models provide a reason for the observed difficulty of people to savemore for the future, exercise more, eat healthier, and quit smoking, despite stateddesires to make these changes.
While a large literature has developed investigating hallmarks of dynamic inconsis-tency in laboratory experiments, (see Frederick, Loewenstein and O’Donoghue (2002)for an overview), limited empirical evidence exists to inform these models in a naturalcontext.1 To address this gap, we conduct a natural field experiment to investigatedynamic inconsistency and the demand for commitment in food choice.2
Our experimental setting is a food delivery service for low-income subjects in urbanChicago, Illinois. This setting is important for two reasons. First, our experimentalneighborhood previously qualified as a ‘food desert’ according to the United States De-partment of Agriculture, implying both a high rate of poverty and potentially limitedaccess to fresh fruits and vegetables.3 The limited grocery access of our study sampleis critical, as we offer subjects choices between healthy and unhealthy items. Limitedaccess to healthy foods constrains the opportunities for subjects to arbitrage the ex-periment by making use of external trading opportunities. Second, our experimental
1Identification of dynamic inconsistency relies on subjects choosing between rewards at time t andat time t+k. Disagreement in these choices is evidence of dynamic inconsistency. Relatively few studiesprovide such longitudinal tests, as noted by Halevy (2012) and Sayman and Onculer (2009). Saymanand Onculer (2009) identifies only three prior longitudinal studies of time inconsistency: Ainslie andHaendel (1983) for monetary choices within subjects, Read, Loewenstein and Kalyanaraman (1999)for “highbrow" and “lowbrow" movies between subjects, and Read and Van Leeuwen (1998) for snackchoices within subjects. Another early work is Solnick, Kannenberg, Eckerman and Waller (1980), forirritating noises between subjects. Recent experimental advances with longitudinal within subjectsdesigns include Sayman and Onculer (2009) for cafe rewards and money, Halevy (2012) for money,Gine, Goldberg, Silverman and Yang (2010) for money, and Augenblick, Niederle and Sprenger (2013)for effort and money. A recent study with a longitudinal between subjects design is Duflo, Kremerand Robinson (2011) for fertilizer purchase. We are aware of only three field studies in which subjectspotentially did not know they were participating in an experiment: Sayman and Onculer (2009), Readand Van Leeuwen (1998) and Duflo et al. (2011).
2Related work on food choice includes McClure, Laibson, Loewenstein and Cohen (2004), whofind neural evidence for diminishing impatience surrounding beverage consumption and Brown, Chuaand Camerer (2009) who show that food decisions (also consuming beverages) exhibit hallmarks ofdynamic inconsistency in consumption-savings problems.
3See the USDA’s website, http://apps.ams.usda.gov/fooddeserts/fooddeserts.aspx. A food desertis officially defined as having a) a poverty rate of 20% or greater and b) at least 500 persons and/orat least 33% of the census tract lives more than one mile from a supermarket or large grocery store.Estimates by the USDA suggest that approximately 11.5 million low-income Americans live more than1 mile from a supermarket.
1
neighborhood sits in the cross-hairs of debates on food policy. Obesity is at an all-timehigh in the United States, contributing to chronic illnesses such as coronary disease anddiabetes, and disproportionately affecting low income communities (Jia and Lubetkin,2005; Mokdad, Ford, Bowman, Dietz, Vinicor, Bales and Marks, 2003; Kumanyika andGrier, 2006). Research in such communities may be uniquely positioned to influencethe policy debate on the sources of low-income obesity and the interventions that mayprove successful in combatting it.
Two hundred eighteen subjects completed a three-week food delivery program con-ducted in collaboration with a neighborhood grocery store, Louis’ Groceries.4 Subjectswere given a budget of $10 and asked to construct a bundle of goods from a list of 20potential foods for home delivery in one week. All items cost $1 each. Ten of the foodswere fresh fruits and vegetables (which we call healthy) and ten were packaged snackfoods (which we call unhealthy). Prior to the study, subjects also provided a rating forhow much they liked each food.
Delivery was made at a time when subjects were sure to be home. On the day ofdelivery, the delivery-person brought the chosen bundle of goods, and also surprisedsubjects with four additional foods available for exchange. These four items were tai-lored for each subject to be their highest rated healthy item, their highest rated healthyitem not included in their original chosen bundle, their highest rated unhealthy item,and their highest rated unhealthy item not included in their original chosen bundle.Subjects were given the opportunity to make up to four exchanges. Importantly, everybundle that could be constructed with immediate exchanges is one that was available atthe time of advance choice. As such, dynamic inconsistencies are identified as violationsof revealed preference between advance and immediate choices.
In the second week of the study, subjects again made advance choices. However,during the delivery reminder call, they were asked if they would like the driver tonot bring the four additional items. That is, subjects were asked if they would like tocommit to their advance choice. Thus, commitment is identified as a binding restrictionto the singleton choice set consisting only of the advance bundle.
Our analysis focuses on dynamic inconsistencies that alter the proportion of healthyor unhealthy items in a subject’s bundle. Forty-six of 218 subjects (21%) exhibiteddynamic inconsistencies, making immediate choices that were either less healthy or
4Two hundred twenty five subjects were initially recruited into the study. Of these 225, 5 subjectsdid not provide a working phone number of address, so we consider them attrited from the samplebefore receiving any food deliveries. One subject requested their data not be used in analysis and onesubject did not make a commitment decision. Our relatively low level of attrition is partly due to acompletion bonus of $20. See section 2 for further details.
2
more healthy than their advance choices. Of these 46, 44 (96%) subjects exchanged forless healthy bundles, giving a clear direction for the nature of inconsistency. Consistentwith models of temptation and self-control, subjects’ immediate decisions are tiltedtowards less healthy alternatives than their advance decisions.
Of the 218 subjects, 73 (33%) chose to commit, restricting themselves to theiradvance choice.5 Such demand for commitment is a key prediction of models of dynamicinconsistency. Recognizing the possibility of immediate temptation, a decisionmakermay be willing to restrict herself to her advance choice.
Exploration of the relationship between dynamic inconsistency and commitmentreveals an interesting pattern. Committing subjects are disproportionately likely to bedynamically consistent. While only 9 of 46 (20%) dynamically inconsistent subjectsdemand commitment, 64 of 172 (37%) dynamically consistent subjects do so. Foodratings data indicate that committing subjects do indeed try to restrict themselveswhen making their advance decisions, choosing their highest rated items less frequentlythan their non-committing counterparts. Hence, it seems committing subjects aresystematically those that overcome temptation, rather than those who succumb to it.
Our findings relate to two prominent strands in the experimental literature on dy-namic inconsistency. The first strand attempts to utilize consumption rather thanmonetary choices to investigate intertemporal preferences. Most notably, Read andVan Leeuwen (1998) identify dynamic inconsistency in the surprise re-allocations ofsnack choices for Dutch workers. Across conditions, 50.5% of subjects chose unhealthysnack items in advance choice and 83% of subjects chose unhealthy snack items inimmediate choice, 37.5% of subjects were dynamically inconsistent and 93% of viola-tions were towards less healthy snack items. The patterns of dynamic inconsistencyand violations towards less healthy items are consistent between our study and thatof Read and Van Leeuwen (1998). However, several design differences might generateour clearly less dramatic findings. First, in Read and Van Leeuwen (1998) subjectsare told that the researcher had no record of their prior decisions.6 This might givethe decisionmaker additional license to give in to temptation, or may generate exper-
5For the remaining 145 non-committing subjects, we can investigate stability of dynamic incon-sistency, revealing substantial correlation in both choice and the inconsistency in choice over time.Section 4 provides details.
6The procedure notes “At this point, we made no reference to the fact that they had alreadychosen a snack and told them that they could have any snack they wanted. Many people felt thatthey should take the snack they had originally chosen, but we reminded them that they could haveany snack they wanted and emphasized that we had plenty of each kind of snack. Some asked if weknew what their advance choices were, but we denied any such knowledge and ‘proved’ it by showingthem a list containing only their names with no record of their choices. Once the subjects had madetheir immediate choice we gave them the snack they chose" (Read and Van Leeuwen, 1998).
3
imenter demand effects. A second difference is an issue with selection in Read andVan Leeuwen (1998), as 20% of the sample attrits during the study. Choices are madeat two points in time, either ‘after lunch time’ or ‘in the late afternoon around 4:30or 5:00’.7 Subjects present at work at those times may be selected on potential fortemptatio, either by not having eaten lunch or not having left work for the day.
A second strand of literature links hallmarks of dynamic inconsistency to commit-ment demand. Such empirical exercises are instructive as they provide an opportunityto both validate models of dynamic inconsistency and discriminate between compet-ing theories. In particular, under perfectly sophisticated quasi-hyperbolic discounting(Laibson, 1997; O’Donoghue and Rabin, 1999a), more present-biased subjects shouldbe more likely to demand commitment, while under the models of Gul and Pesendor-fer (2001) and Fudenberg and Levine (2006) all decisionmakers, including those whodon’t succumb to temptation, value commitment. With partial sophistication, the pre-diction depends on the relationship between sophistication and the extent of dynamicinconsistency. In all prior exercises, it appears that more dynamically inconsistent indi-viduals are more aware of their inconsistency, yielding the observed positive correlationbetween the extent of inconsistency and the extent of commitment demand (Ashraf,Karlan and Yin, 2006; Augenblick et al., 2013; Kaur, Kremer and Mullainathan, 2010).8
Our evidence indicates that those with the largest self-control problems may be lesslikely to be aware, as it is those who overcome temptation who disproportionately de-mand commitment. Importantly, in all of the conducted exercises, including our own,the proportion of explained variance in commitment choice is small, indicating limitedcorrelation between dynamic inconsistency and sophistication. Clearly, more researchis required in this domain before any conclusions can be drawn.
Our findings also provide policy implications. Critically, our results show clearpotential health effects from making choices in advance. In our study, advance bundlescontain significantly less calories, fat, saturated fat, carbohydrates, protein and addedsugar; and significantly more natural sugar and fiber compared to immediate bundles.Policy makers wishing to alter patterns of food consumption in these directions coulddo so by encouraging advance choice. Our findings also suggest that the observable
7In section 4.4, we analyze differential behavior by time of day of food delivery. However, thetiming is not exogenous as it is determined partly by the decisionmaker and may be an avenue forcommitment.
8Ashraf et al. (2006) show a limited, but significant, correlation between diminishing impatiencein monetary choices and take-up of a savings commitment device for women. Augenblick et al. (2013)show a small, but significant, correlation between dynamic inconsistency and commitment demandfor real effort tasks. Kaur et al. (2010) document a relationship between take-up of a dominated wagecontract and increased effort close to paydays.
4
benefits of providing commitment may be limited. Commitment in our setting allowssubjects who would overcome temptation anyway an alternative method of doing so.Hence, provision of commitment devices may not dramatically affect health outcomes.This conclusion resonates with one recent finding on commitment demand in gymattendance by Royer, Stehr and Sydnor (2012), who document commitment beingdisproportionately demanded by subjects who already exercise regularly.
In what follows, Section 2 provides an overview of the experimental design, Section3 couches our design in theories of temptation preferences, Section 4 describes ourresults and Section 5 concludes.
2 Design of Experiment
2.1 Experimental Setup
To examine dynamic inconsistency in food choice, we conducted a natural field exper-iment with 218 subjects at a local grocery store in Chicago, Illinois.9 The experimentwas implemented in the summer of 2014 at Louis’ Groceries, a small-format neighbor-hood grocery store in the low-income community of Greater Grand Crossing.10 Thegrocery store is a pilot program of the non-profit organization Louis’ Groceries NFP,whose mission is to increase community access to healthy food options. Before Louis’opened its doors in 2012, the area was classified as a ‘food desert,’ meaning that ‘asubstantial share of residents have low levels of access to a grocery store or healthy,affordable retail outlet.’11 Unfortunately, Louis’ closed its doors in the winter of 2014,which means that the area has again become a ‘food desert.’
Louis’ Groceries carried out a promotion inviting customers to sign up for a free,2-week home food delivery program. Two research assistants worked at the grocerystore to conduct the experiment and deliver the food items. Subjects for the studywere recruited through flyers posted in the store during a 6-week period. We assuredthat foods were fresh and produce was not bruised at time of delivery by working
9Two hundred twenty-five subjects were initially recruited into the study. Of these 225, 5 subjectsattrited from the sample before receiving any food deliveries could be made. One subject requestedtheir data not be used in analysis and one subject did not make a commitment decision.
10The Greater Grand Crossing community area has a total population of 35,217 (Census, 2010),the majority of whom are African Americans (97.8%). The neighborhood has high rates of poverty,with 28.5% of its residents living on an income below the poverty level. The community also has highincidences of obesity and basic prophylactic health neglect, which are higher than the city of Chicagooverall.
11USDA website, http://apps.ams.usda.gov/fooddeserts/fooddeserts.aspx. The nearest grocerystore is over 1 mile away.
5
closely with the grocery store and preparing deliveries as close to the delivery time aspossible. In keeping with natural field experiment methodology, subjects did not knowthat they were in an experiment. Thus, we are able to observe subjects in their naturalenvironment as they made a series of intertemporal food allocation decisions.
In return for participating in the promotion, including selecting items, receiving2 weekly deliveries and completing a pre- and post- survey, subjects received a $20participation payment. At the conclusion of the study, subjects were notified that theyhad participated in an experiment and had the option to withdraw their data. Onesubject chose to withdraw, and this subject’s data is not in the dataset.
In our experiment, we observe allocation choices but not actual consumption of fooditems. One may worry that subjects’ choices do not represent their true preferences,but rather reflect their external opportunities to trade healthy and unhealthy items.For example, a subject who can trade healthy for unhealthy items more advantageouslyoutside of the experiment may choose a bundle consisting only of healthy items, conductappropriate trades, and generate for herself an opportunity set that dominates thatprovided by experimental choice. A similar arbitrage argument is used to question theuse of monetary payments in studies of discounting (Cubitt and Read, 2007; Chabris,Laibson and Schuldt, 2008; Andreoni and Sprenger, 2012; Augenblick et al., 2013).
Several aspects of the experimental environment largely minimize the possibility ofarbitrage. Louis’ groceries is one of few neighborhood places where fresh fruits andvegetables can be obtained and the prices in the store are identical to those faced inthe experiment. Hence, external exchanges are unlikely to be advantageous. Addi-tionally, conducting exchanges with others in the neighborhood is practically difficult,including the cost of identifying interested parties and the perishability of some foods.Importantly, even if arbitrage opportunities exist, one would not expect them to changedramatically over a single week in our study. Hence, if choice is driven by arbitragestrategies, dynamic inconsistencies should be rare. The data themselves can providesome indication of arbitrage strategies by examining the prevalence of completely con-centrated bundles, consisting of either all healthy or all unhealthy items. Such bundleconcentration is, in fact, quite infrequent.12 One additional concern posed by not ob-serving food consumption is that if foods are not consumed immediately temptationmay be limited. This is a clear limitation of the present design and may indicate thatobserved dynamic inconsistencies and commitment demand represent lower bounds onthe potential prevalence of such phenomena.
12Only 10 of 218 bundles consist of either all healthy or all unhealthy items.
6
2.2 Foods and Ratings
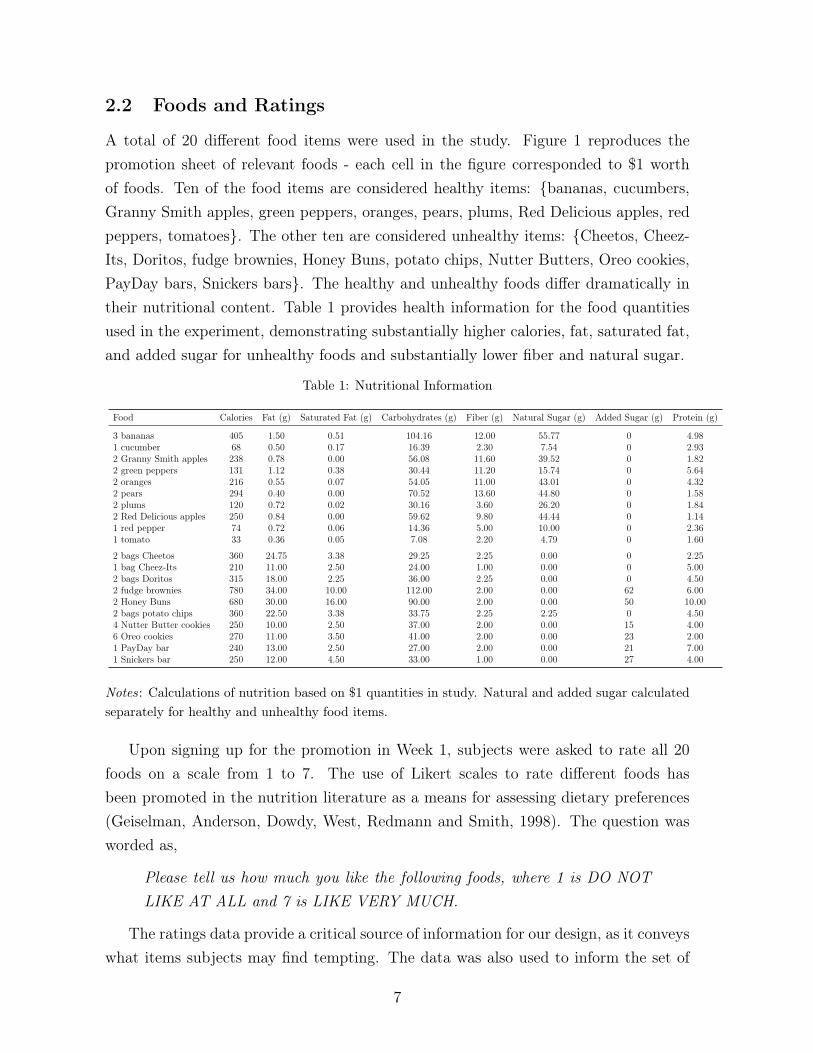
A total of 20 different food items were used in the study. Figure 1 reproduces thepromotion sheet of relevant foods - each cell in the figure corresponded to $1 worthof foods. Ten of the food items are considered healthy items: {bananas, cucumbers,Granny Smith apples, green peppers, oranges, pears, plums, Red Delicious apples, redpeppers, tomatoes}. The other ten are considered unhealthy items: {Cheetos, Cheez-Its, Doritos, fudge brownies, Honey Buns, potato chips, Nutter Butters, Oreo cookies,PayDay bars, Snickers bars}. The healthy and unhealthy foods differ dramatically intheir nutritional content. Table 1 provides health information for the food quantitiesused in the experiment, demonstrating substantially higher calories, fat, saturated fat,and added sugar for unhealthy foods and substantially lower fiber and natural sugar.
Table 1: Nutritional Information
Food Calories Fat (g) Saturated Fat (g) Carbohydrates (g) Fiber (g) Natural Sugar (g) Added Sugar (g) Protein (g)
3 bananas 405 1.50 0.51 104.16 12.00 55.77 0 4.981 cucumber 68 0.50 0.17 16.39 2.30 7.54 0 2.932 Granny Smith apples 238 0.78 0.00 56.08 11.60 39.52 0 1.822 green peppers 131 1.12 0.38 30.44 11.20 15.74 0 5.642 oranges 216 0.55 0.07 54.05 11.00 43.01 0 4.322 pears 294 0.40 0.00 70.52 13.60 44.80 0 1.582 plums 120 0.72 0.02 30.16 3.60 26.20 0 1.842 Red Delicious apples 250 0.84 0.00 59.62 9.80 44.44 0 1.141 red pepper 74 0.72 0.06 14.36 5.00 10.00 0 2.361 tomato 33 0.36 0.05 7.08 2.20 4.79 0 1.60
2 bags Cheetos 360 24.75 3.38 29.25 2.25 0.00 0 2.251 bag Cheez-Its 210 11.00 2.50 24.00 1.00 0.00 0 5.002 bags Doritos 315 18.00 2.25 36.00 2.25 0.00 0 4.502 fudge brownies 780 34.00 10.00 112.00 2.00 0.00 62 6.002 Honey Buns 680 30.00 16.00 90.00 2.00 0.00 50 10.002 bags potato chips 360 22.50 3.38 33.75 2.25 2.25 0 4.504 Nutter Butter cookies 250 10.00 2.50 37.00 2.00 0.00 15 4.006 Oreo cookies 270 11.00 3.50 41.00 2.00 0.00 23 2.001 PayDay bar 240 13.00 2.50 27.00 2.00 0.00 21 7.001 Snickers bar 250 12.00 4.50 33.00 1.00 0.00 27 4.00
Notes: Calculations of nutrition based on $1 quantities in study. Natural and added sugar calculatedseparately for healthy and unhealthy food items.
Upon signing up for the promotion in Week 1, subjects were asked to rate all 20foods on a scale from 1 to 7. The use of Likert scales to rate different foods hasbeen promoted in the nutrition literature as a means for assessing dietary preferences(Geiselman, Anderson, Dowdy, West, Redmann and Smith, 1998). The question wasworded as,
Please tell us how much you like the following foods, where 1 is DO NOTLIKE AT ALL and 7 is LIKE VERY MUCH.
The ratings data provide a critical source of information for our design, as it conveyswhat items subjects may find tempting. The data was also used to inform the set of
7
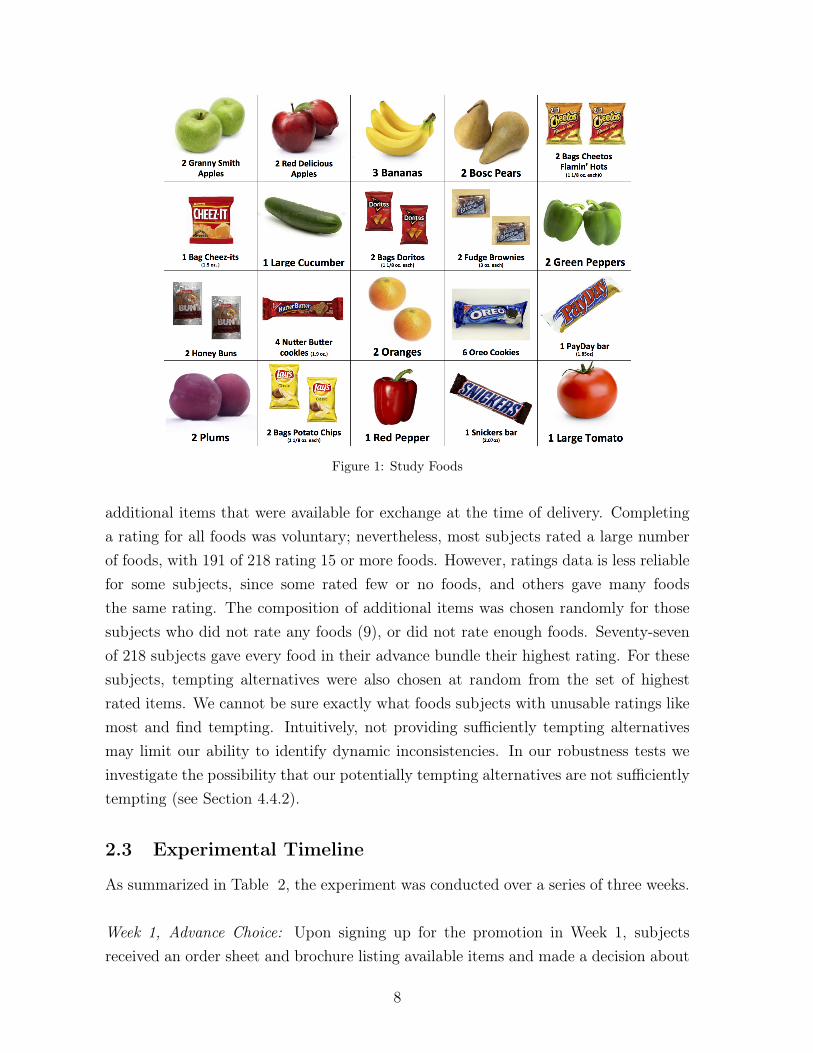
Figure 1: Study Foods
additional items that were available for exchange at the time of delivery. Completinga rating for all foods was voluntary; nevertheless, most subjects rated a large numberof foods, with 191 of 218 rating 15 or more foods. However, ratings data is less reliablefor some subjects, since some rated few or no foods, and others gave many foodsthe same rating. The composition of additional items was chosen randomly for thosesubjects who did not rate any foods (9), or did not rate enough foods. Seventy-sevenof 218 subjects gave every food in their advance bundle their highest rating. For thesesubjects, tempting alternatives were also chosen at random from the set of highestrated items. We cannot be sure exactly what foods subjects with unusable ratings likemost and find tempting. Intuitively, not providing sufficiently tempting alternativesmay limit our ability to identify dynamic inconsistencies. In our robustness tests weinvestigate the possibility that our potentially tempting alternatives are not sufficientlytempting (see Section 4.4.2).
2.3 Experimental Timeline
As summarized in Table 2, the experiment was conducted over a series of three weeks.
Week 1, Advance Choice: Upon signing up for the promotion in Week 1, subjectsreceived an order sheet and brochure listing available items and made a decision about
8
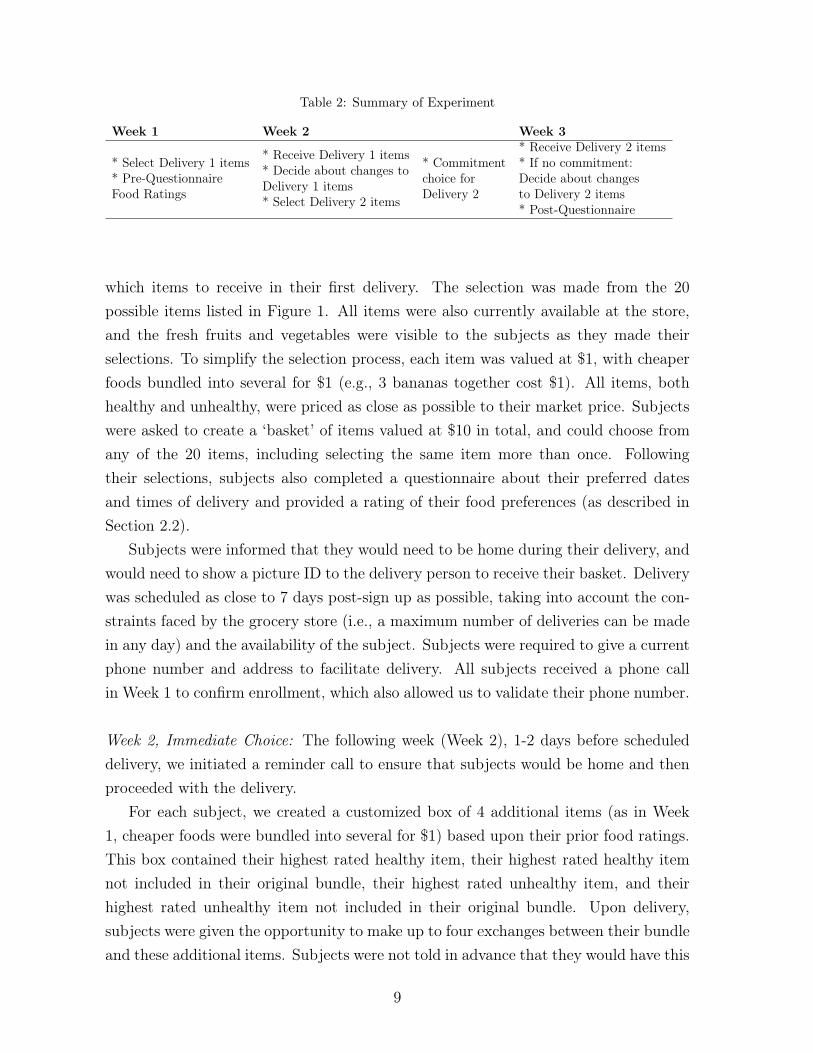
Table 2: Summary of Experiment
Week 1 Week 2 Week 3
* Select Delivery 1 items* Pre-QuestionnaireFood Ratings
* Receive Delivery 1 items* Decide about changes toDelivery 1 items* Select Delivery 2 items
* Commitmentchoice forDelivery 2
* Receive Delivery 2 items* If no commitment:Decide about changesto Delivery 2 items* Post-Questionnaire
which items to receive in their first delivery. The selection was made from the 20possible items listed in Figure 1. All items were also currently available at the store,and the fresh fruits and vegetables were visible to the subjects as they made theirselections. To simplify the selection process, each item was valued at $1, with cheaperfoods bundled into several for $1 (e.g., 3 bananas together cost $1). All items, bothhealthy and unhealthy, were priced as close as possible to their market price. Subjectswere asked to create a ‘basket’ of items valued at $10 in total, and could choose fromany of the 20 items, including selecting the same item more than once. Followingtheir selections, subjects also completed a questionnaire about their preferred datesand times of delivery and provided a rating of their food preferences (as described inSection 2.2).
Subjects were informed that they would need to be home during their delivery, andwould need to show a picture ID to the delivery person to receive their basket. Deliverywas scheduled as close to 7 days post-sign up as possible, taking into account the con-straints faced by the grocery store (i.e., a maximum number of deliveries can be madein any day) and the availability of the subject. Subjects were required to give a currentphone number and address to facilitate delivery. All subjects received a phone callin Week 1 to confirm enrollment, which also allowed us to validate their phone number.
Week 2, Immediate Choice: The following week (Week 2), 1-2 days before scheduleddelivery, we initiated a reminder call to ensure that subjects would be home and thenproceeded with the delivery.
For each subject, we created a customized box of 4 additional items (as in Week1, cheaper foods were bundled into several for $1) based upon their prior food ratings.This box contained their highest rated healthy item, their highest rated healthy itemnot included in their original bundle, their highest rated unhealthy item, and theirhighest rated unhealthy item not included in their original bundle. Upon delivery,subjects were given the opportunity to make up to four exchanges between their bundleand these additional items. Subjects were not told in advance that they would have this
9
opportunity to exchange. The opportunity to exchange was conducted by a researchassistant serving as a delivery person and was fully scripted as:
Hello, I am here with your basket. Please take a look [Bring open basket,allow person to look through]. We also have some extra items available. Ifyou like, you can exchange any one item in your basket for one of theseitems [ show extra items on tray ]. I brought four additional items, so youcan make up to 4 exchanges. Do you want to make any exchange? [Greatthanks, let me note that on your order sheet.]
After making any exchanges, subjects used a new order sheet to make a decisionabout the contents of their second delivery, scheduled for Week 3.
Week 2.5, Commitment Choice: 1-2 days prior to the Week 3 delivery, we again initiateda reminder call to ensure that subjects would be home. This time, we also elicited thedemand for commitment by asking subjects whether they would like to receive the boxof additional items during the Week 3 delivery. This question was again fully scriptedas:
Last time, we brought some extra items for you so you could exchange ifyou changed your mind from your previous choices. This time, we can alsobring extra items, but I wanted to check if you’d like that or not. It is upto you: would you like me to bring extra items this time, or not?
If a subject answered ‘yes,’ the box of additional items was prepared in the same wayas before and presented at the time of delivery. If a subject answered ‘no.’ a box ofadditional items was not delivered and we classified this subject as one who demandscommitment. In the case that subjects did not pick up the phone for the remindercall at least 1 day prior to the delivery date, we continued calling and re-scheduled thedelivery for 1 day after we reached the subject to elicit commitment.
At the time of the Week 3 delivery, subjects completed another questionnaire andreceived a voucher that could be redeemed for $20 in cash at Louis’ Groceries upontheir next visit.
3 Theoretical Predictions
Our experiment offers subjects a choice between unhealthy, g, and healthy, h, foods.The price of each food item (healthy and unhealthy) is $1. With a fixed budget of
10
$10, this establishes the choice set, (g, h) 2 X = {(0, 10), (1, 9), ..., (9, 1), (10, 0)}.13
We study choices made at two points in time. First, we examine the choices made inadvance of food delivery, which we refer to as advance decisions. Second, we studychoices made at the time of food delivery, which we call immediate decisions. Finally,we explore the extent of commitment demand exhibited as an advance preference forsmaller choice sets.
We analyze behavior through the lens of temptation based models (Gul and Pe-sendorfer, 2001; Fudenberg and Levine, 2006).14 In applying temptation preferences,we make two assumptions. The first is that temptation is felt only at the time offood delivery, and the second is that advance decisions are generated under the guiseof commitment.15 Under these assumptions, for a given choice set, A, and immediatedecisions, the Gul and Pesendorfer (2001); Fudenberg and Levine (2006) formulationdelivers a decisionmaker who maximizes
max(g,h)2A u(g, h) + v(g, h)� v(gt, ht)
The index v(g, h) is a temptation ranking, capturing the impulses felt by the de-cisionmaker at the time of food delivery. The maximum of this index for thechoice set, A, is the most tempting choice available at the time of food delivery,v(gt, ht) ⌘ max(g,h)2Av(g, h). The difference v(g, h) � v(gt, ht) represents the fore-gone utility of choosing the bundle (g, h) and not the most tempting item in the choiceset, v(gt, ht). These are self-control costs potentially born in immediate decisions thatprevent the subject from giving in fully to temptation.
The index u(g, h) is a commitment ranking, capturing the decisionmaker’s prefer-ences if he had been able to commit to a single bundle in advance. Consider a subjectfacing a singleton choice set in an immediate decision, having committed ex-ante to aparticular bundle. In such a case, v(g, h) = v(gt, ht), no self-control costs are borne,and the decisionmaker receives utility u(g, h). Hence, u(g, h) is a commitment rankingin the sense that it provides the decisionmaker’s advance ranking over singleton choice
13For ease of explication we abstract from the preferences within food categories and investigateonly the number of healthy and unhealthy items chosen.
14In particular, we apply the Gul and Pesendorfer (2001) formulation of self-control preferencewhich corresponds to the class of Fudenberg and Levine (2006) formulations that restrict to linearcost functions.
15The first of these assumptions is effectively what is assumed in (Gul and Pesendorfer, 2001),restricting the feelings of temptation to second period choice. This assumption is testable by compar-ing advance and immediate choices to examine the extent and direction of inconsistencies. Relatingobserved inconsistencies to food rankings provides a second basis for investigation. The second as-sumption is defensible given our design of blinding subjects to reallocation opportunities in the firstweek of the experiment.
11
sets.The interplay of temptation and commitment rankings determines immediate
choice.16 Tension between u(g, h) and v(g, h) provides the potential for dynamic incon-sistency in the sense that advance rankings and immediate choice need not coincide.Note, however, that the decisionmaker may not give in entirely to temptation andchoose (gt, ht).
Our setting is particularly amenable to the application of temptation based mod-els as we have pre-determined the initial choice set X; identify the ranking u(g, h)
from advance decisions; identify the combination of u(g, h) + v(g, h) from immediatedecisions; and identify the preference for smaller choice sets from commitment choice.There is a natural set of alternative formulations for dynamically inconsistent choicerelated to quasi-hyperbolic time preferences (Laibson, 1997; O’Donoghue and Rabin,1999b). In our setting, applying such models would require a set of assumptions forthe discounted utilities of healthy and unhealthy items and their intertemporal orga-nization of costs and benefits. This, in turn, might require additional information onstorage opportunities. In our discussion, we attempt to port the insights gained fromour study back to these models as well.
3.1 Advance Decisions
Our advance decisions provide the decisionmaker with the choice set (g, h) 2 X =
{(0, 10), (1, 9), ..., (9, 1), (10, 0)} and ask her to choose a bundle (gA, hA) for delivery oneweek later. That is, the decisionmaker is asked to choose a singleton choice set under theguise of commitment. Under our model of temptation preferences, the decisionmakerchooses according to the commitment ranking, u(g, h), such that
(gA, hA) = argmax(g,h)2Xu(g, h).
We identify (gA, hA) for each subject.
3.2 Immediate Decisions
Importantly, the advance decisions are made only under the guise of commitment. Thebundle (gA, hA) actually serves as an anchor point for the next element of the design.Upon delivery, we provide subjects with the opportunity to exchange up to four items
16In immediate choice, the decisionmaker maximizes u(g, h) + v(g, h). Gul and Pesendorfer (2001)note that maximizing this combination represents the optimal tradeoff between commitment andtemptation. We ignore the case where no tension exists, u(g, h) = v(g, h).
12
from their bundle with items in a box of 2 healthy items and 2 unhealthy items. Hence,in immediate decisions, we offer four bundles in addition to (gA, hA), generating thechoice set X
0 = {(gA, hA), (gA + 1, hA � 1), (gA + 2, hA � 2), (gA � 1, hA + 1), (gA �2, hA + 2)}. We ignore the elements of X 0 that substitute g for g and h for h, leavingunchanged the number of healthy and unhealthy items. Note that X
0 ⇢ X such thatevery bundle available in X
0 was also available and not chosen from X.17
Choice from the set X 0 is governed by the interplay of temptation and commitmentrankings. Hence,
(gI , hI) = argmax(g,h)2X0u(g, h) + v(g, h)� v(gt, ht),
where v(gt, ht) = max(g,h)2X0v(g, h). We identify (gI , hI) for each subject and identify
dynamic inconsistencies as revealed preference violations,
(gI , hI) 6= (gA, hA).
Given that immediate choice is determined by the interplay between temptationand commitment ranking, while advance choice is determined by commitment rankingalone, dynamic inconsistencies will correspond to increasing the temptation value ofthe chosen items. Different decisionmakers may find different items tempting, suchthat any deviation between (gI , hI) and (gA, hA) could be taken as evidence in supportof temptation preferences. However, a natural intuition is that unhealthy foods aretempting, such that (gI , hI) will involve greater levels of g than (gA, hA).
3.3 Commitment Demand
In the model of temptation preferences, commitment demand is exhibited as a prefer-ence for smaller choice sets. In particular, we investigate the preference for singletonchoice sets. In Week 2.5, after having made the allocation (gA, hA), subjects are askedwhether they prefer the delivery driver to bring only (gA, hA) or to deliver the setX
0 = {(gA, hA), (gA + 1, hA � 1), (gA + 2, hA � 2), (gA � 1, hA + 1), (gA � 2, hA + 2)}.We assume that this decision is made without any tempting impulses.
17The set X
0 may induce some censoring. Subjects wishing to consume a lot of g in the immediatechoices may not be able to do so as they are only offered g
A + 2. Further it may be that the itemsincluded in X
0 are not sufficiently tempting. Hence, we may be identifying a lower bound on dynamicinconsistency.
13
A subject will choose to commit if
u(gA, hA) > u(gI , hI) + v(gI , hI)� v(gt, ht),
where again v(gt, ht) = max(g,h)2X0v(g, h). Because (gA, hA) is the maximizer of u(g, h)
and the choice set X 0 always generates negative utility associated with self-control costs,this inequality will always hold. That is, if subjects suffer from temptation at all, theywill value commitment. We identify the preference for making immediate decisionsfrom the singleton choice set (gA, hA) over X 0 from each subject’s commitment choice.
Note that a subject need not succumb to temptation in order to demand commit-ment. A subject who succumbs to temptation, and hence delivers dynamic inconsis-tencies, satisfies
u(gI , hI) + v(gI , hI)� v(gt, ht) > u(gA, hA) + v(gA, hA)� v(gt, ht).
The commitment inequality above holds with or without this restriction.18
3.4 Sophistication
The temptation based models of Gul and Pesendorfer (2001); Fudenberg and Levine(2006) feature complete sophistication in the sense of O’Donoghue and Rabin (1999b).That is, the decisionmaker is fully aware of her potential to feel temptation when mak-ing immediate decisions. This sophistication leads her to exhibit an advance preferencefor commitment, preferring smaller choice sets with limited opportunity for temptation.A natural extension of these models would account for partial sophistication, whereinsubjects are not fully aware of their future temptation potential. O’Donoghue and Ra-bin (2001) provide such an extension in the domain of quasi-hyperbolic discounting byincluding an additional behavioral parameter that captures the decisionmaker’s beliefsabout her future present bias.
Following a similar path, one could accommodate partial sophistication in tempta-tion based models by endowing the advance decisionmaker with beliefs about imme-
18A subject will commit and be dynamically inconsistent if
u(gI , hI) + v(gI , hI)� v(gt, ht) < u(gA, hA) < u(gI , hI) + v(gI , hI)� v(gA, hA).
A subject who is dynamically consistent will exhibit (gA, hA) = (gI , hI) and will still satisfy thecommitment equation
u(gA, hA) + v(gA, hA)� v(gt, ht) < u(gA, hA).
14
diate choice.19 As in models of partially sophisticated quasi-hyperbolic discounting, itis the distribution of preferences and beliefs and the correlation between the two thatdetermines the pattern of results.
To date, relatively little is known about the relationship between temptation andsophistication. Ashraf et al. (2006) show a limited, but significant, correlation betweendiminishing impatience in monetary choices and take-up of a savings commitmentdevice for women. Augenblick et al. (2013) show a small, but significant correlationbetween dynamic inconsistency and commitment demand for real effort tasks. Kaur etal. (2010) document a relationship between take-up of a dominated wage contract andincreased effort close to paydays. The above studies suggest that subjects who haveself-control problems are at least partially aware of it. However, in each exercise theproportion of explained variance in commitment choice is small, indicating potentiallylimited correlation between temptation and sophistication.
4 Results
We present the results in four sub-sections. The first two sub-sections discuss advanceand immediate choices of food bundles in Weeks 1 and 2 of the experiment, documentingsubstantial evidence of dynamic inconsistency. The third sub-section provides evidenceof commitment demand and links previously measured behavior to commitment choice.Finally, the fourth sub-section provides robustness tests analyzing alternate measuresof dynamic inconsistency, incorporating elicited information of food preferences, andinvestigating stability in choice throughout the experiment.
4.1 Advance Choice
In Week 1 of the study, the 218 subjects made advance decisions for healthy andunhealthy foods. Each subject had the opportunity to choose 10 items, yielding apotential total of 2180 advance food choices. One subject chose only 7 items; thus, wehave 2177 total advance food choices in our dataset.
19For example, the decisionmaker could envisage maximizing
max(g,h)2A u(g, h) + ↵[v(g, h)� v(gt, ht)],
where the parameter ↵ 2 [0,1] captures the decisionmaker’s distorted forecast of her future tempta-tion and hence future temptation costs. If ↵ = 1, no belief distortions are present, and the subjectbehaves exactly as in Gul and Pesendorfer (2001). If ↵ 2 [0, 1), the subject believes she will be lesstempted than she truly will be. If ↵ = 0, the subject is completely naive such that she will potentiallysuccumb to temptation and find no value in commitment. If ↵ > 1, the subject believes she will bemore tempted than she truly will be.
15
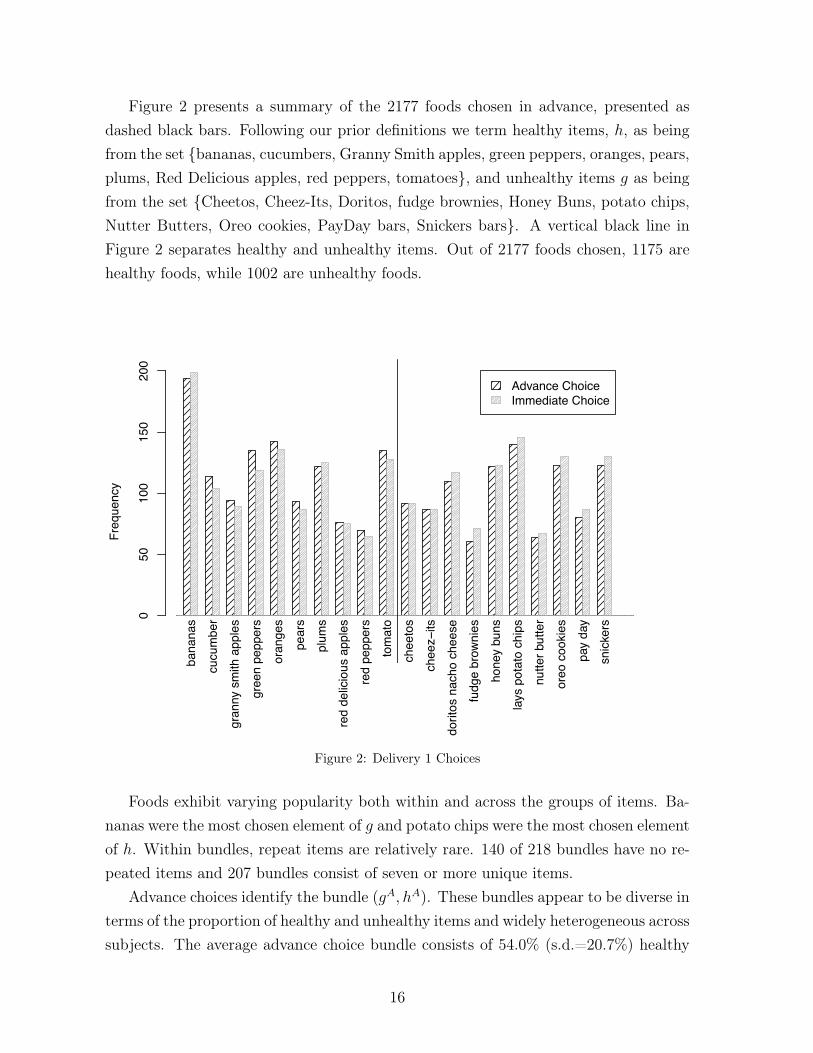
Figure 2 presents a summary of the 2177 foods chosen in advance, presented asdashed black bars. Following our prior definitions we term healthy items, h, as beingfrom the set {bananas, cucumbers, Granny Smith apples, green peppers, oranges, pears,plums, Red Delicious apples, red peppers, tomatoes}, and unhealthy items g as beingfrom the set {Cheetos, Cheez-Its, Doritos, fudge brownies, Honey Buns, potato chips,Nutter Butters, Oreo cookies, PayDay bars, Snickers bars}. A vertical black line inFigure 2 separates healthy and unhealthy items. Out of 2177 foods chosen, 1175 arehealthy foods, while 1002 are unhealthy foods.
Freq
uenc
y
050
100
150
200
bana
nas
cucu
mbe
rgr
anny
sm
ith a
pple
sgr
een
pepp
ers
oran
ges
pear
spl
ums
red
delic
ious
app
les
red
pepp
ers
tom
ato
chee
tos
chee
z−its
dorit
os n
acho
che
ese
fudg
e br
owni
esho
ney
buns
lays
pot
ato
chip
snu
tter b
utte
ror
eo c
ooki
espa
y da
ysn
icke
rs
Advance ChoiceImmediate Choice
Figure 2: Delivery 1 Choices
Foods exhibit varying popularity both within and across the groups of items. Ba-nanas were the most chosen element of g and potato chips were the most chosen elementof h. Within bundles, repeat items are relatively rare. 140 of 218 bundles have no re-peated items and 207 bundles consist of seven or more unique items.
Advance choices identify the bundle (gA, hA). These bundles appear to be diverse interms of the proportion of healthy and unhealthy items and widely heterogeneous acrosssubjects. The average advance choice bundle consists of 54.0% (s.d.=20.7%) healthy
16
Den
sity
0.00
0.05
0.10
0.15
0.20
0.25
0 0.1 0.2 0.3 0.4 0.5 0.6 0.7 0.8 0.9 1
Advance ChoiceImmediate Choice
Figure 3: Proportion of Healthy Bundle Items, h
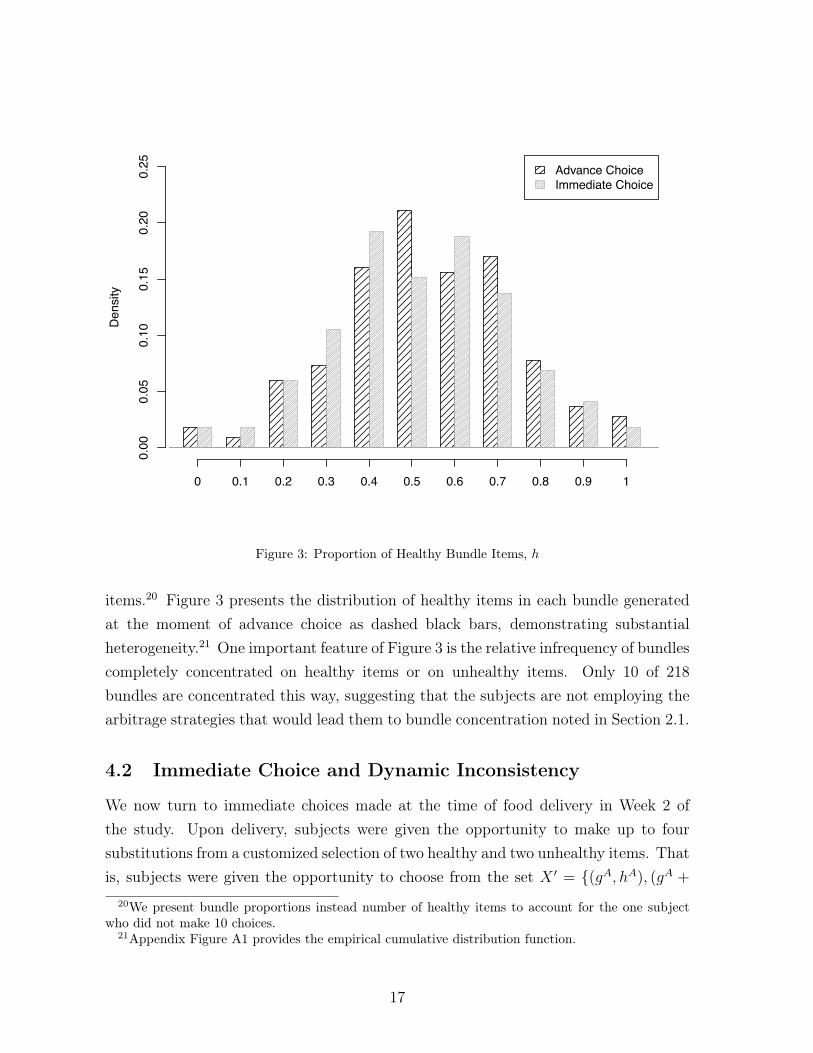
items.20 Figure 3 presents the distribution of healthy items in each bundle generatedat the moment of advance choice as dashed black bars, demonstrating substantialheterogeneity.21 One important feature of Figure 3 is the relative infrequency of bundlescompletely concentrated on healthy items or on unhealthy items. Only 10 of 218bundles are concentrated this way, suggesting that the subjects are not employing thearbitrage strategies that would lead them to bundle concentration noted in Section 2.1.
4.2 Immediate Choice and Dynamic Inconsistency
We now turn to immediate choices made at the time of food delivery in Week 2 ofthe study. Upon delivery, subjects were given the opportunity to make up to foursubstitutions from a customized selection of two healthy and two unhealthy items. Thatis, subjects were given the opportunity to choose from the set X
0 = {(gA, hA), (gA +
20We present bundle proportions instead number of healthy items to account for the one subjectwho did not make 10 choices.
21Appendix Figure A1 provides the empirical cumulative distribution function.
17
1, hA � 1), (gA + 2, hA � 2), (gA � 1, hA + 1), (gA � 2, hA + 2)}.Figure 2 reports the aggregate immediate choices made when faced with choice
set X
0 as filled gray bars. Notable from Figure 2 is substantial evidence of dynamicinconsistency with a clear direction of change. Out of 2177 foods chosen, 1127 arehealthy foods, while 1050 are unhealthy foods. That is, the number of healthy foodschosen decreases by 48, while the number of unhealthy foods chosen increases by 48.The inconsistency is observable across food items. Eight of ten healthy foods arechosen less frequently in immediate choice relative to advance choice, while eight of tenunhealthy foods are chosen more frequently. This pattern of aggregate inconsistencyis in line with the intuition that unhealthy foods have higher temptation value.
Immediate choices identify the bundle (gI , hI). These bundles continue to varysubstantially across subjects. The average immediate choice bundle consists of 51.8%(s.d.= 20.9%) healthy items. Figure 3 presents the distribution of bundle proportionsgenerated at the moment of immediate choice as filled gray bars, continuing to demon-strate substantial heterogeneity.22
We compare (gA, hA) to (gI , hI) with simple tests for paired data. Given our largesample size, even relatively small inconsistencies in choice are potentially detectable.In a paired t-test, the estimated difference in mean healthy proportions of 54.0%-51.8% = 2.2% is statistically different from zero, t = 6.55, (p < 0.01). A Wilcoxonsigned rank test also rejects the null hypothesis for equal distributions in healthy foodproportions between advance and immediate choice, z = 6.17, (p < 0.01).23 Of our218 subjects, 172 exhibit (gI , hI) = (gA, hA). Of the 46 dynamically inconsistentsubjects, 2 choose the more healthy bundle (gI , hI) = (gA � 1, hA + 1), 38 choose theless healthy bundle (gI , hI) = (gA + 1, hA � 1), and 6 choose the less healthy bundle(gI , hI) = (gA + 2, hA � 2).24
The contrast between advance and immediate bundles is compelling. On aver-age, subjects are dynamically inconsistent, preferring less healthy items when makingimmediate choices than when deciding in advance. Revealed preference violations of
22Appendix Figure A1 provides the empirical cumulative distribution function.23It should be noted that the most pronounced the dynamic inconsistency could be for each subject
would be to make two exchanges for less healthy items, yielding (gI , hI) = (gA + 2, hA � 2), subjectto censoring. This would generate a mean healthy proportion for immediate choice of 34.4% (s.d. =19.7%) and an estimated difference of 19.6%. As such, our level of observed inconsistency is about10% the total possible observable value.
24Recall that this analysis ignores any inconsistencies that leave the number of healthy and unhealthyitems unchanged. Though the majority of inconsistencies lead to different numbers of healthy andunhealthy foods, 36 of 178 subjects with (gI , hI) = (gA, hA) exchanged either h for h or g for g whenmaking their immediate choices. In section 4.4, we examine our results with alternative measures fordynamic inconsistency.
18
(gA, hA) 6= (gI , hI) are documented for roughly 21% of subjects, and 96% of violationsare towards less healthy bundles in immediate choice.
4.3 Commitment Demand
In Week 2.5, before the delivery of their items in Week 3, subjects were offered theopportunity to commit to their advance bundle (gA, hA) and not face the set X
0 =
{(gA, hA), (gA + 1, hA � 1), (gA + 2, hA � 2), (gA � 1, hA + 1), (gA � 2, hA + 2)} whenmaking their immediate choice. Seventy-three of 218 (33%) subjects preferred notto face the expanded choice set X
0 when making immediate decisions. Commitmentdemand is a critical prediction of temptation-based models, and our data show that asizable fraction of subjects are willing to restrict themselves to a singleton choice set.
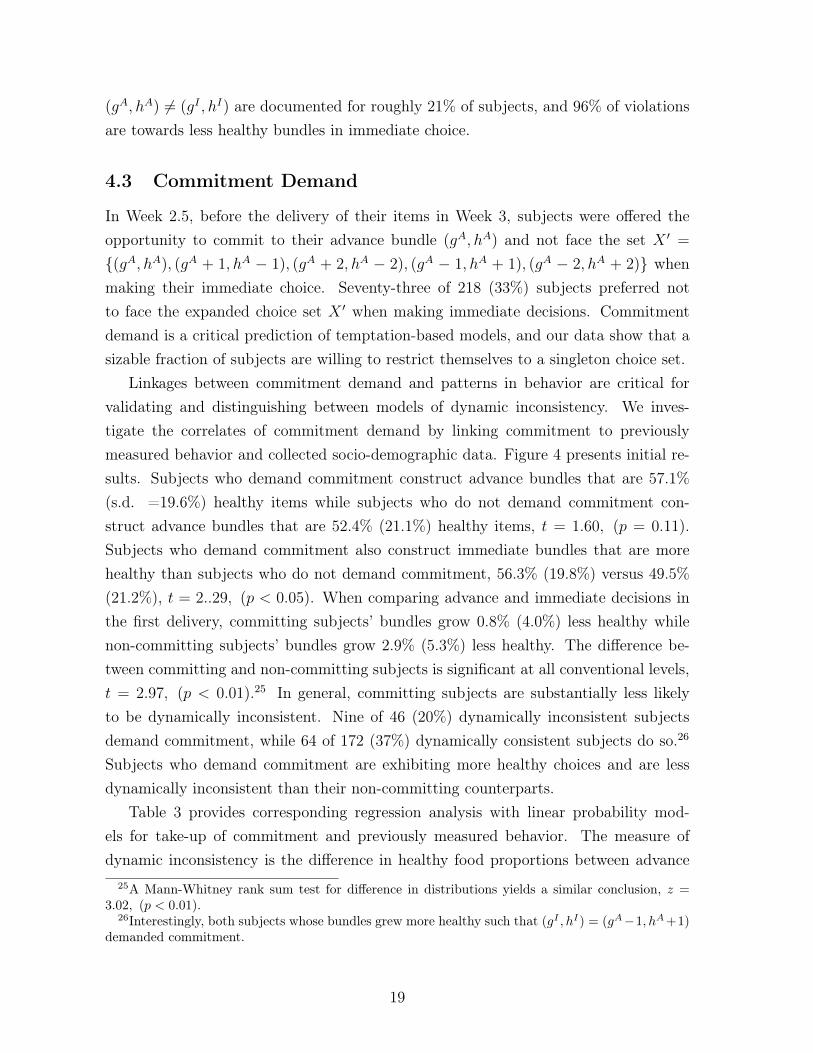
Linkages between commitment demand and patterns in behavior are critical forvalidating and distinguishing between models of dynamic inconsistency. We inves-tigate the correlates of commitment demand by linking commitment to previouslymeasured behavior and collected socio-demographic data. Figure 4 presents initial re-sults. Subjects who demand commitment construct advance bundles that are 57.1%(s.d. =19.6%) healthy items while subjects who do not demand commitment con-struct advance bundles that are 52.4% (21.1%) healthy items, t = 1.60, (p = 0.11).Subjects who demand commitment also construct immediate bundles that are morehealthy than subjects who do not demand commitment, 56.3% (19.8%) versus 49.5%(21.2%), t = 2..29, (p < 0.05). When comparing advance and immediate decisions inthe first delivery, committing subjects’ bundles grow 0.8% (4.0%) less healthy whilenon-committing subjects’ bundles grow 2.9% (5.3%) less healthy. The difference be-tween committing and non-committing subjects is significant at all conventional levels,t = 2.97, (p < 0.01).25 In general, committing subjects are substantially less likelyto be dynamically inconsistent. Nine of 46 (20%) dynamically inconsistent subjectsdemand commitment, while 64 of 172 (37%) dynamically consistent subjects do so.26
Subjects who demand commitment are exhibiting more healthy choices and are lessdynamically inconsistent than their non-committing counterparts.
Table 3 provides corresponding regression analysis with linear probability mod-els for take-up of commitment and previously measured behavior. The measure ofdynamic inconsistency is the difference in healthy food proportions between advance
25A Mann-Whitney rank sum test for difference in distributions yields a similar conclusion, z =3.02, (p < 0.01).
26Interestingly, both subjects whose bundles grew more healthy such that (gI , hI) = (gA�1, hA+1)demanded commitment.
19

Prop
ortio
n H
ealth
y
0.40
0.45
0.50
0.55
0.60
Commit=0 Commit=1
Advance ChoiceImmediate Choice
Figure 4: Delivery 1 Choice and Commitment Demand
and immediate bundles, (Advance - Immediate) Proportion Healthy. The measure ofhealthiness in advance choice is the proportion of healthy foods, Advance ProportionHealthy. In columns (1) through (3), we document that dynamic inconsistency andless healthy advance decisions are significantly correlated with lower take-up of com-mitment. A difference of 10%-age points in the proportion of healthy foods betweenadvance and immediate choice is associated with around a 19%-age point decrease inthe probability of commitment. In columns (4) and (5), we restrict attention to a sub-sample of 192 subjects for whom we have complete socio-demographic information.Socio-demographics seem virtually uncorrelated with commitment choice in our sam-ple. Importantly, across specifications we find very limited predictive power in totalfor commitment. Including all observable characteristics and prior behavior in column(5), we explain only around 6% of the variation in commitment choice.
20
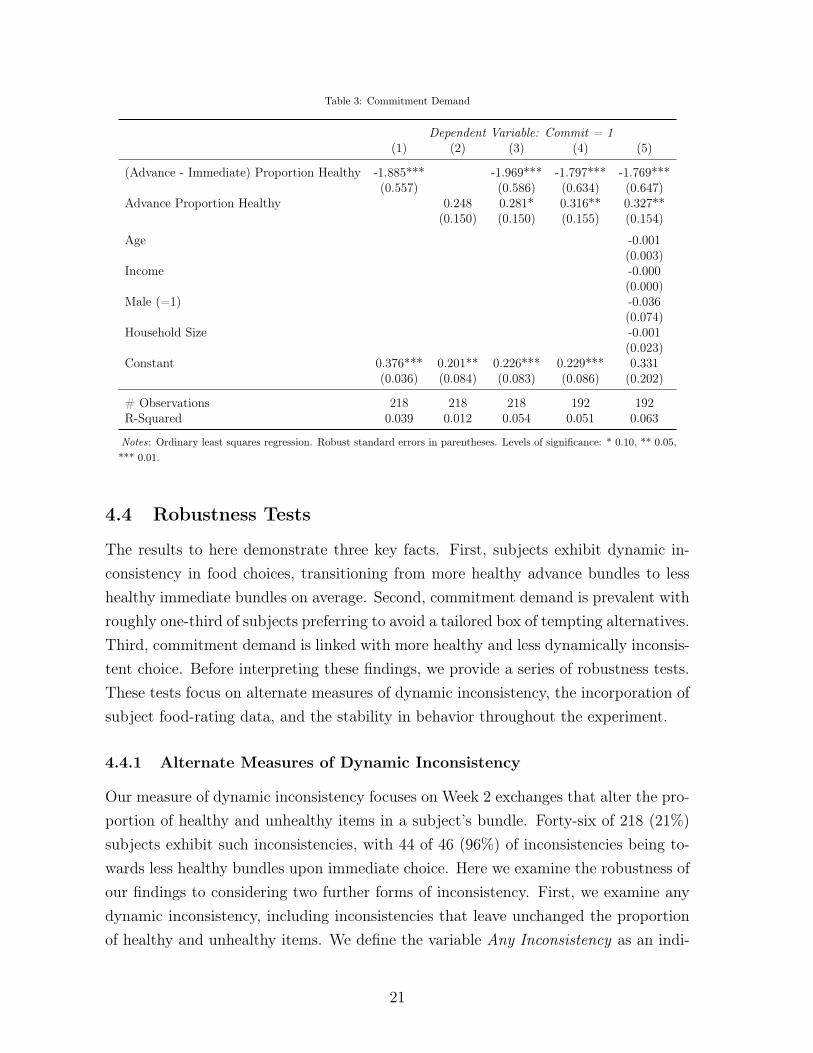
Table 3: Commitment Demand
Dependent Variable: Commit = 1(1) (2) (3) (4) (5)
(Advance - Immediate) Proportion Healthy -1.885*** -1.969*** -1.797*** -1.769***(0.557) (0.586) (0.634) (0.647)
Advance Proportion Healthy 0.248 0.281* 0.316** 0.327**(0.150) (0.150) (0.155) (0.154)
Age -0.001(0.003)
Income -0.000(0.000)
Male (=1) -0.036(0.074)
Household Size -0.001(0.023)
Constant 0.376*** 0.201** 0.226*** 0.229*** 0.331(0.036) (0.084) (0.083) (0.086) (0.202)
# Observations 218 218 218 192 192R-Squared 0.039 0.012 0.054 0.051 0.063
Notes: Ordinary least squares regression. Robust standard errors in parentheses. Levels of significance: * 0.10, ** 0.05,*** 0.01.
4.4 Robustness Tests
The results to here demonstrate three key facts. First, subjects exhibit dynamic in-consistency in food choices, transitioning from more healthy advance bundles to lesshealthy immediate bundles on average. Second, commitment demand is prevalent withroughly one-third of subjects preferring to avoid a tailored box of tempting alternatives.Third, commitment demand is linked with more healthy and less dynamically inconsis-tent choice. Before interpreting these findings, we provide a series of robustness tests.These tests focus on alternate measures of dynamic inconsistency, the incorporation ofsubject food-rating data, and the stability in behavior throughout the experiment.
4.4.1 Alternate Measures of Dynamic Inconsistency
Our measure of dynamic inconsistency focuses on Week 2 exchanges that alter the pro-portion of healthy and unhealthy items in a subject’s bundle. Forty-six of 218 (21%)subjects exhibit such inconsistencies, with 44 of 46 (96%) of inconsistencies being to-wards less healthy bundles upon immediate choice. Here we examine the robustness ofour findings to considering two further forms of inconsistency. First, we examine anydynamic inconsistency, including inconsistencies that leave unchanged the proportionof healthy and unhealthy items. We define the variable Any Inconsistency as an indi-
21
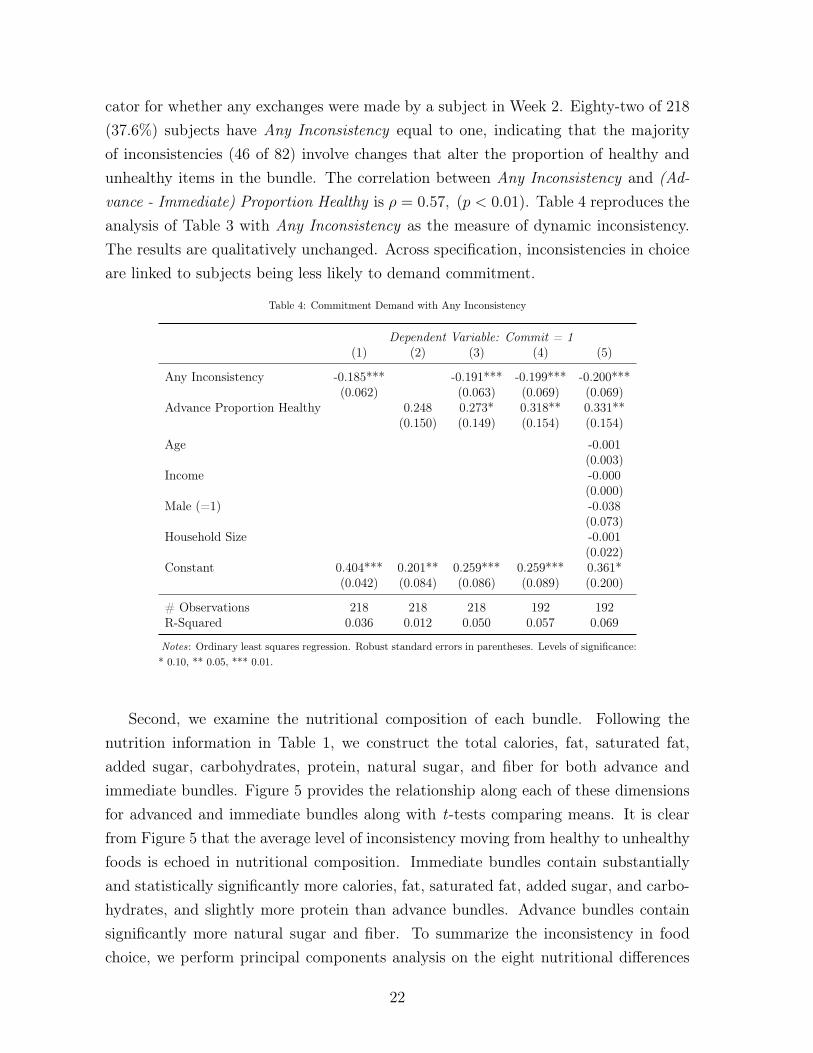
cator for whether any exchanges were made by a subject in Week 2. Eighty-two of 218(37.6%) subjects have Any Inconsistency equal to one, indicating that the majorityof inconsistencies (46 of 82) involve changes that alter the proportion of healthy andunhealthy items in the bundle. The correlation between Any Inconsistency and (Ad-vance - Immediate) Proportion Healthy is ⇢ = 0.57, (p < 0.01). Table 4 reproduces theanalysis of Table 3 with Any Inconsistency as the measure of dynamic inconsistency.The results are qualitatively unchanged. Across specification, inconsistencies in choiceare linked to subjects being less likely to demand commitment.
Table 4: Commitment Demand with Any Inconsistency
Dependent Variable: Commit = 1(1) (2) (3) (4) (5)
Any Inconsistency -0.185*** -0.191*** -0.199*** -0.200***(0.062) (0.063) (0.069) (0.069)
Advance Proportion Healthy 0.248 0.273* 0.318** 0.331**(0.150) (0.149) (0.154) (0.154)
Age -0.001(0.003)
Income -0.000(0.000)
Male (=1) -0.038(0.073)
Household Size -0.001(0.022)
Constant 0.404*** 0.201** 0.259*** 0.259*** 0.361*(0.042) (0.084) (0.086) (0.089) (0.200)
# Observations 218 218 218 192 192R-Squared 0.036 0.012 0.050 0.057 0.069
Notes: Ordinary least squares regression. Robust standard errors in parentheses. Levels of significance:* 0.10, ** 0.05, *** 0.01.
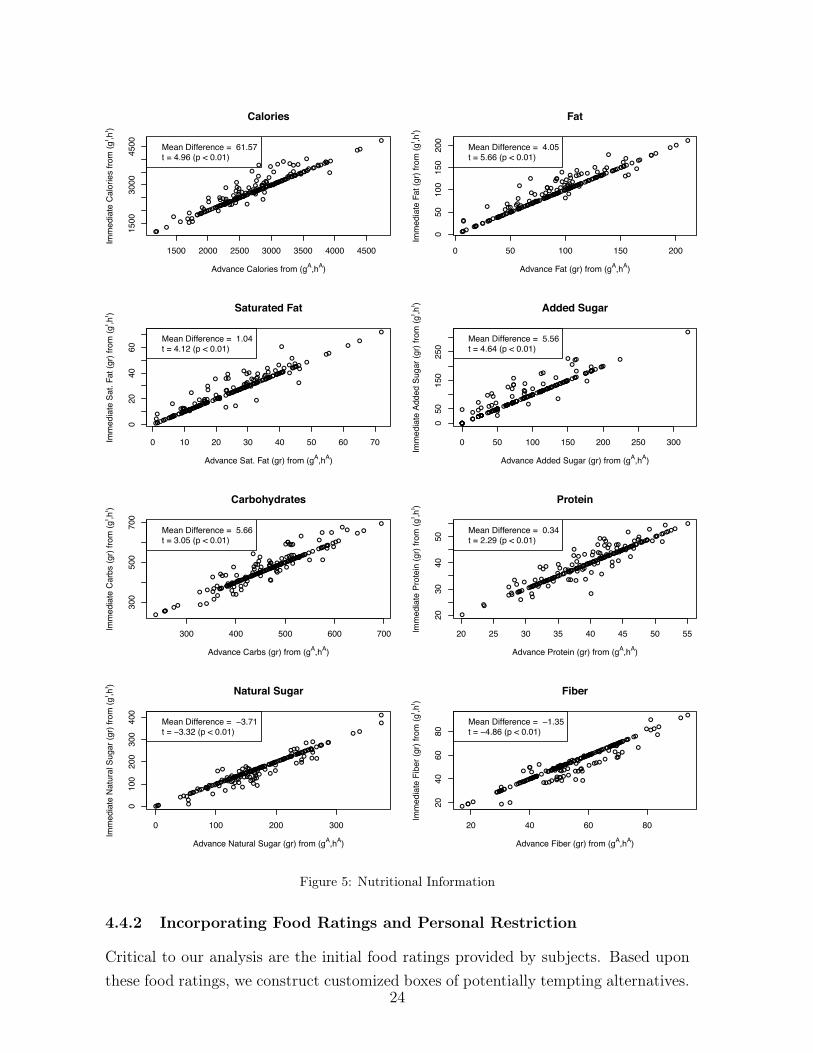
Second, we examine the nutritional composition of each bundle. Following thenutrition information in Table 1, we construct the total calories, fat, saturated fat,added sugar, carbohydrates, protein, natural sugar, and fiber for both advance andimmediate bundles. Figure 5 provides the relationship along each of these dimensionsfor advanced and immediate bundles along with t-tests comparing means. It is clearfrom Figure 5 that the average level of inconsistency moving from healthy to unhealthyfoods is echoed in nutritional composition. Immediate bundles contain substantiallyand statistically significantly more calories, fat, saturated fat, added sugar, and carbo-hydrates, and slightly more protein than advance bundles. Advance bundles containsignificantly more natural sugar and fiber. To summarize the inconsistency in foodchoice, we perform principal components analysis on the eight nutritional differences
22

contained in Figure 5. We extract the first principal component as a Food ConsistencyFactor.27 The Food Consistency Factor provides a summary for the consistency inchoice at the nutritional level. The correlation between the Food Consistency Factorand (Advance - Immediate) Proportion Healthy is ⇢ = �0.76, (p < 0.01), indicatingthat subjects with higher food consistency factors exhibit fewer dynamic inconsisten-cies from healthy to unhealthy items.28 Table 5 re-conducts the analysis of Table 3with Food Consistency Factor as the measure of dynamic inconsistency. The results arequalitatively unchanged. Across specification, inconsistencies in nutrition are linked tosubjects being less likely to demand commitment.
Table 5: Commitment Demand with Principal Component of Food Inconsistency
Dependent Variable: Commit = 1(1) (2) (3) (4) (5)
Food Consistency Factor 0.071** 0.073** 0.073** 0.071**(0.030) (0.031) (0.033) (0.032)
Advance Proportion Healthy 0.248 0.259* 0.301* 0.317**(0.150) (0.151) (0.156) (0.155)
Age -0.001(0.003)
Income -0.000(0.000)
Male (=1) -0.025(0.074)
Household Size -0.000(0.023)
Constant 0.336*** 0.201** 0.196** 0.199** 0.309(0.032) (0.084) (0.085) (0.088) (0.202)
# Observations 218 218 218 192 192R-Squared 0.023 0.012 0.036 0.042 0.053
Notes: Ordinary least squares regression. Robust standard errors in parentheses. Levels ofsignificance: * 0.10, ** 0.05, *** 0.01.
Taken together, these results demonstrate robustness of our central findings toalternate measures of dynamic inconsistency.
27The first principal component has an eigenvalue of 4.65 and explains 58.2% of the variance in theeight nutritional differences. One more factor had an eigenvalue in excess of 1, 2.03, and explainedan additional 25% of the variance. In unreported results, this second factor was observed to providelimited additional explanatory power in the specifications of Table 5. The Food Consistency Factoris positively correlated with (i.e., loads positively on) the difference in calories, fat, saturated fat,carbohydrates, added sugar and protein between advance and immediate choice; and is negativelycorrelated with (i.e., loads negatively on the difference in natural sugar and fiber).
28The correlation between the Food Consistency Factor and Any Inconsistency is ⇢ = �0.48, (p <
0.01).
23
● ●●
●
●●
●●●
●
●
●
●
●
●
●●
●
●
●
●●
●●
●
●
●
●
●
●● ●
● ●
●●●
●●
●
●
●
●●●●
●
●
●
●
●
●
●
●
●
●
●
●
●
●
●
●
●
●●
●
●
●●
●●
●
●●
●●
●
●
●
●
●
●
●
●
●● ●
●
●
●
●
●
●
●
●
●
●
●
●
●
●
●
●●
●
●
●
●
●
●
●●
●●
●
●
●
●
●
●
●
●
●●
●
●
●
●●●
●
●
●
●
●●
●
● ●
●
●● ●
●
●
●●
●●
●
●●
●
●
●
●
●
● ●
●
●
●
●
●
●
● ●
●●
●
●
● ●
●
●●●
●
●
●
●●●
●
●
●
●●
●
●
●
●
●
●
●
●
●●
●
●●
●
●
●
●
●
●
●●
●
●
●●
●●
●●
●
1500 2000 2500 3000 3500 4000 4500
1500
3000
4500
Calories
Advance Calories from (gA,hA)
Imm
edia
te C
alor
ies
from
(gI ,h
I )
Mean Difference = 61.57t = 4.96 (p < 0.01)
●
●
●
●
●
●
●
●
●
●
●
●
●
●
●
●
●
●
●
●
●
●
●
●
●
●●
●
●
●●
●● ●●
●
●●
●
●
●●
●●
●
●
●
●
●
●●
●
●
●
●
●
●
●
●
●
●●
●
●●●
●
●●
●
●
●
●
●
●●
●
●
●
●
●●●
●
●
●
●●
●
●
●
●
●
●
●
●
●
●
●
●
●
●
●
●●
●
●
●
●
●
●●
●●
●
●●
●
●
●
●●
●
●
●
●
●
●
●
●
●
●
●
●
●●
●
●
●
●
●●●
●
●
●
●●
●
●
●
●
●
●
●
●
●
●
●
●
●
●●
●
●
●●
●●
●
●●
●
●
●
●
●
●
●
●●
●
●
●
●●
●
●
●
●
●
●
●
●●
●
●
●
●
●●
●
●
●●
●
●
●
●●
●
●
●
●
●
●
●
●
0 50 100 150 200
050
100
150
200
Fat
Advance Fat (gr) from (gA,hA)
Imm
edia
te F
at (g
r) fro
m (g
I ,hI )
Mean Difference = 4.05t = 5.66 (p < 0.01)
●
●
●
●
●
●
●
●
●
●
●
●
●
●
●
●
●
●
●
●
●●
●●
●
●●
●
●
●●
●
●●
●
●
●
●
●●
●●
●●
●
●
●
●
●
●
●
●
●
●●
●
●
●
●
●
●
●
●
●
●
●
●
●●
●
●
●
●
●
●●
●
●
●
●
●
●
●
●
●●
●
●
●●
●
●
●
●
●
●
●●
●
●
●
●●
●
●
●
●
●
●
●
●●
●●
●
●●
●
●
●
●
●
●●
●
●
●
●
●
●
●●
●●
●●
●
●
●●●
●●● ●
●
● ●●
●
●
●
●
●
●
●
●
●
●
●
●
●
●●
●
●●
●
●●
●
●
●
●
●●
●●
●
●●●
●
●
●
●
●
●
●
●
●
●
●
●●
●
● ●
●
●
●●
●
●
●
●
●
●
●
●
●●
●
●
●
●
●●
0 10 20 30 40 50 60 70
020
4060
Saturated Fat
Advance Sat. Fat (gr) from (gA,hA)
Imm
edia
te S
at. F
at (g
r) fro
m (g
I ,hI )
Mean Difference = 1.04t = 4.12 (p < 0.01)
●
●
●●
●●
●●
●
●
●
●
●
●
●
●
●
●
●
●
●
●
●
●
●
●
●
●
●
●● ●
●
●●
●●
●
●
●
●
●
●
●
●
●●
●
●
●
●
●
●
●
●
●
●
●
●
●
●
●
●
●●
●
●
●
●
●●
●
●
●
●●
●
●
●
●
●●
●
●●●
●●
●
●●
●
●
●
●
●
●
●
●
●
●
●●
●●
●
●●
●
●
●●
●●
●
●●
●●
●
●
●
●
●
●
●●
●
●
●
●●
●●
●
●
●
●●● ●
●●●
●
●
●
●●
●
●●
●
●
●
●
●
●
●
●
●
●
●
●
●
●
●●
● ●
●
●
●
●
●
●●
●
●
●
●
●
●
●
●
●
●●
●
●
●
●
●
●●
●
●
●
●
●●●
●
●●
●
●●
●
●
●
●
●●
● ●
●
●
0 50 100 150 200 250 3000
5015
025
0
Added Sugar
Advance Added Sugar (gr) from (gA,hA)
Imm
edia
te A
dded
Sug
ar (g
r) fro
m (g
I ,hI )
Mean Difference = 5.56t = 4.64 (p < 0.01)
●
●
●
●
●●
●
●
●
●
●●
●
●
●
●
●
●
●
●
●
●
● ●
●
●
●
●
●●●
●
● ●
●
●
●
●
●
●
●
●
●●
●
●●
● ●
●
●
●
●
●●
●
●● ●
●
●
●
●
●
●
●●
●●
●
●
● ●
●
●
●
●
●
●
●
●
●
●
●●
●
●
●
●
●●
●
●
●●
●
●
●
●
●
●
●●●
●●
●
●
●
●
●
●●●
●
●
●
●
●
●
●
●
●●
●
●
●●
●●
●●
●
●
●●
●
●
●●
●● ●
●
●
●●
●
●
●
●
●●
●
●
●
●
●
●
●
●
●
●●
●
●●
●
●●
●
●
●
●
●
●
●●● ●
●
●
●
●
●
●
●
●
●
● ●
●●
●
●
●
●
●
●
●
●
●
●●
●
●●
●
●
●●
●
●
●
●●
●●
300 400 500 600 700
300
500
700
Carbohydrates
Advance Carbs (gr) from (gA,hA)
Imm
edia
te C
arbs
(gr)
from
(gI ,h
I )
Mean Difference = 5.66t = 3.05 (p < 0.01)
●
●
●
●
●
●
●
●
●●
●●
●
●
●
●●
●
●
●
●
●
●
●●
●●
●
●
●
●
●●
●
●
●●
●
●
●
●
●
●
●●●
●
●
●●
●
●
●
●
●
●
●
●
●
●
●
●
●
●
●
●
●
●●●
●
●
●●●
●
●
●
●●
●
●
●
●●●
●● ●
●●
●
●
●
●
●
● ●
●●
●
●●
●●
●
●
●
●
●
●
●
●
●
●●
●
●
●
●
●
●●
●
●
●
●●
●
●
●
●
●
●
●
●●
●
●
●
●
●●
● ●●
●
●
●
●●
●
●
●
●
●
●
●●
●●●
●
●
●
●●
●
●●
●
●
●
●●
●
●●
●
●
●
●
●
●
●
●
●
●●●
●
●
●
●●
●●
●
●
●
●
●
●
●
●●
●
●
●●
●
●
●●
●● ●
●
20 25 30 35 40 45 50 55
2030
4050
Protein
Advance Protein (gr) from (gA,hA)
Imm
edia
te P
rote
in (g
r) fro
m (g
I ,hI )
Mean Difference = 0.34t = 2.29 (p < 0.01)
●
●
●●
●
●
●
●
●
●
●
●
●
●
●●
●
●
●
●
●
●●
●
●
●
● ●●
●●
●
●●
●
●
●●●
●●
●
●
●
●
●
●
●
●●
● ●●
●
●
●●
●
●
●
●
●
●
●
●
●●
●●
●
●●
●
●
●
●●
●●
●
●
●
●
●●
●
●
●
●
●
●
●●
●●
●
●●
●
●●
●●
●
●
●
●
●
●
●●
●
●●
●●
●
●
●
●
●●
●●
●
●
●●
●
●●
●
●
●●
●
●
●
●
●
●
●●●
●
●
●
●
●●
●
●
●●
●
●
●●
●
●
● ●●
●
●
●●
●
●●
●
●
●
●
●
●
●
●
●
●● ●
●●●
●
●
●
●
●
●●
●
●
●
●●
●
●
●
● ● ●
●●
●
●●
●
●
●●
●
●
●●
●
●
0 100 200 300
010
020
030
040
0
Natural Sugar
Advance Natural Sugar (gr) from (gA,hA)
Imm
edia
te N
atur
al S
ugar
(gr)
from
(gI ,h
I )
Mean Difference = −3.71t = −3.32 (p < 0.01)
●
●
●●
●
●
●
●
●
●
●
●
●
●
●
●
●
●
●
●
●
●●●
●
●
●●●
●●
●
●
●
●
●
●●●
●
●
●
●
●
●
●
●●
●
●
●
●
●
●
●
●
●
●
●
●
●
●
●
●●●●
●●●
●●
●
●
●
●
●
●●
●
●
●
●
●
●
●
●
●
●
●
●
●
●
●
●
●
●●
●
●
●
●
●●
●
●
●
●
●
●●
●
●●
●●
●
●●
●●
●
●●
●
●
●
●
●
●●
●
●
●
●
●
●
●
●●
●
●
●●
●
●
●
●
●●
●
●
●
●
●
●
●
●
●
●● ●
●●
● ●●
●●
●
●
●
●●●
●
●●●
●
● ●
●●
●●
●
●
●
●
●
●
●
●
●
●●
●
●
●
● ●●
●
●
●
●
●
●
●
●●
●
●
●
●
●●
20 40 60 80
2040
6080
Fiber
Advance Fiber (gr) from (gA,hA)
Imm
edia
te F
iber
(gr)
from
(gI ,h
I )
Mean Difference = −1.35t = −4.86 (p < 0.01)
Figure 5: Nutritional Information
4.4.2 Incorporating Food Ratings and Personal Restriction
Critical to our analysis are the initial food ratings provided by subjects. Based uponthese food ratings, we construct customized boxes of potentially tempting alternatives.
24

Two issues are potentially relevant. First, subjects may make relatively few ratings,limiting our ability to ensure that the additional items are indeed tempting. Second,subjects may rate many of the goods in their initial bundle highly, such that they arepotentially unlikely to be tempted by the provided alternatives.
Table 6 reproduces the analysis of Table 3, column(3) with several sample restric-tions. In column (1), we reproduce Table 3, column(3), while in column (2) we restrictthe sample to those subjects who make 15 or more food ratings. The results arevirtually unchanged when restricting the sample to those subjects for whom we candetermine what foods they may or may not actually find tempting. In column (3),we make an additional sample restriction. We examine subjects whose initial bundlescontain less than 90% maximally rated items (the sample median for the subjects whomake 15 or more food ratings). Though less precise, we again find a qualitatively sim-ilar pattern of results. Importantly, in these two restricted samples we find that theproportion of dynamically inconsistent subjects and proportion of committing subjectsis virtually unchanged when compared to the full sample. Across sample restrictions,we find consistent results: subjects exhibit dynamic inconsistency and commitmentand a significant negative correlation between the two.
Table 6: Incorporating Ratings Data
Dependent Variable: Commit = 1(1) (2) (3) (4) (5) (6)
Full Sample � 15 Ratings � 15 Ratings Full Sample � 15 Ratings � 15 Ratings& < 0.9 Max & < 0.9 Max
(Advance - Immediate) Proportion Healthy -1.969*** -2.045*** -1.707* -2.026*** -2.169*** -1.988**(0.586) (0.644) (0.934) (0.573) (0.617) (0.934)
Advance Proportion Healthy 0.281* 0.299* 0.286 0.272* 0.270* 0.306(0.150) (0.158) (0.291) (0.146) (0.153) (0.280)
Advance Ratings Max Proportion -0.192* -0.252** -0.442**(0.102) (0.119) (0.222)
Constant 0.226*** 0.216** 0.248 0.369*** 0.424*** 0.472**(0.083) (0.086) (0.166) (0.116) (0.135) (0.199)
Proportion Dynamically Inconsistent 0.21 0.22 0.23 0.21 0.22 0.23Proportion Committing 0.33 0.33 0.37 0.33 0.33 0.37# Observations 218 191 93 218 191 93R-Squared 0.054 0.059 0.044 0.070 0.082 0.085
Notes: Ordinary least squares regression. Robust standard errors in parentheses. Levels of significance: * 0.10, ** 0.05, *** 0.01.
The food ratings data also provide for additional analyses. One clear possibility isthat subjects who are dynamically consistent have already chosen their favorite foods.Providing them with additional items provides no benefit and, given some small costsof making the choice, they opt to commit to avoid having to choose from the additionalitems again. Columns (4) through (6) of Table 6 examines this possibility by includingas a regressor the proportion of advance bundle items that are maximally rated. An
25
interesting correlation is observed across specifications. Subjects who demand com-mitment construct advance bundles that contain fewer maximally rated items. Hence,subjects who demand commitment are not necessarily already satisfied with their initialbundles.29
An additional implication of Table 6 columns (4) through (6) is that subjects whodemand commitment may have already been seeking to restrict themselves. Becausebundles can contain repeated items, not choosing all maximally rated items is tan-tamount to self-restriction. That is, it entails choosing less preferred items. Thisself-restriction correlates significantly with commitment demand across specifications.This correlation is important as it shows that subjects who restrict themselves to thesingleton of their advance choice in Week 3 were potentially exercising self-control whenmaking advance choices in Week 1.
4.4.3 Stability of Choice
The observed dynamic inconsistency is identified from comparing the bundle (gA, hA)
constructed in Week 1 to the bundle (gI , hI) constructed in Week 2. In additionto temptation preferences, inconsistencies in choice could have a number of alternatesources, including random utility shocks and the resolution of uncertainty betweenWeek 1 and Week 2. Here we investigate two dimensions of stability that may speakto the empirical relevance of these sources for inconsistency.
First, we examine the correlations in choice at the subject level for advance bundles.The proportion of healthy foods in Week 1 advance bundles and in Week 2 advancebundles correlates highly, ⇢ = 0.66, (p < 0.01). Interestingly, for subjects who aredynamically inconsistent, the correlation is substantially lower, ⇢ = 0.37, (p < 0.05).30
This low correlation is driven almost entirely by the 9 of 46 inconsistent subjectswho choose to commit. For dynamically inconsistent, non-committing subjects thecorrelation is ⇢ = 0.54, (p < 0.01) while for dynamically inconsistent, committingsubjects the correlation is ⇢ = �0.09, (p = 0.81).31 This result indicates that dynamicinconsistency may be driven by shocks, as inconsistent subjects construct quite differentadvance bundles in Week 2 than they constructed in Week 1. However, if shocks playeda large role in generating choice, one would not expect the greatest inconsistencies in
29Further, the correlation between the proportion of maximally rated items and (Advance - Im-mediate) Proportion Healthy is quite limited, ⇢ = �0.05, (p = 0.46). Hence, the coefficients for thechange in health proportions in columns (4) through (6) of Table 6 look similar to those of columns(1) through (3).
30For subjects with Any Inconsistency the correlation is ⇢ = 0.61, (p < 0.01).31For dynamically consistent non-committing subjects, the correlation is ⇢ = 0.73, (p < 0.01) while
for dynamically consistent, committing subjects the correlation is ⇢ = 0.73, (p < 0.01).
26
choice to come from those who choose to restrict themselves via commitment.Second, we examine the stability of dynamic inconsistency for subjects who choose
not to commit. Non-committing subjects construct advance bundles in Week 2 thatare 49.2% (21.0%) healthy items and construct immediate bundles in Week 3 that are46.3% (21.9%) healthy items. In a paired t-test, the average estimated difference inmean healthy proportions of 49.0%-46.1% = 2.9% is statistically different from zero,t = 5.70, (p < 0.01). A Wilcoxon signed rank test also rejects the null hypothesis forequal distributions in healthy food proportions between advance and immediate choicez = 5.31 (p < 0.01). Thirty-nine of 145 non-committing subjects are dynamicallyinconsistent between Weeks 2 and 3 of the study, which compares favorably to the37 of 145 non-committing subjects who are dynamically inconsistent between Weeks1 and 2. Absent commitment, dynamically inconsistent subjects remain dynamicallyinconsistent on average. At the subject level, regularities are also observed. Thoughthe correlation in (Advance - Immediate) Proportion Healthy falls outside of the rangeof significance, ⇢ = 0.13, (p = 0.13), the correlation in exhibiting Any Inconsistency issignificant, ⇢ = 0.30, (p < 0.01).32 Taken together, these results indicate that subjectswho do not commit are dynamically inconsistent on average in the second round of thestudy, and that there is potential stability in succumbing to temptation at the subjectlevel over time.
5 Discussion and Conclusion
We provide field experimental evidence on dynamic inconsistency and commitment de-mand in food choice. Taken together, our findings show that dynamic inconsistenciesare prevalent, with 20% of subjects altering their proportion of healthy foods cho-sen between advance and immediate bundles, and roughly 40% of subjects exhibitingany inconsistency in choice. The direction of inconsistency is generally towards lesshealthy bundles in immediate choice. Around one-third of subjects demand a bindingcommitment device, restricting themselves to their advance choice.
Subjects who demand commitment are more likely to be dynamically consistentwhen compared to non-committing subjects. Hence, it is subjects who overcome temp-tation, rather than those who succumb to it, that demand commitment. Investigationof food rating data demonstrate that these committing subjects appear to be restrict-ing themselves in their advance choices, choosing their most preferred items relatively
32Additionally a Pearson’s Chi-Squared test for independence in Any Inconsistency comparing thetwo rounds is rejected, �2(1) = 12.72, p < 0.01 and a Fisher’s exact test also rejects independence(p < 0.01).
27
less frequently. Hence, it is disproportionately subjects who exhibit self-control intheir advance choices that take advantage of the binding restriction provided by ourcommitment device.
We analyze our results through the lens of temptation models such as Gul andPesendorfer (2001) and Fudenberg and Levine (2006). The results are consistent withtwo central implications of these models: first, the existence of dynamic inconsistencies,borne out of the tension between advance and immediate preferences; and second, thepreference for smaller choice sets achieved through binding commitment. These twocentral results are also consistent with alternative models such as quasi-hyperbolicdiscounting (Laibson, 1997; O’Donoghue and Rabin, 1999a, 2001), which also predictboth dynamic inconsistency and commitment demand.33
Though the models referenced predict dynamic inconsistencies and commitmentdemand, they are differentiated by the relationship between the two. In Gul and Pe-sendorfer (2001) and Fudenberg and Levine (2006), decisionmakers always value com-mitment, yielding zero correlation between the extent of inconsistency and the extentof commitment demand. Under the perfectly sophisticated model of O’Donoghue andRabin (2001), all dynamically inconsistent individuals demand commitment, while alldynamically consistent individuals do not, yielding a positive correlation between theextent of inconsistency and the extent of commitment demand. Under partial sophis-tication, the correlation depends upon the relationship between beliefs about dynamicinconsistency and the inconsistency itself. In all prior empirical exercises, it appearsthat more dynamically inconsistent individuals are weakly more aware of their incon-sistency, yielding the observed positive correlation between the extent of inconsistencyand the extent of commitment demand (Ashraf et al., 2006; Augenblick et al., 2013;Kaur et al., 2010). Our result is in contrast to these findings. It appears that moredynamically inconsistent individuals are less likely to be aware of their inconsistency.It should be noted that across exercises, much of the variance in commitment choiceremains unexplained. In our study, the proportion of explained variance is around sixpercent, similar to that of Augenblick et al. (2013).34 Ultimately, the relationship be-tween temptation and sophistication deserves substantial attention in future research.Empirical data in this vein will add value in distinguishing between models of dynamicinconsistency and pointing the way towards new extensions. Though it is beyond thescope of this paper to articulate such extensions, one is sketched briefly in footnote 19.
33We focus primarily on the temptation models, wherein all model elements are directly observableto the researcher, to remain agnostic on timing issues.
34Augenblick et al. (2013) also note that many dynamically consistent individuals demand commit-ment in their study, potentially indicative of some misspecification of their estimated model.
28
Our results also give insights to innovations in food policy. Advance bundles inour experiment are arguably healthier along a variety of nutritional dimensions. Asimple, and perhaps effective, policy for altering food choices in this direction would bemandated advance choice. Such a policy may even be implementable at scale given theexistence of government transfer programs targeted towards nutrition. The findings inour low-income urban study population are particularly valuable as they are likely ex-ternally valid for low-income populations of interest. At the least, policy-makers shouldconsider allowing individuals enrolled in nutrition assistance programs to make advancedecisions by allowing pre-payment for foods in grocery stores or as part of communitysupported agriculture (CSA) programs. The Supplemental Nutrition Assistance Pro-gram (SNAP) already allows pre-payment of up to 14 days, yet this option is notwidely advertised. Our findings also indicate the potential promise of policies relatedto the provision of commitment devices for changing observable nutrition outcomes.Our committing individuals make healthier and less inconsistent choices without com-mitment. Given the stability in choice, commitment likely did not alter substantiallythe patterns of consumption in our sample. Hence, even with substantial commitmentdemand, a policy providing commitment devices may not alter much the healthinessof consumed foods.
Our findings of dynamic inconsistency relate to an exciting body of research inves-tigating temptation models outside of the standard experimental domain of time-datedmonetary choices. Relatively little experimental work has investigated dynamic incon-sistencies between advance and immediate choice, and even less has investigated suchbehaviors in the field. Further research investigating temptation models in field set-tings is necessary to more deeply understand the relevance of the behavioral insightsfor a broad spectrum of behavior.
29
References
Ainslie, George and Varda Haendel, “The Motives of the Will,” in E. Gottheil, K. Durley,T. Skodola, and H. Waxman, eds., Etiologic Aspects of Alcohol and Drug Abuse, CharlesC. Thomas, 1983.
Andreoni, James and Charles Sprenger, “Estimating Time Preferences with ConvexBudgets,” American Economic Review, 2012, 102 (7), 3333–3356.
Ashraf, Nava, Dean Karlan, and Wesley Yin, “Tying Odysseus to the Mast: Evidencefrom a Commitment Savings Product in the Philippines,” Quarterly Journal of Economics,2006, 121 (1), 635–672.
Augenblick, Ned, Muriel Niederle, and Charles Sprenger, “Working over time: Dy-namic inconsistency in real effort tasks,” Technical Report, National Bureau of EconomicResearch 2013.
Brown, Alexander L, Zhikang Eric Chua, and Colin F Camerer, “Learning andvisceral temptation in dynamic saving experiments,” Quarterly Journal of Economics, 2009,124 (1), 197–231.
Chabris, Christopher F., David Laibson, and Jonathon P. Schuldt, “IntertemporalChoice,” in Steven N. Durlauf and Larry Blume, eds., The New Palgrave Dictionary ofEconomics, London: Palgrave Macmillan, 2008.
Cubitt, Robin P. and Daniel Read, “Can Intertemporal Choice Experiments Elicit Pref-erences for Consumption,” Experimental Economics, 2007, 10 (4), 369–389.
Duflo, Esther, Michael Kremer, and Jonathan Robinson, “Nudging Farmers to UseFertilizer: Theory and Experimental Evidence from Kenya,” American Economic Review,2011, 101 (6), 2350–2390.
Frederick, Shane, George Loewenstein, and Ted O’Donoghue, “Time discounting andtime preference: A critical review,” Journal of economic literature, 2002, pp. 351–401.
Fudenberg, Drew and David K. Levine, “A dual self model of impulse control,” AmericanEconomic Review, 2006, p. Forthcoming.
Geiselman, Paula J, Ashley M Anderson, Marcia L Dowdy, David B West,Stephen M Redmann, and Steven R Smith, “Reliability and validity of a macronu-trient self-selection paradigm and a food preference questionnaire,” Physiology & behavior,1998, 63 (5), 919–928.
Gine, Xavier, Jessica Goldberg, Dan Silverman, and Dean Yang, “Revising Com-mitments: Time Preference and Time-Inconsistency in the Field,” Working Paper, 2010.
Gul, Faruk and Wolfgang Pesendorfer, “Temptation and Self-Control,” Econometrica,2001, 69 (6), 1403–1435.
Halevy, Yoram, “Time Consistency: Stationarity and Time Invariance,” Working Paper,2012.
30
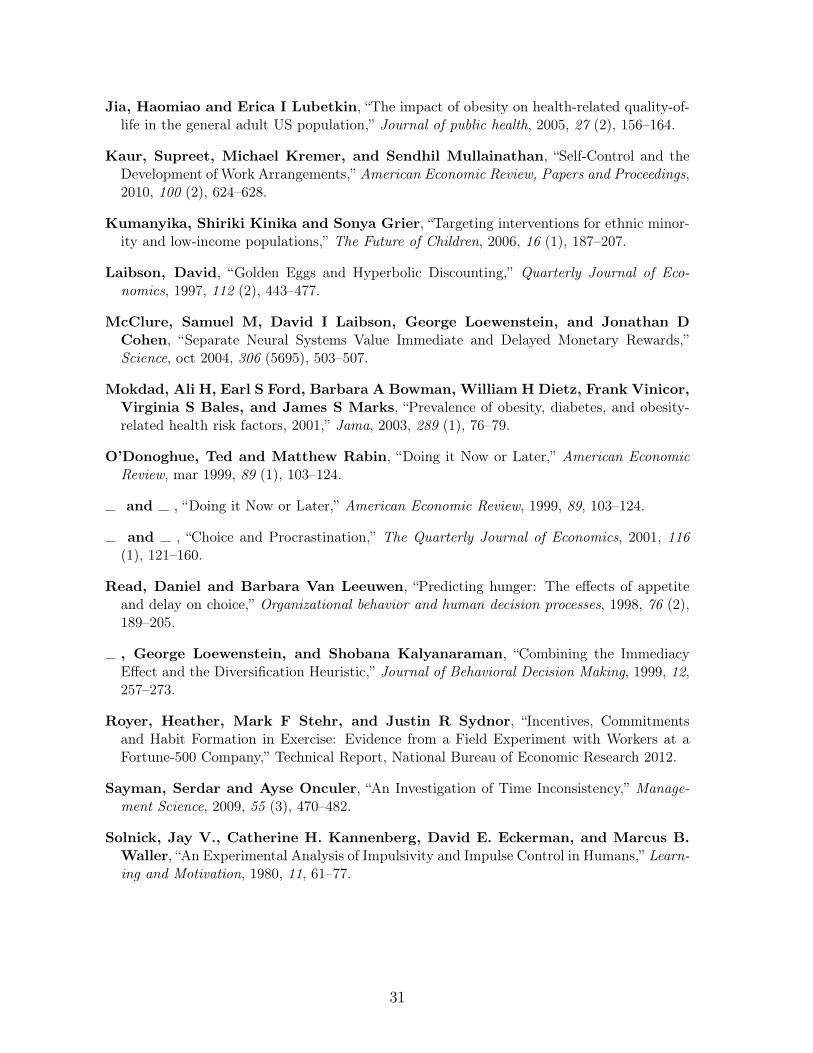
Jia, Haomiao and Erica I Lubetkin, “The impact of obesity on health-related quality-of-life in the general adult US population,” Journal of public health, 2005, 27 (2), 156–164.
Kaur, Supreet, Michael Kremer, and Sendhil Mullainathan, “Self-Control and theDevelopment of Work Arrangements,” American Economic Review, Papers and Proceedings,2010, 100 (2), 624–628.
Kumanyika, Shiriki Kinika and Sonya Grier, “Targeting interventions for ethnic minor-ity and low-income populations,” The Future of Children, 2006, 16 (1), 187–207.
Laibson, David, “Golden Eggs and Hyperbolic Discounting,” Quarterly Journal of Eco-nomics, 1997, 112 (2), 443–477.
McClure, Samuel M, David I Laibson, George Loewenstein, and Jonathan DCohen, “Separate Neural Systems Value Immediate and Delayed Monetary Rewards,”Science, oct 2004, 306 (5695), 503–507.
Mokdad, Ali H, Earl S Ford, Barbara A Bowman, William H Dietz, Frank Vinicor,Virginia S Bales, and James S Marks, “Prevalence of obesity, diabetes, and obesity-related health risk factors, 2001,” Jama, 2003, 289 (1), 76–79.
O’Donoghue, Ted and Matthew Rabin, “Doing it Now or Later,” American EconomicReview, mar 1999, 89 (1), 103–124.
and , “Doing it Now or Later,” American Economic Review, 1999, 89, 103–124.
and , “Choice and Procrastination,” The Quarterly Journal of Economics, 2001, 116(1), 121–160.
Read, Daniel and Barbara Van Leeuwen, “Predicting hunger: The effects of appetiteand delay on choice,” Organizational behavior and human decision processes, 1998, 76 (2),189–205.
, George Loewenstein, and Shobana Kalyanaraman, “Combining the ImmediacyEffect and the Diversification Heuristic,” Journal of Behavioral Decision Making, 1999, 12,257–273.
Royer, Heather, Mark F Stehr, and Justin R Sydnor, “Incentives, Commitmentsand Habit Formation in Exercise: Evidence from a Field Experiment with Workers at aFortune-500 Company,” Technical Report, National Bureau of Economic Research 2012.
Sayman, Serdar and Ayse Onculer, “An Investigation of Time Inconsistency,” Manage-ment Science, 2009, 55 (3), 470–482.
Solnick, Jay V., Catherine H. Kannenberg, David E. Eckerman, and Marcus B.Waller, “An Experimental Analysis of Impulsivity and Impulse Control in Humans,” Learn-ing and Motivation, 1980, 11, 61–77.
31
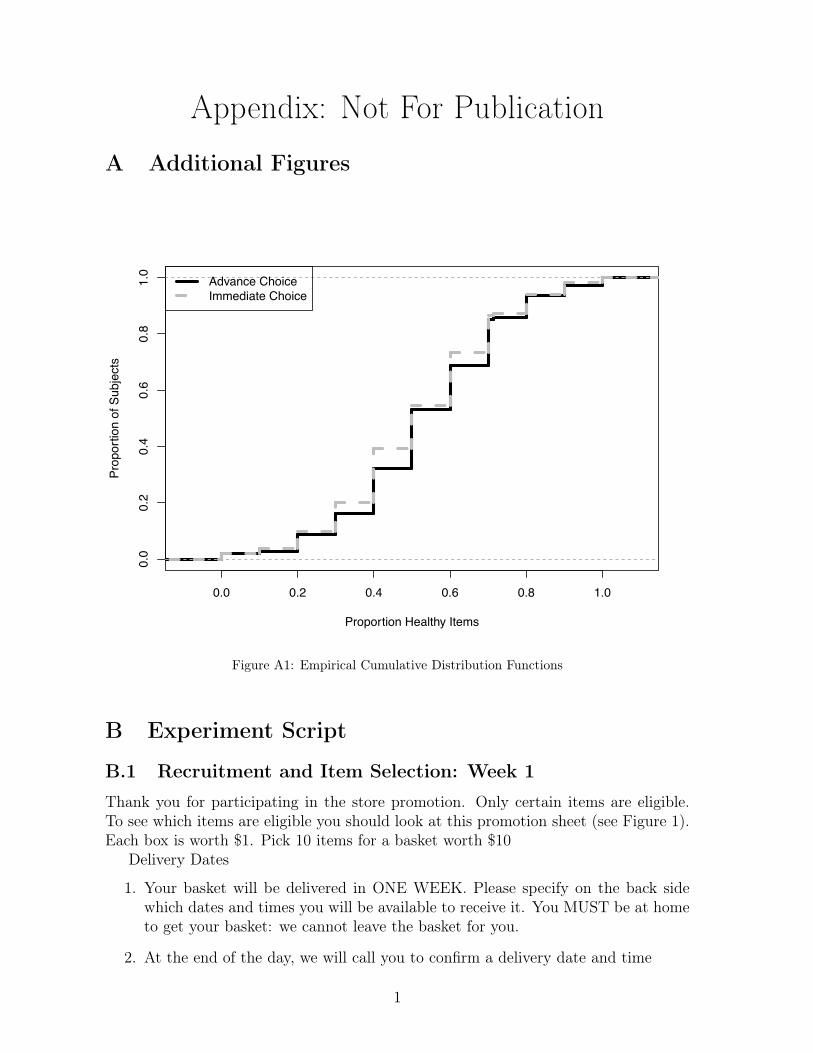
Appendix: Not For Publication
A Additional Figures
0.0 0.2 0.4 0.6 0.8 1.0
0.0
0.2
0.4
0.6
0.8
1.0
Proportion Healthy Items
Prop
ortio
n of
Sub
ject
s
Advance ChoiceImmediate Choice
Figure A1: Empirical Cumulative Distribution Functions
B Experiment Script
B.1 Recruitment and Item Selection: Week 1
Thank you for participating in the store promotion. Only certain items are eligible.To see which items are eligible you should look at this promotion sheet (see Figure 1).Each box is worth $1. Pick 10 items for a basket worth $10
Delivery Dates
1. Your basket will be delivered in ONE WEEK. Please specify on the back sidewhich dates and times you will be available to receive it. You MUST be at hometo get your basket: we cannot leave the basket for you.
2. At the end of the day, we will call you to confirm a delivery date and time
1

Special Promotion
1. Your $10 basket is FREE OF CHARGE
2. In addition, you will get $20 just for participating in our store promotion andcompleting the questionnaires. But you MUST BE HOME both times for thebasket delivery.
B.2 Delivery Confirmation Call: Week 1
Hi, this is [NAME] from Louis’ Groceries. I’m calling for [NAME]. (Or, Is this[NAME]?). You have signed up for the FREE food basket delivery program. I’mjust confirming that we have you scheduled to receive the basket of items that youpicked out in store on [DATE].
1. Remember, you MUST be home to receive your basket, we are not able to leaveit at your door. Does this still work for you? [ If not, try to reschedule themwithin 2 days ]
2. Great, we will see you next week on [DATE] between [TIME START] and [TIMEEND].
B.3 Delivery Reminder Call: Week 2
Hi, this is [NAME] from Louis’ Groceries. I’m calling for [NAME]. (Or, Is this[NAME]?). I am calling to remind you that your FREE food basket delivery is sched-uled on [DATE] between [TIME START] and [TIME END]. You MUST be home toreceive your basket and participate in the promotion that earns you $20 after 2 weeks.
B.4 Week 2 Delivery and Item Selection for Week 3
Hello, I am here with your basket. Please take a look [Bring open basket, allow personto look through]. We also have some extra items available. If you like, you can exchangeany one item in your basket for one of these items [ show extra items on tray ]. I broughtfour additional items, so you can make up to 4 exchanges. Do you want to make anyexchange? [Great thanks, let me note that on your order sheet.]
Remember next week you will also get a basket. Here is a Week 2 basket ordersheet and the promotion items [hand to person.] Will you please go ahead and fill thisout? I will wait in the car and prepare the next round of deliveries while you do that.When you are done, just come outside and we will get your order sheet from you.
Remember:
1. Your delivery will be next [DATE] between [TIME START] and [TIME END].
2. You MUST be home to receive your basket next week
3. Your $10 basket is FREE OF CHARGE
2
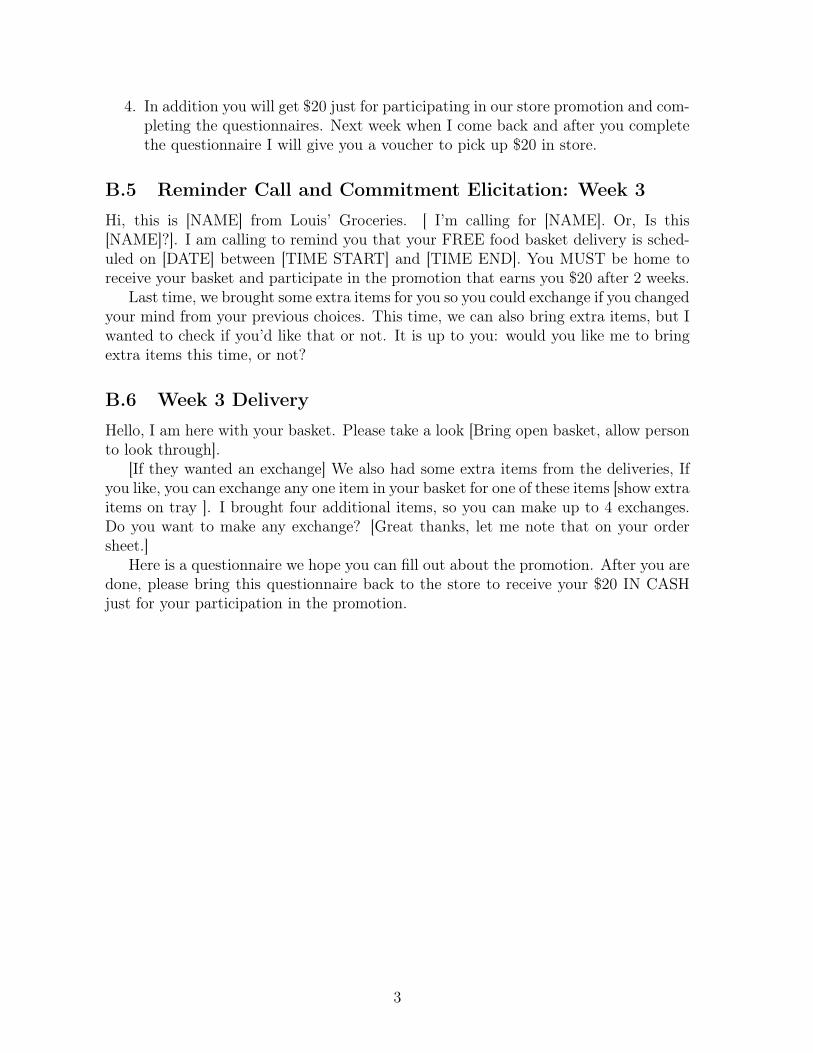
4. In addition you will get $20 just for participating in our store promotion and com-pleting the questionnaires. Next week when I come back and after you completethe questionnaire I will give you a voucher to pick up $20 in store.
B.5 Reminder Call and Commitment Elicitation: Week 3
Hi, this is [NAME] from Louis’ Groceries. [ I’m calling for [NAME]. Or, Is this[NAME]?]. I am calling to remind you that your FREE food basket delivery is sched-uled on [DATE] between [TIME START] and [TIME END]. You MUST be home toreceive your basket and participate in the promotion that earns you $20 after 2 weeks.
Last time, we brought some extra items for you so you could exchange if you changedyour mind from your previous choices. This time, we can also bring extra items, but Iwanted to check if you’d like that or not. It is up to you: would you like me to bringextra items this time, or not?
B.6 Week 3 Delivery
Hello, I am here with your basket. Please take a look [Bring open basket, allow personto look through].
[If they wanted an exchange] We also had some extra items from the deliveries, Ifyou like, you can exchange any one item in your basket for one of these items [show extraitems on tray ]. I brought four additional items, so you can make up to 4 exchanges.Do you want to make any exchange? [Great thanks, let me note that on your ordersheet.]
Here is a questionnaire we hope you can fill out about the promotion. After you aredone, please bring this questionnaire back to the store to receive your $20 IN CASHjust for your participation in the promotion.
3