Dynamic imaging of the growth plate cartilage reveals ...cmchuong/2015SkelMorph.pdf · reveals...
10
ARTICLE Received 17 Nov 2014 | Accepted 27 Feb 2015 | Published 13 Apr 2015 Dynamic imaging of the growth plate cartilage reveals multiple contributors to skeletal morphogenesis Yuwei Li 1,2,3, * ,w , Vikas Trivedi 1,2, *, Thai V. Truong 1,2,w , David S. Koos 4 , Rusty Lansford 4 , Cheng-Ming Chuong 5 , David Warburton 3 , Rex A. Moats 4 & Scott E. Fraser 1,2,3,6,w The diverse morphology of vertebrate skeletal system is genetically controlled, yet the means by which cells shape the skeleton remains to be fully illuminated. Here we perform quantitative analyses of cell behaviours in the growth plate cartilage, the template for long bone formation, to gain insights into this process. Using a robust avian embryonic organ culture, we employ time-lapse two-photon laser scanning microscopy to observe proliferative cells’ behaviours during cartilage growth, resulting in cellular trajectories with a spreading displacement mainly along the tissue elongation axis. We build a novel software toolkit of quantitative methods to segregate the contributions of various cellular processes to the cellular trajectories. We find that convergent-extension, mitotic cell division, and daughter cell rearrangement do not contribute significantly to the observed growth process; instead, extracellular matrix deposition and cell volume enlargement are the key contributors to embryonic cartilage elongation. DOI: 10.1038/ncomms7798 OPEN 1 Division of Biology and Biological Engineering, California Institute of Technology, Pasadena, California 91125, USA. 2 Department of Molecular and Computational Biology, University of Southern California, Los Angeles, California, USA. 3 Developmental Biology and Regenerative Medicine Program, Saban Research Institute, Children’s Hospital Los Angeles, Los Angeles, California 90027, USA. 4 Department of Radiology, The Saban Research Institute, Children’s Hospital Los Angeles, Los Angeles, California 90027, USA. 5 Department of Pathology, Keck School of Medicine, University of Southern California, Los Angeles, California, USA. 6 Department of Biomedical Engineering, Viterbi School of Engineering, University of Southern California, Los Angeles, California, USA. w Present Address: Molecular and Computational Biology, University of Southern California, 1050 Childs Way, Los Angeles, California, USA. *These authors contributed equally to this work. Correspondence and requests for materials should be addressed to Y.L. (email: [email protected]) or to S.E.F. (email: [email protected]). NATURE COMMUNICATIONS | 6:6798 | DOI: 10.1038/ncomms7798 | www.nature.com/naturecommunications 1 & 2015 Macmillan Publishers Limited. All rights reserved.
Transcript of Dynamic imaging of the growth plate cartilage reveals ...cmchuong/2015SkelMorph.pdf · reveals...

ARTICLE
Received 17 Nov 2014 | Accepted 27 Feb 2015 | Published 13 Apr 2015
Dynamic imaging of the growth plate cartilagereveals multiple contributors to skeletalmorphogenesisYuwei Li1,2,3,*,w, Vikas Trivedi1,2,*, Thai V. Truong1,2,w, David S. Koos4, Rusty Lansford4, Cheng-Ming Chuong5,
David Warburton3, Rex A. Moats4 & Scott E. Fraser1,2,3,6,w
The diverse morphology of vertebrate skeletal system is genetically controlled, yet the
means by which cells shape the skeleton remains to be fully illuminated. Here we perform
quantitative analyses of cell behaviours in the growth plate cartilage, the template for long
bone formation, to gain insights into this process. Using a robust avian embryonic organ
culture, we employ time-lapse two-photon laser scanning microscopy to observe proliferative
cells’ behaviours during cartilage growth, resulting in cellular trajectories with a spreading
displacement mainly along the tissue elongation axis. We build a novel software toolkit of
quantitative methods to segregate the contributions of various cellular processes to the
cellular trajectories. We find that convergent-extension, mitotic cell division, and daughter
cell rearrangement do not contribute significantly to the observed growth process; instead,
extracellular matrix deposition and cell volume enlargement are the key contributors to
embryonic cartilage elongation.
DOI: 10.1038/ncomms7798 OPEN
1 Division of Biology and Biological Engineering, California Institute of Technology, Pasadena, California 91125, USA. 2 Department of Molecular andComputational Biology, University of Southern California, Los Angeles, California, USA. 3 Developmental Biology and Regenerative Medicine Program, SabanResearch Institute, Children’s Hospital Los Angeles, Los Angeles, California 90027, USA. 4 Department of Radiology, The Saban Research Institute, Children’sHospital Los Angeles, Los Angeles, California 90027, USA. 5 Department of Pathology, Keck School of Medicine, University of Southern California, LosAngeles, California, USA. 6 Department of Biomedical Engineering, Viterbi School of Engineering, University of Southern California, Los Angeles, California,USA. w Present Address: Molecular and Computational Biology, University of Southern California, 1050 Childs Way, Los Angeles, California, USA. * Theseauthors contributed equally to this work. Correspondence and requests for materials should be addressed to Y.L. (email: [email protected]) or to S.E.F.(email: [email protected]).
NATURE COMMUNICATIONS | 6:6798 | DOI: 10.1038/ncomms7798 | www.nature.com/naturecommunications 1
& 2015 Macmillan Publishers Limited. All rights reserved.

Among the diverse skeletal elements, the growth platecartilage of long bones (limb skeleton) is ideal for 4D(xyz and t) analyses of cell behaviours due to its largely
unidirectional growth and cylindrical shape. Growth is accom-panied by the progressive differentiation of chondrocytes alongthe proximo-distal axis (PDA; Fig. 1a,b)1–3. Residing close to thearticular cartilage are the round and dispersed chondrocytes ofthe resting zone, which are progenitor cells that differentiate intothe elliptical and organized chondrocytes of the proliferative zone(PZ)1–3. During this transition process, chondrocytes depositcollagen II (col2), a specialized extracellular matrix (ECM)protein, into the intercellular space. After a period of celldivision, the proliferative chondrocytes differentiate sequentiallyinto the enlarged chondrocytes in the prehypertrophic andhypertrophic zone (HZ). The terminally differentiated HZchondrocytes deposit another type of ECM protein, collagen X(col10), which serves as a scaffold for the invasion of osteoblastcells; the osteoblasts lay down a calcified bony matrix for longbone maturation1–3.
Multiple signalling pathways, including Indian hedgehog(Ihh)4,5, parathyroid hormone-related peptide (Pthrp)4,5, bonemorphogenetic proteins (Bmp)6, fibroblast growth factors(FGFs)7 and wingless/int-1 molecules (Wnt)8, form a molecularregulatory circuit controlling cartilage growth and morpho-genesis. Significant work in the past, based on static imaging, hassuggested the importance of convergent-extension (CE) likebehaviours of the PZ cells9,10, volume increase of the HZcells11–13 and deposition of ECM12 to adult cartilage elongation.However, the specific contributions and relationships of thevarious cellular processes to embryonic cartilage elongation haveyet to be fully defined. Static imaging studies face two generalchallenges for dissecting tissue morphogenesis: first, fixing andprocessing of tissues can alter cell sizes and the spaces betweenthem in a non-uniform manner; second, dynamic cellularprocesses can only be inferred from static studies. In theabsence of tools for visualizing the various cellular processesand systematically dissecting their roles, it is difficult to
understand how individual cell behaviours are translated intothe collective cell behaviour that underlies tissue morphogenesis.
To meet these challenges, we perform quantitative imaging onlive tissue and generate predictive models to extract informationon the underlying cellular dynamics. Quantitative live opticalimaging allows the longitudinal visualization of individual cellsand the quantitative description of their behaviours in 4D14–16.In silico modelling takes these quantitative measures of PZ cellfeatures and behaviours (for example, length and speed of celldisplacement, absolute and relative orientation of cell division,the rate of ECM deposition and cell volume change) and createspredictions that can then be tested using quantitative imagingtools. Our closed loop analysis reveals that embryonic cartilageelongation is highly coordinated, with critical contributions fromtwo types of cell morphogenesis in the PZ: ECM deposition andcell volume enlargement.
ResultsAvian metacarpal culture for 4D imaging of cartilage elongation.To permit our quantitative imaging analyses of skeleton shapingand the underlying cellular processes in the PZ, we established anorgan culture system that supported normal growth and per-mitted longitudinal imaging of the live specimen. The metacarpalof the forelimb provides an excellent experimental system, as theembryonic day 8 (E8) chick metacarpal is largely PZ and issufficiently thin that nutrients can penetrate to the chondrocytes(Supplementary Fig. 1a–c)17, resulting in normal growth whenisolated in culture (Supplementary Fig. 1d,e). We injectedreplication-competent avian retrovirus into the donor forelimbbud at E3 (Fig. 1b), so that the chondrocytes in the metacarpalharvested at E8 are globally labelled with green fluorescentprotein in cytoplasm (cytoplasmic-GFP) (Supplementary Fig. 2).
To stabilize the metacarpal for long-term imaging, it wasmounted in grooves cast in agarose, using a custom-designedplastic mold based on the metacarpal dimensions (Fig. 1c,d).The agarose provides a non-stick surface that permits natural
x
(PDA)
z
y
z
193 μm
90 μm
1
Distal RCAS-GFP
PHZ
HZ
PZ
RZ
Loop
Ste
m
23
220
μm
45 μm
193 μm
z
xy
t = 0
t = 55h
Loop
Ste
m
90 μm
x
(PDA)
Proximal
Y
x
yz
Figure 1 | Live imaging of cartilage growth. (a) The growth plate cartilage displays a stem-loop shape and contains four zones along the PDA: resting
(RZ), proliferative (PZ), prehypertrophic (PHZ) and hypertrophic (HZ) zones. (b–d) Schematic diagrams of metacarpal culture and imaging. (b) Chick
forelimb bud was injected with RCAS-GFP and the viral-infected metacarpal was dissected for organ culture. (c) A mold (grey) was inserted into molten
agarose on an imaging dish to create grooves (d), which were used to hold the metacarpals stably for imaging through the objective (light blue) on an
inverted laser scanning microscope. (e) Top view of the metacarpal sitting in the groove. (f) The same metacarpal exhibiting similar extension on both sides
after live imaging for 55 h. The red circles in (e) and (f) depict the region imaged. (g) Two orthogonal sections shown in the 3D rendered image of the
GFP-expressing (green) metacarpal at t¼ 29 h (chosen for the best depiction) of live imaging. The white cuboid drawn shows the approximate region
selected for the PZ cell tracking. (h) Side view of the same sample. The middle 90-mm region spanning both stem and loop parts was digitally sliced into
three sections along the imaging axis (Methods) to facilitate cell segmentation. Scale bars, (e,f) 500mm, (g) 50mm and (h) 20mm.
ARTICLE NATURE COMMUNICATIONS | DOI: 10.1038/ncomms7798
2 NATURE COMMUNICATIONS | 6:6798 | DOI: 10.1038/ncomms7798 | www.nature.com/naturecommunications
& 2015 Macmillan Publishers Limited. All rights reserved.

tissue elongation and morphogenesis. To avoid the possibilitythat the enlarged ends of the metacarpal (Fig. 1a) might lodge inthe agarose, we removed the agarose surrounding the ends; thus,only the more cylindrical stem region was in contact with theagarose groove (Fig. 1e).
4D imaging and segmentation of the PZ cells. To non-invasively visualize cells in multiple layers of the explanted bone,we used two-photon laser scanning microscopy (TPLSM)18,which can image cells deeper in the tissue than conventionalconfocal laser scanning microscopy. Image stacks were collectedof one end of the cultured metatarsal hourly for 55 h, to a depththat reached half the thickness (Supplementary Movie 1). Theilluminated and unexposed half of the metacarpal exhibitedsimilar length extension (Fig. 1f), suggesting there is little if anyphoto-toxicity or detrimental effects of being cultured on themicroscope stage.
We identified the PZ cells based on their positions in the livetissue (Supplementary Fig. 1f). To quantitatively define these cellbehaviours, we performed 3D spot segmentation of individualcells, so that they could be tracked over time in a 220� 90�90 mm3 region (Fig. 1g,h; Fig. 2a,b; Supplementary Movies 2–4).
We estimated that our segmentation and tracking is able toaccurately track 95% of the cells in the volume. This was validatedby labelling the post-imaging sample with phalloidin and findingthat 97% of the cells identified in this way were GFP labelled(Supplementary Fig. 2). In addition, all computed trajectorieswere manually checked and corrected for possible errors. Ourprocessing was able to identify 481 cells, out of which weeventually analysed 472 cells (98%). Thus, we conclude that oursegmentation and tracking is able to accurately cover 95% (98 of97% labelled cells) of all the cells.
Anisotropic spreading of the PZ cells. To analyze and displaythe 4D trajectories, we defined a Cartesian coordinate systemaligned with the shape of the metacarpal (Figs 1b and 2a): ThePDA was defined as the y axis, with the middle of the tissue takenas the origin; the axis perpendicular to the long axis in theimaging plane was defined as the x axis; the axis coming out(along the light path) and orthogonal to the image plane wasdefined as the z axis.
Decomposition of cellular trajectories using this Cartesiancoordinate system revealed a clear bias to the spreadingbehaviour, with the most significant movement along the y axis(Fig. 2c). This y axis motion occurred in two phases, with manycellular trajectories moving proximally in the first 10 h ofimaging; thereafter, all trajectories coursed distally. Colour-coding the trajectories according to the initial positions of thecells revealed an inherent order, with the displacementsincreasing progressively from the proximal to the distal end inthe second phase (Fig. 2c). Such a coordinated pattern was notobserved in the x and z directions (Supplementary Fig. 3a,b),suggesting that the cell displacements are mainly determined bytheir initial positions along the PDA.
Additive nature of the anisotropic cell spreading. The orderlyspreading of cells suggests some cooperation between cells, thenature of which needed further investigation. By analysing thetotal y displacement of each cell with respect to its initial yposition, we found a linear relationship (R2¼ 0.986) (Fig. 2d),implying that the displacement of a cell is contributed additivelyby all the cells proximal to it. Such a patterned displacementshould be expected given the growth patterns, and the linear slopeimplies that all the cells contribute equally to the overall dis-placement. This orderly cell displacement translated into cellular
speed (Supplementary Fig. 3d), with the same correlationpattern relative to cell initial positions (Supplementary Fig. 3c).Importantly, the equal contribution from each cell to the overalldisplacement means that the relative speed between nearest-neighbour cells should be the same independent of their positionsalong the PDA (Supplementary Fig. 3e).
To explore the nature of the cooperative behaviour suggestedby the trajectory analysis at the individual cell level, we employeda cell-based reference system to analyse the distance changebetween neighbouring cells. The mean of the distance between acell and every other cell was calculated at each time point. Thisyielded unimodal distributions of the mean distances, withsimilar shapes at all time points, strongly suggesting that cellswere displaced away from each other at a global level (Fig. 2e,f).Similar to cell displacement behaviour, cell-cell distance changeshowed a larger spread along the y axis, direction of tissueelongation.
Conservation of cell spreading behaviour across avianembryos. To determine whether the PZ cell displacement patternis conserved across avian embryos, the same methodology wasapplied to analyse metacarpal elongation in transgenic quailembryos constitutively expressing H2B-mCherry in their cellnuclei19, (Supplementary Fig. 5a,b; Supplementary Movies 7–9).We found similar cellular trajectories (Supplementary Fig. 5c)and cell-cell distance change (Supplementary Fig. 5f,g), withcellular speed (Supplementary Fig. 3f–h) and displacementlengths (Supplementary Fig. 5d) increasing in an additive andhomogeneous manner in the y direction. In quail, the two distinctphases of cell displacement occurred with slightly differenttiming, with cell trajectories that were first displaced distally, thenbidirectionally, followed by another phase of distal displacement(Supplementary Fig. 5c). These subtle differences in timingbetween quail and chick might be the product of species-dependent differences in the timing or patterning of long bonegrowth, in a largely conserved elongation mechanism.
CE cannot account for cell spreading. What, then, are thecellular processes accounting for the observed anisotropic cellspreading and metacarpal elongation? Previous qualitative studieshave proposed an important role of CE in controlling cartilagemorphology10. CE achieves elongation by cell-cell intercalationsorthogonal to the growth axis, resulting in the narrowing andlengthening of the embryonic axis of the frog embryo, forexample refs 20,21. As our cell-cell distance analyses indicateextension in all directions (Fig. 2e,f; Supplementary Fig. 5f,g),CE could only be a significant contributor during metacarpalelongation if changes in other cellular morphogenesiscompensates for the convergence. To definitively test thecontribution of CE, we performed a polygon analysis, in whichthe relative motions of all cells with respect to their immediateneighbours are tracked over time (Fig. 3a). If CE takes place, theincrease in height (along the PDA) of the polygon shouldaccompany the decrease in its width. Using this criterion, ouranalysis showed that only 10% of the cells underwent CE, while87% underwent extension-extension, that is, extension in bothx and y directions (Fig. 3b, Supplementary Fig. 4e).
Mitotic division cannot account for cell spreading. We nexttested the ability of mitotic division to explain the growthobserved by our quantitative imaging. We identified the cells thatunderwent mitosis in chick with the cytoplasmic-GFP (Fig. 3c,d;Supplementary Movies 5 and 6) and in quail with the nuclearH2B-mCherry (Supplementary Movies 10 and 11). In bothsystems, the mitotic rate was below 7%, which is insufficient to
NATURE COMMUNICATIONS | DOI: 10.1038/ncomms7798 ARTICLE
NATURE COMMUNICATIONS | 6:6798 | DOI: 10.1038/ncomms7798 | www.nature.com/naturecommunications 3
& 2015 Macmillan Publishers Limited. All rights reserved.

Log(25) Log(50) Log(60)0
10
20
30
40
50
60
70
80
90
100
200 250
Initial position along y axis (μm)
300 350 400
−20
0
20
−20
0
20
40
60
80
100
10 20 30 40 50−40
−20
0
20
0
20
0
20
40
60
80
100
Time (hours)
Distancealong y axis
Pro
xim
al
Dis
tal
////
y
x
z
Dis
plac
emen
t (μm
)
Time (hours)x
y
z
Distal
ProximalProximal
Distal
Tot
al d
ispl
acem
ent (
μm)
x
Fre
quen
cy o
f occ
urre
nce
y3D
xz
z
0 Time (hours) 56
0 Time (hours) 56
Fre
quen
cy o
f occ
urre
nce//
//
Log (cell-cell distance along x axis (μm))
y1y2
x2x1
x4x3
y3 y4
Log(50)
Log (cell-cell distance along y axis (μm))
Log(100) Log(150)0
10
20
30
40
50
60
70
80
90
100
ARTICLE NATURE COMMUNICATIONS | DOI: 10.1038/ncomms7798
4 NATURE COMMUNICATIONS | 6:6798 | DOI: 10.1038/ncomms7798 | www.nature.com/naturecommunications
& 2015 Macmillan Publishers Limited. All rights reserved.

explain the large and homogenous cell displacements.Furthermore, measurements of the division angles (Fig. 3e)confirmed that the divisions were oriented orthogonal to the PDA(Fig. 3g; Supplementary Figs 4a,b and 5e), as suggested byprevious static analyses10,22. These findings make it unlikely thatmitotic division is a major contributor to the observed celldisplacements.
To test this interpretation, we treated E8 cultured chickmetacarpals with the cell-cycle blocker mitomycin, whichpartially inhibited the progression to mitosis (validated by the
reduced expression level of the mitosis marker phospho-histoneH3 Supplementary Fig. 4d), and found that the treated tissueselongated normally when scored at E9 (Supplementary Fig. 4c).This supports our conclusion that mitotic division is notnecessary for tissue elongation during the time window of ourexperiment. As ultimately the number of cells in a tissue isexpected to contribute to its size, further studies are needed tofully elucidate the precise spatio-temporal relationship betweencell division and cartilage growth, through extending the analysisover longer time windows.
10 20 30 40 50−10
0
10
20
−3
7
Δh (
μm)
Δw (
μm)
17
27 Cell of interest
Neighbours
Con
verg
ence
only
Convergent
extension
wh
Δh > 0Δw = 0
Δh = 0Δw < 0
Δh > 0Δw < 0
Exten
sion
only
x
y
z
r
Daughtercell 1
Daughtercell 2
Oriented division
Rearran-gement
PDA
Time (hours)
//
1 Cell number 472
End of tracking
Θ (degrees)
Number of cells
30
0
60
90Time of division
20
15
10
5
t = 0
t = 14h
t = 26h
t = 56h x
y
z
Θ
Figure 3 | Convergent-extension and mitotic division cannot account for cell spreading. (a,b) Polygon analysis of convergent-extension (CE).
(a) Schematic diagrams of polygon analysis. A polygon was drawn for every cell (red) by choosing three nearest neighbours (green). Change in the height
(Dh) and the width (Dw) of the polygon depends on the nature of cell motion with respect to its neighbours. (b) Dh and Dw of the PZ cells during growth
(each coloured line shows the changing value of a single polygon). The increase in the mean of both Dh and Dw (thick black line) over time suggests no
significant CE during the observed time window (n¼472 cells, Supplementary Fig. S4e). (c–g) Angle analysis of dividing cells. Several time frames of one
representative dividing cell expressing GFP (red dots) are presented (c), and the trajectories of all dividing cells were mapped (d) (n¼ 17 cells). To analyse
their trajectories, a polar coordinate system was defined (e) with r and Y as the distance and angle with respect to xz plane between two daughter cells,
respectively. If a cell divides along or orthogonal to the PDA, Y at the time of division is 90 degrees or 0, respectively. If daughter cells undergo
rearrangement after orthogonal division (f), Y should undergo significant increase over time. (g) Y was measured for all dividing cells and a polar
histogram was employed to show that all Y were below 15 degrees at the time of division (blue), ruling out the possibility of oriented cell division along the
PDA. The fact that all Y were below 30 degrees by the end of tracking (red) further excluded the possibility of daughter cell rearrangement afterwards (g)
(n¼ 17 cells). Scale bars, (c) 10mm, (d) 50mm.
Figure 2 | Cells undergo collective spreading displacement during cartilage growth. (a,b) Cells in the proliferative zone (PZ) were segmented (red dots),
and their net displacement vectors (blue lines in a) and trajectories (colored lines in b) were mapped, showing strong orientation of the cell displacement
towards the distal end of the tissue. (c,d) Analysis of individual cell trajectories. (c) Cell displacement over time relative to its initial y position
(colour-coded as shown in the top inset), showing the largest displacement along the y axis and smaller along the x and z axes. (d) Total cell displacement
(t¼ 55 h) along different axes and planes relative to their initial y positions. Cell displacements along the y axis account for most of the displacements in 3D
with linear increase in magnitude according to their initial y positions (R2¼0.986), as expected if the motion of the cells depends both on local changes
and similar changes happening more proximally. (e,f) Analysis of cell-cell distance change. The mean of centre-to-centre distance between all possible
pairs of cells at any given time was measured (as indicated in the insets), and the distributions of those means for all cells over time (colour-coded)
were plotted along the x (e) and the y axes (f) on a semi-log scale (to amplify the increase in mean over time graphically). More increase in cell-cell
distance along the y axis as compared with the x axis implies an anisotropic spreading behaviour of the PZ cells; n¼472 cells in (c–f). Scale bars
(a,b), 50mm.
NATURE COMMUNICATIONS | DOI: 10.1038/ncomms7798 ARTICLE
NATURE COMMUNICATIONS | 6:6798 | DOI: 10.1038/ncomms7798 | www.nature.com/naturecommunications 5
& 2015 Macmillan Publishers Limited. All rights reserved.

260 280 300
Initial position along y axis (�m)
320 340 360 380 400 42040
45
50
55
60
65
70
75
80
85
90
10 15 20 25 30 35 40 45 50 55−10
0
10
20
30
40
50
60
70
80
90
0 10 20 30 40 502
1.5
1
0.5
0.5
1
1.5
2
2.5
3
3.5 140
130
120
110
100
110
100
90
Dark voxels (ECM)
Time (h)
Time (h)
Time (h)
White voxels (cells)
Num
ber
of v
oxel
s (A
U)
0 10 20 30 40 50
% C
hang
e in
leng
th
Along y axis
// //
Simulated
ExperimentalTot
al d
ispl
acem
ent a
long
y a
xis
(�m
)
Dis
plac
emen
t alo
ng y
axi
s (�
m)
Experimental
Simulated
Time (hour)
Cel
l num
ber
% e
rror
–3
0
3
10 551
109
t = 0 t = 10 h t = 20 h t = 40h
t = 56 h
t = 0 t = 10 h t = 20 h t = 40h
t = 56h
BoxECMCell
Along x axis
Figure 4 | ECM expansion and cell volume enlargement account for cell spreading. (a,b) Col2a antibody staining (red) of frozen sections from the
chick metacarpal expressing cytoplasmic-GFP (green). (a) Low magnification view. (b) Enlarged image of the region in the white box in (a). Inset of
(b) shows sample counterstained with DAPI (blue) to reveal the locations of cell nuclei (three experiments; n¼4 per experiment). (c,d) Cell segmentation
for voxel analysis. (c) Maximum intensity projections of five time points in the 4D live imaging of a chick metacarpal expressing GFP; the region enclosed
within the expanding white box selected for voxel analysis, based on the same four cells on the boundaries (red dots). (d) Corresponding binary
images provided clear identification of voxels as either ECM (black) and cell (white) volume. (e,f) Voxel analysis. (e) Total count of the number of dark and
white voxels, denoting the volume occupied by ECM and cells, respectively, shows the expansion of both ECM and cell volume. (f) Decomposition of the
increase in ECM and cell length along the x and y axes, expressed as the percentage of the length at t¼0 (100% denotes no change). (g,h) Results of
computer simulations of cell trajectories, based on the model of tissue growth described in text and depicted schematically in Fig. 5. (g) Overlapping
simulated and experimental (tracked) cell trajectories along the y axis depicted for six randomly chosen cells. Heat map in the insert depicts the errors of all
simulated trajectories as a percentage of the experimental values showing that the absolute errors are always below 3%. (h) Total cell displacement length
(t¼ 55 h) along the y axis of all simulated cells are plotted against their initial y positions, displaying similar distribution pattern to the experimental ones;
n¼ 109 cells in (c–e). Scale bars, (a,b) 15 mm, (c,d) 50mm.
ARTICLE NATURE COMMUNICATIONS | DOI: 10.1038/ncomms7798
6 NATURE COMMUNICATIONS | 6:6798 | DOI: 10.1038/ncomms7798 | www.nature.com/naturecommunications
& 2015 Macmillan Publishers Limited. All rights reserved.
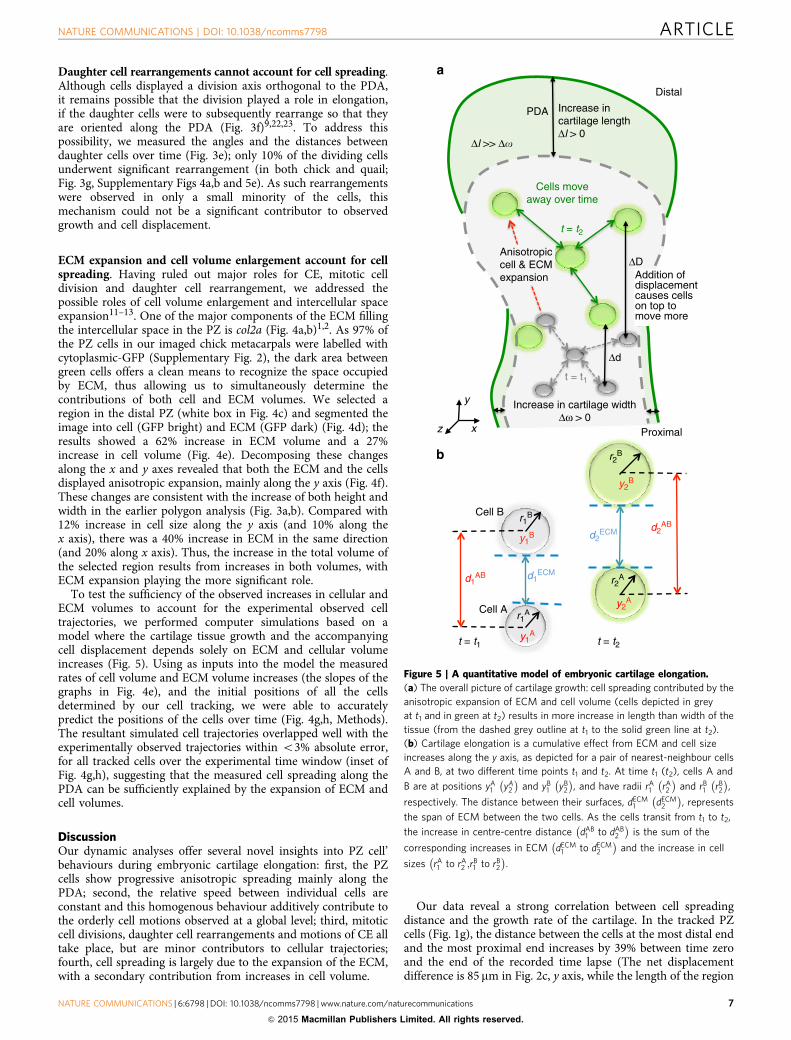
Daughter cell rearrangements cannot account for cell spreading.Although cells displayed a division axis orthogonal to the PDA,it remains possible that the division played a role in elongation,if the daughter cells were to subsequently rearrange so that theyare oriented along the PDA (Fig. 3f)9,22,23. To address thispossibility, we measured the angles and the distances betweendaughter cells over time (Fig. 3e); only 10% of the dividing cellsunderwent significant rearrangement (in both chick and quail;Fig. 3g, Supplementary Figs 4a,b and 5e). As such rearrangementswere observed in only a small minority of the cells, thismechanism could not be a significant contributor to observedgrowth and cell displacement.
ECM expansion and cell volume enlargement account for cellspreading. Having ruled out major roles for CE, mitotic celldivision and daughter cell rearrangement, we addressed thepossible roles of cell volume enlargement and intercellular spaceexpansion11–13. One of the major components of the ECM fillingthe intercellular space in the PZ is col2a (Fig. 4a,b)1,2. As 97% ofthe PZ cells in our imaged chick metacarpals were labelled withcytoplasmic-GFP (Supplementary Fig. 2), the dark area betweengreen cells offers a clean means to recognize the space occupiedby ECM, thus allowing us to simultaneously determine thecontributions of both cell and ECM volumes. We selected aregion in the distal PZ (white box in Fig. 4c) and segmented theimage into cell (GFP bright) and ECM (GFP dark) (Fig. 4d); theresults showed a 62% increase in ECM volume and a 27%increase in cell volume (Fig. 4e). Decomposing these changesalong the x and y axes revealed that both the ECM and the cellsdisplayed anisotropic expansion, mainly along the y axis (Fig. 4f).These changes are consistent with the increase of both height andwidth in the earlier polygon analysis (Fig. 3a,b). Compared with12% increase in cell size along the y axis (and 10% along thex axis), there was a 40% increase in ECM in the same direction(and 20% along x axis). Thus, the increase in the total volume ofthe selected region results from increases in both volumes, withECM expansion playing the more significant role.
To test the sufficiency of the observed increases in cellular andECM volumes to account for the experimental observed celltrajectories, we performed computer simulations based on amodel where the cartilage tissue growth and the accompanyingcell displacement depends solely on ECM and cellular volumeincreases (Fig. 5). Using as inputs into the model the measuredrates of cell volume and ECM volume increases (the slopes of thegraphs in Fig. 4e), and the initial positions of all the cellsdetermined by our cell tracking, we were able to accuratelypredict the positions of the cells over time (Fig. 4g,h, Methods).The resultant simulated cell trajectories overlapped well with theexperimentally observed trajectories within o3% absolute error,for all tracked cells over the experimental time window (inset ofFig. 4g,h), suggesting that the measured cell spreading along thePDA can be sufficiently explained by the expansion of ECM andcell volumes.
DiscussionOur dynamic analyses offer several novel insights into PZ cell’behaviours during embryonic cartilage elongation: first, the PZcells show progressive anisotropic spreading mainly along thePDA; second, the relative speed between individual cells areconstant and this homogenous behaviour additively contribute tothe orderly cell motions observed at a global level; third, mitoticcell divisions, daughter cell rearrangements and motions of CE alltake place, but are minor contributors to cellular trajectories;fourth, cell spreading is largely due to the expansion of the ECM,with a secondary contribution from increases in cell volume.
Our data reveal a strong correlation between cell spreadingdistance and the growth rate of the cartilage. In the tracked PZcells (Fig. 1g), the distance between the cells at the most distal endand the most proximal end increases by 39% between time zeroand the end of the recorded time lapse (The net displacementdifference is 85 mm in Fig. 2c, y axis, while the length of the region
Cell B
Cell A
t = t1 t = t2
ΔD
PDA Increase incartilage lengthΔl > 0
Cells moveaway over time
t = t2
t = t1
Δd
x
y
z
Distal
Proximal
Increase in cartilage widthΔω > 0
Δl >> Δ�
Anisotropiccell & ECMexpansion
r2B
y2B
y1B
d2AB
d2ECM
d1ECM
d1AB
r1A
r2A
y1A
y2A
r1B
Addition of displacement causes cellson top tomove more
Figure 5 | A quantitative model of embryonic cartilage elongation.
(a) The overall picture of cartilage growth: cell spreading contributed by the
anisotropic expansion of ECM and cell volume (cells depicted in grey
at t1 and in green at t2) results in more increase in length than width of the
tissue (from the dashed grey outline at t1 to the solid green line at t2).
(b) Cartilage elongation is a cumulative effect from ECM and cell size
increases along the y axis, as depicted for a pair of nearest-neighbour cells
A and B, at two different time points t1 and t2. At time t1 (t2), cells A and
B are at positions yA1 yA
2
� �and yB
1 yB2
� �, and have radii rA
1 rA2
� �and rB
1 rB2
� �,
respectively. The distance between their surfaces, dECM1 dECM
2
� �, represents
the span of ECM between the two cells. As the cells transit from t1 to t2,
the increase in centre-centre distance dAB1 to dAB
2
� �is the sum of the
corresponding increases in ECM dECM1 to dECM
2
� �and the increase in cell
sizes rA1 to rA
2 ;rB1 to rB
2
� �.
NATURE COMMUNICATIONS | DOI: 10.1038/ncomms7798 ARTICLE
NATURE COMMUNICATIONS | 6:6798 | DOI: 10.1038/ncomms7798 | www.nature.com/naturecommunications 7
& 2015 Macmillan Publishers Limited. All rights reserved.

at time zero is 220 mm in Fig. 2d, x axis.). During the same periodof time, the entire metacarpal extends by 31% (growth of 500 mmfrom an initial length of 1,600 mm), as quantified by thetransmitted-light images taken with lower magnification(Fig. 1e,f). Thus, the percentage change observed in the trackedPZ cells displacement (39% increase) was higher than the entiretissue growth (31% increase); this was expected, as other regionsof the metacarpal (for example, the resting zone) might notundergo as much growth as the PZ. Overall, this signifies that thecellular displacement tracked and quantified in our study isrelevant to the growth of the entire tissue.
A central task of modern biology is to understand how cellsbuild a tissue in a 4D context24–26. Live imaging provides aunique approach to meet this challenge due to its noninvasiveability to collect longitudinal data from cells embodied in theirnormal context of the live tissues18–20. Live imaging generateslarge data sets, which can be unwieldy to analyse, and biologicalinterpretation of such complex numerical data sets requiresquantitative and statistically robust toolsets27–29. Here, we havedeveloped a suit of custom software tools to meet this challenge,providing a means for analysing relative distance change betweenindividual cells (Fig. 2e,f), CE (Fig. 3a,b), mitotic divisionorientation and daughter cell rearrangement (Fig. 3e–g), therate of ECM deposition and cell volume change (Fig. 4c–h). Weshowed that cell behaviour during skeleton shaping can besystematically dissected using these quantitative approaches,which can also be adapted for studies of diverse morphogeneticevents with minor modifications.
Our trajectory analysis reveals phased cell spreading along thePDA. Cells in the lower PZ displayed proximalwards motion inthe first 10 h, and, thereafter, all trajectories coursed distally(Fig. 2c, y axis). Interestingly, there is a correlation between theobserved cell spreading behaviour and the velocity of ECMdeposition. During the first 10 h, the rate of ECM deposition isthe highest along both the x and y axes (as suggested by the slopeof the black lines in Fig. 4f). After 10 h, the majority of ECMincrease is along the y axis (as suggested by the nearly flat plateauof the black line along x axis in Fig. 4f). This timing matches wellwith the orientation and timing of cell spreading (Fig. 2c, y axis),indicating that the velocity of ECM deposition is linked tocell displacement behaviour. Determining whether this strongcorrelation reflects a causal relationship will require a newgeneration of experiments using our toolset.
Previous work analysing retroviral-based clones of cells withstatic imaging suggested that the PZ cells undergo a stereotypedrearrangement after division to create elongated ranks of relatedcells22. Here we observed such cell rearrangement at a verylow frequency: four mitotically related cells were seen to beginsuch rearrangements (Fig. 3g). This low frequency of cellrearrangement out of the 472 cells we analysed might be due tothe shorter timescale in the current experiments. The virallylabelled clones of cells in chick humerus22 were analysed 5 daysafter viral infection. In that study, the typical labelled patchconsisted of about four cells, suggesting a slow cell division rateand permitting the subsequent rearrangement to be slow. Our liveimaging of the isolated metacarpal lasted for only 55 h.Alternatively, it may be that the formation of ranks of cellstakes place earlier in the metacarpals, while cell movement atlater stages is restricted due to the different microenvironment. Inthe future, it will be important to examine the expression of col2aand other ECM proteins during different developmental stages.
A recent report of live imaging analysis in a craniofacialcartilage showed that cell rearrangements take place by twodaughter cells spreading along their interface23. However, theslow elongation rate of the cranial cartilage and the mosaic natureof the GFP-labelled tissue used in that study make it difficult to
determine the quantitative contributions of this mode of cellrearrangement to skeleton shaping. Thus, even in systemsreporting cell rearrangements in limb skeleton22 or in cranialskeleton23, it seems unlikely to be the driving force for skeletonelongation.
Immunohistochemistry shows that col2a fills the intercellularspace in the PZ (Fig. 5a,b), and perturbation study demonstratesthat the PZ cells are highly misoriented and the cartilage elementsare significantly shorter in the PZ of col2a-mutant mice30. Thus,based on both our circumstantial and published genetic evidence,we propose that col2a deposition, cell morphology and cellspreading coordinate with each other to regulate cartilageelongation. The causal relationship among these three factorsremains uncertain. One attractive hypothesis is that the elongatedshape of the PZ cells might encourage more col2a deposition,which in turn might provide the environment that encourages theelongated cell shape. Indeed, the normal orientation of col2afibres and the cells’ polarized alignment are both disrupted inmutant conditions associated with abnormal cartilagearchitecture and dimensions31,32. In addition, the correlationamong these three factors might be mediated by a response tochemical signalling. Consistent with this possibility, disruptingthe normal activity of noncanonical Wnt signalling in both mouseand chick embryos results in misarranged PZ cells8,22,33, as incol2a-mutant mice30. The resultant shorter and wider cartilageelements further suggest an altered cell spreading behaviour.Future studies, examining the consequences of such alteration incol2a and Wnt signalling, may help shed light on the relative rolesplayed by physical interactions, the ECM and chemical signallingin the creation of proper tissue architecture and morphologyduring skeletogenesis.
In this study, 4D imaging and systematic segregation of distinctcellular processes revealed that cartilage elongation in avianembryo is directly controlled by ECM deposition and cell volumeenlargement in the PZ. Together with the known dominant rolesof these two factors in the HZ in adult cartilage elongation ofmammals11–13,34, our results suggest similar cellular principlesunderlying skeleton shaping at different developmental stages andin different species.
MethodsViral production and infection. Replication-competent avian retrovirus(A)-GFPwas transfected into DF1 cells (ATCC) in 6-cm culture dish using thestandard transfection protocol. The transfected cells were split sequentiallyinto 10 and 15 cm dishes. When the cells were confluent in 15-cm dishes,the cell culture medium was harvested once per day for 3 days and wasconcentrated at 26,000 r.p.m. for 1.5 h. After the spin, the supernatant wasdiscarded while the pellet was dissolved in minimal volume, and further injectedinto chick (Specific Pathogen-Free chick, Charles River) right forelimbs at E3(HH 19–20).
Metacarpal culture and 4D imaging of cartilage elongation. The viral-infectedmetacarpals were dissected at E8 (HH 32–33) for organ culture. Moltenagarose was poured into the fluorodish (World Precision Instruments) and thecustom-designed mold was immediately inserted into it. When the agarose wassolidified, the mold was pulled out, leaving grooves in the agarose for holding themetacarpals. The metacarpals were submerged in DMEM/F12 growth mediumcontaining 10 mM b-glycerophosphate, 0.2% bovine serum albumin, 50 mMascorbate acid (Sigma-Aldrich) and 1% glutamine-penicillin-streptomycin(Invitrogen) in a humidified chamber at 37 �C on the stage of the inverted laserscanning microscope (LSM 710, Carl-Zeiss). For imaging chick metacarpalexpressing GFP, two-photon laser excitation was used with 26% relative power atwavelength of 900 nm. Optical sectioning was achieved at intervals of 1 mm. Forimaging quail metacarpal expressing H2B-mCherry, one-photon laser excitationwas used with 26% relative power at wavelength of 561 nm and same opticalsectioning.
Cell segmentation and tracking. The 4D images were imported into IMARIS7.6.4. The chick metacarpal expressing GFP had a thickness of 193 mm. The middle90-mm region spanning both stem and loop parts was digitally sliced into three
ARTICLE NATURE COMMUNICATIONS | DOI: 10.1038/ncomms7798
8 NATURE COMMUNICATIONS | 6:6798 | DOI: 10.1038/ncomms7798 | www.nature.com/naturecommunications
& 2015 Macmillan Publishers Limited. All rights reserved.

sections along the imaging axis (z axis) (Fig. 1h). Three-dimensional spotsegmentation of cells and subsequently 4D tracking of cells were performed foreach section individually. The cell trajectories from all three sections were com-bined for quantitative analysis in MATLAB R2013b. Four-dimensional image ofquail metacarpal expressing H2B-mCherry had sparse enough signal due to nuclearlabels (as opposed to ubiquitous cytoplasmic label in chick). In addition therelatively low penetration of the one-photon excitation only generated imageswith good resolution for a thickness of 80 mm. Therefore, digital slicing of thisdata set was not required, and all the nuclei were segmented and tracked usingIMARIS 7.6.4.
Cell displacement length measurement. Displacement lengths were calculatedby subtracting the coordinates at time t¼ 0 and a given time. The speed wascalculated as the distance moved by a cell (difference of coordinates along y axis)over time (1-h intervals).
Analysis of cell-cell distance distributions. On the basis of the coordinates of thetracked cells, center-to-center distance between a cell and every other cell wasmeasured, the distribution of which was used for calculating the mean distancealong different orientations. This process was repeated for all the cells and adistribution of average distances was plotted for each time point to depict theshifts in distances over time. The mean of each distribution was further calculatedand plotted over time to show statistically average behaviour of all the cellsover time.
Analysis of daughter cell rearrangement. Figure 3e showed the definition of the3D distance (r) and the 3D angle (Y) between two daughter cells. The axisdirection is the same at all time points as defined in Fig. 3d, but the origin isfixed on one of the daughter cells. Changes (increase or decrease) in r denoterelative displacement of daughter cells (away or towards) over time. Changesin Y denote rearrangement of the vector joining the center of daughter cells withrespect to the xz plane. As the divisions occured at different time points fordifferent cells, the time axis was adjusted with time t¼ 1 denoting the momentof division.
Voxel analysis. The images were imported as Tiff files and cropped based on thecoordinates of the four cells (in the upper region of PZ) on the boundaries used asthe references for drawing the edges of the box for analysis at all times (Fig. 4c).Cropped images were binarized frame-by-frame based on 10 different values ofthresholds around the average voxel intensity of that frame. On the basis of theabove thresholds, every voxel was assigned an identity as either belonging to cell orto ECM based on the value of one or zero in the binary image, respectively. Thisprocess was repeated for all time points and the total numbers of bright and darkvoxels were calculated. To decompose the expansion along x and y axes, the binaryimages for each frame at a given time point were segmented. The dimensions of allthe bounding boxes obtained from every segmented patch at a given time wereaveraged along the two axes. The change in this denotes the changes in celldimensions on average. Subtracting this mean length from the dimensions of thecropping box along corresponding axes at every time denotes the changes in ECMspan on an average.
Computer simulation of cellular trajectories. Given that the majority of cartilagegrowth happens along the PDA, y axis (Fig. 2), we assume that measured rates ofchange of cell volume and ECM volume (the slopes of the graphs in Fig. 4e) comeentirely from the changes along the y axis. We thus took these measured rates ofchange and the initial positions of all the cells determined by our imaging andtracking as inputs into a custom-written MATLAB code to simulate the expectedcell trajectories. As depicted in Fig. 5b, at every time point the intercellular distancewas increased assuming an anisotropic but uniform change along the y axis.New cellular positions were predicted at every time point (based on equation (9)below), which were then iteratively used as inputs into the next time step toconstruct the trajectory over the total duration of imaging. Note that oursimulation did not contain any freely adjustable parameters—the only inputs arethe measured rates of change in cell and ECM size, and the imaged and trackedcellular positions. The derivation for the simulation based on inputs from theimages is outlined below. On the basis of Fig. 5b we know that
yB2 � yA
2 ¼ dECM2 þ rA
2 þ rB2 and yB
1 � yA1 ¼ dECM
1 þ rA1 þ rB
1 ð1ÞWe can write that
dAB2 � dAB
1 ¼ dECM2 þ rA
2 þ rB2
� �� dECM
1 þ rA1 þ rB
1
� �) yB
2 � yA2
� �� yB
1 � yA1
� �¼ dECM
2 � dECM1
� �þ rA
2 � rA1
� �þ rB
2 � rB1
� �) yB
2 � yB1
� �� yA
2 � yA1
� �¼ dECM
2 � dECM1
� �þ rA
2 � rA1
� �þ rB
2 � rB1
� �
) yB2 � yB
1
� �Dt
� yA2 � yA
1
� �Dt
¼ dECM2 � dECM
1
� �Dt
þ rA2 � rA
1
� �Dt
þ rB2 � rB
1
� �Dt
ð2Þ
) Relative speed ¼ rate of change of ECMþ rate of change of cell volume ð3Þ
From equation (1), we know that
) yB2 ¼ yA
2 þ dECM2 þ rA
2 þ rB2 ð4Þ
Since dECM2 þ rA
2 þ rB2 ¼ dECM
1
� �% ECM½ � þ rA
1 þ rB1
� �% cell½ � ð5Þ
) dECM2 þ rA
2 þ rB2 ¼ dECM
1
� � dECM2
dECM1
� �þ rA
1 þ rB1
� � rA2 þ rB
2
rA1 þ rB
1
� �
) dECM2 þ rA
2 þ rB2 ¼ dECM
1 þ rA1 þ rB
1
� � dECM1
dECM1 þ rA
1 þ rB1
� �rA
1 þ rB1
dECM1 þ rA
1 þ rB1
� �rA
2 þ rB2
rA1 þ rB
1
� ��
ð6Þ
) dECM2 þ rA
2 þ rB2 ¼ dECM
1 þ rA1 þ rB
1
� �ECM fraction at t1½ �f
Ratio of ECM at t2 and t1½ � þ Cell fraction at t1½ � Ratio of Cell at t2 and t1½ �gð7Þ
Converting the expression in terms of dark and bright voxels, we get
) dECM2 þ rA
2 þ rB2 ¼ yB
1 � yA1
� �dark voxel fraction at t1½ �f
ratio of dark voxels at t2 and t1½ � þ Bright voxel fraction at t1½ �ratio of bright voxels at t2 and t1½ �
g ð8Þ
Hence combining equations (4) and (8) we have,
yB2 ¼ yA
2 þ yB1 � yA
1
� �dark voxel fraction at t1½ � ratio of dark voxels at t2 and t1½ �f
þ bright voxel fraction at t1½ � ratio of bright voxels at t2 and t1½ �gð9Þ
Effectively this also can be simplified to the following
yB2 ¼ yA
2 þ yB1 � yA
1
� � No: voxels at t2No: voxels at t1
� ð10Þ
Isolation of chondrocytes and western analysis. Chondrocytes were isolatedfrom chick metacarpals. After removal of the surrounding perichondrium, thegrowth plate cartilage was cut into small pieces, homogenized in RIPA buffer andfurther clarified by centrifugation. The supernatant was used for western blottingwith the following antibodies: anti-phosphor-histone-H3 (1:2000; cell signaling),anti-cleaved-caspase (1:2000; cell signaling), anti-b-actin (1:1000, cell signaling)and HRP-conjugated secondary antibodies (1:5000; cell signaling).
Immunofluorescence and section in situ hybridization. Chick metacarpals at E8were dissected, fixed in 4% paraformaldehyde and frozen in O.C.T. (Tissue-Tek)for making sections (20 mm thickness). For col2a antibody staining, tissue sectionswere pretreated with 1 mg ml� 1 pepsin in 0.1 N HCl and blocked in 10% fetalbovine serum before incubating with anti-col2a (1:50, DSHB) and further anti-mouse alexa-488 (1:250, Invitrogen). Phalloidin alexa-546 (1:100, MolecularProbes) was used for counterstaining. For section in situ hybridization, tissuesections were hybridized to anti-chick Ihh RNA probes labelled with digoxigenin.Tissue sections of the post-imaging chick metacarpal (expressing GFP) werestained with phalloidin alexa-546 (1:100, Molecular Probes). The number of green(2483 PZ cells) and red signals (2560 PZ cells) of the illuminated half of the tissuewas counted using ImageJ.
References1. Kronenberg, H. M. Developmental regulation of the growth plate. Nature 423,
332–336 (2003).2. Shum, L., Coleman, C. M. & Tuan, R. S. Morphogenesis and dysmorphogenesis
of the appendicular skeleton. Birth Defects Res. C Embryo Today 69, 102–122(2003).
3. Lefebvre, V. & Bhattaram, P. Vertebrate skeletogenesis. Curr. Top. Dev. Biol.90, 291–317 (2010).
4. Vortkamp, A. et al. Regulation of rate of cartilage differentiation by Indianhedgehog and PTH-related protein. Science 273, 613–622 (1996).
5. Lanske, B. et al. PTH/PTHrP receptor in early development and Indianhedgehog-regulated bone growth. Science 273, 663–666 (1996).
6. De Luca, F. et al. Regulation of growth plate chondrogenesis by bonemorphogenetic protein-2. Endocrinology 142, 430–436 (2001).
7. Deng, C., Wynshaw-Boris, Zhou, F., Kuo, A. & Leder, P. Fibroblast growthfactor receptor 3 is a negative regulator of bone growth. Cell 84, 911–921(1996).
8. Yang, Y., Topol, L., Lee, H. & Wu, J. Wnt5a and Wnt5b exhibit distinctactivities in coordinating chondrocyte proliferation and differentiation.Development 130, 1003–1015 (2003).
9. Dodds, G. Row formation and other types of arrangement of cartilage cells inendochondral ossification. Anat. Rec. 46, 385–399 (1930).
10. Ahrens, M., Li, Y., Jiang, H. & Dudley, A. T. Convergent extension movementsingrowth plate chondrocytes require gpi-anchored cell surface proteins.Development 136, 3463–3474 (2009).
NATURE COMMUNICATIONS | DOI: 10.1038/ncomms7798 ARTICLE
NATURE COMMUNICATIONS | 6:6798 | DOI: 10.1038/ncomms7798 | www.nature.com/naturecommunications 9
& 2015 Macmillan Publishers Limited. All rights reserved.

11. Wilsman, N. J., Farnum, C. E., Leiferman, E. M., Fry, M. & Barreto, C.Differential growth by growth plates as a function of multiple parameters ofchondrocytic kinetics. J. Orthop. Res. 14, 927–936 (1996).
12. Noonan, K. J., Hunziker, E. B., Nessler, J. & Buckwalter, J. A. Changes in cell,matrix compartment, and fibrillar collagen volumes between growth-platezones. J. Orthop. Res. 16, 500–508 (1998).
13. Cooper, K. L. et al. Multiple phases of chondrocyte enlargement underliedifferences in skeletal proportions. Nature 7441, 375–378 (2013).
14. Megason, S. G. & Fraser, S. E. Digitizing life at the level of the cell:high-performance laser-scanning microscopy and image analysis for in totoimaging of development. Mech. Dev. 120, 1407–1420 (2003).
15. Megason, S. G. & Fraser, S. E. Imaging in systems biology. Cell 130, 784–795(2007).
16. Lippincott-Schwartz, J. Bridging structure and process in developmentalbiology through new imaging technologies. Dev. Cell 19, 5–10 Review(2011).
17. Long, F. & Linsenmayer, T. F. Regulation of growth plate cartilageproliferation and differentiation by perichondrium. Development 125,1067–073 (1998).
18. Denk, W., Strickler, J. H. & Webb, W. W. Two-photon laser scanningfluorescence microscopy. Science 6, 73–76 (1990).
19. Sato, Y. et al. Dynamic analysis of vascular morphogenesis using transgenicquail embryos. PLoS. ONE 14, e12674 (2010).
20. Keller, R. Shaping the vertebrate body plan by polarized embryonic cellmovements. Science 298, 1950–1954 Review (2002).
21. Tada, M. & Heisenberg, C. P. Convergent extension: using collective cellmigration and cell intercalation to shape embryos. Development 139,3897–3904 (2012).
22. Li, Y. & Dudley, A. T. Noncanonical frizzled signaling regulates cell polarity ofgrowth plate chondrocytes. Development 136, 1083–1092 (2009).
23. Romereim, S. M., Conoan, N. H., Chen, B. & Dudley, A. T. A dynamic celladhesion surface regulates tissue architecture in growth plate cartilage. Dev.Camb. Engl. 141, 2085–2095 (2014).
24. Keller, R. Mechanisms of elongation in embryogenesis. Development 133,2291–2302 Review (2006).
25. Zhang, H., Gally, C. & Labouesse, M. Tissue morphogenesis: howmultiple cells cooperate to generate a tissue. Curr. Opin. Cell Biol. 22, 575–582(2010).
26. Sasai, Y. Cytosystems dynamics in self-organization of tissue architecture.Nature 17, 318–326 (2013).
27. Gong, Y., Mo, C. & Fraser, S. E. Planar cell polarity signalling controlscell division orientation during zebrafish gastrulation. Nature 430, 689–693(2004).
28. McMahon, A., Supatto, W., Fraser, S. E. & Stathopoulos, A. Dynamic analysesof Drosophila gastrulation provide insights into collective cell migration.Science 5907, 1546–1550 (2010).
29. Supatto, W., McMahon, A., Fraser, S. E. & Stathopoulos, A. Quantitativeimaging of collective cell migration during Drosophila gastrulation:multiphoton microscopy and computational analysis. Nat. Protoc. 4,1397–1412 (2009).
30. Barbieri, O. et al. Depletion of cartilage collagen fibrils in mice carrying adominant negative Col2a1 transgene affects chondrocyte differentiation. Am. J.Physiol. Cell Physiol. 285, C1504–C1512 (2003).
31. Aszodi, A., Hunziker, E. B., Brakebusch, C. & Fassler, R. Beta1 integrinsregulate chondrocyte rotation, G1 progression, and cytokinesis. Genes Dev.17, 2465–2479 (2003).
32. Saito, A. et al. Regulation of endoplasmic reticulum stress response by aBBF2H7-mediated Sec23a pathway is essential for chondrogenesis. Nat. CellBiol. 1197–1204 (2009).
33. Gao, B. et al. Wnt signaling gradients establish planar cell polarity by inducingVangl2 phosphorylation through Ror2. Dev. Cell 20, 163–176 (2011).
34. Hall, B. K. Fins Into Limbs: Evolution, Development, And Transformation(University of Chicago Press, 2008).
AcknowledgementsWe thank Jason Alexander Junge, Masahiro Kitano and Carol Readhead for commentson the manuscript. Alaa I. Abdelhamid, Marcela Artiga, Luca Caneparo, David Huss,Ali Lashgari, Ang Li and Greg Shackleford for discussion and sharing reagents. This workwas supported by California Institute of Regenerative Medicine (CIRM) PostdoctoralFellowship, Dental Research Center at Qassim University (Saudi Arabia), Caltech Bio-logical Imaging Center, the CHLA Translational Biomedical Imaging Laboratory, and theUSC Translational Imaging Center.
Author contributionsAll the authors designed the experiments, and Y.L., T.V.T. and V.T. initiated this project.T.V.T designed the mold for organ culture and helped optimize imaging conditions. Y.L.,D.S.K. and T.V.T. performed organ culture and live imaging. V.T. and Y.L. performedquantitative analysis. R.L. constructed the transgenic quail. Y.L. performed all otherexperiments. Y.L, V.T. and S.E.F. wrote the manuscript.
Additional informationSupplementary Information accompanies this paper at http://www.nature.com/naturecommunications
Competing financial interests: The authors declare no competing financial interests.
Reprints and permission information is available online at http://npg.nature.com/reprintsandpermissions/
How to cite this article: Li, Y. et al. Dynamic imaging of the growth plate cartilagereveals multiple contributors to skeletal morphogenesis. Nat. Commun. 6:6798doi: 10.1038/ncomms7798 (2015).
This work is licensed under a Creative Commons Attribution 4.0International License. The images or other third party material in this
article are included in the article’s Creative Commons license, unless indicated otherwisein the credit line; if the material is not included under the Creative Commons license,users will need to obtain permission from the license holder to reproduce the material.To view a copy of this license, visit http://creativecommons.org/licenses/by/4.0/
ARTICLE NATURE COMMUNICATIONS | DOI: 10.1038/ncomms7798
10 NATURE COMMUNICATIONS | 6:6798 | DOI: 10.1038/ncomms7798 | www.nature.com/naturecommunications
& 2015 Macmillan Publishers Limited. All rights reserved.