Dynamic Ground Effects Flight Test of an F-15 Aircraft Technical Memorandum 4604 Dynamic Ground...
28
NASA Technical Memorandum 4604 Dynamic Ground Effects Flight Test of an F-15 Aircraft September 1994 Stephen Corda, Mark T. Stephenson, Frank W. Burcham, and Robert E. Curry
-
Upload
vuonghuong -
Category
Documents
-
view
219 -
download
1
Transcript of Dynamic Ground Effects Flight Test of an F-15 Aircraft Technical Memorandum 4604 Dynamic Ground...

NASA Technical Memorandum 4604
Dynamic Ground Effects Flight Test of an F-15 Aircraft
September 1994
Stephen Corda, Mark T. Stephenson,Frank W. Burcham, and Robert E. Curry

NASA Technical Memorandum 4604
National Aeronautics and Space Administration
Office of Management
Scientific and Technical Information Program
1994
Stephen Corda
PRC Inc.Edwards, California
Mark T. Stephenson, Frank W. Burcham, and Robert E. Curry
Dryden Flight Research CenterEdwards, California
Dynamic Ground Effects Flight Test of an F-15 Aircraft

CONTENTS
ABSTRACT . . . . . . . . . . . . . . . . . . . . . . . . . . . . . . . . . . . . . . . . . . . . . . . . . . . . . . . . . . . . . . . . . . . . . . . 1
NOMENCLATURE . . . . . . . . . . . . . . . . . . . . . . . . . . . . . . . . . . . . . . . . . . . . . . . . . . . . . . . . . . . . . . . . . .1
INTRODUCTION. . . . . . . . . . . . . . . . . . . . . . . . . . . . . . . . . . . . . . . . . . . . . . . . . . . . . . . . . . . . . . . . . . . 1
GROUND EFFECTS BACKGROUND. . . . . . . . . . . . . . . . . . . . . . . . . . . . . . . . . . . . . . . . . . . . . . . . . . 2
AIRCRAFT DESCRIPTION . . . . . . . . . . . . . . . . . . . . . . . . . . . . . . . . . . . . . . . . . . . . . . . . . . . . . . . . . . 5Flight Control System . . . . . . . . . . . . . . . . . . . . . . . . . . . . . . . . . . . . . . . . . . . . . . . . . . . . . . . . . . . . . .5Instrumentation . . . . . . . . . . . . . . . . . . . . . . . . . . . . . . . . . . . . . . . . . . . . . . . . . . . . . . . . . . . . . . . . . . 6
FLIGHT TEST PROCEDURE . . . . . . . . . . . . . . . . . . . . . . . . . . . . . . . . . . . . . . . . . . . . . . . . . . . . . . . . . 6
DATA ANALYSIS. . . . . . . . . . . . . . . . . . . . . . . . . . . . . . . . . . . . . . . . . . . . . . . . . . . . . . . . . . . . . . . . . . 7
RESULTS AND DISCUSSION . . . . . . . . . . . . . . . . . . . . . . . . . . . . . . . . . . . . . . . . . . . . . . . . . . . . . . . . 8Pilots’ Comments . . . . . . . . . . . . . . . . . . . . . . . . . . . . . . . . . . . . . . . . . . . . . . . . . . . . . . . . . . . . . . . 10Noseboom Pressure Corrections . . . . . . . . . . . . . . . . . . . . . . . . . . . . . . . . . . . . . . . . . . . . . . . . . . . . 14Angle-of-Attack and Elevator Change Corrections . . . . . . . . . . . . . . . . . . . . . . . . . . . . . . . . . . . . . 15Approach Speed, Flap Setting, and Sink Rate Effects . . . . . . . . . . . . . . . . . . . . . . . . . . . . . . . . . . . 15Previous Ground Effect Data Comparison . . . . . . . . . . . . . . . . . . . . . . . . . . . . . . . . . . . . . . . . . . . . 20
CONCLUSIONS. . . . . . . . . . . . . . . . . . . . . . . . . . . . . . . . . . . . . . . . . . . . . . . . . . . . . . . . . . . . . . . . . . . .22
REFERENCES . . . . . . . . . . . . . . . . . . . . . . . . . . . . . . . . . . . . . . . . . . . . . . . . . . . . . . . . . . . . . . . . . . . . 23
TABLES Table 1. Physical characteristics of the F-15 aircraft . . . . . . . . . . . . . . . . . . . . . . . . . . . . . . . . . . . . . .5Table 2. Summary of F-15 ground effects landings . . . . . . . . . . . . . . . . . . . . . . . . . . . . . . . . . . . . . . .8Table 3. Calculated changes in aerodynamic coefficients caused by ground
effect (h/b = 0) . . . . . . . . . . . . . . . . . . . . . . . . . . . . . . . . . . . . . . . . . . . . . . . . . . . . . . . . .9Table 4. Summary of data for aircraft used in ground effects correlation . . . . . . . . . . . . . . . . . . . . .20
FIGURESFigure 1. NASA F-15 aircraft performing approach and landing typical of ground
effects testing . . . . . . . . . . . . . . . . . . . . . . . . . . . . . . . . . . . . . . . . . . . . . . . . . . . . . . . . . .2Figure 2. Change in lift and induced drag coefficients caused by ground effect. . . . . . . . . . . . . . . . . .3Figure 3. Ground effects flight test aircraft. . . . . . . . . . . . . . . . . . . . . . . . . . . . . . . . . . . . . . . . . . . . . .4Figure 4. The F-15 landing attitude at an angle of attack of 8° . . . . . . . . . . . . . . . . . . . . . . . . . . . . . .7Figure 5. Time histories of flight data from F-15 ground effects for landing
4 of flight 674. . . . . . . . . . . . . . . . . . . . . . . . . . . . . . . . . . . . . . . . . . . . . . . . . . . . . . . . .10Figure 6. Comparison of change in F-15 pitching moment because of ground effect as a
function of height above the ground. . . . . . . . . . . . . . . . . . . . . . . . . . . . . . . . . . . . . . . .13Figure 7. Error corrections in F-15 noseboom-measured static pressure because of ground
effect. . . . . . . . . . . . . . . . . . . . . . . . . . . . . . . . . . . . . . . . . . . . . . . . . . . . . . . . . . . . . . . .14
III

Figure 8. Change in F-15 lift coefficient because of ground effect as a function of height above the ground. . . . . . . . . . . . . . . . . . . . . . . . . . . . . . . . . . . . . . . . . . . . . . . . . . . . . . . 16
Figure 9. Change in F-15 drag coefficient because of ground effect as a function of height above the ground. . . . . . . . . . . . . . . . . . . . . . . . . . . . . . . . . . . . . . . . . . . . . . . . . . . . . . 17
Figure 10. Change in F-15 pitching moment coefficient caused by ground effect as a function of height above the ground. . . . . . . . . . . . . . . . . . . . . . . . . . . . . . . . . . . . . . . . . . . . . . . 18
Figure 11. Effect of approach speed, flap setting, and sink rate on change in F-15 aerodynamic coefficients caused by ground effect. . . . . . . . . . . . . . . . . . . . . . . . . . . . . . . . . . . . . . . 19
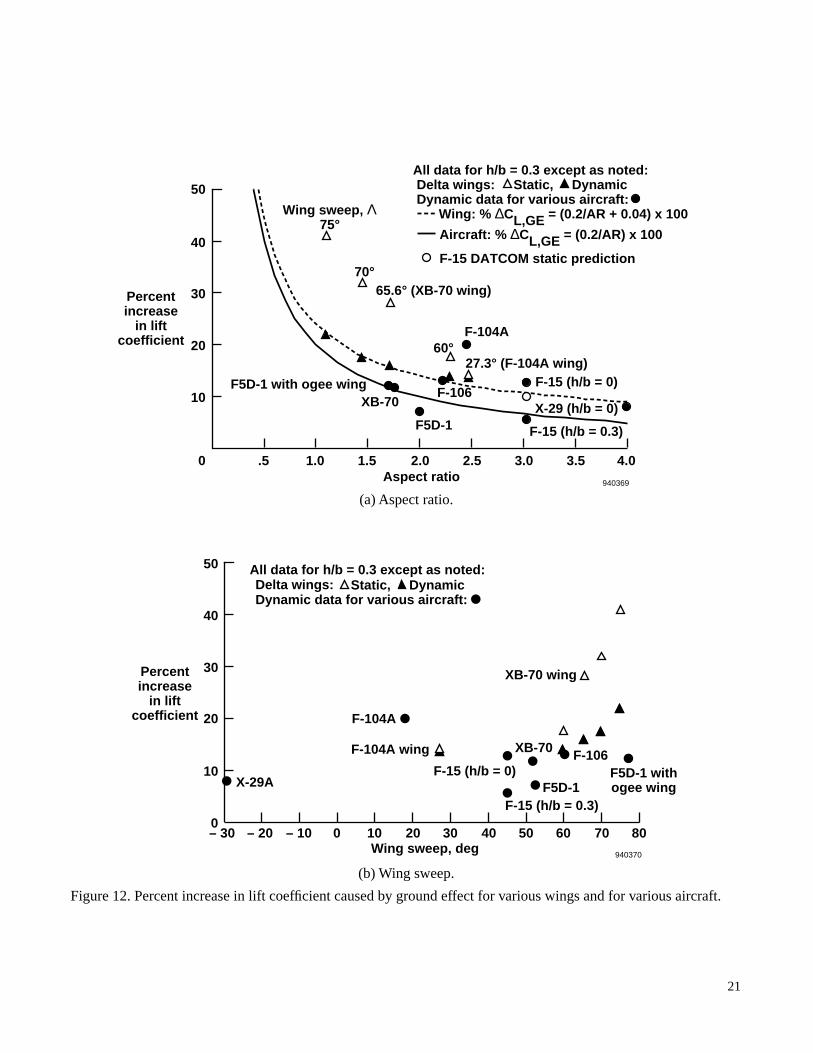
Figure 12. Percent increase in lift coefficient caused by ground effect for various wings and for various aircraft. . . . . . . . . . . . . . . . . . . . . . . . . . . . . . . . . . . . . . . . . . . . . . . . . . . . . . . . 21
IV
ABSTRACT
Flight tests to determine the changes in the aerody-namic characteristics of an F-15 aircraft caused bydynamic ground effects are described. Data wereobtained for low- and high-sink rates between 0.7 and6.5 ft/sec and at two landing approach speeds and flapsettings: 150 kn with the flaps down and 170 kn withthe flaps up. Simple correlation curves are given for thechange in aerodynamic coefficients because of groundeffects as a function of sink rate. Ground effects gener-ally caused an increase in the lift, drag, and nose-downpitching moment coefficients. The change in the liftcoefficient increased from approximately 0.05 at thehigh-sink rate to approximately 0.10 at the low-sinkrate. The change in the drag coefficient increased fromapproximately 0 to 0.03 over this decreasing sink raterange. No significant difference because of theapproach configuration was evident for lift and drag;however, a significant difference in pitching momentwas observed for the two approach speeds and flap set-tings. For the 170 kn with the flaps up configuration,the change in the nose-down pitching momentincreased from approximately –0.008 to –0.016. Forthe 150 kn with the flaps down configuration, thechange was from approximately –0.008 to –0.038.
NOMENCLATURE
AR aspect ratio
aA axial acceleration, ft/sec2
aN normal acceleration, ft/sec2
b wingspan, ft
CAS Control Augmentation System
CA axial force coefficient
CD drag coefficient
CL lift coefficient
CM moment coefficient
CN normal force coefficient
CT thrust coefficient
DATCOM Data Compendium
g acceleration caused by gravity, ft/sec2
h height above ground, ft
sink rate, ft/sech
IX moment of inertia about the aircraftlongitudinal axis, slug-ft
2
IY moment of inertia about the aircraftlateral axis, slug-ft
2
IZ moment of inertia about the aircraft yawaxis, slug-ft
2
IXZ product of inertia, slug-ft2
n number of data points
PCA propulsion-controlled aircraft
PLA power lever angle, deg
p roll rate, deg/sec
q pitch rate, deg/sec
dynamic pressure, lb/ft2
rate of change of pitch rate, deg/sec2
r yaw rate, deg/sec
S wing planform area, ft2
W weight, lb
α angle of attack, deg
∆ change in variable
δ stabilator deflection, deg (negative fordownward deflection)
%∆ percent change in variable
Λ wing sweep, deg
θ pitch attitude, deg
Subscriptsα derivative with respect to angle of
attack, deg–1
δ derivative with respect to stabilatorposition, deg–1
GE ground effect
OGE out of ground effect
uncorr uncorrected for changes in angle-of-attack and stabilator position
INTRODUCTION
Aerodynamic characteristics of an aircraft maysignificantly differ when flying close to the groundrather than when flying up and away.1,2 Recent researchhas also determined that dynamic effects influence
q
q

2
ground effects (GE).3–10 These ground effects maysignificantly impact the performance of aircraft in suchflight phases as takeoff and landing, particularly forautomatic landings. For this reason, such effects needto be thoroughly understood. Significant discrepanciesexist between predicted and measured ground effectsfor many aircraft. Wind-tunnel and flight test tech-niques continue to evolve in an effort to provideaccurate predictions for new aircraft designs.
Recently, NASA Dryden Flight Research Center(NASA Dryden) conducted the propulsion-controlledaircraft (PCA) flight test program.11 The PCA programdeveloped technology for emergency landing of air-craft using collective and differential engine thrust.Assuming that the conventional flight control systemhad been disabled was a basic premise of this program.Flight testing was conducted with the NASA Dryden F-15 flight research aircraft (McDonnell DouglasCorporation, St. Louis, Missouri) (fig. 1). Because thePCA program flew the aircraft to touchdown usingflight control limited to that provided by the engines,knowing the aerodynamic characteristics of the F-15aircraft close to the ground, that is, in ground effect,was important.
Figure 1. NASA F-15 aircraft performing approach andlanding typical of ground effects testing.
Although the F-15 aircraft has been in service formore than 20 years, in-flight dynamic ground effectsdata have never been obtained. For this reason, aground effects flight investigation of the NASADryden F-15 aircraft was conducted for low- andhigh-sink rates, , between 0.8 and 6.5 ft/sec at two
approach speed and flap-setting combinations. Thesecombinations consisted of 150 kn with the flaps down(30° deflection) and 170 kn with the flaps up (0° deflec-tion). The aerodynamic coefficients caused by groundeffects were estimated from the flight data. Theseground effects data were correlated with the aircraftapproach speed, flap setting, and sink rate.
This paper describes the test procedures and resultsfor approaches at 150 kn with the flaps down and170 kn with the flaps up over sink rates from 0.8 to6.5 ft/sec. Results are compared to previous flight testand wind-tunnel ground effects data for various wingsand for complete aircraft.
GROUND EFFECTS BACKGROUND
Ground effects may be explained by the interactionof the aircraft wingtip vortices with the ground. Thisinteraction reduces the strength of these vortices. Theweakened wingtip vortices reduce the wing downwashwhich increases the lift and decreases the induced drag,or drag caused by lift.
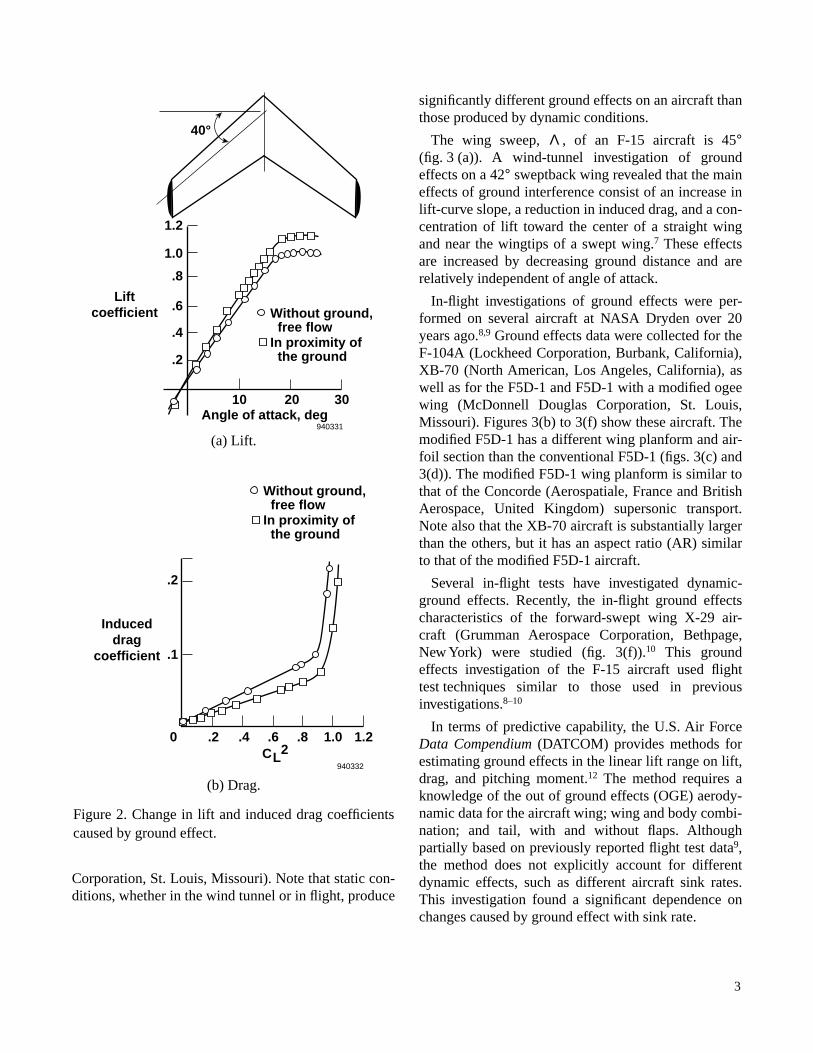
Figures 2(a) and 2(b) show this change for a 40°sweptback wing. In addition, the reduced downwash atthe wing trailing edge increases the angle of attack, ,of the relative wind at the elevator, resulting in a nose-down pitching moment. In a fundamental sense, thechange in downwash near the ground results in adifferent pressure distribution over the wing, tail, andfuselage. This distribution alters the aircraft aerody-namic forces and moments.
Ground effects data can be obtained in the wind tun-nel or in flight. In conventional wind-tunnel groundeffects testing, measurements are taken for a stationaryaircraft model at various fixed ground heights. Theresults are called static ground effects data. Unfortu-nately, this static data simulates the aircraft flying nearthe ground at a constant altitude rather than simulatingthe transient or dynamic effects of the aircraft descend-ing through a given altitude, termed “dynamic” groundeffects data. Ground-based techniques have provedsuccessful in more closely duplicating dynamic effectsby using a model that moves toward a stationary ormoving ground board in the wind tunnel, thereby simu-lating the rate of descent.2–6 Dynamic ground effectswind-tunnel data were obtained for the F-106B(General Dynamics/Convair, Fort Worth, Texas) andthe F-15 Short Take-Off and Landing ManeuverTechnology Demonstrator (McDonnell Douglash
α
(a) Lift.
(b) Drag.
Figure 2. Change in lift and induced drag coefficientscaused by ground effect.
40°
1.2
10
1.0
.8
.6
.4
.2
20 30Angle of attack, deg
940331
Lift coefficient Without ground,
free flowIn proximity of the ground
Induced drag
coefficient
Without ground, free flowIn proximity of the ground
.2
.1
0 .2 .4 .6 .8 1.0 1.2CL
2940332
Corporation, St. Louis, Missouri). Note that static con-ditions, whether in the wind tunnel or in flight, produce
significantly different ground effects on an aircraft thanthose produced by dynamic conditions.
The wing sweep, , of an F-15 aircraft is 45°(fig. 3 (a)). A wind-tunnel investigation of groundeffects on a 42° sweptback wing revealed that the maineffects of ground interference consist of an increase inlift-curve slope, a reduction in induced drag, and a con-centration of lift toward the center of a straight wingand near the wingtips of a swept wing.7 These effectsare increased by decreasing ground distance and arerelatively independent of angle of attack.
In-flight investigations of ground effects were per-formed on several aircraft at NASA Dryden over 20years ago.8,9 Ground effects data were collected for theF-104A (Lockheed Corporation, Burbank, California),XB-70 (North American, Los Angeles, California), aswell as for the F5D-1 and F5D-1 with a modified ogeewing (McDonnell Douglas Corporation, St. Louis,Missouri). Figures 3(b) to 3(f) show these aircraft. Themodified F5D-1 has a different wing planform and air-foil section than the conventional F5D-1 (figs. 3(c) and3(d)). The modified F5D-1 wing planform is similar tothat of the Concorde (Aerospatiale, France and BritishAerospace, United Kingdom) supersonic transport.Note also that the XB-70 aircraft is substantially largerthan the others, but it has an aspect ratio (AR) similarto that of the modified F5D-1 aircraft.
Several in-flight tests have investigated dynamic-ground effects. Recently, the in-flight ground effectscharacteristics of the forward-swept wing X-29 air-craft (Grumman Aerospace Corporation, Bethpage,New York) were studied (fig. 3(f)).10 This groundeffects investigation of the F-15 aircraft used flighttest techniques similar to those used in previousinvestigations.8–10
In terms of predictive capability, the U.S. Air ForceData Compendium (DATCOM) provides methods forestimating ground effects in the linear lift range on lift,drag, and pitching moment.12 The method requires aknowledge of the out of ground effects (OGE) aerody-namic data for the aircraft wing; wing and body combi-nation; and tail, with and without flaps. Althoughpartially based on previously reported flight test data9,the method does not explicitly account for differentdynamic effects, such as different aircraft sink rates.This investigation found a significant dependence onchanges caused by ground effect with sink rate.
Λ
3

(a) F-15A.
(b) F-104A.
28.25 ft (8.61 m)
9.09 ft (2.77 m)
63.75 ft (19.43 m)
42.81 ft (13.05 m)
940333
18.94 ft (5.77 m)
17.8 ft (5.42 m)
52.4 ft (16.0 m)
11.9 ft (3.6 m)
21.9 ft (6.7 m)
13.5 ft (4.1 m)
940334
4
Figure 3. Ground effec
(c) F5D-1.
(d) F5D-1 airplane with modified ogee wing.
33.5 ft (10.2 m)
14.8 ft (4.5 m)
46.8 ft (14.3 m)
940335
33.5 ft (10.2 m)
14.8 ft (4.5 m)
46.8 ft (14.3 m)
940336
ts flight test aircraft.

5
(e) XB-70.
(f) X-29.
Figure 3. Concluded.
Ground line
105 ft (32 m)
185.75 ft (56.62 m)
30 ft (9.1 m)
940337
Strake flap
CanardWing trailing-edge flap
27.20 ft (8.29 m)
48.08 ft (14.66 m)
14.79 ft (4.51 m)
Noseboom
4.33 ft (1.32 m)
940338
AIRCRAFT DESCRIPTION
The NASA Dryden F-15 aircraft was used for theground effects approach and landing tests (figs. 1 and3(a)). Table 1 lists its physical characteristics. In addi-tion, the wing has trailing-edge flaps with a maximumdownward deflection of 30°. No leading-edge devicesexist on the wing.
The NASA Dryden F-15 aircraft is a single-seat, pre-production model of the F-15A that has been modifiedfrom its fighter role to fulfill its function as a flightresearch aircraft. These modifications include remov-ing the weapons systems and installing special flighttest instrumentation and data acquisition equipment.For example, the aircraft is equipped with a noseboomfor airdata measurements, such as angle of attack,angle of sideslip, static pressure, and pitot pressure.This aircraft is powered by two PW1128 low bypassratio, afterburning turbofan engines (Pratt & Whitney,West Palm Beach, Florida). These engines areupgraded versions of the Pratt & Whitney F100 seriesengines. Although modified for flight research, the air-craft is representative of any single-seat F-15 aircraft interms of ground effects evaluation.
Flight Control System
The primary flight control surfaces of the F-15 air-craft consist of conventional, hydraulically actuatedailerons; twin vertical rudders; and horizontal stabila-tors. These control surfaces are capable of symmetricalor differential movements. The hydraulic actuatorsreceive inputs from a hydromechanical system and anelectrical system called the Control Augmentation Sys-tem (CAS). These systems work together duringnormal operation, but either system can independentlyprovide sufficient aircraft control.
Table 1. Physical characteristics of the F-15 aircraft.
Characteristics Dimensions
Wingspan, ft 42.83
Wing planform area, ft2 608
Aspect ratio 3.02
Wing sweep at quarter chord, deg 45
Length, ft 63.75
Height to top of vertical tails, ft 18.67
Empty weight, lb 30,035
Maximum gross weight, lb 40,835
Maximum internal fuel load, lb 10,800
Engines 2
Engine type PW 1128
Installed sea level static thrustper engine, lb 18,000
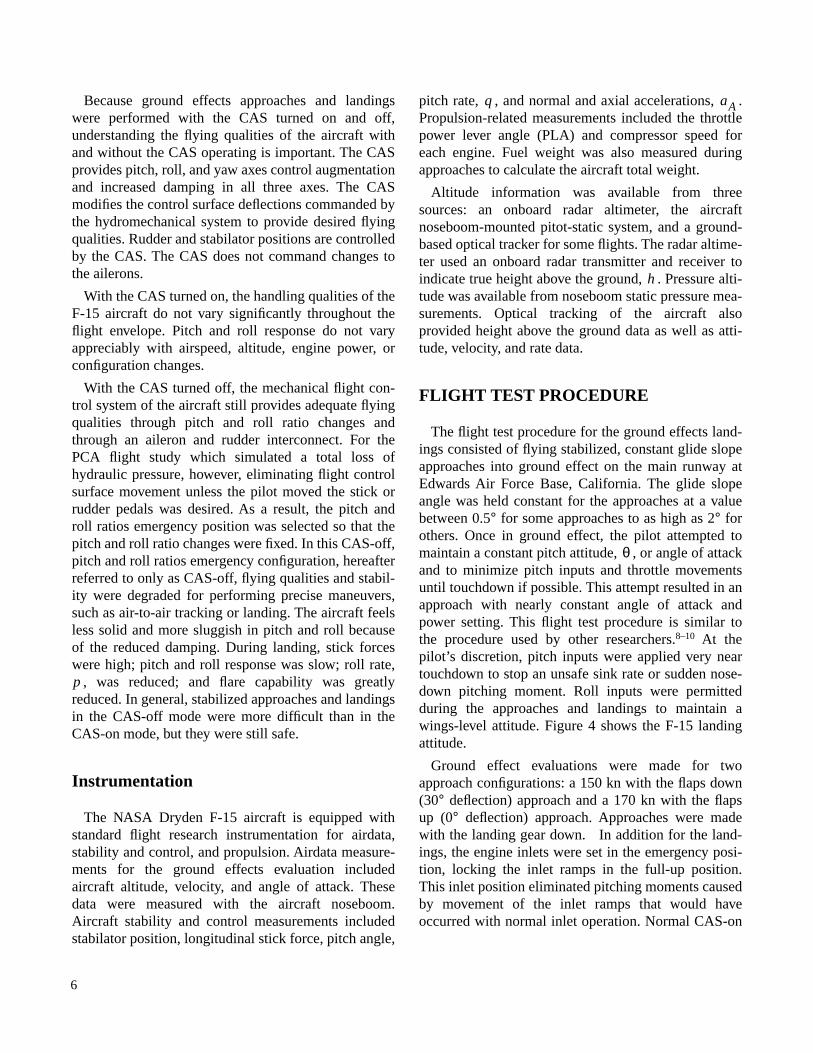
Because ground effects approaches and landingswere performed with the CAS turned on and off,understanding the flying qualities of the aircraft withand without the CAS operating is important. The CASprovides pitch, roll, and yaw axes control augmentationand increased damping in all three axes. The CASmodifies the control surface deflections commanded bythe hydromechanical system to provide desired flyingqualities. Rudder and stabilator positions are controlledby the CAS. The CAS does not command changes tothe ailerons.
With the CAS turned on, the handling qualities of theF-15 aircraft do not vary significantly throughout theflight envelope. Pitch and roll response do not varyappreciably with airspeed, altitude, engine power, orconfiguration changes.
With the CAS turned off, the mechanical flight con-trol system of the aircraft still provides adequate flyingqualities through pitch and roll ratio changes andthrough an aileron and rudder interconnect. For thePCA flight study which simulated a total loss ofhydraulic pressure, however, eliminating flight controlsurface movement unless the pilot moved the stick orrudder pedals was desired. As a result, the pitch androll ratios emergency position was selected so that thepitch and roll ratio changes were fixed. In this CAS-off,pitch and roll ratios emergency configuration, hereafterreferred to only as CAS-off, flying qualities and stabil-ity were degraded for performing precise maneuvers,such as air-to-air tracking or landing. The aircraft feelsless solid and more sluggish in pitch and roll becauseof the reduced damping. During landing, stick forceswere high; pitch and roll response was slow; roll rate,
, was reduced; and flare capability was greatlyreduced. In general, stabilized approaches and landingsin the CAS-off mode were more difficult than in theCAS-on mode, but they were still safe.
Instrumentation
The NASA Dryden F-15 aircraft is equipped withstandard flight research instrumentation for airdata,stability and control, and propulsion. Airdata measure-ments for the ground effects evaluation includedaircraft altitude, velocity, and angle of attack. Thesedata were measured with the aircraft noseboom.Aircraft stability and control measurements includedstabilator position, longitudinal stick force, pitch angle,
p
6
pitch rate, , and normal and axial accelerations, .Propulsion-related measurements included the throttlepower lever angle (PLA) and compressor speed foreach engine. Fuel weight was also measured duringapproaches to calculate the aircraft total weight.
Altitude information was available from threesources: an onboard radar altimeter, the aircraftnoseboom-mounted pitot-static system, and a ground-based optical tracker for some flights. The radar altime-ter used an onboard radar transmitter and receiver toindicate true height above the ground, . Pressure alti-tude was available from noseboom static pressure mea-surements. Optical tracking of the aircraft alsoprovided height above the ground data as well as atti-tude, velocity, and rate data.
FLIGHT TEST PROCEDURE
The flight test procedure for the ground effects land-ings consisted of flying stabilized, constant glide slopeapproaches into ground effect on the main runway atEdwards Air Force Base, California. The glide slopeangle was held constant for the approaches at a valuebetween 0.5° for some approaches to as high as 2° forothers. Once in ground effect, the pilot attempted tomaintain a constant pitch attitude, , or angle of attackand to minimize pitch inputs and throttle movementsuntil touchdown if possible. This attempt resulted in anapproach with nearly constant angle of attack andpower setting. This flight test procedure is similar tothe procedure used by other researchers.8–10 At thepilot’s discretion, pitch inputs were applied very neartouchdown to stop an unsafe sink rate or sudden nose-down pitching moment. Roll inputs were permittedduring the approaches and landings to maintain awings-level attitude. Figure 4 shows the F-15 landingattitude.
Ground effect evaluations were made for twoapproach configurations: a 150 kn with the flaps down(30° deflection) approach and a 170 kn with the flapsup (0° deflection) approach. Approaches were madewith the landing gear down. In addition for the land-ings, the engine inlets were set in the emergency posi-tion, locking the inlet ramps in the full-up position.This inlet position eliminated pitching moments causedby movement of the inlet ramps that would haveoccurred with normal inlet operation. Normal CAS-on
q aA
h
θ
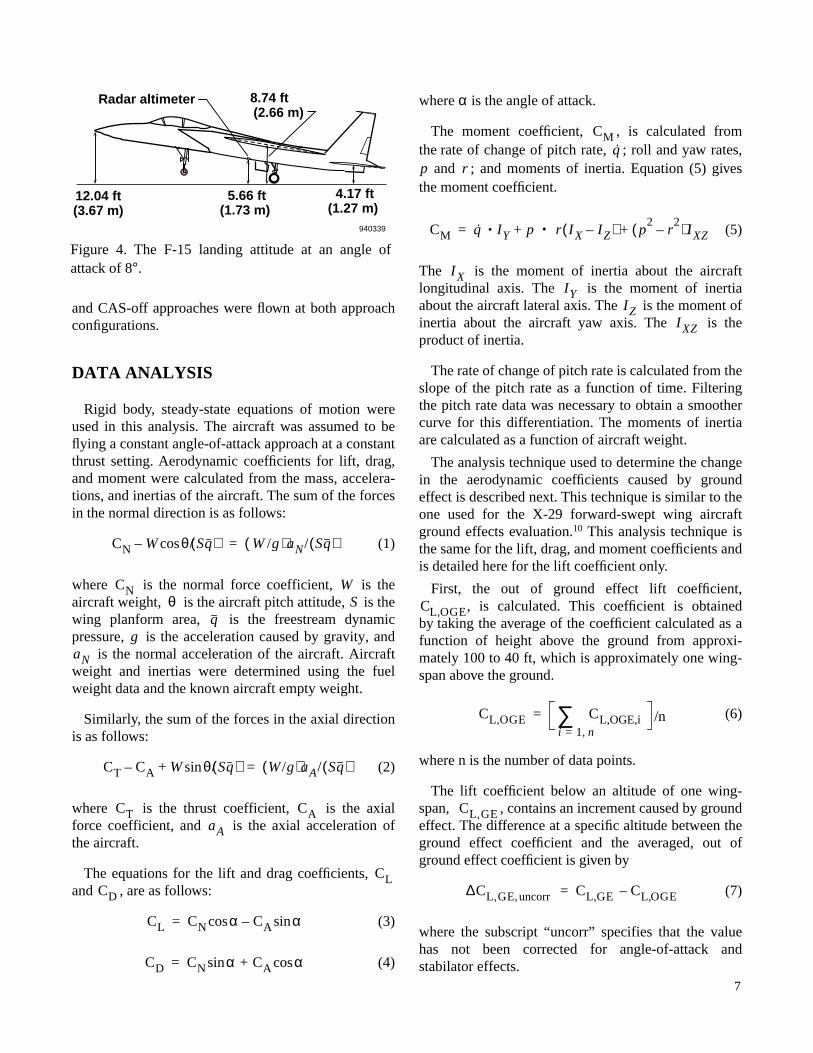
Figure 4. The F-15 landing attitude at an angle ofattack of 8°.
5.66 ft (1.73 m)
8.74 ft (2.66 m)
4.17 ft (1.27 m)
12.04 ft (3.67 m)
Radar altimeter
940339
and CAS-off approaches were flown at both approachconfigurations.
DATA ANALYSIS
Rigid body, steady-state equations of motion wereused in this analysis. The aircraft was assumed to beflying a constant angle-of-attack approach at a constantthrust setting. Aerodynamic coefficients for lift, drag,and moment were calculated from the mass, accelera-tions, and inertias of the aircraft. The sum of the forcesin the normal direction is as follows:
(1)
where is the normal force coefficient, is theaircraft weight, is the aircraft pitch attitude, is thewing planform area, is the freestream dynamicpressure, is the acceleration caused by gravity, and
is the normal acceleration of the aircraft. Aircraftweight and inertias were determined using the fuelweight data and the known aircraft empty weight.
Similarly, the sum of the forces in the axial directionis as follows:
(2)
where is the thrust coefficient, is the axialforce coefficient, and is the axial acceleration ofthe aircraft.
The equations for the lift and drag coefficients, and , are as follows:
(3)
(4)
CN W θ/ Sq( )cos– W /g( )aN / Sq( )=
CN Wθ S
qg
aN
CT CA W θ/ Sq( )sin+– W /g( )aA/ Sq( )=
CT CAaA
CLCD
CL CN α CA αsin–cos=
CD CN α + CA αcossin=
7
where α is the angle of attack.
The moment coefficient, , is calculated fromthe rate of change of pitch rate, ; roll and yaw rates,
and ; and moments of inertia. Equation (5) givesthe moment coefficient.
· · (5)
The is the moment of inertia about the aircraftlongitudinal axis. The is the moment of inertiaabout the aircraft lateral axis. The is the moment ofinertia about the aircraft yaw axis. The is theproduct of inertia.
The rate of change of pitch rate is calculated from theslope of the pitch rate as a function of time. Filteringthe pitch rate data was necessary to obtain a smoothercurve for this differentiation. The moments of inertiaare calculated as a function of aircraft weight.
The analysis technique used to determine the changein the aerodynamic coefficients caused by groundeffect is described next. This technique is similar to theone used for the X-29 forward-swept wing aircraftground effects evaluation.10 This analysis technique isthe same for the lift, drag, and moment coefficients andis detailed here for the lift coefficient only.
First, the out of ground effect lift coefficient,, is calculated. This coefficient is obtained
by taking the average of the coefficient calculated as afunction of height above the ground from approxi-mately 100 to 40 ft, which is approximately one wing-span above the ground.
(6)
where n is the number of data points.
The lift coefficient below an altitude of one wing-span, , contains an increment caused by groundeffect. The difference at a specific altitude between theground effect coefficient and the averaged, out ofground effect coefficient is given by
(7)
where the subscript “uncorr” specifies that the valuehas not been corrected for angle-of-attack andstabilator effects.
CMq
p r
CM q= IY p+ r IX IZ–( ) p2
r2
–( )IXZ+
IXIY
IZIXZ
CL OGE,
CL OGE, C L,OGE,ii 1 n,=∑ /n=
CL GE,
∆CL GE uncorr,, CL GE, CL OGE,–=

This increment caused by ground effect is calculatedas a function of height above the ground from a heightof approximately one wingspan to the ground. In calcu-lating the difference in the lift coefficients, the thrustand weight terms are assumed to be constant for themaneuver. As a result, the thrust and weight terms inequations (1) and (2) cancel out, allowing the axial andnormal force coefficients to be calculated from theaircraft accelerations.
Ideally by maintaining a constant pitch attitude, thechanges in the aerodynamic coefficients are limited tothose resulting from ground effect. On the other handduring flight, turbulence and necessary pitch inputs bythe pilot to maintain a constant pitch attitude in groundeffect resulted in unwanted influences caused by thestabilator moving and the angle of attack changing. Asa result, subtracting the stabilator and angle-of-attackeffects from the ground effect coefficients wasnecessary.
For example, the lift coefficient was corrected usingequation (8).
(8)
where is the lift coefficient caused byground effect uncorrected for stabilator movement andangle-of-attack change. The and are thechanges in angle-of-attack and stabilator position. The
and are the derivatives of the out of groundeffect lift coefficient with respect to angle-of-attackand stabilator position. Stabilator deflection, , isnegative for downward deflection.
Values for and were obtained from thedatabase used in the NASA Dryden F-15-piloted flightsimulator. Although these derivatives are themselves afunction of angle-of-attack and stabilator position, thelift and moment derivatives are relatively constant forthe range of angle-of-attack and stabilator positionsused in the ground effect approaches and landings. Itwas also assumed that these aerodynamic derivativeswere not affected by or changed because of groundeffect. The nominal angle-of-attack and stabilatorposition used to define the lift and moment coefficient
∆CL GE, ∆CL GE uncorr,, CL α, ∆αGE–=
CL δ, ∆δGE–
CL GE,uncorr,
∆αGE ∆δGE
CL α, CL δ,
δ
CL α, CL δ,
8
derivatives were 8° and –5°. Values used for and were 0.065 and 0.005/deg. Values used for and were –0.0021 and –0.00072/deg.
The drag coefficient derivative with respect to stabila-tor position, , was zero. The derivative withrespect to angle of attack, , was calculated as afunction of angle of attack.
The change in angle of attack while in ground effectis calculated using equation (9).
(9)
where is the out of ground effect angle of attackof the aircraft, averaged from approximately 100 ft to aheight of one wingspan (40 ft) above the runway. The
is the aircraft angle of attack calculated in groundeffect, below 40 ft. The same procedure is used tocalculate the change in stabilator position. A computercode was written that followed the analysis describedby this procedure. The flight data were processed withthis code to obtain the corrections to the aerodynamiccoefficients caused by ground effect.
RESULTS AND DISCUSSION
The F-15 ground effects data were obtained for 24landings during 7 flights (tables 2 and 3). Twelve land-ings occurred in the flaps down, 150-kn configuration.In addition,12 landings occurred in the flaps up, 170-knconfiguration. The CAS was turned off for 16 landingsand turned on for 8 landings. Approaches were flownwith the landing gear down. The approaches andlandings were flown by three test pilots.
Table 2. Summary of F-15 ground effects landings.
Ground Flight Landingseffects test 150 kn, 170 kn, CASflight mission flaps down flaps up status
1 670 2 2 Off
2 671 2 2 Off
3 672 1 1 On
4 673 2 2 On
5 674 2 2 On
6 675 1 1 On
7 685 2 2 Off
CL α,CL δ,CM α, CM δ,
CD δ,CD α,
∆αGE αGE αOGE–=
αOGE
αGE
9
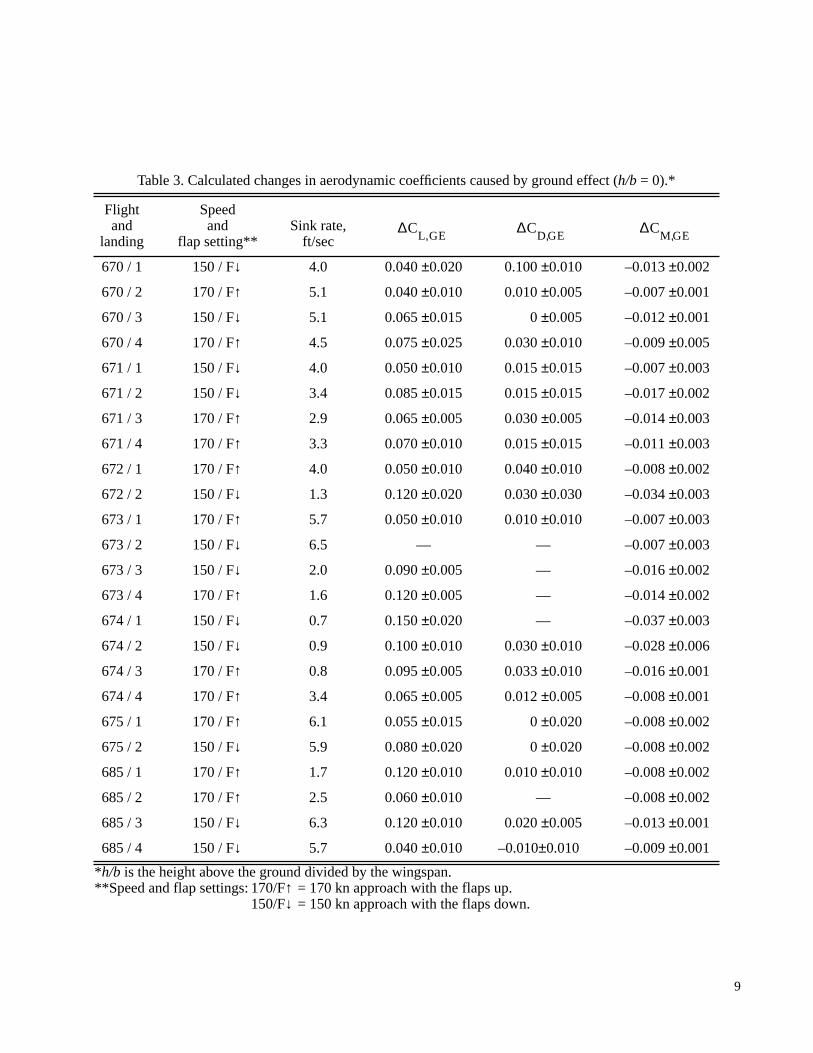
*h/b is the height above the ground divided by the wingspan.**Speed and flap settings: 170/F↑ = 170 kn approach with the flaps up.
150/F↓ = 150 kn approach with the flaps down.
Table 3. Calculated changes in aerodynamic coefficients caused by ground effect (h/b = 0).*
Flightand
landing
Speed and
flap setting**Sink rate,
ft/sec
670 / 1 150 / F↓ 4.0 0.040 ±0.020 0.100 ±0.010 –0.013 ±0.002
670 / 2 170 / F↑ 5.1 0.040 ±0.010 0.010 ±0.005 –0.007 ±0.001
670 / 3 150 / F↓ 5.1 0.065 ±0.015 0 ±0.005 –0.012 ±0.001
670 / 4 170 / F↑ 4.5 0.075 ±0.025 0.030 ±0.010 –0.009 ±0.005
671 / 1 150 / F↓ 4.0 0.050 ±0.010 0.015 ±0.015 –0.007 ±0.003
671 / 2 150 / F↓ 3.4 0.085 ±0.015 0.015 ±0.015 –0.017 ±0.002
671 / 3 170 / F↑ 2.9 0.065 ±0.005 0.030 ±0.005 –0.014 ±0.003
671 / 4 170 / F↑ 3.3 0.070 ±0.010 0.015 ±0.015 –0.011 ±0.003
672 / 1 170 / F↑ 4.0 0.050 ±0.010 0.040 ±0.010 –0.008 ±0.002
672 / 2 150 / F↓ 1.3 0.120 ±0.020 0.030 ±0.030 –0.034 ±0.003
673 / 1 170 / F↑ 5.7 0.050 ±0.010 0.010 ±0.010 –0.007 ±0.003
673 / 2 150 / F↓ 6.5 — — –0.007 ±0.003
673 / 3 150 / F↓ 2.0 0.090 ±0.005 — –0.016 ±0.002
673 / 4 170 / F↑ 1.6 0.120 ±0.005 — –0.014 ±0.002
674 / 1 150 / F↓ 0.7 0.150 ±0.020 — –0.037 ±0.003
674 / 2 150 / F↓ 0.9 0.100 ±0.010 0.030 ±0.010 –0.028 ±0.006
674 / 3 170 / F↑ 0.8 0.095 ±0.005 0.033 ±0.010 –0.016 ±0.001
674 / 4 170 / F↑ 3.4 0.065 ±0.005 0.012 ±0.005 –0.008 ±0.001
675 / 1 170 / F↑ 6.1 0.055 ±0.015 0 ±0.020 –0.008 ±0.002
675 / 2 150 / F↓ 5.9 0.080 ±0.020 0 ±0.020 –0.008 ±0.002
685 / 1 170 / F↑ 1.7 0.120 ±0.010 0.010 ±0.010 –0.008 ±0.002
685 / 2 170 / F↑ 2.5 0.060 ±0.010 — –0.008 ±0.002
685 / 3 150 / F↓ 6.3 0.120 ±0.010 0.020 ±0.005 –0.013 ±0.001
685 / 4 150 / F↓ 5.7 0.040 ±0.010 –0.010±0.010 –0.009 ±0.001
∆CL GE, ∆C
D GE, ∆CM GE,

Figure 5 shows an example time history for anapproach for landing 4 of flight 674. The approach wasat 170 kn with the flaps up and the CAS turned on. Thisexample represents one of the best approaches andlandings flown during the test program. The averagevalues of the parameters calculated out of ground effect(OGE average) are also shown.
Figure 5(a) shows the radar altitude as a function oftime. Note that touchdown is at a radar altitude ofapproximately 6 ft (time of approximately 23 sec), theheight above the ground of the radar altimeter in theaircraft at touchdown (fig. 4). The actual height abovethe ground of the aircraft wing at touchdown wasapproximately 9 ft (fig. 4). The height above the groundof the radar altimeter at touchdown was subtractedfrom these data so that the height above the ground attouchdown was zero.
Figure 5(b) shows airspeed as a function of time. Theapproach is very stable with a constant airspeed ofapproximately 166 kn. This approach is ideal becauseno power changes were required and few stabilatorposition changes were needed (figs. 5(c) through 5(e).Figure 5(c) shows that the engine is nearly idle ata constant compressor speed of approximately10,900 rpm to beyond touchdown. The pilot did notmake any pitch inputs from approximately 30 ft abovethe ground to touchdown, as shown by the zero longitu-dinal stick force in figure 5(d). The left and right stabi-lator positions in figure 5(e) and the pitch rate in figure5(f) are fairly constant until approximately 20 ft abovethe ground (time of approximately 18 sec), where a
10
(a) Radar
Figure 5. Time histories of flight data from F-
continuous increase in the pitch rate because of groundeffect is seen along with the compensating, downwarddeflection of the stabilators.
Below approximately 20 ft, some differential deflec-tion of the stabilators occurs as the pilot compensatesfor roll upsets using lateral stick to maintain a wings-level attitude, and the CAS acts to counter the nose-down pitching moment. Figure 5(g) shows a stabilized,very shallow flightpath angle, or glide slope, of approx-imately –1.2°. A constant angle of attack of approxi-mately 10° is shown in figure 5(h) until approximately20 ft above the ground. At 20 ft, or approximately one-half the wingspan, the nose of the aircraft pitches downand the angle of attack decreases because of groundeffect. Figure 5(i) shows the aircraft pitch attitude. Thepitch is nearly constant at approximately 9.7° withsome small oscillations before the pitch down occurs atapproximately 20 ft.
Pilots’ Comments
As expected, pilots commented that the approachesand landings were more difficult to fly “hands off”when the air was turbulent. Roll upsets could usuallybe corrected by the pilot without applying pitch inputs.The CAS-off approaches were difficult to fly, espe-cially in turbulence. The aircraft short period longitudi-nal oscillation was difficult to damp with the CAS-offmode.
altitude.
15 ground effects for landing 4 of flight 674.

11
(d) Longitudinal stick force.
Figure 5. Continued.

12
(g) Flightpath angle.
Figure 5. Continued.

(i) Pitch attitude.
Table 5. Concluded.
Figures 6 shows the effects of flying the approachwith the CAS turned on and with CAS turned off. Thechange in the moment coefficient because of groundeffect is plotted as a function of height above theground. The CAS-off approach is less dampedlongitudinally, resulting in a short period of oscillationduring the approach. In general, CAS-on flight dataprovided a better estimate of the change in the aerody-namic coefficients than the CAS-off flight data.
(a) Control augmentation system turned on.
∆CM,GE
.010
.0050
–.005–.010
100 20 30 40 6050 Height above ground, ft
70 1009080
940349
13
(b) Control augmentation system turned off.
Figure 6. Comparison of change in F-15 pitchingmoment because of ground effect as a function ofheight above the ground.
The pilots generally felt a moderate to significantpitch down of the nose of the aircraft in ground effect.Sometimes the pilot had to apply brisk aft stickmotions to prevent damaging the aircraft. In instances
∆CM,GE
.010
.0050
–.005–.010–.015
–.020100 20 30 40 6050
Height above ground, ft70 1009080
940350

1
where the approach was very stabilized “hands off”and the sink rate was very low, the pilots exper-ienced significant “float” in ground effect. In addi-tion, touchdown sometimes required forward stickmotions.
Noseboom Pressure Corrections
Again for landing 4 of flight 674, figure 7 showsthe error in the noseboom-measured static pressurebecause of ground effect. These errors are defined asthe difference between the value from the noseboom-measured pressure and the value using the actualstatic pressure. The error in the pressure altitudededuced from the noseboom static pressure, ,was plotted as a function of height above the ground
∆hGE
4
(a) Pressur
(b) Static
Figure 7. Error corrections in F-15 noseboom-m
–10
–5
0
5
3020100Height
∆hGE, ft
–1.0
– .5
0
.5
3020100Height
∆pGE,
lb/ft2
(fig. 7(a)). The noseboom pressure altitude has anerror because of ground effect of approximately 6.5ft at touchdown. This pressure altitude error is typicalof noseboom systems and was not critical to thisinvestigation because radar or optically measuredaltitudes were used for height above the ground data.
On the other hand, noseboom-derived static anddynamic pressure errors could be important incalculating ground effect aerodynamic coefficients.Figures 7(b) and 7(c) show the errors because ofground effect for the noseboom static and dynamicpressures, and . At touchdown, thestatic and dynamic pressure errors are approximately0.5 and 0.025 lb/ft
2. These values were typical for the
landings analyzed. Although these errors were small,dynamic pressure correction was applied to theseflight data.
∆ pGE ∆qGE
e altitude.
pressure.
easured static pressure because of ground effect.
908070605040 above ground, ft
940351
908070605040 above ground, ft
940352
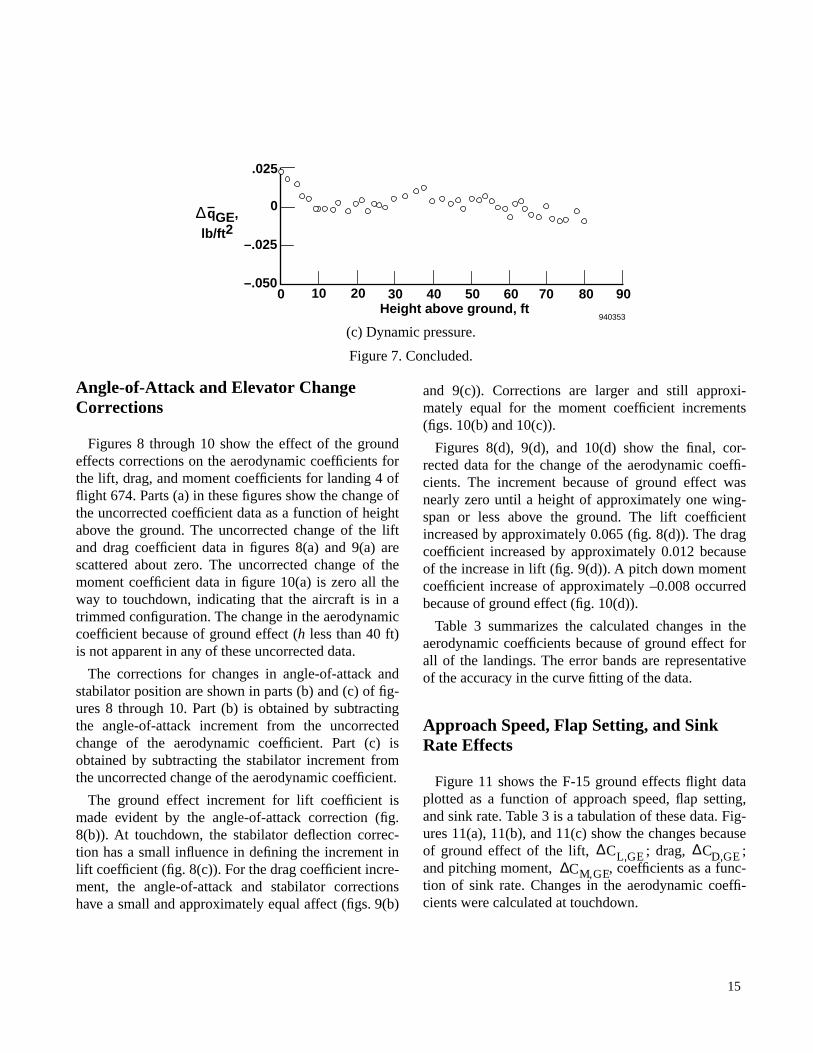
(c) Dynamic pressure.
Figure 7. Concluded.
–.050
–.025
0
.025
9080706050403020100Height above ground, ft
940353
∆qGE,
lb/ft2
Angle-of-Attack and Elevator Change Corrections
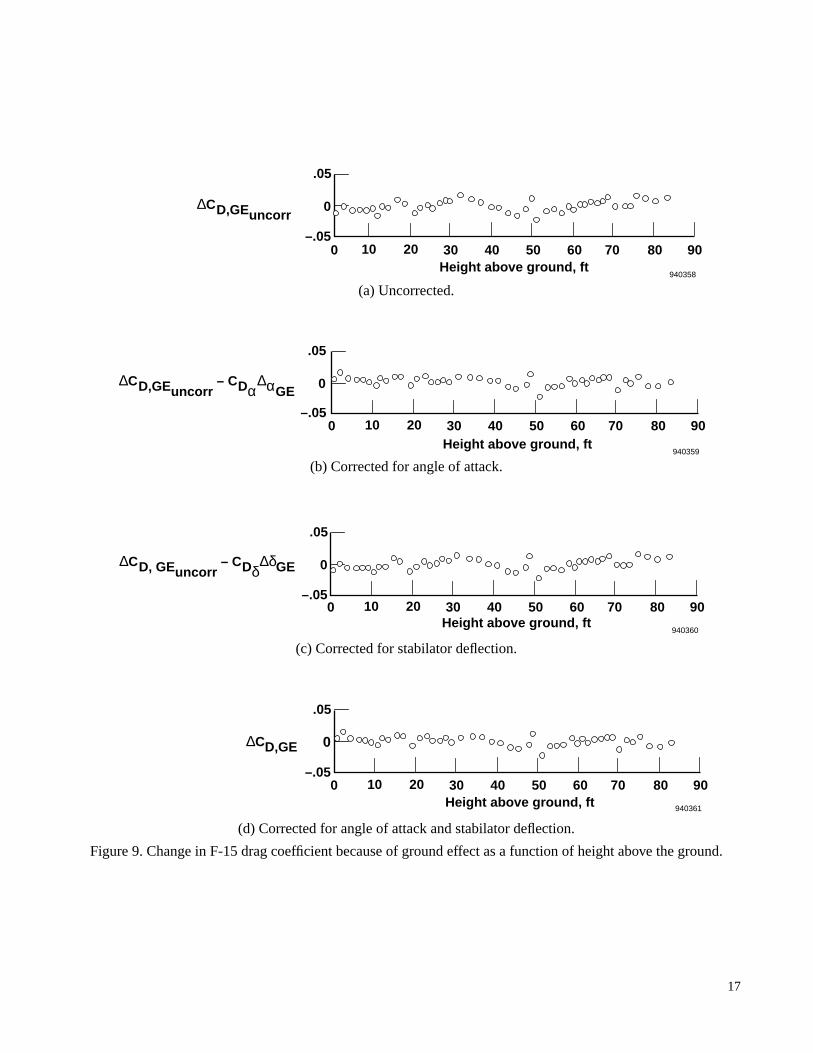
Figures 8 through 10 show the effect of the groundeffects corrections on the aerodynamic coefficients forthe lift, drag, and moment coefficients for landing 4 offlight 674. Parts (a) in these figures show the change ofthe uncorrected coefficient data as a function of heightabove the ground. The uncorrected change of the liftand drag coefficient data in figures 8(a) and 9(a) arescattered about zero. The uncorrected change of themoment coefficient data in figure 10(a) is zero all theway to touchdown, indicating that the aircraft is in atrimmed configuration. The change in the aerodynamiccoefficient because of ground effect (h less than 40 ft)is not apparent in any of these uncorrected data.
The corrections for changes in angle-of-attack andstabilator position are shown in parts (b) and (c) of fig-ures 8 through 10. Part (b) is obtained by subtractingthe angle-of-attack increment from the uncorrectedchange of the aerodynamic coefficient. Part (c) isobtained by subtracting the stabilator increment fromthe uncorrected change of the aerodynamic coefficient.
The ground effect increment for lift coefficient ismade evident by the angle-of-attack correction (fig.8(b)). At touchdown, the stabilator deflection correc-tion has a small influence in defining the increment inlift coefficient (fig. 8(c)). For the drag coefficient incre-ment, the angle-of-attack and stabilator correctionshave a small and approximately equal affect (figs. 9(b)
and 9(c)). Corrections are larger and still approxi-mately equal for the moment coefficient increments(figs. 10(b) and 10(c)).
Figures 8(d), 9(d), and 10(d) show the final, cor-rected data for the change of the aerodynamic coeffi-cients. The increment because of ground effect wasnearly zero until a height of approximately one wing-span or less above the ground. The lift coefficientincreased by approximately 0.065 (fig. 8(d)). The dragcoefficient increased by approximately 0.012 becauseof the increase in lift (fig. 9(d)). A pitch down momentcoefficient increase of approximately –0.008 occurredbecause of ground effect (fig. 10(d)).
Table 3 summarizes the calculated changes in theaerodynamic coefficients because of ground effect forall of the landings. The error bands are representativeof the accuracy in the curve fitting of the data.
Approach Speed, Flap Setting, and Sink Rate Effects
Figure 11 shows the F-15 ground effects flight dataplotted as a function of approach speed, flap setting,and sink rate. Table 3 is a tabulation of these data. Fig-ures 11(a), 11(b), and 11(c) show the changes becauseof ground effect of the lift, ; drag, ;and pitching moment, , coefficients as a func-tion of sink rate. Changes in the aerodynamic coeffi-cients were calculated at touchdown.
∆CL GE, ∆CD GE,∆CM GE,
15

16
(a) Uncorrected.
(b) Corrected for angle of attack.
(c) Corrected for stabilator deflection.
(d) Corrected for angle of attack and stabilator deflection.
Figure 8. Change in F-15 lift coefficient because of ground effect as a function of height above the ground.
0 10 20 30 40 50 60 70 80 90Height above ground, ft
.05
0
– .05
940354
∆CL,GEuncorr
.10
0 10 20 30 40 50 60 70 80 90Height above ground, ft
.05
0
– .05
940355
.10
∆CL,GEuncorr – CLα∆αGE
0 10 20 30 40 50 60 70 80 90Height above ground, ft
.05
0
– .05
940356
.10
∆CL,GEuncorr – CLδ∆δGE
0 10 20 30 40 50 60 70 80 90Height above ground, ft
.05
0
– .05
940357
.10
∆CL,GE
17
(a) Uncorrected.
(b) Corrected for angle of attack.
(c) Corrected for stabilator deflection.
(d) Corrected for angle of attack and stabilator deflection.
Figure 9. Change in F-15 drag coefficient because of ground effect as a function of height above the ground.
0
.05
9080706050403020100Height above ground, ft
940358
∆CD,GEuncorr
–.05
–.05
0
.05
9080706050403020100Height above ground, ft
940359
∆CD,GEuncorr – CDα
∆αGE
0
.05
9080706050403020100Height above ground, ft
940360
∆CD, GEuncorr – CDδ
∆δGE
–.05
0
.05
9080706050403020100Height above ground, ft 940361
∆CD,GE
–.05

18
(a) Uncorrected.
(b) Corrected for angle of attack.
(c) Corrected for stabilator deflection.
(d) Corrected for angle of attack and stabilator deflection.
Figure 10. Change in F-15 pitching moment coefficient caused by ground effect as a function of height above theground.
0 10 20 30 40 50 60 70 80 90Height above ground, ft
.005
0
– .005
940362
∆CM,GEuncorr
0 10 20 30 40 50 60 70 80 90Height above ground, ft
.005
0
– .005
940363
∆CM,GEuncorr – CMα∆αGE
0 10 20 30 40 50 60 70 80 90Height above ground, ft
.005
0
– .005
940364
∆CM,GEuncorr – CMδ∆δGE
0 10 20 30 40 50 60 70 80 90Height above ground, ft
.005
0
– .005
940365
∆CM,GE
– .010

19
(a) Lift.
(b) Drag.
(c) Moment.
.20
.15
.10
.05
0 7654321Sink rate, ft/sec
∆CL,GE
940366
F-15 flight data, gear down170 kn, flaps up 150 kn, flaps down ∆CL,GE = 0.2/(1 + h) + 0.02
.
.15
.10
.05
0
0 7654321Sink rate, ft/sec
∆CD,GE
940367
F-15 flight data, gear down170 kn, flaps up 150 kn, flaps down ∆CD,GE = 0.035 – 0.005 h
.
–.05
0
–.01
–.02
–.04
0 7654321Sink rate, ft/sec
∆CM,GE
940368
F-15 flight data, gear down170 kn, flaps up 150 kn, flaps down ∆CM,GE = – 0.035/(1 + h) ∆CM,GE = – 0.06/(1 + h)
.
–.05
–.03
.
Figure 11. Effect of approach speed, flap setting, andsink rate on change in F-15 aerodynamic coefficientscaused by ground effect.
Two approach speed and flap-setting combinationswere flown: 150 kn with the flaps down (30° deflec-tion) and 170 kn with the flaps up (0° deflection). Thesink rate varied because of several factors. The primarycontributors being pilot technique and atmospheric tur-bulence. Sink rates ranged from 0.7 (42 ft/min) to6.5 ft/sec (390 ft/min). For reference, the F-15 landinggear has a maximum sink rate capability of approxi-mately 10 ft/sec (600 ft/min).
In general, figure 11 shows that ground effectbecomes increasingly significant as sink rate decreases.The changes in the lift coefficient (fig. 11(a)) and thenose-down pitching moment (fig. 11(c)) increase withdecreasing sink rate. These data also show that thechanges because of ground effect decreases andapproaches zero as the sink rate increases. The changein the lift coefficient more than doubles from approxi-mately 0.05 to over 0.1 as the sink rate decreasestoward zero. The change in the nose-down pitchingmoment coefficient doubles from –0.008 to –0.016 forthe 170 kn with the flaps up configuration and morethan quadruples from –0.008 to –0.038 for the 150 knwith the flaps down configuration as the sink rate variesfrom the maximum to the minimum values.
The trends are not as clear for the drag coefficient(fig. 11(b)). The change in drag increased with decreas-ing sink rate from 0 to approximately 0.03. The largeincrease in drag at a sink rate of approximately 4 ft/secmay result from data scatter because of the greater sen-sitivity of calculating the small change in the drag forcecaused by ground effect.
Figure 11 also shows that the 150 kn with the flapsdown approach results in significant ground effects.This difference is most apparent for pitching moment(fig. 11(c)). Here, the 150 kn with the flaps downvalues are approximately twice that of the 170 kn withthe flaps up values at the lower sink rates. This increasemay result from a camber effect because of the flapsbeing down.
The camber effect may be explained as follows: Ingeneral, ground effect reduces the downwash at the tail,hence the effective, local angle of attack increaseswhich cause an increase in the lift at the tail. Thisincrease in lift at the tail results in an increase in nose-down pitching moment for both approach configura-tions. For a highly cambered airfoil, such as a flappedwing, or a wing at high angle of attack, pronouncedloss of lift because of ground effect relative to the
uncambered wing occurs.2 If the center of pressure ofthe wing is ahead of the aircraft center of gravity, thisloss of lift on the main wing produces an increase in thenose-down pitching moment. This difference in lift isnot evident in figure 11(a), but a marked increase in thenose-down pitching moment is seen in figure 11(c) forthe 150 kn with the flaps down configuration versus the170 kn with the flaps up configuration.
In addition, figure 11 shows simple correlationcurves that have been fit through the ground effectsdata. These curves give the change in lift, drag, andpitching moment coefficients because of ground effectas a function of sink rate. The equations for the changein lift, drag, and moment are given next. Equation (10)applies to changes in lift.
(10)
Equation (11) applies to changes in drag.
(11)
Equation (12) applies to changes in moment for the 150kn with flaps down configuration.
(12)
Equation (13) applies to the changes in moment for the
∆CL GE, 0.2 / 1 h+( ) 0.02+=
∆CD GE, 0.035 – 0.005h=
∆CM GE, 0.06 / 1 h+( )–=
20
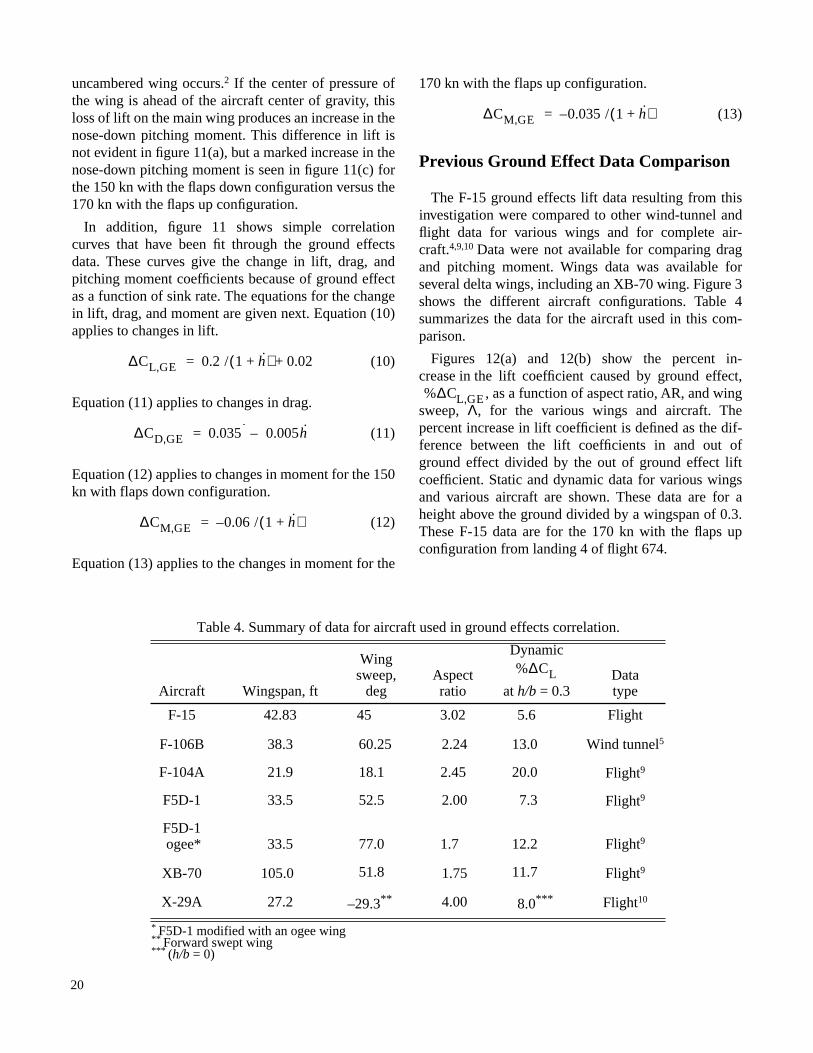
* F5D-1 modified with an ogee wing** Forward swept wing*** (h/b = 0)
Table 4. Summary of data for aircraf
Aircraft Wingspan, ft
Wingsweep,
deg
F-15 42.83 45
F-106B 38.3 60.25
F-104A 21.9 18.1
F5D-1 33.5 52.5
F5D-1 ogee* 33.5 77.0
XB-70 105.0 51.8
X-29A 27.2 –29.3**
170 kn with the flaps up configuration.
(13)
Previous Ground Effect Data Comparison
The F-15 ground effects lift data resulting from thisinvestigation were compared to other wind-tunnel andflight data for various wings and for complete air-craft.4,9,10 Data were not available for comparing dragand pitching moment. Wings data was available forseveral delta wings, including an XB-70 wing. Figure 3shows the different aircraft configurations. Table 4summarizes the data for the aircraft used in this com-parison.
Figures 12(a) and 12(b) show the percent in-crease in the lift coefficient caused by ground effect,
, as a function of aspect ratio, AR, and wingsweep, Λ, for the various wings and aircraft. Thepercent increase in lift coefficient is defined as the dif-ference between the lift coefficients in and out ofground effect divided by the out of ground effect liftcoefficient. Static and dynamic data for various wingsand various aircraft are shown. These data are for aheight above the ground divided by a wingspan of 0.3.These F-15 data are for the 170 kn with the flaps upconfiguration from landing 4 of flight 674.
∆CM GE, 0.035 / 1 h+( )–=
%∆CL GE,
t used in ground effects correlation.
Aspect ratio
Dynamic
at h/b = 0.3Data type
3.02 5.6 Flight
2.24 13.0 Wind tunnel5
2.45 20.0 Flight9
2.00 7.3 Flight9
1.7 12.2 Flight9
1.75 11.7 Flight9
4.00 8.0*** Flight10
%∆CL
21
(a) Aspect ratio.
(b) Wing sweep.
Figure 12. Percent increase in lift coefficient caused by ground effect for various wings and for various aircraft.
50
40
30
20
10
Percent increase
in lift coefficient
4.03.53.02.52.01.51.0.50Aspect ratio
XB-70
F5D-1
F-106
F-104A60°
70°
Wing sweep, Λ 75°
65.6° (XB-70 wing)
F5D-1 with ogee wing
All data for h/b = 0.3 except as noted: Delta wings: Static, Dynamic Dynamic data for various aircraft: Wing: % ∆CL,GE = (0.2/AR + 0.04) x 100
X-29 (h/b = 0)
27.3° (F-104A wing)F-15 (h/b = 0)
F-15 (h/b = 0.3)
Aircraft: % ∆CL,GE = (0.2/AR) x 100 F-15 DATCOM static prediction
940369
50
40
30
20
10
0
Percent increase
in lift coefficient
80706050403020100– 10– 20– 30Wing sweep, deg
All data for h/b = 0.3 except as noted: Delta wings: Static, Dynamic Dynamic data for various aircraft:
XB-70 wing
F-104A wing
X-29AF-15 (h/b = 0)
F-15 (h/b = 0.3)
F-106F5D-1 with ogee wingF5D-1
XB-70
F-104A
940370
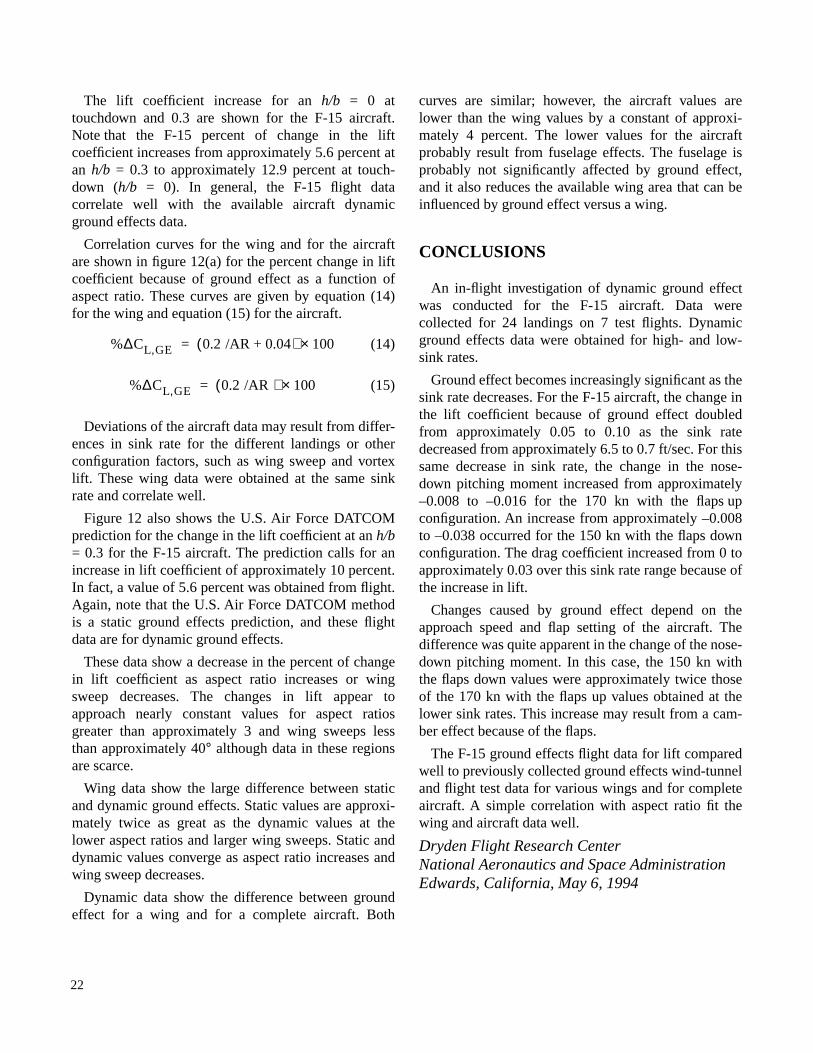
The lift coefficient increase for an h/b = 0 attouchdown and 0.3 are shown for the F-15 aircraft.Note that the F-15 percent of change in the liftcoefficient increases from approximately 5.6 percent atan h/b = 0.3 to approximately 12.9 percent at touch-down (h/b = 0). In general, the F-15 flight datacorrelate well with the available aircraft dynamicground effects data.
Correlation curves for the wing and for the aircraftare shown in figure 12(a) for the percent change in liftcoefficient because of ground effect as a function ofaspect ratio. These curves are given by equation (14)for the wing and equation (15) for the aircraft.
(14)
(15)
Deviations of the aircraft data may result from differ-ences in sink rate for the different landings or otherconfiguration factors, such as wing sweep and vortexlift. These wing data were obtained at the same sinkrate and correlate well.
Figure 12 also shows the U.S. Air Force DATCOMprediction for the change in the lift coefficient at an h/b= 0.3 for the F-15 aircraft. The prediction calls for anincrease in lift coefficient of approximately 10 percent.In fact, a value of 5.6 percent was obtained from flight.Again, note that the U.S. Air Force DATCOM methodis a static ground effects prediction, and these flightdata are for dynamic ground effects.
These data show a decrease in the percent of changein lift coefficient as aspect ratio increases or wingsweep decreases. The changes in lift appear toapproach nearly constant values for aspect ratiosgreater than approximately 3 and wing sweeps lessthan approximately 40° although data in these regionsare scarce.
Wing data show the large difference between staticand dynamic ground effects. Static values are approxi-mately twice as great as the dynamic values at thelower aspect ratios and larger wing sweeps. Static anddynamic values converge as aspect ratio increases andwing sweep decreases.
Dynamic data show the difference between groundeffect for a wing and for a complete aircraft. Both
%∆CL GE, 0.2 /AR + 0.04( ) 100×=
%∆CL GE, 0.2 /AR ( ) 100×=
22
curves are similar; however, the aircraft values arelower than the wing values by a constant of approxi-mately 4 percent. The lower values for the aircraftprobably result from fuselage effects. The fuselage isprobably not significantly affected by ground effect,and it also reduces the available wing area that can beinfluenced by ground effect versus a wing.
CONCLUSIONS
An in-flight investigation of dynamic ground effectwas conducted for the F-15 aircraft. Data werecollected for 24 landings on 7 test flights. Dynamicground effects data were obtained for high- and low-sink rates.
Ground effect becomes increasingly significant as thesink rate decreases. For the F-15 aircraft, the change inthe lift coefficient because of ground effect doubledfrom approximately 0.05 to 0.10 as the sink ratedecreased from approximately 6.5 to 0.7 ft/sec. For thissame decrease in sink rate, the change in the nose-down pitching moment increased from approximately–0.008 to –0.016 for the 170 kn with the flaps upconfiguration. An increase from approximately –0.008to –0.038 occurred for the 150 kn with the flaps downconfiguration. The drag coefficient increased from 0 toapproximately 0.03 over this sink rate range because ofthe increase in lift.
Changes caused by ground effect depend on theapproach speed and flap setting of the aircraft. Thedifference was quite apparent in the change of the nose-down pitching moment. In this case, the 150 kn withthe flaps down values were approximately twice thoseof the 170 kn with the flaps up values obtained at thelower sink rates. This increase may result from a cam-ber effect because of the flaps.
The F-15 ground effects flight data for lift comparedwell to previously collected ground effects wind-tunneland flight test data for various wings and for completeaircraft. A simple correlation with aspect ratio fit thewing and aircraft data well.
Dryden Flight Research CenterNational Aeronautics and Space AdministrationEdwards, California, May 6, 1994

REFERENCES
1Hoerner, Sighard F. and Borst, Henry V., Fluid-Dynamic Lift: Practical Information on Aerodynamicand Hydrodynamic Lift, 2nd edition, published byLiselotte A. Hoerner, Brick Town, New Jersey, 1985.
2Chang, Ray C. and Muirhead, Vincent U., “Inves-tigation of Dynamic Ground Effect,” Proceedings ofthe 1985 NASA Ames Research Center's Ground-EffectsWorkshop, NASA CP-2462, Aug. 20, 1985, pp. 363–393.
3Lee, Pai-Hung, Lan, C. Edward, and Muirhead,Vincent U., An Experimental Investigation of DynamicGround Effect, NASA CR-4105, 1987.
4Lee, Pai-Hung, Lan, C. Edward, and Muirhead,Vincent U., “Experimental Investigation of DynamicGround Effect,” J. of Aircraft, vol. 26, no. 6, June 1989,pp. 497–498.
5Kemmerly, G.T., Paulson, J.W., Jr., and Compton,M., “Exploratory Evaluation of Moving-ModelTechnique for Measurement of Dynamic GroundEffects,” J. of Aircraft, vol. 25, no. 6, June 1988, pp.557–562.
6Paulson, John W., Jr., Kemmerly, Guy T., andGilbert, William P., “Dynamic Ground Effects,”Aerodynamics of Combat Aircraft Controls and ofGround Effects, AGARD CP-465, 1990, pp. 21-1–21-12.
7Furlong, G. Chester and Bollech, Thomas V., Effectof Ground Interference on the Aerodynamic and FlowCharacteristics of a 42° Sweptback Wing at ReynoldsNumbers Up to , NACA TR-1218, 1955.
8Schweikhard, William, “A Method for In-FlightMeasurement of Ground Effect on Fixed-WingAircraft,” J. of Aircraft, vol. 4, no. 2, Mar.–Apr. 1967,pp. 101–104.
9Baker, Paul A., Schweikhard, William G., andYoung, William R., “Flight Evaluation of Ground Effecton Several Low-Aspect Ratio Airplanes,” NASA TND-6053, 1970.
10Curry, Robert E., Moulton, Bryan, J., and Kresse,John, An In-Flight Investigation of Ground Effect on aForward-Swept Wing Airplane, NASA TM-101708,1989.
11Burcham, Frank W., Jr., Maine, Trindel A.,Fullerton, C. Gordon, and Wells, Edward A.,Preliminary Flight Results of a Fly-by-ThrottleEmergency Flight Control System on an F-15 Airplane,NASA TM-4503, 1993.
12McDonnell Douglas Corporation, USAF Stabilityand Control DATCOM, U.S. Air Force Flight DynamicsLaboratory, Wright-Patterson AFB, Ohio, Oct. 1960(Revised Apr. 1976).
6.8 106×
23

REPORT DOCUMENTATION PAGE Form ApprovedOMB No. 0704-0188
Public reporting burden for this collection of information is estimated to average 1 hour per response, including the time for reviewing instructions, searching existing data sources, gathering and maintaining the data needed, and completing and reviewing the collection of information. Send comments regarding this burden estimate or any other aspect of this col-lection of information, including suggestions for reducing this burden, to Washington Headquarters Services, Directorate for Information Operations and Reports, 1215 Jefferson Davis Highway, Suite 1204, Arlington, VA 22202-4302, and to the Office of Management and Budget, Paperwork Reduction Project (0704-0188), Washington, DC 20503.
1. AGENCY USE ONLY (Leave blank) 2. REPORT DATE 3. REPORT TYPE AND DATES COVERED
4. TITLE AND SUBTITLE 5. FUNDING NUMBERS
6. AUTHOR(S)
8. PERFORMING ORGANIZATION REPORT NUMBER
7. PERFORMING ORGANIZATION NAME(S) AND ADDRESS(ES)
9. SPONSORING/MONOTORING AGENCY NAME(S) AND ADDRESS(ES) 10. SPONSORING/MONITORING AGENCY REPORT NUMBER
11. SUPPLEMENTARY NOTES
12a. DISTRIBUTION/AVAILABILITY STATEMENT 12b. DISTRIBUTION CODE
Unclassified—Unlimited Subject Category 02
13. ABSTRACT (Maximum 200 words)
14. SUBJECT TERMS 15. NUMBER OF PAGES
16. PRICE CODE
17. SECURITY CLASSIFICATION OF REPORT
18. SECURITY CLASSIFICATION OF THIS PAGE
19. SECURITY CLASSIFICATION OF ABSTRACT
20. LIMITATION OF ABSTRACT
NSN 7540-01-280-5500 Standard Form 298 (Rev. 2-89)Prescribed by ANSI Std. Z39-18298-102
Dynamic Ground Effects Flight Test of an F-15 Aircraft
WU-533-02-31
Stephen Corda, Mark T. Stephenson, Frank W. Burcham, and Robert E. Curry
NASA Dryden Flight Research CenterP.O. Box 273Edwards, California 93523-0273
H-1999
National Aeronautics and Space AdministrationWashington, DC 20546-0001 NASA TM-4604
Flight tests to determine the changes in the aerodynamic characteristics of an F-15 aircraft caused by dynamicground effects are described. Data were obtained for low- and high-sink rates between 0.7 and 6.5 ft/sec and attwo landing approach speeds and flap settings: 150 kn with the flaps down and 170 kn with the flaps up. Simplecorrelation curves are given for the change in aerodynamic coefficients because of ground effects as a functionof sink rate. Ground effects generally caused an increase in the lift, drag, and nose-down pitching moment coef-ficients. The change in the lift coefficient increased from approximately 0.05 at the high-sink rate toapproximately 0.10 at the low-sink rate. The change in the drag coefficient increased from approximately 0 to0.03 over this decreasing sink rate range. No significant difference because of the approach configuration wasevident for lift and drag; however, a significant difference in pitching moment was observed for the twoapproach speeds and flap settings. For the 170 kn with the flaps up configuration, the change in the nose-downpitching moment increased from approximately –0.008 to –0.016. For the 150 kn with the flaps downconfiguration, the change was from approximately –0.008 to –0.038.
Aircraft aerodynamics; Aircraft approach and landing; F-15 aircraft; Flight testing; Ground effect; Propulsion-controlled aircraft
A03
26
Unclassified Unclassified Unclassified Unlimited
September 1994 Technical Memorandum
Available from the NASA Center for AeroSpace Information, 800 Elkridge Landing Road, Linthicum Heights, MD 21090; (301)621-0390
Stephen Corda, PRC Inc., Edwards, California; Mark T. Stephenson, Frank W. Burcham, and Robert E. Curry, NASA Dryden Flight Research Center, Edwards, California.