Dynamic Compaction of Sandy Soils in Kuwait A Case Study
16
Journal of Engg. Research Online First Article 1 Dynamic Compaction of Sandy Soils in Kuwait – A Case Study DOI : 10.36909/jer.14305 By Nabil F. Ismael*, Monera Al-Otaibi Civil Engineering Department, Kuwait University, Kuwait *Email: [email protected] Abstract Ground improvement was required for construction of the Jaber Al Ahmed New City located about 25 km west of Kuwait City, Kuwait. Loose to medium poorly graded sands, and silty sands extended from ground level to a depth ranging from 5m to 9m. Dynamic compaction was employed, as an economic method, to increase the soil bearing capacity and reduce its compressibility for foundation design and construction. The testing program included borings and sampling, Standard Penetration Tests, Cone Penetration Tests and Pressuremeter Tests before and after dynamic compaction. The area covered in this study is about 31415m 2 . The results indicated significant ground improvement, and satisfaction of the specified acceptance criteria resulting in an allowable soil pressure, for shallow foundation design, equal to or exceeding 300 kN/m 2 . Key words: Sands, Soil Tests, Dynamic Compaction, Standard Penetration Tests, Cone Penetration Tests, Pressuremeter Tests.
Transcript of Dynamic Compaction of Sandy Soils in Kuwait A Case Study
Journal of Engg. Research Online First Article
1
Dynamic Compaction of Sandy Soils in Kuwait – A Case Study
DOI : 10.36909/jer.14305
By Nabil F. Ismael*, Monera Al-Otaibi
Civil Engineering Department, Kuwait University, Kuwait
*Email: [email protected]
Abstract
Ground improvement was required for construction of the Jaber Al Ahmed New City located
about 25 km west of Kuwait City, Kuwait. Loose to medium poorly graded sands, and silty sands
extended from ground level to a depth ranging from 5m to 9m. Dynamic compaction was
employed, as an economic method, to increase the soil bearing capacity and reduce its
compressibility for foundation design and construction. The testing program included borings
and sampling, Standard Penetration Tests, Cone Penetration Tests and Pressuremeter Tests
before and after dynamic compaction. The area covered in this study is about 31415m2. The
results indicated significant ground improvement, and satisfaction of the specified acceptance
criteria resulting in an allowable soil pressure, for shallow foundation design, equal to or
exceeding 300 kN/m2.
Key words: Sands, Soil Tests, Dynamic Compaction, Standard Penetration Tests, Cone
Penetration Tests, Pressuremeter Tests.
Journal of Engg. Research Online First Article
2
INTRODUCTION
With major economic development and population increase, Kuwait has started the construction
of new cities in the desert. One of these cities is Jaber Al Ahmed New City located 25 km west
of Kuwait City. Preliminary soil investigation revealed loose to medium dense sands, and silty
sands extending up to 9m below ground level underlain by dense to very dense sands. This is
typical of the ground conditions in Kuwait (Ismael et al. 1986). The ground water level was
encountered at a depth of 3m below ground level. With no gravel in the soil samples and with the
fines content (< 0.075mm) ranging from 10% to 15% on average, dynamic compaction was
recommended to the Public Authority for Housing Welfare (PAHW), as an effective and
economic method for ground improvement. Dynamic compaction has been used for ground
improvement of the Sabkha deposits which exist along the Arabian Gulf region (Moon et.al.
2019). This is a salt flat or a salt bearing soil consisting of fine silt or clayey silt with a large
percentage of carbonates and sulphates. Dynamic compaction was used for densification of sand
fill formed by hydraulic filling (Bo et al. 2009, Khelalfa 2017) and as a cost-effective alternative
to pile foundations for sites consisting of deep deposits of loose granular soils (Ali, and Ali,
2008) and for compacting sand filling embankment (Chen 2012). Studies to estimate the
dynamic compaction effect in sand and the depth of improvement was carried out (Lee and Gu
2004, Kundu and Viswanadhan 2016) and the effect on the liquefaction of reclaimed ground was
investigated by Shen (2018).
An area of 31416m2 consisting of six subzones was selected in the present study. Dynamic
compaction was achieved using a pounder 1.8m x 1.8m weighing 15 ton and dropping from a
height of 14 to 16m with 4 to 6 blows at each point, and in three phases and followed by an
ironing phase. Soil conditions were determined before ground improvement by boreholes and
Journal of Engg. Research Online First Article
3
Standard Penetration Tests SPT, Cone Penetration tests CPT and Pressuremeter Tests ‘PMT’.
The same tests were repeated after dynamic compaction as the quality control tests to determine
the improvement made and whether it met the acceptance criteria set before the beginning of the
work. The criteria were based on achieving the minimum allowable soil pressure of 300 kN/m2
required for foundation design of the housing structures and other infrastructure services and
facilities in the new city. The allowable pressure is determined from Bowles (1977) Equation
based on the SPT test values and an allowable settlement of 25 mm
This paper presents a well-documented case study of dynamic compaction in the arid desert
environment of the State of Kuwait. No case studies are available for the local soils. The
equipment and procedure employed, the improvements in the soil parameters and the penetration
test values are presented for the benefit of the practicing geotechnical engineers and researchers.
SOIL CONDITIONS
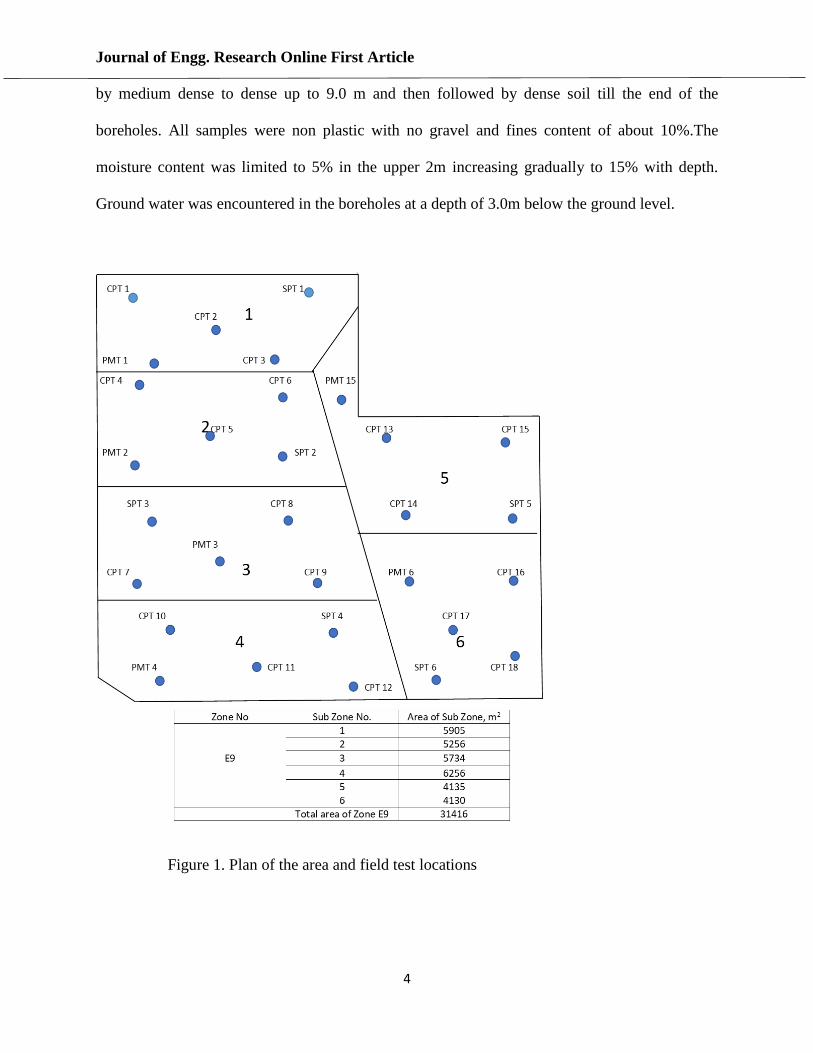
Figure 1 shows a plan of the area under investigation which consist of six subzones each having
an area of 4000 to 6000 m2. One borehole, cone tests at three locations and one hole for the
Pressuremeter Tests were drilled in each subzone. The boreholes were advanced by augering.
Standard Penetration Tests were carried out at 0.5m intervals till 4.0m from existing ground
surface, and then at 1.0m intervals up to the end of the boreholes. The depth of the boreholes was
11.5m. Laboratory tests were performed on the selected samples recovered during the field
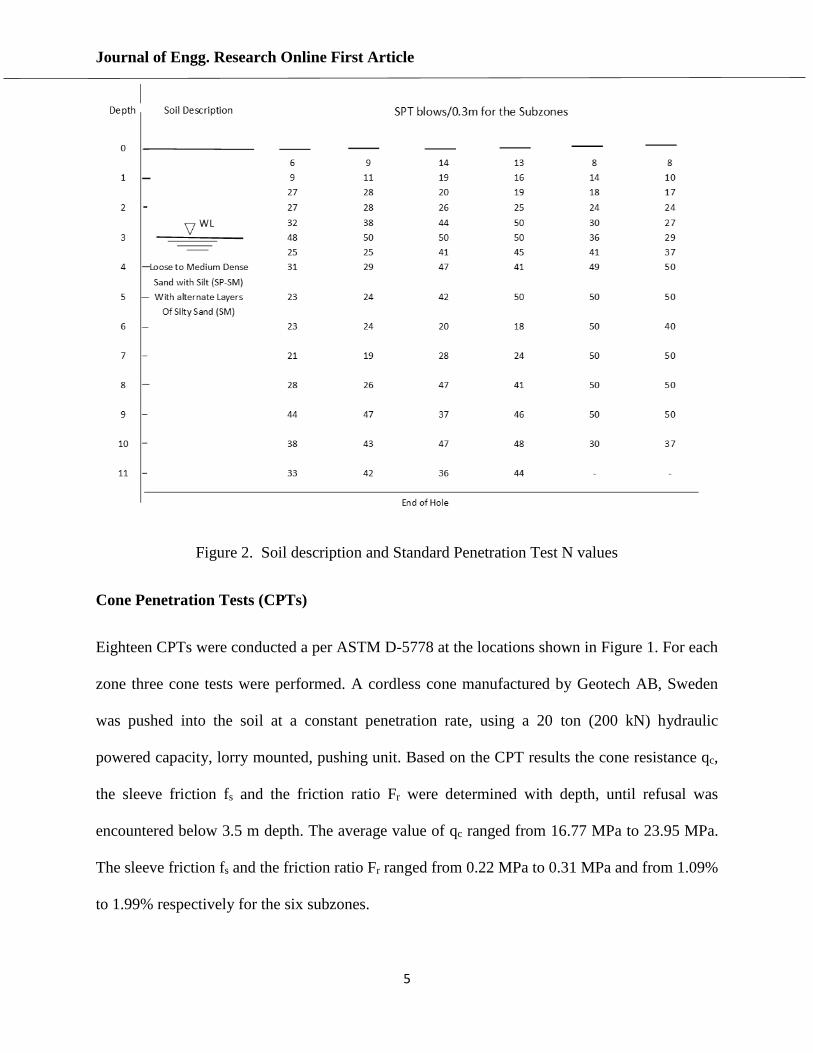
investigation for classification and for the determination of the basis properties. Figure 2 shows
the soil description and the Standard Penetration Test N values for the six boreholes. The soil
profile consists of calcareous granular material which was found to be generally alternate layers
of poorly graded sand with silt (SP-SM) and silty sand (SM). Based on the SPT-N values the
relative density of the granular material can be classified as loose soils in the top 1.0 m followed
Journal of Engg. Research Online First Article
4
by medium dense to dense up to 9.0 m and then followed by dense soil till the end of the
boreholes. All samples were non plastic with no gravel and fines content of about 10%.The
moisture content was limited to 5% in the upper 2m increasing gradually to 15% with depth.
Ground water was encountered in the boreholes at a depth of 3.0m below the ground level.
Figure 1. Plan of the area and field test locations
Journal of Engg. Research Online First Article
5
Figure 2. Soil description and Standard Penetration Test N values
Cone Penetration Tests (CPTs)
Eighteen CPTs were conducted a per ASTM D-5778 at the locations shown in Figure 1. For each
zone three cone tests were performed. A cordless cone manufactured by Geotech AB, Sweden
was pushed into the soil at a constant penetration rate, using a 20 ton (200 kN) hydraulic
powered capacity, lorry mounted, pushing unit. Based on the CPT results the cone resistance qc,
the sleeve friction fs and the friction ratio Fr were determined with depth, until refusal was
encountered below 3.5 m depth. The average value of qc ranged from 16.77 MPa to 23.95 MPa.
The sleeve friction fs and the friction ratio Fr ranged from 0.22 MPa to 0.31 MPa and from 1.09%
to 1.99% respectively for the six subzones.
Journal of Engg. Research Online First Article
6
Pressuremeter Tests (PMTs)
Pressuremeter tests were conducted at six locations, one location in each zone as shown in Figure
1. The Pressuremeter test device consists of a pressure cell and two guard cells. A probe with OD
44mm installed into a slotted casing with OD 63mm was used. Percussion driving was used to
penetrate the probe into the soil. Tests were performed at one meter intervals down to 10m or
until refusal occurred. The criteria for refusal is reached if 0.5m penetration of the device
required more than 120 sec. The test involves expanding the pressure cell inside the borehole at a
certain depth and measuring the expansion of its volume after each increment of pressure. The
test data were interpreted on the basis of the theory of expansion of the cylindrical cell under cell
pressure. Refusal occurred below a depth of 3m. For this case the limit pressure is considered as
exceeding 3.0 MPa. The average measured values ranged from 1.2MPa to 2.45 MPa for the limit
pressure PL and 11.6 MPa to 41.5 MPa for the soil modulus Em
ACCEPTANCE CRITERIA FOR SOIL IMPROVEMENT
To meet the foundation design requirements at the Jaber Al-Ahmed New City site with regard to
the allowable pressure and compressibility of the ground soils the following acceptance criteria
were specified for the soils to a depth of 7m.
SPT Tests.
For the top 4m from the original ground surface, the average N values shall not be less than 25
with the minimum value not less than 20. The average N value from 4 to 7m depth shall not be
less than 20, with the minimum value not less than 15.
Journal of Engg. Research Online First Article
7
CPT Tests
For the top 4.0m from the original ground surface, the average cone resistance qc shall not be
less than 15MPa with the minimum value not less than 12 MPa. The corresponding values from
4 to 7m are 12MPa and 10 MPa respectively.
PMT Tests
For the top 4m from the original ground surface, the average limit pressure PL shall not be less
than 1.5 MPa with the minimum value not less than 1.2 MPa. The corresponding values from 4
to 7m are 1.2 MPa. and 1.0 MPa respectively.
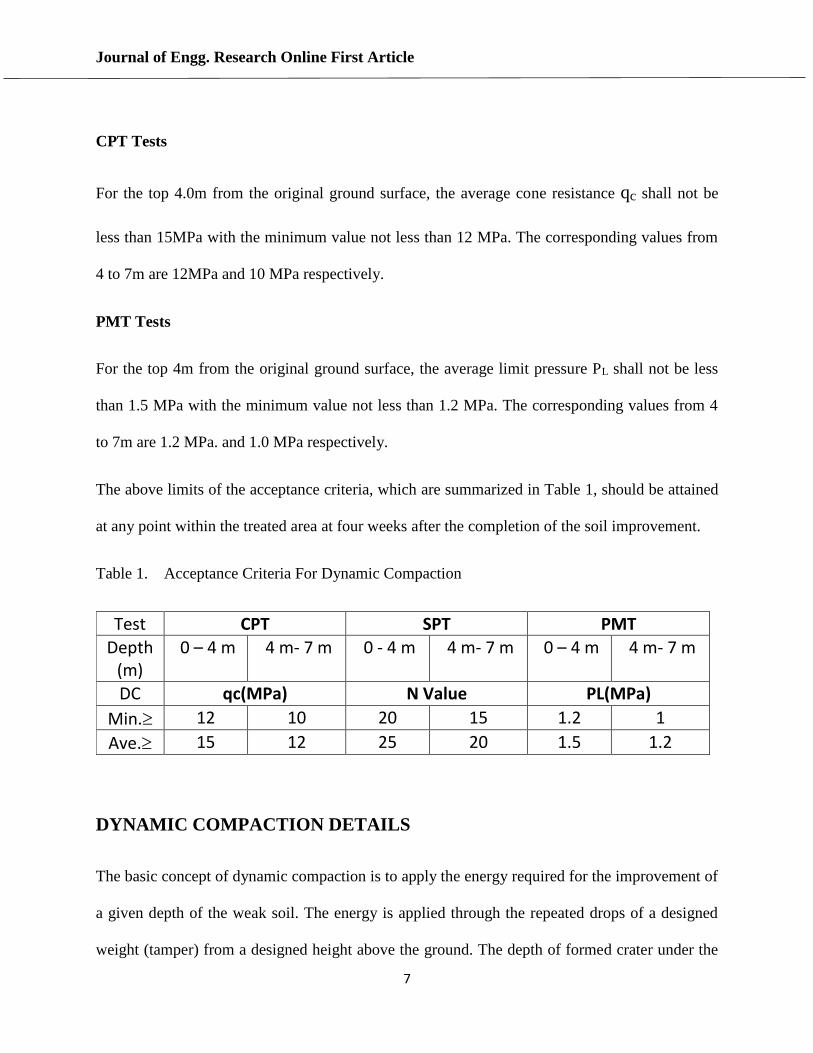
The above limits of the acceptance criteria, which are summarized in Table 1, should be attained
at any point within the treated area at four weeks after the completion of the soil improvement.
Table 1. Acceptance Criteria For Dynamic Compaction
DYNAMIC COMPACTION DETAILS
The basic concept of dynamic compaction is to apply the energy required for the improvement of
a given depth of the weak soil. The energy is applied through the repeated drops of a designed
weight (tamper) from a designed height above the ground. The depth of formed crater under the
Test CPT SPT PMT
Depth (m)
0 – 4 m 4 m- 7 m 0 - 4 m 4 m- 7 m 0 – 4 m 4 m- 7 m
DC qc(MPa) N Value PL(MPa)
Min. 12 10 20 15 1.2 1
Ave. 15 12 25 20 1.5 1.2
Journal of Engg. Research Online First Article
8
applied energy is a tentative measure of the amount of improvement. The governing Equation of
the dynamic compaction may be expressed as:
D = n (WH)0.5 ………(1)
where D = depth of improvement (m), n = coefficient depending on the soil type and ranges
between 0.3 and 0.8, W = weight of drop tamper (ton), and H = drop height.
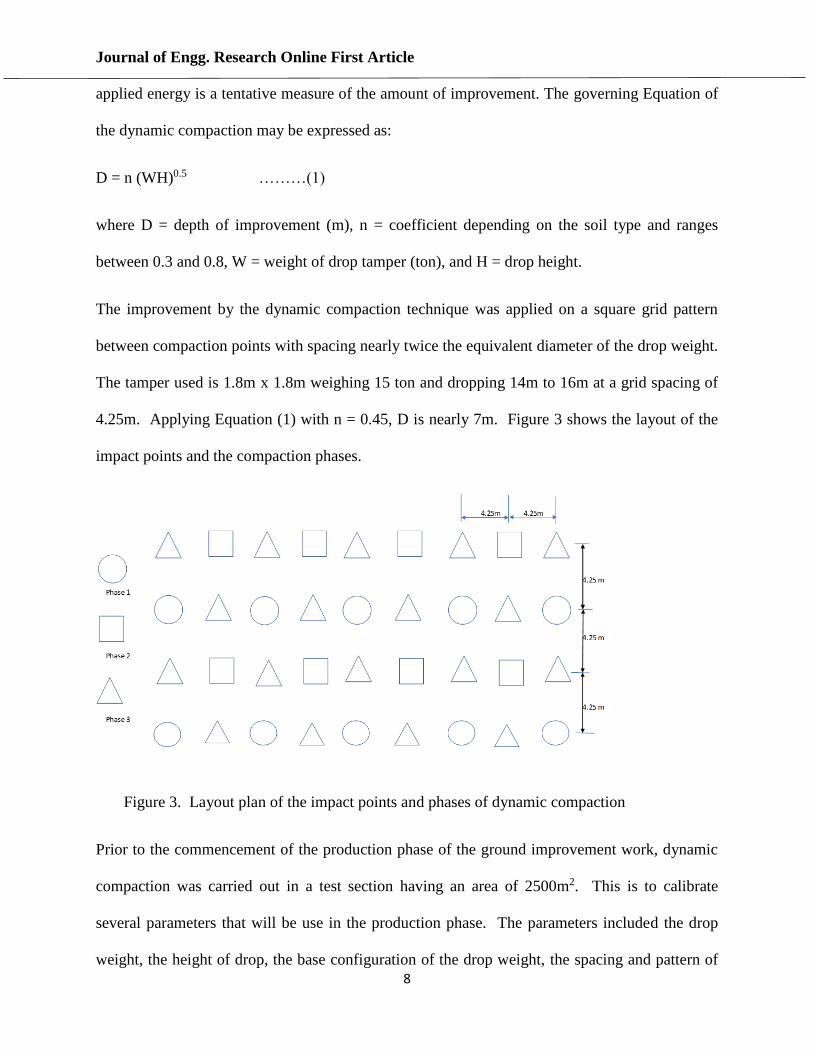
The improvement by the dynamic compaction technique was applied on a square grid pattern
between compaction points with spacing nearly twice the equivalent diameter of the drop weight.
The tamper used is 1.8m x 1.8m weighing 15 ton and dropping 14m to 16m at a grid spacing of
4.25m. Applying Equation (1) with n = 0.45, D is nearly 7m. Figure 3 shows the layout of the
impact points and the compaction phases.
Figure 3. Layout plan of the impact points and phases of dynamic compaction
Prior to the commencement of the production phase of the ground improvement work, dynamic
compaction was carried out in a test section having an area of 2500m2. This is to calibrate
several parameters that will be use in the production phase. The parameters included the drop
weight, the height of drop, the base configuration of the drop weight, the spacing and pattern of
Journal of Engg. Research Online First Article
9
imprints, the number of drops per imprint, the number of passes and the time delay between the
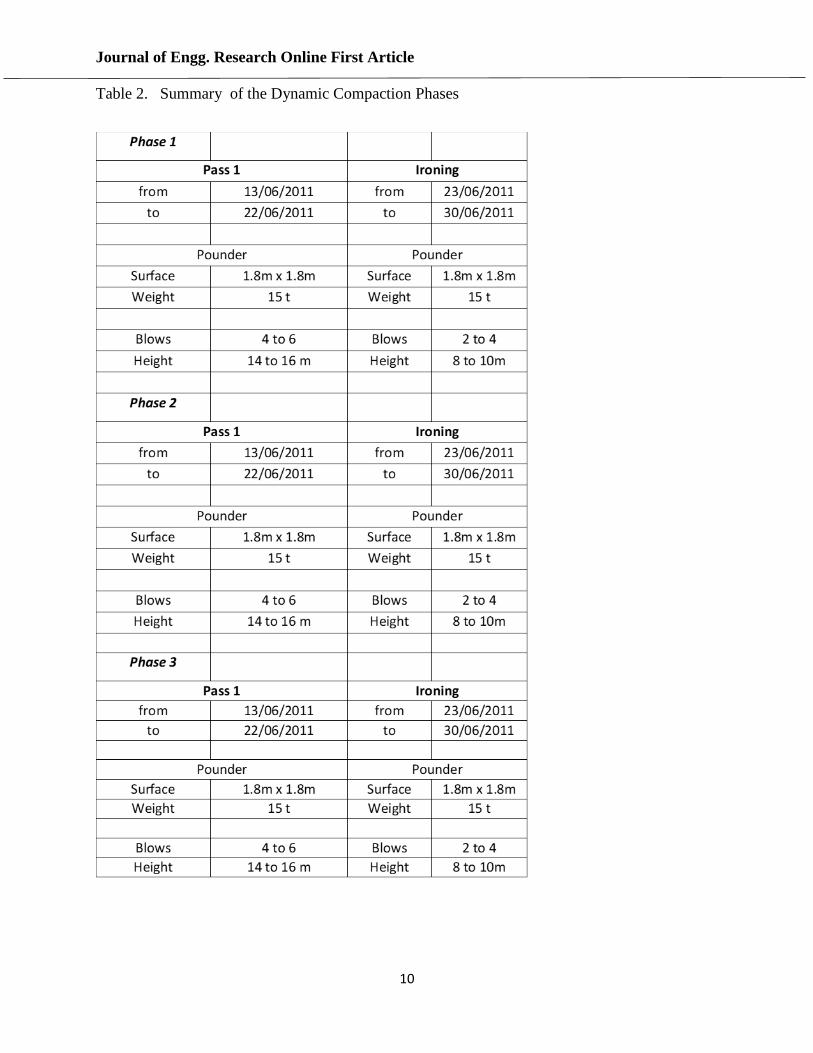
passes if required. Table 2 shows a summary of the compaction phases. As shown each phase
consists of one pass with 4 to 6 blows at each point. After each dynamic compaction phase, the
craters were filled with imported granular material having finer content not exceeding 30% and
the plasticity index not exceeding 8%. The ground surface was leveled and prepared for the next
compaction phase. In all cases, an additional pass to compact the surface soils (ironing pass) was
performed after the successful application of the dynamic compaction with the details shown in
Table 2. During the dynamic compaction operations, the application of an energy stopped when
any of the following occurred:
a) The depth of the crater is greater than the thickness of the drop weight plus 0.3m. In this case
the crater was backfilled, and compaction resumed.
b) Heave of the ground surface occurred prior to reaching the required numbers of drops. In this
case time was given prior to resuming the compaction to allow for pore water pressure
dissipation.
c) Ground water appeared within the crater. In this case the crater is backfilled, and compaction
resumed.
Journal of Engg. Research Online First Article
10
Table 2. Summary of the Dynamic Compaction Phases
Journal of Engg. Research Online First Article
11
TEST RESULTS AFTER DYNAMIC COMPACTION
The initial tests conducted were repeated after ground improvement by dynamic compaction for
quality control to ensure satisfaction of the acceptance criteria. For each subzone one boring was
drilled, cone tests at three points, and one hole for Pressuremeter tests next to the initial locations
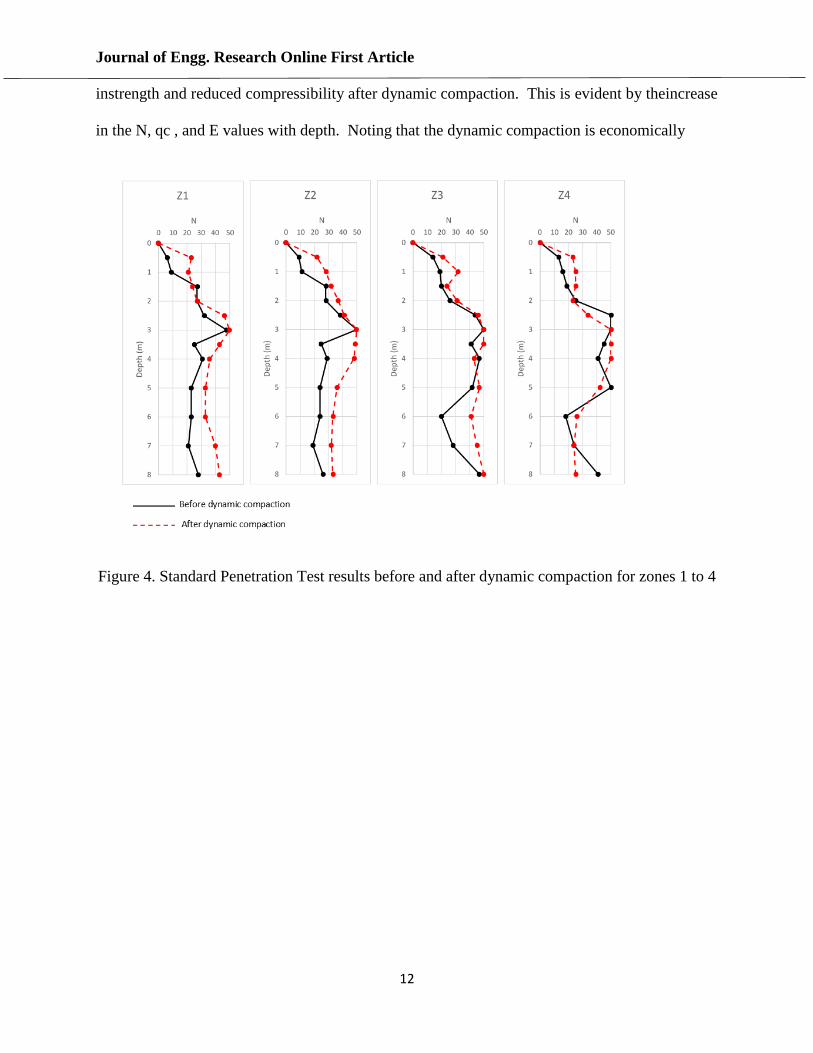
Figure 4 shows the SPT - N values before and after ground improvement up to a depth of 8 m for
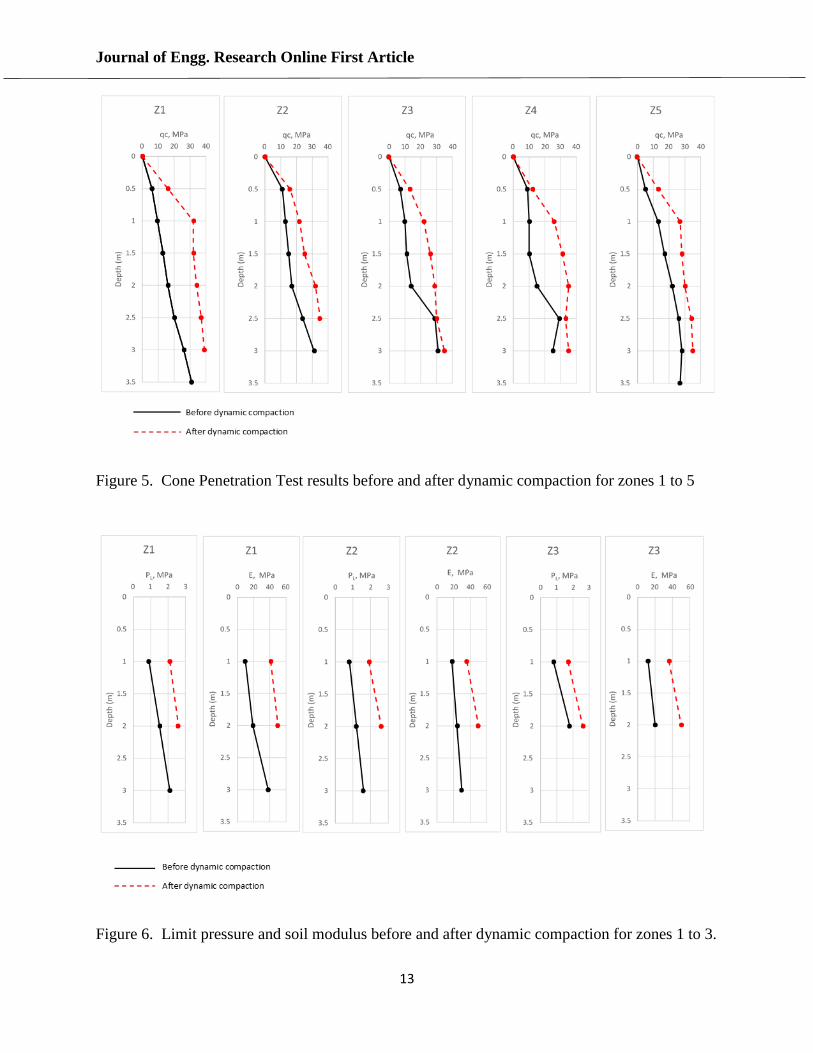
subzones 1 to 4. As shown the N values increased and satisfied the acceptance criteria. Figure 5
shows the cone resistance with depth qc, before and after dynamic compaction for subzones 1 to
5. A remarkable increase in the value of qc is noted along the entire depth with the values
meeting the acceptance criteria. The values increased to at least twice the original values. At a
depth of 3.5m refusal was encountered as the maximum reaction capacity was reached. Figure 6
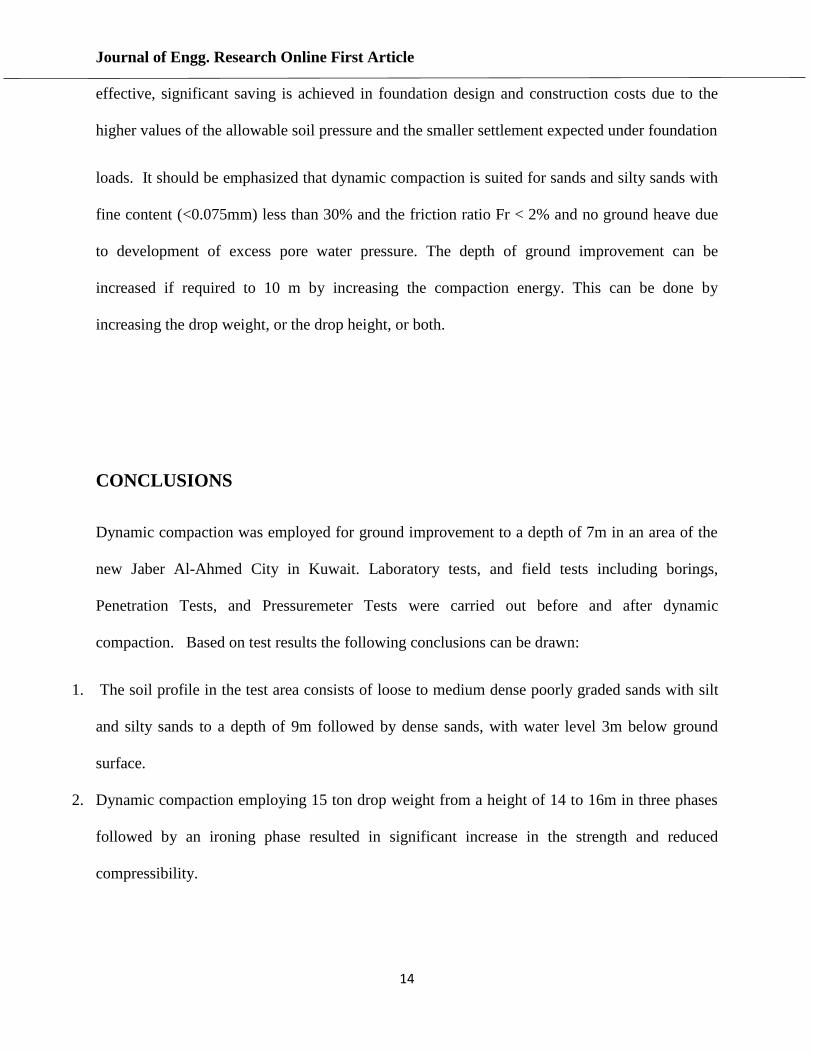
shows the Pressuremeter test results for subzones 1 to 3. For each subzone the variations of the
limit pressure and the Pressuremeter modules with depth are shown before and after ground
improvement. Refusal was encountered at a depth of 3m after dynamic compaction. From
Figure 6 it is noted that both the limit pressure PL and the soil modulus E have increased by two
times or more compared to their initial values after dynamic compaction. These values satisfied
the acceptance criteria.
DISCUSSION
The above results indicated the effectiveness of dynamic compaction for ground improvement of
loose and medium dense sands and silty sands to a depth of 7m. The method is ideal for new
areas where no buildings or nearby structures exist. The results show significant increase
Journal of Engg. Research Online First Article
12
instrength and reduced compressibility after dynamic compaction. This is evident by theincrease
in the N, qc , and E values with depth. Noting that the dynamic compaction is economically
Figure 4. Standard Penetration Test results before and after dynamic compaction for zones 1 to 4
Journal of Engg. Research Online First Article
13
Figure 5. Cone Penetration Test results before and after dynamic compaction for zones 1 to 5
Figure 6. Limit pressure and soil modulus before and after dynamic compaction for zones 1 to 3.
Journal of Engg. Research Online First Article
14
effective, significant saving is achieved in foundation design and construction costs due to the
higher values of the allowable soil pressure and the smaller settlement expected under foundation
loads. It should be emphasized that dynamic compaction is suited for sands and silty sands with
fine content (<0.075mm) less than 30% and the friction ratio Fr < 2% and no ground heave due
to development of excess pore water pressure. The depth of ground improvement can be
increased if required to 10 m by increasing the compaction energy. This can be done by
increasing the drop weight, or the drop height, or both.
CONCLUSIONS
Dynamic compaction was employed for ground improvement to a depth of 7m in an area of the
new Jaber Al-Ahmed City in Kuwait. Laboratory tests, and field tests including borings,
Penetration Tests, and Pressuremeter Tests were carried out before and after dynamic
compaction. Based on test results the following conclusions can be drawn:
1. The soil profile in the test area consists of loose to medium dense poorly graded sands with silt
and silty sands to a depth of 9m followed by dense sands, with water level 3m below ground
surface.
2. Dynamic compaction employing 15 ton drop weight from a height of 14 to 16m in three phases
followed by an ironing phase resulted in significant increase in the strength and reduced
compressibility.
Journal of Engg. Research Online First Article
15
3. Standard Penetration Tests and Cone Penetration tests before and after dynamic compaction
indicated the N and qc values increased substantially as the ground changed from loose, and
medium dense to dense ground conditions.
4. As a result of dynamic compaction, the minimum allowable pressure of 300 kN/m2 required for
foundation design by the Public Authority for Housing Welfare was exceeded.
5. The soil compressibility decreased significantly after dynamic compaction. The soil modulus E
determined from the Pressuremeter Tests has more than doubled after dynamic compaction.
6. The method of dynamic compaction is recommended for other areas in the Gulf States where
loose desert sands, and silty sands extend to a depth of up to10m with the fines content less than
30%, and the water level is relatively deep, and where new cities, or large compounds will be
constructed in the desert.
REFERENCES
Ali, L. and Ali, S. (2008). “Enhancement of Bearing Capacity by Dynamic Compaction: A case
History”. Proceedings of the 6th International Conference on Case Histories in Geotechnical
Engineering, Arlington, VA, paper No 7.25a
Bo, M.W., Na, Y.M., Arulrajah, A., and Chang, M.F. (2009). Densification of granular soils by
dynamic compaction. Proceedings of the Institute of Civil Engineers, Ground Improvement 162,
Issue G13, pp. 121-132
Bowles. (1977). Foundation Analysis and Design, 2nd ed., McGraw-Hill, New York
Chen, C. (2012) Effect of dynamic compaction on red sand soil filling embankment. Applied
Mechanics and Materials, pp. 788-791.
Ismael, N.F., Jeragh, A.M., Mollah, M.A., and Al Khaldi, O. (1986). A study of the properties of
surface soils in Kuwait. Journal of the Southeast Asian Geotechnical Society, Bangkok, Thailand,
No. 1, Volume 17, pp. 67-87, June.
Journal of Engg. Research Online First Article
16
Khelalfa, H. (2017) Dynamic compaction with high energy of sandy coastal embankment.
International Symposium on Construction Management and Civil Engineering, November, Algeria
Kundu, S. and Viswanadham, B.(2016). Studies to evaluate the impact of tamper on the depth of
improvement in dynamic compaction. Proceedings of the 15th Asian Regional Conference on Soil
Mechanics and Geotechnical Engineering, pp 2033-2037.
Lee, F.H., and Gu, Q. (2004). Method for estimating dynamic compaction effect on sand. Journal
of Geotechnical and Geo environmental Engineering, ASCE, 130 (2): 139-152
Moon, J., Jung, H., Lee, S.,and Kang, S.(2019). Ground improvement using dynamic compaction in
Sabkha Deposit. Applied Sciences 9, 2506.
Shen, M., Martin, J.,Ku,C., and Lu, Y. (2018). A case study of the effect of dynamic compaction on
the liquefaction of reclaimed ground. Engineering Geology 240, 48-61