Dynamic characterization of the DUOC-UC footbridge · 2 This footbridge is highly transited because...
8
Proceedings of the Tenth Pacific Conference on Earthquake Engineering Building an Earthquake-Resilient Pacific 6-8 November 2015, Sydney, Australia Dynamic characterization of the DUOC-UC footbridge J.T. Padilla, L.M Zamora & J.J. Olivera M.Sc. Students, Universidad Católica de la Santísima Concepción, Concepción, Chile. C.A. Oyarzo-Vera Senior Lecturer, Universidad Católica de la Santísima Concepción, Concepción, Chile. ABSTRACT: The results of an operational modal analysis conducted on a footbridge in Concepción, Chile, are presented in this article. Accelerometers were attached at different points on the footbridge and one-hour ambient tests were performed on different days and hour times. Stochastic Subspace Identification (SSI) and Frequency Domain Decomposition (FDD) were employed to determine the dynamic properties of the structure (modal frequencies and mode shapes). The experimental results were compared with the modal response calculated from a numerical model in SAP2000. Results are discussed in terms of the similitude between experimental and theoretical response. 1 INTRODUCTION Footbridges are generally slender structures that may experience large displacements or excessive vibrations due to ambient excitations (pedestrian flow, vehicles traffic, wind, tremors, etc). These structures are usually designed using computational models that verify the strength of each of the constituent elements, but also the design must meet serviceability conditions, such as, limits for deformations and vibrations. Usually, strength conditions are easily satisfied by footbridge design. However, it is not exceptional finding structures that experienced vibrations which amplitude or frequency generates discomfort in users. This undesired structural behavior is usually not predicted by the numerical models because they do not necessarily represent the actual response of the structure in an exact manner (Bayraktar et al., 2010). Moreover, numerical models are generally not validated by any mean. Hence, it is impossible that these models can trustfully predict the actual structural performance if they are not calibrated using experimental measurements on the real structure. A tool to calibrate numerical models considers measuring the low intensity vibrations that experienced structures due to ambient excitations (Ren et al., 2004; Gentile et al., 2011). The modal parameters that dynamically characterize the structures (frequencies, mode shapes and damping) are extracted from these operational vibration records. This information is then compared to the response predicted by numerical models and the models are adjusted to match the response measured on the real structure. These procedures are known as operational modal analysis (Brincker et al., 2000), system identification and model updating. Our study aims to identify the modal properties (modal frequencies and mode shapes) of a pedestrian arch bridge built in laminated timber and steel. These experimental data will be then employed to obtain an improved numerical model of this structure that will be used to predict the bridge performance under operational and extreme conditions. 2 DESCRIPTION OF THE STRUCTURE DUOC–UC footbridge is located over Avenida Paicaví, in front of the UCSC Medical Center in Concepción, Chile (Fig. 1). The footbridge consists of two 52 m long and 6.5 m height arches. The main elements of the arch are four curved beams made of laminated timber of radiata pine hinged at both ends (supports and middle length of the arches). These beams have a rectangular section of 1100 x 200 mm. A steel structure is attached to the main beams, with columns spaced every 4 m. This steel structure supports a 100 mm thick radiata pine slab with an 80 mm thick top layer of asphalt (Fig. 2). Paper Number 24
Transcript of Dynamic characterization of the DUOC-UC footbridge · 2 This footbridge is highly transited because...

Proceedings of the Tenth Pacific Conference on Earthquake Engineering
Building an Earthquake-Resilient Pacific
6-8 November 2015, Sydney, Australia
Dynamic characterization of the DUOC-UC footbridge
J.T. Padilla, L.M Zamora & J.J. Olivera
M.Sc. Students, Universidad Católica de la Santísima Concepción, Concepción, Chile.
C.A. Oyarzo-Vera
Senior Lecturer, Universidad Católica de la Santísima Concepción, Concepción, Chile.
ABSTRACT: The results of an operational modal analysis conducted on a footbridge in
Concepción, Chile, are presented in this article. Accelerometers were attached at different
points on the footbridge and one-hour ambient tests were performed on different days and
hour times. Stochastic Subspace Identification (SSI) and Frequency Domain
Decomposition (FDD) were employed to determine the dynamic properties of the
structure (modal frequencies and mode shapes). The experimental results were compared
with the modal response calculated from a numerical model in SAP2000. Results are
discussed in terms of the similitude between experimental and theoretical response.
1 INTRODUCTION
Footbridges are generally slender structures that may experience large displacements or excessive
vibrations due to ambient excitations (pedestrian flow, vehicles traffic, wind, tremors, etc). These
structures are usually designed using computational models that verify the strength of each of the
constituent elements, but also the design must meet serviceability conditions, such as, limits for
deformations and vibrations. Usually, strength conditions are easily satisfied by footbridge design.
However, it is not exceptional finding structures that experienced vibrations which amplitude or
frequency generates discomfort in users. This undesired structural behavior is usually not predicted by
the numerical models because they do not necessarily represent the actual response of the structure in
an exact manner (Bayraktar et al., 2010). Moreover, numerical models are generally not validated by
any mean. Hence, it is impossible that these models can trustfully predict the actual structural
performance if they are not calibrated using experimental measurements on the real structure.
A tool to calibrate numerical models considers measuring the low intensity vibrations that experienced
structures due to ambient excitations (Ren et al., 2004; Gentile et al., 2011). The modal parameters
that dynamically characterize the structures (frequencies, mode shapes and damping) are extracted
from these operational vibration records. This information is then compared to the response predicted
by numerical models and the models are adjusted to match the response measured on the real
structure. These procedures are known as operational modal analysis (Brincker et al., 2000), system
identification and model updating.
Our study aims to identify the modal properties (modal frequencies and mode shapes) of a pedestrian
arch bridge built in laminated timber and steel. These experimental data will be then employed to
obtain an improved numerical model of this structure that will be used to predict the bridge
performance under operational and extreme conditions.
2 DESCRIPTION OF THE STRUCTURE
DUOC–UC footbridge is located over Avenida Paicaví, in front of the UCSC Medical Center in
Concepción, Chile (Fig. 1). The footbridge consists of two 52 m long and 6.5 m height arches. The
main elements of the arch are four curved beams made of laminated timber of radiata pine hinged at
both ends (supports and middle length of the arches). These beams have a rectangular section of
1100 x 200 mm. A steel structure is attached to the main beams, with columns spaced every 4 m. This
steel structure supports a 100 mm thick radiata pine slab with an 80 mm thick top layer of asphalt
(Fig. 2).
Paper Number 24

2
This footbridge is highly transited because it connects two educational institutions (UCSC and DUOC-
UC) with a main road. The peak of pedestrian flow occurs between 12:00 and 14:00 hours and
between 17:00 and 19:00 during week days, especially from March to December. The peak of
vehicular flow under the bridge occurs at the same time frame.
Figure 1: Reference location of
footbridge in Concepción Figure 2: DUOC-UC footbridge
3 NUMERICAL MODEL
3.1 Model description
A model was generated using the finite elements software SAP2000 (Fig. 3). The numerical model has
256 nodes and consists of 330 frame elements and 102 shell type elements. The traffic slab,
constituted of timber slab covered by an asphaltic layer, was modelled with shell element (100 mm
thick) which equivalent to weight was 1520 kg/m3. Timber mechanical properties (Young’s modulus
and Poisson’s ratio) were assigned to the traffic slab as a first modelling approach. The properties of
steel members, laminated timber beams and traffic slab are presented in Table 1. This model was used
to determine the optimal locations for structure instrumentation.
Figure 3: Footbridge model in SAP2000
Table 1: Material properties
Laminated Timber Steel Traffic Slab
Young's Modulus (MPa) 112 2,1 104
Poisson's Ratio 0.3 0.3 0.3
Weight (kg/m3) 480 7800 1520
3.2 Model results
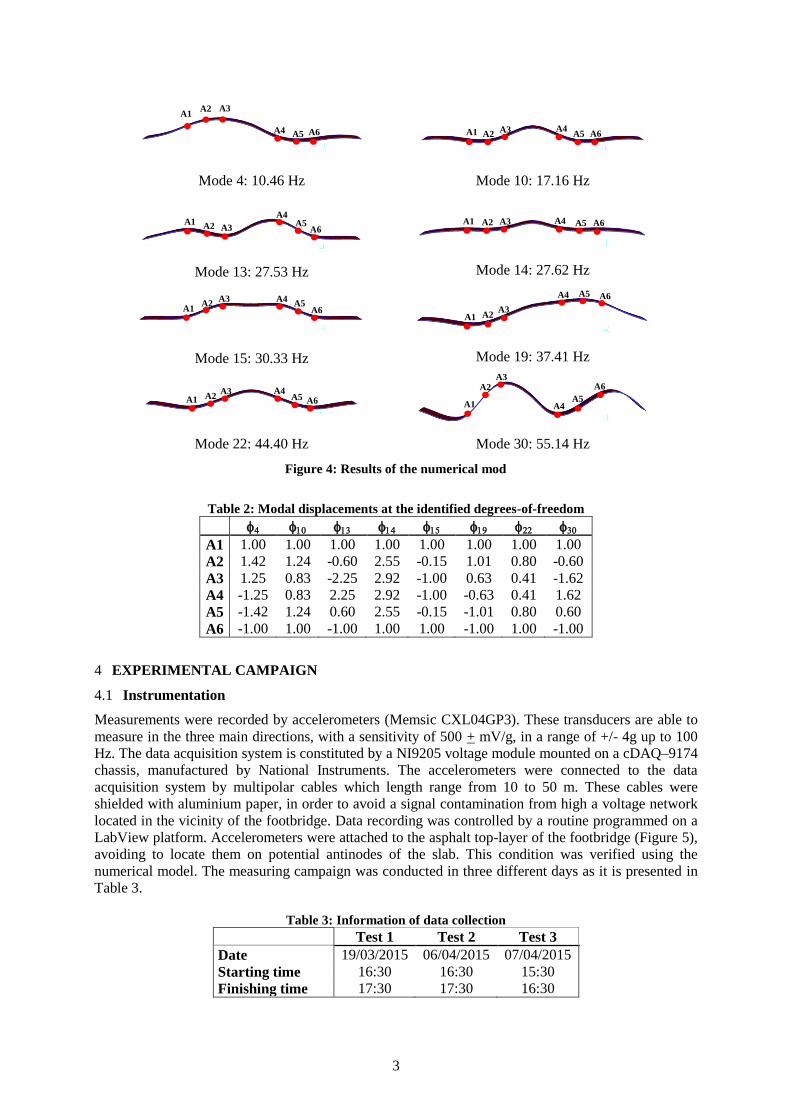
The modes with higher participation of the traffic slab in the vertical direction were identified and the
corresponding modal frequencies and mode shapes are presented in Figure 4. The modal
displacements recorded at the optimal locations (A1 to A6) identified to determine the mode shapes
are presented in Table 2. These locations were considered latter in this study to attach the instruments
for experimentally identifying modal response.
Timber
beam
52 m
6.5 m
3
Mode 4: 10.46 Hz
Mode 10: 17.16 Hz
Mode 13: 27.53 Hz
Mode 14: 27.62 Hz
Mode 15: 30.33 Hz
Mode 19: 37.41 Hz
Mode 22: 44.40 Hz
Mode 30: 55.14 Hz
Figure 4: Results of the numerical mod
Table 2: Modal displacements at the identified degrees-of-freedom
A1 1.00 1.00 1.00 1.00 1.00 1.00 1.00 1.00
A2 1.42 1.24 -0.60 2.55 -0.15 1.01 0.80 -0.60
A3 1.25 0.83 -2.25 2.92 -1.00 0.63 0.41 -1.62
A4 -1.25 0.83 2.25 2.92 -1.00 -0.63 0.41 1.62
A5 -1.42 1.24 0.60 2.55 -0.15 -1.01 0.80 0.60
A6 -1.00 1.00 -1.00 1.00 1.00 -1.00 1.00 -1.00
4 EXPERIMENTAL CAMPAIGN
4.1 Instrumentation
Measurements were recorded by accelerometers (Memsic CXL04GP3). These transducers are able to
measure in the three main directions, with a sensitivity of 500 + mV/g, in a range of +/- 4g up to 100
Hz. The data acquisition system is constituted by a NI9205 voltage module mounted on a cDAQ–9174
chassis, manufactured by National Instruments. The accelerometers were connected to the data
acquisition system by multipolar cables which length range from 10 to 50 m. These cables were
shielded with aluminium paper, in order to avoid a signal contamination from high a voltage network
located in the vicinity of the footbridge. Data recording was controlled by a routine programmed on a
LabView platform. Accelerometers were attached to the asphalt top-layer of the footbridge (Figure 5),
avoiding to locate them on potential antinodes of the slab. This condition was verified using the
numerical model. The measuring campaign was conducted in three different days as it is presented in
Table 3.
Table 3: Information of data collection
Test 1 Test 2 Test 3
Date 19/03/2015 06/04/2015 07/04/2015
Starting time 16:30 16:30 15:30
Finishing time 17:30 17:30 16:30
A1
A1
A1
A1
A1
A1
A1
A1
A2 A3
A4 A5 A6 A2 A3 A4
A5 A6
A2 A3
A4 A5
A6 A2 A3 A4 A5 A6
A2 A3 A4
A5 A6
A2 A3
A4 A5 A6
A2 A3 A4
A5 A6
A2 A3
A4 A5
A6

4
Figure 5: Position of the accelerometers. (a) Lateral view, and (b) Plane view.
4.2 Modal parameters identification
Two system identification methods were employed to determine the modal properties of the structure:
Stochastic Subspace Identification (SSI) and Frequency Domain Decomposition (FDD). The SSI
method (van Overschee & de Moor, 1996) is a data-driven time-domain technique that employs QR-
factorization and singular value decomposition to identify the matrices of the dynamic state-space
model. Once the state space model of the structure is found, the modal parameters (natural
frequencies, damping ratios and mode shapes) can be determined by eigenvalues decomposition. In
general, it is not possible to determine the system order beforehand. Therefore, it is necessary to repeat
the analysis with different system orders and verify the repeatability of the results. This procedure is
performed by constructing stabilization charts (Figure 6). In this graph, the dots represent the
fundamental frequencies of the poles (modes) identified considering models with different system
orders (SO). The red dots are associated with those frequencies that are similar to another frequency
detected in the precedent model, while the blue circles around the dots represents those poles that have
a similar mode shape to a pole detected in the precedent model. Those poles that reveal stability in
terms of similar frequencies and mode shapes (usually aligned in a vertical column in the graph) are
very likely to represent vibration modes.
(a) (b) (c)
Figure 6: Stabilization charts of (a) Test 1, (b) Test 2 and (c) Test 3.
The FDD method (Brincker et al., 2000) is an extension of the classical peak-picking method. The
FDD algorithm assumes that the excitation applied on the structure has a random nature and can be
described as a white-noise. Thus, the excitation power spectral density function (PSD) becomes a
constant (S) and, consequently, the FRF peaks can be directly identified from the peaks of the response
PSD function. These peaks on the PSD function are assumed as resonant frequencies and mode shapes can be determined by applying Single Value Decomposition procedures. The PSD curves obtained for this experiment are presented in Figure 7.
(a)
(b)

5
(a) (b) (c)
Figure 7: Power spectral density curves of (a) Test 1, (b) Test 2 and (c) Test 3
The SSI and FDD methods were able to identify 9 modes. In general, the modal frequencies obtained
by both methods coincide as can be observed in Table 4.
Modal assurance criterion (MAC) is used to compare experimental modal shapes obtained in the
different test and those determined by different methods. MAC is an indicator that represents the
degree of similitude between two mode shapes by determining the minimum square deviation (Eq. 1).
Values close to unit indicate a high similitude between those two modes, and values close to zero do
indicate no similitude between modes.
( )
( )(
)
(1)
where = modal vector identified for testing i ; and = modal vector identified for testing i
*. The
results of this comparison are presented in Tables 5. It can be observed that the modes identified in
Test 1 are similar to those identified in Test 2, while the results of the comparison Test 1 vs Test 3 and
Test 2 vs Test 3 are deficient.
The mode shapes obtained from the data extracted from Test 2 by SSI and FDD methods are
compared in Figure 8.
Table 4: Experimental modal frequencies
Mode
SSI FDD Difference
(%) Test 1
(Hz)
Test 2
(Hz)
Test 3
(Hz)
Average
(Hz)
CoV
(%)
Test 1
(Hz)
Test 2
(Hz)
Test 3
(Hz)
Average
(Hz)
CoV
(%)
1 3.56 3.52 3.54 3.54 0.61 3.52 3.52 3.52 3.52 0.00 0.6
2 5.51 5.34 5.43 5.43 1.59 5.47 5.47 5.47 5.47 0.00 0.7
3 7.09 7.23 7.27 7.19 1.34 7.42 7.42 7.42 7.42 0.00 3.1
4 9.84 9.97 9.85 9.89 0.75 9.77 10.16 9.77 9.90 2.27 0.1
5 11.57 11.77 11.60 11.64 0.92 11.33 11.72 11.72 11.59 1.94 0.4
6 12.50 12.68 - 12.59 0.99 13.28 13.28 - 13.28 0.00 5.3
7 14.46 15.25 14.50 14.73 3.02 14.45 14.84 14.45 14.58 1.54 1.0
8 16.30 16.57 16.31 16.39 0.91 16.02 16.80 16.02 16.28 2.77 0.7
9 - 17.94 17.75 17.85 0.75 - 18.36 17.58 17.97 3.07 0.7
Table 5: MAC values
SSI FDD
Mode Test 1 vs Test 2 Test 1 vs Test 3 Test 2 vs Test 3 Test 1 vs Test 2 Test 1 vs Test 3 Test 2 vs Test 3
1 0.811 0.807 0.955 0.817 0.805 0.967
2 0.794 0.279 0.439 0.892 0.357 0.642
3 0.966 0.613 0.599 0.878 0.795 0.897
4 0.220 0.016 0.471 0.390 0.083 0.406
5 0.620 0.290 0.508 0.611 0.192 0.669
6 0.862 -- -- 0.906 -- --
7 0.002 0.740 0.044 0.000 0.016 0.561
8 0.226 0.044 0.171 0.340 0.05 0.024
9 -- -- 0.269 -- -- 0.385

6
Mode 1
Mode 2
Mode 3
Mode 4
Mode 5
Mode 6
Mode 7
Mode 8
Mode 9
Figure 8: Experimental modal shapes

7
Tables 4 and 5 show that the first three detected modes are the most similar in terms of frequencies
and shapes. The results obtained for these modes were visually paired with the modes numerically
predicted by our SAP2000 model. This comparison is presented in Figure 9 and Table 6. The
differences in between experimental and numerical frequencies are evident, even though the model
was constructed using the most appropriate information available.
This situation clearly illustrate the driving idea presented in this paper: Numerical models must be
calibrated using experimental measurements if an accurate representation of the actual structures
behaviour is desired.
(a) Experimental mode 1 vs. Numerical mode 4
(b) Experimental mode 2 vs. Numerical mode 30
(c) Experimental mode 3 vs. Numerical mode 13
Figure 9: Comparison of experimental and numerical mode shapes
Table 6: Comparison of experimental and numerical frequencies
Experimental freq.
(Hz)
Numerical freq.
(Hz)
f1=3.53 f4=10.46
f2=5.45 f30=55.14
f3=7.31 f13=27.53
The experimentally identified frequencies and those numerically computed are presented in Table 6.
Significant differences are observed between these two results that represent the same vibrating
modes. These differences can be related to misestimations of the actual material properties considered
for the numeric model. For example, one of these properties is the timber Young´s modulus that was
obtained from Chilean Standard (NCh 1198 Of.2006). However, this property is sensitive to
environmental conditions, such as, humidity and temperature, and it can be also affected by damage
due to precedent earthquakes or other kind of extreme load. This estimation can be improved by
performing experimental test on that material, but at the moment it was not possible to extract samples
from the structure.
Even though, this modelling approach has followed the most common engineering practice to be
applied for this kind of projects and was assisted by field surveys, it was not able to perfectly replicate
the actual structural behaviour. This is something we should also expect in the process of design of

8
any similar structure. Thus, it was demonstrated that experimental tests are essential to be performed
for calibrating numerical models that provide accurate representations of the structural response.
5 CONCLUSIONS
Operational modal analysis was performed on an arched footbridge in Concepcion, Chile. Ambient
vibrations due to pedestrian and vehicular traffic were considered as source of excitations. SSI and
FDD methods were successfully employed to extract the modal properties of the structure.
SSI and FDD methods were able of identifying nine modal frequencies from Test 2, while in the other
tests a few modes were missing. The results of both system identification techniques are coincident.
As long both techniques are completely independent and based on different numerical approaches, the
coincident results confirm that the identified modes corresponded to actual vibration modes and not
only to numerical artefacts.
The deficient results in MAC obtained when Test 3 is compared to the others may be interpreted as a
dissimilar mode identification in Test 3. This can be attributed to the difference in the time frame
considered for performing the data recording. Test 1 and 2 were performed one hour earlier than Test
3 (see Table 3) and that may implied differences in source of excitation.
The fundamental hypothesis that inspired this study was clearly confirmed. Numerical models must be
calibrated using experimental measurements if an accurate representation of the actual structures
behaviour is desired. Otherwise, the numerical model is only representative of itself and no trustful
structural diagnosis or prediction can be extracted from it.
The low dispersion observed in the detected frequencies and mode shapes demonstrates an accurate
identification of modal parameters. These parameters will be considered as target values for model
calibration in future works. It is expected that the results of this last stage of the study (model
updating) can be presented in the conference.
REFERENCES:
Brincker, R.. Andersen, P., & Zhang, L. (2000, 7-10 February). Modal identification from ambient
responses using frequency domain decomposition. Paper presented at the 18th International
Modal Analysis Conference (XVIII IMAC), San Antonio, Texas.
Gentile, C., Materazzi, A., & Ubertini, F. (2011, July 6-8). Operational modal testing and analysis of
a long span footbridge, Paper presented at the 4th International conference on Footbridge,
Wroclaw, Poland.
Ren, W., Zhao, T., & Harik, I. E. (2004). Experimental and analytical modal analysis of steel arch
bridge. Journal of Structural Engineering, 130(7), 1022-1031.
van Overschee, P., & de Moor, B. (1996). Subspace identification for linear systems : theory,
implementation, applications Boston: Kluwer Academic Publishers.
Bayraktar, A., Altunisik, A., Sevim, B. & Türker, T. (2010, January). Ambient Vibration Tests of a
Steel Footbridge, Article in journal of nondestructive evaluation. March 2010, Volume
29, Issue 1, pp 14-24.
INN Instituto Nacional de Normalización (2006). NCh 1198 Of.2006: Wood- Wood constructions –
Calculation, Chilean Standard.