Dynamic Characteristics and Seismic Performance Evaluation ...
10
Dynamic Characteristics and Seismic Performance Evaluation of Low Rise Existing RC Moment Resisting Frame using Microtremor Technique and Standard Code of Practice AHMAD FAHMY BIN KAMARUDIN 1 MOHD. EFFENDI BIN DAUD 2 KOH HENG BOON 3 1,2,3 Faculty of Civil and Environmental Engineering Universiti Tun Hussein Onn Malaysia 86400 Pt. Raja, Bt. Pahat, Johor, MALAYSIA 1 [email protected] 2 [email protected] 3 [email protected] ZAINAH BINTI IBRAHIM Department of Civil Engineering, Faculty Engineering University of Malaya 50603 Kuala Lumpur, MALAYSIA [email protected] AZMI BIN IBRAHIM Faculty of Civil Engineering Universiti Teknologi MARA 40450 Shah Alam, Selangor, MALAYSIA [email protected] Abstract: - Most of existing multi-storey reinforced concrete (RC) buildings in Malaysia was designed to BS 8110 without considering seismic load. Tremors generated from previous distant earthquakes occurred from Sumatran faults zone had shaken many low-rise to high-rise buildings in Peninsular Malaysia and emerged panic. Worst scenario when the conventional practice of unreinforced masonry like brick wall is weak in lateral resistance and ease to damage. Poor soil condition may also have a crucial modifying influence occasionally acted as a resonator and amplifies the seismic wave when reached to ground surface. A microtremor study was conducted in order to evaluate the dynamic characteristics of site-structure, resonance potential and seismic capacity of an existing 4-storey RC primary school building and its site in SK Sri Molek which located in Batu Pahat-Johor. From the findings, it was expected that the building is prone to resonate since both site and building have only a slight different between their natural frequencies. The predominant building frequencies were predicted at 4.20 Hz and 4.35 Hz in transverse and longitudinal directions whereas for site fundamental frequencies were between 2.69 to 3.20 Hz in North-South (NS) direction and 2.79 to 2.98 Hz in East-West (EW) direction. By using the site response spectra for Kuala Lumpur region based on the consideration of large magnitude of distant earthquake scenario at 9.3 and 530 km of the closest to site distance produced by previous researcher, the design response spectrum (RS A ) has given 0.32 m/s 2 at natural period between 0.15 to 0.40 s. From this RS A value, an equivalent static analysis (ESA) for base shear force estimation was performed according to EC 8 [2]. The analysis shows that, the design ultimate horizontal load described in BS 8110 [3] based on conventional load combination has been exceeded more than 1.5% as recommended by the code. Key-Words: - Microtremor, dynamic characteristics, resonance, base shear force 1 Introduction Less attention has been given to the earthquake hazard especially in low seismic region such as Malaysia. This scenario could be due to previous earthquakes had not inflicted to any severe damage or casualty [4]. Although Peninsular Malaysia is located in the stable Sunda shelf with low to Recent Advances in Civil and Mining Engineering ISBN: 978-960-474-337-7 182
Transcript of Dynamic Characteristics and Seismic Performance Evaluation ...
Dynamic Characteristics and Seismic Performance Evaluation of Low
Rise Existing RC Moment Resisting Frame using Microtremor
Technique and Standard Code of Practice
AHMAD FAHMY BIN KAMARUDIN1
MOHD. EFFENDI BIN DAUD2
KOH HENG BOON3
1,2,3 Faculty of Civil and Environmental Engineering
Universiti Tun Hussein Onn Malaysia
86400 Pt. Raja, Bt. Pahat, Johor, MALAYSIA 1
ZAINAH BINTI IBRAHIM
Department of Civil Engineering, Faculty Engineering
University of Malaya
50603 Kuala Lumpur, MALAYSIA
AZMI BIN IBRAHIM
Faculty of Civil Engineering
Universiti Teknologi MARA
40450 Shah Alam, Selangor, MALAYSIA [email protected]
Abstract: - Most of existing multi-storey reinforced concrete (RC) buildings in Malaysia was designed to BS
8110 without considering seismic load. Tremors generated from previous distant earthquakes occurred from
Sumatran faults zone had shaken many low-rise to high-rise buildings in Peninsular Malaysia and emerged
panic. Worst scenario when the conventional practice of unreinforced masonry like brick wall is weak in lateral
resistance and ease to damage. Poor soil condition may also have a crucial modifying influence occasionally
acted as a resonator and amplifies the seismic wave when reached to ground surface. A microtremor study was
conducted in order to evaluate the dynamic characteristics of site-structure, resonance potential and seismic
capacity of an existing 4-storey RC primary school building and its site in SK Sri Molek which located in Batu
Pahat-Johor. From the findings, it was expected that the building is prone to resonate since both site and
building have only a slight different between their natural frequencies. The predominant building frequencies
were predicted at 4.20 Hz and 4.35 Hz in transverse and longitudinal directions whereas for site fundamental
frequencies were between 2.69 to 3.20 Hz in North-South (NS) direction and 2.79 to 2.98 Hz in East-West
(EW) direction. By using the site response spectra for Kuala Lumpur region based on the consideration of large
magnitude of distant earthquake scenario at 9.3 and 530 km of the closest to site distance produced by previous
researcher, the design response spectrum (RSA) has given 0.32 m/s2 at natural period between 0.15 to 0.40 s.
From this RSA value, an equivalent static analysis (ESA) for base shear force estimation was performed
according to EC 8 [2]. The analysis shows that, the design ultimate horizontal load described in BS 8110 [3]
based on conventional load combination has been exceeded more than 1.5% as recommended by the code.
Key-Words: - Microtremor, dynamic characteristics, resonance, base shear force
1 Introduction Less attention has been given to the earthquake
hazard especially in low seismic region such as
Malaysia. This scenario could be due to previous
earthquakes had not inflicted to any severe damage
or casualty [4]. Although Peninsular Malaysia is
located in the stable Sunda shelf with low to
Recent Advances in Civil and Mining Engineering
ISBN: 978-960-474-337-7 182
medium seismic activity level, however the effect of
tremors from Sumatra earthquakes have been
reported several times [5]. According to Megawati
et al. [6], it was predicted that an earthquake at
moment magnitude greater than 7.8 from the
Sumatra subduction zone has the capability to
generate destructive ground motion in Singapore
and Kuala Lumpur, even at a distance of 700 km.
Even a longer distance may create destructive
ground motion, it seems reasonable to postulate
larger and closer earthquakes that might result in
tremendous ground motion to Peninsular Malaysia
especially [7].
Reinforced concrete framed structures had
shown in large number of deterioration or become
unsafe when subjected to changes in loading and
configuration [8]. Worst, when no specific guideline
was proposed in re-evaluating the dynamics
performance of underlying site, and vulnerability of
existing RC moment resisting frame (MRF) in
Malaysia up to date. It is important to take serious
action on seismic hazard in order to provide
structural and occupant safety especially to the
existing RC structure.
In a situation of distant earthquake, the seismic
waves that reached to Peninsular Malaysia bedrock
is rich in long period waves which significantly
amplified due to resonance when they propagate
upward, especially through the soft soil sites with a
frequency close to the predominant frequency of the
seismic waves [9]. The amplification waves may
cause resonance to the buildings and inducing a
large motions on the buildings which enough to be
felt by the residence [9]. The reliability of these site-
structure interactions effect due to resonance
phenomenon had significantly proven in the
destruction of selective buildings between five to
fifteen storey which were constructed on the soft
ground strata in 1985 Mexico City earthquake [10],
even the epicenter distance was 320 km to 350 km
away. Hence, it is important to consider the effect of
soil-structure resonance either in seismic design or
re-evaluation work on existing site or structure
including to distant earthquake region due to a
tendency of resonance disaster for safety reason.
In this study, microtremor technique was
conducted in order to evaluate the resonance of site-
structure frequencies of existing new low rise
reinforced concrete building in SK Sri Molek.
Microtremor is a non-destructive method, cheap but
effective. It is suitable for a region which lacking of
ground motions records but higher level of noise for
dynamic characteristics investigation of a ground
surface layer or structure. The equipment is also
light and only small number of operators needed in
in-situ measurement [11], at the same time gives
extra credit to additional advantages. Besides, the
base shear force was also calculated using a
developed response spectra by Looi et al. [1].
According to Gioncu and Mozzalani [12], ESA is a
simplified dynamic analysis and available when
there has a predominant mode of vibration (primary
mode of vibration) compared to others, and the
system is accurately modeled by a single degree of
freedom. ESA is an approximation method but
adequate for regular building type at the ground
fundamental period having close to the first
vibration of the structure.
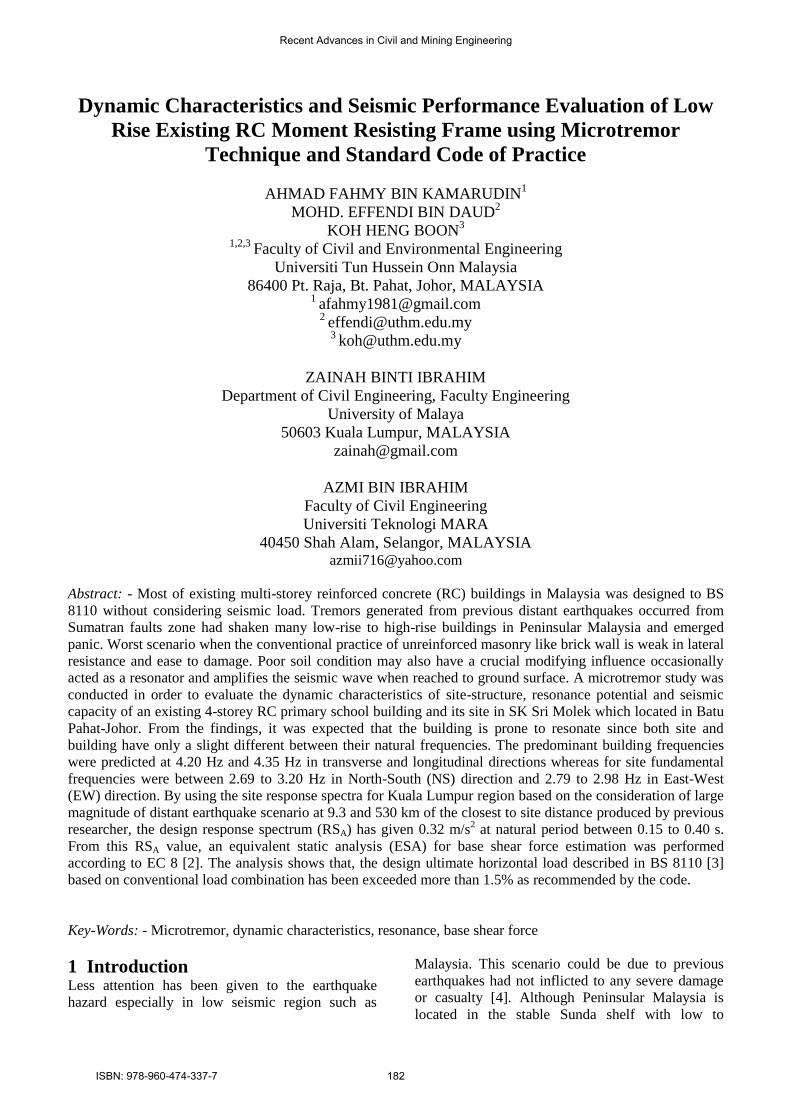
2 Study Area and Fieldwork Fig. 1 shows the location and front elevations of SK
Sri Molek building. This building is a 4-storey
reinforced concrete structure which located in
Senggarang, Batu Pahat-Johor. The school is
designed by Public Works Department Malaysia
(JKR) based on a standard RC design with typical
building configuration of 3.6 m storey height, 3 m
spacing between bays, 7.5 m building width and 2.1
m length of cantilever corridor balcony with 1.05 m
of parapet wall height. The total length of the
building is 60 m.
Fig. 1 Location and elevations of SK Seri Molek
1o 46’ 10.53” N
102 o58’ 9.18” E
C1 C3
C2
C5
C4
C7
C6
C9
C8
C11
C10
C13
C12
C15
C14
C17
C16
C19
C18 C20
GF
1stF
2ndF
3rdF
C21
Recent Advances in Civil and Mining Engineering
ISBN: 978-960-474-337-7 183

Each floor is divided into a few rooms as shown
in Fig. 2. On the upper floor, four main rooms are
used for prayer room (TBA 6), classroom (TBD
3A), lounge room (TBL 3) and counseling room
(TBB 2). Meanwhile, on the second floor, it has
been provided for a meeting room (TBM 3) and
library (TBR10) followed by a headmaster office
(TBP 9) and teachers’ room (TBT 5) on the first
floor. Sport room (TSS 3), other two classrooms and
health centre (TBE 3) are placed on the ground
floor. The other room functions and imposed load
used in the calculation is tabulated in Table 1.
Fig. 2 Floor plans of SK Sri Molek
A series of microtremor measurements were
performed by using three units of Lennartz portable
tri-axial seismometer sensors (S), with 1 Hz
eigenfrequency, CityShark II data logger and 1 GB
memory. Since the input vibration is based on
ambient vibration in three major components of NS,
EW and vertical (V) directions, the external noises
disturbance such as extreme weather (strong wind,
lightning, heavy rain etc.), transient noises (traffic,
pedestrian, etc.), monochromatic sources
(machinery, pumps, generator etc.) and nearby
structures (tress, pipes, sewer lids etc.) should be in
minimum operation for the best result of natural
frequency prediction as recommended by SESAME
[13] guideline. The site-structure measurements
were started from 8.00 am and finished at 5.30 pm
for five days.
Table 1 Room types in SK Sri Molek building
Code Room Function Qk
(kN/m2)
TBA 6 Prayer room 3.0
TTU 1C Wuduk room 2.0
TSS 3 Sport room 2.5
TBL 3 Lounge room 2.5
TBB 2 Counseling room 2.5
TBT 5 Teacher’s room 4.0
TBD 3A Classroom 3.0
TBC 1 Access room 2.0
TBP 9 Headmaster office 4.0
TBM 3 Main meeting room 4.0
TBS 2 Invigilator room 2.5
TBR 10 Library 4.0
TBE 3 Health centre 2.5
TBY 1 Security room 2.0
T 1 Access 2.0
TBK 1A Book shop 4.0
TBW 1 Prefect Room 2.5
TTP 1 Toilet (Female) 2.0
TTL 1 Toilet (Male) 2.0
TSA 1 Store 2.0
TTS 1 A Toilet (Staff) 2.0
SWITCH ROOM Service room 2.0
Corridor Corridor 3.0
Similar equipment was applied in site and
building measurements. All sensors were referred to
the True North direction as the bench mark. This
bench mark direction is also parallel to the
transverse axis of the building (see Fig. 3). In
building measurement, the sensors were arranged
and positioned in horizontal and vertical sensor
alignments which close to the main structural frame
joint along the corridor. The arrangement of
measurement points in both alignments were given
in Table 2 and Table 3. A total of 14 measurements
were carried out in horizontal alignment whereas 10
measurements in vertical alignment. Meanwhile, for
site measurement, the sensors were placed on 25 m
x 25 m grid as represented by six coloured red dots
in Fig. 3. Only two measurements on site were
considered in the analysis. The sampling rate of 100
Hz was used at optimum gain level in all recording.
15 minutes of recording length was taken in site as
well as in building measurements. All frequencies
below 1 Hz were not of interested [14], in both
building and site measurements.
2.1
m
Third floor (3rd
F)
Second floor (2nd
F)
Second floor (2nd
F)
First floor (1stF)
Ground floor (GF)
Corridor
Corridor
Corridor
Corridor
C1 C3
C2
C5
C4
C7
C6
C9
C8
C11
C10
C13
C12
C15
C14
C17
C16
C19
C18 C20
C21
Corridor
60 m
7.5
m
Recent Advances in Civil and Mining Engineering
ISBN: 978-960-474-337-7 184

Table 2 Arrangement and position of sensor on
every floor in horizontal measurements
Floor No Sensor 1 (S1) Sensor 2 (S2) Sensor 3 (S3)
3rd, 2nd and
1st Floor
C11 C21 C1
C11 C3 C19
C11 C6 C16
C11 C9 C13
Ground Floor C11 C21 C1
C11 C16 C6
Table 3 Arrangement and position of sensor at
selected columns in vertical measurements
Column No Sequence of Floor Alignment
C1, C6, C11, C16, C21
S1 3rd S1 3rd
S2 2nd S2 2nd
S3 1st - -
- - S3 GF
Fig. 3 Layout plan of SK Seri Molek and positions
of sensors on site
3 Data Processing and Analysis Horizontal to Vertical Spectral Ratio (HVSR)
technique is an attractive method especially in
estimating the dynamic characteristics of a structure
or site in low or none seismicity regions [5]. It is
widely used nowadays due to much faster, cheaper
and non-destructive compared to conventional
methods. Besides, it also proven that the
amplification of strong motion at the predominant
frequency of ground may approximately estimate
through this technique but in a case of larger
amplitude of vertical component dominating (when
influenced by Rayleigh wave), it may affect to the
prediction of amplification characteristic [6]. HVSR
is also not recommended in determination of
building frequencies if the soil amplification is
significant strong which may contaminate to the
building response [7]. Therefore, careful analysis
and evaluation must be carried out. In this study,
respective dynamic characteristics estimation for
site and building was applied via HVSR technique
and a standard method of Fourier amplitude spectra
(FAS). In order to check the reliability of a building
natural frequency, there should has a good
correspondence frequency at each measured floor
with the peaks predominant frequency will increase
with increase of height [7].
Geopsy software was used in the analysis as a
processing tool for HVSR and FAS curves analyses,
based on the following variable parameters; 15 sec
of automatic window length was selected with anti-
triggering algorithm and a cosine taper of 5%. The
Fourier spectra were computed for each window
length and smoothed by Konno Ohmachi smoothing
constant of 40. Directional energy method was
chosen in HVSR analysis when the ambient
vibration signals in both NS and EW are calculated
accordingly to respective direction. Reliability and
clarity of the significant peaks of mean HVSR
curves were checked based on the recommended
criteria by the SESAME [13] guideline. The
dynamic characteristics in terms of predominant
frequency of building, Fo, and fundamental
frequencies of ground surface, fo, in conjunction
with site-structure amplifications, Ao, were
determined. Illustration of dominant vertical mode
shape based on predominant frequencies given in
both longitudinal and transverse directions were
produced. Besides, the horizontal mode shape was
also prepared in order to study the lateral deflection
mode.
Estimation of the base shear force was computed
using equivalent static analysis according to EC 8
[2]. The intensity of dead load (Gk) and imposed
load (Qk) used were based on typical standard
construction design characteristics as proposed by
JKR and BS 6399-1 [18]. Since none of a site
specific response spectrum has been developed in
this study region up to this moment, the design
response spectrum produced by Looi et al. [1] as in
Fig. 4 was adopted. The used RSA was modeled
based on the consideration of large magnitude
distant earthquake scenario at 9.3 from neighboring
region of Sumatra with 530 km of the closest to site
distance. Comparison was made to the estimated
597-S1
597-S3
597-S2
561-S3
561-S1
561-S2
Recent Advances in Civil and Mining Engineering
ISBN: 978-960-474-337-7 185

S1 3.20 5.71 R C Passed
S2 2.69 7.78 R C Passed
S3 3.42 9.99 NR C Failed
S1 2.98 8.32 NR C Failed
S2 2.88 6.78 R C Passed
S3 2.98 7.46 R C Passed
S1 2.88 7.55 R C Passed
S2 2.79 11.68 NR C Failed
S3 3.20 9.95 NR C Failed
S1 2.79 6.37 R C Passed
S2 2.79 9.82 NR C Failed
S3 2.88 7.37 R C Passed
597-EW
Reliable (R) or No
Reliable (NR)
Clear (C) or No Clear
(NC)
Criteria: Passed, Failed or
Recommended to be Repeated
Natural Frequencies
, f o
(Hz)
Amplification Factor,
A o
File No. Sensor No.
561-NS
561-EW
597-NS
applicable notional design ultimate horizontal force
that can be resisted by the building. As stated in
BS8110 [3], conventional design load combination
of 1.4 Gk + 1.6 Qk should be capable to resist a
notional design ultimate horizontal load applied at
each floor or roof level simultaneously equal to 1.5
% of the characteristic dead weight of the structure
between mid-height of the storey below and either
mid-height of the storey above or the roof surface.
Fig. 4 Redrawn RSA for Kuala Lumpur region [1]
4 Results and Discussions
4.1 Dynamic Characteristics of Site-
Structure and Resonance Effect Table 4 indicates the passing files of site
fundamental frequencies (no shaded row) carried
out based on recommendations criteria by SESAME
[13] which must fulfilled 3/3 of reliability criteria,
and at least 5/6 for clarity criteria of HVSR curve.
The predicted fo were obtained between 2.69 to 3.20
Hz with maximum Ao of 7.8 in NS direction. While,
in EW, it shows between 2.79 to 2.98 Hz for
maximum Ao reached was 7.46. Rough evaluation
of soil depth in conjunction with the natural period
below < 0.5 s shows that, this site may be classified
in shallow stiff soil stratification with 6 to 30 m soil
depth based on B&R-M system [19].
The theory and interpretation of ambient
vibration for buildings are not so structure and
straightforward as for the free-field case (site) [20].
The main difficulties is to detect and eliminate the
effects of fundamental frequencies of the nearby
free-field and other buildings in the vicinity [20].
Besides, strong site amplification may also able to
contaminate the building response and false
prediction to the building natural frequencies. Due
to these reasons, comparison between FAS (only
considered on the upper floor for building) and
HVSR (on the ground surface for site) curves in NS
and EW was produced for predominant building
frequency assessment. Interesting results were
shown when the peak FAS curves in NS direction
was slightly shifted to 4.20 Hz (see Fig. 5a) but vice
versa in EW direction (see Fig. 6a), whereby the
sites amplifications were highly dominated between
2.69 to 3.20 Hz (see Fig. 5e) and 2.79 to 2.98 Hz
(see Fig. 6e). It was expected that, the first mode of
building frequency in EW was predicted to occur at
the second peaks frequency of 4.35 Hz which can be
clearly seen from the FAS curves. This
circumstance could be due to high amplifications
factor of site that largely contaminate to the building
response in both directions even though on the
upper floor and become stronger when lowering to
the ground level. Besides, it was clearly shown in
Fig. 5b-d and Fig. 6b-d when the peak frequency of
FAS curves tend to approach to site’s HVSR peak
as given in Fig. 5e and Fig. 6e, especially when
reaching to bottom level.
Table 4 Reliability and clarity checking of HVSR
curve
Small difference between site and building
natural frequencies observed may trigger into the
potential of resonance effect. According to Gosar
[20], the indication of soil-structure probable can be
applied by taking the ratio between building
frequency that is closer to the site frequency. When
the difference is within +15%, the danger of soil-
structure resonance is high, if it is within +15 to
25% it is medium, while if it is higher than +25%,
then it is low [20]. Thus, Table 4 indicates the
computed result of site- structure resonance level.
From the ratio of 4.20 Hz of Fo and 3.42 Hz by the
fo taken into consideration, it shows to medium level
of resonance potential.
Table 5: Indication to site-structure potential level
Fo(Hz) fo (Hz) Danger to Soil-Structure
Resonance Potential
NS 4.20 2.6 – 3.20 Medium
EW 4.35 2.98
TC = 0.4 s
PGA = 0.095 m/s2
0
0.1
1
10
1 2 3 4 5 6 T (s)
RSA/
Se(T)
(m/s2)
Recent Advances in Civil and Mining Engineering
ISBN: 978-960-474-337-7 186

Fig. 5 FAS and HVSR curves for building and site
in NS/ transverse direction
4.2 Mode Shapes
Vertical and horizontal mode shapes were drawn
according to the predominant frequencies of
building obtained at 4.20 Hz and 4.35 Hz in
respective directions. From Fig. 7 and Fig. 8, the
displacement pattern of the building has shown a
similar trend when the upper storey remained the
Fig. 6 FAS and HVSR curves for building and site
in EW/ longitudinal direction
highest amplitude value and it decreasing when
lowering to the ground level. Consistent result was
also given by the horizontal mode shapes as in Fig.
9 and Fig. 10. Even the school has almost
geometrically symmetry, however the deformations
between bays were slightly different due to several
expected reasons as highlighted in following
discussions.
Po
tenti
al
to
Res
ona
nce
Zon
e
2.79 Hz 2.98 Hz
a) Fo-3rd
F-EW
b) Fo-2nd
F-EW
c) Fo-1stF-EW
d) Fo-GF-EW
e) fo-Site-EW
4.35 Hz
a) Fo-3rd
F-NS 4.20 Hz
2.69 Hz
3.20 Hz
b) Fo-2nd
F-NS
c) Fo-1stF-NS
d) Fo-GF-NS
e) fo-Site-NS
Po
tenti
al
to
Res
ona
nce
Zon
e
Recent Advances in Civil and Mining Engineering
ISBN: 978-960-474-337-7 187

By referring to Fig. 7c and Fig. 8c, the center
column of C11 has indicated to the highest top
displacement in NS and EW directions, compared to
the adjacent column of C6 and C16 on the same
floor. This situation may be due to higher mass
concentration developed at the mid-span in addition
to farther distance of the staircases which located in
bay two (between C2 to C3) and bay eighteen
(between 18 to 19) which less contribute to lateral
resistance. Besides, larger imposed loads induced by
a classroom (on the 3rd
floor) and library (on the 2nd
floor) located at the mid-span of the building may
also explained the sources of the mass. However,
the displacement amplitudes were reducing when
reaching to the both ends as illustrated in Fig 7a-b
and 7d-e, as well as Fig. 8a-b and Fig. 8d-e.
Meanwhile, from the view of horizontal mode
shapes which involved the translational deformation
in NS and EW directions for every floor have shown
to similar pattern when the upper floor indicates to
the highest displacement amplitude and it's getting
lesser when lowering down to the ground level.
Interesting finding was found when inconsistent
shape of the bending curves given by the first three
floors from top (see Fig. 8a-c) in NS direction, but a
steady mode shape given in EW direction (see Fig.
9). On the upper floor (see Fig. 9a), the maximum
displacement amplitude was given at C11 and it
started to reduce when reaching to both ends.
However, C11 shows the least displacement
amplitudes on the first floor (see Fig. 9c), but it’s
getting bigger when approaching to the ends.
Similar pattern also found on the ground level mode
shape as in Fig. 9d. This scenario may be affected
by the ground amplification intrusion to lower levels
of building since higher Ao were observed on S3 and
S2 positions (closer to both ends of the building)
compared to S1 (closer to C11) from the site
measurement findings.
Finally, in Fig. 10a-d, almost a straight deflection
lines were illustrated in all diagrams. However, a
significant difference was obtained on the first floor
NS
a) C1-NS b) C6-NS c) C11-NS d) C16-NS e) C21-NS
Fig. 7 Dominant vertical mode shape at 4.20 Hz in NS direction for selective column 1 to column 21
NS
a) 3rdF-NS b) 2ndF-NS c) 1stF-NS d) GF-NS
Fig. 9 Horizontal mode shape at 4.20 Hz in NS direction on ground floor to upper floor
Fig. 10 Horizontal mode shape at 4.35 Hz in EW direction on ground floor to upper floor
EW
a) 3rdF-EW
b) 2ndF-EW c) 1stF-EW d) GF-EW
Fig. 8 Dominant vertical mode shape at 4.35 Hz in EW direction for selective Column 1 to Column 21
EW
a) C11-EW b) C6-EW c) C11-EW d) C16-EW e) C21-EW
Recent Advances in Civil and Mining Engineering
ISBN: 978-960-474-337-7 188
(see Fig. 10c) when two measurements at C3-C11-
C19 and C9-C11-C13 have moved farther than
others. The reason was expected due to the external
noise disturbance of human activities and car
transients a few times on ground level during the
measurement since it significantly influencing to the
amplitude of floor displacement.
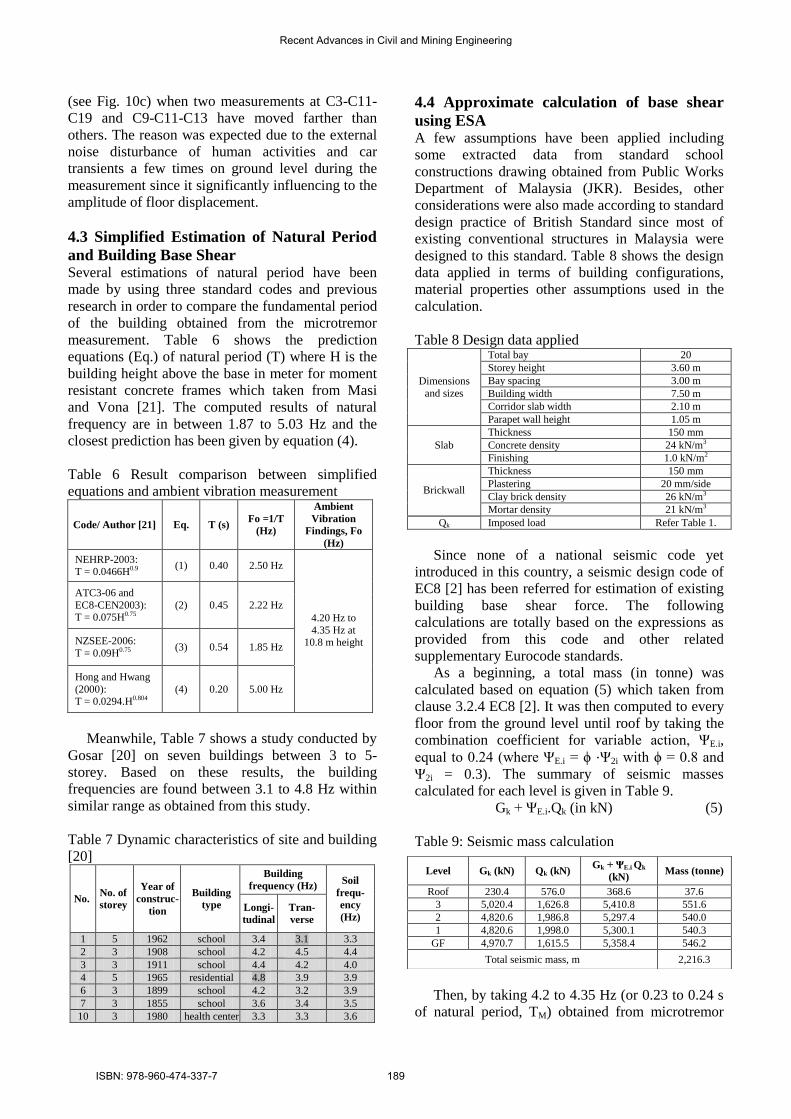
4.3 Simplified Estimation of Natural Period
and Building Base Shear Several estimations of natural period have been
made by using three standard codes and previous
research in order to compare the fundamental period
of the building obtained from the microtremor
measurement. Table 6 shows the prediction
equations (Eq.) of natural period (T) where H is the
building height above the base in meter for moment
resistant concrete frames which taken from Masi
and Vona [21]. The computed results of natural
frequency are in between 1.87 to 5.03 Hz and the
closest prediction has been given by equation (4).
Table 6 Result comparison between simplified
equations and ambient vibration measurement
Code/ Author [21] Eq. T (s) Fo =1/T
(Hz)
Ambient
Vibration
Findings, Fo
(Hz)
NEHRP-2003: T = 0.0466H0.9
(1) 0.40 2.50 Hz
ATC3-06 and
EC8-CEN2003): T = 0.075H0.75
(2) 0.45 2.22 Hz
4.20 Hz to
4.35 Hz at 10.8 m height NZSEE-2006:
T = 0.09H0.75 (3) 0.54 1.85 Hz
Hong and Hwang
(2000): T = 0.0294.H0.804
(4) 0.20 5.00 Hz
Meanwhile, Table 7 shows a study conducted by
Gosar [20] on seven buildings between 3 to 5-
storey. Based on these results, the building
frequencies are found between 3.1 to 4.8 Hz within
similar range as obtained from this study.
Table 7 Dynamic characteristics of site and building
[20]
No. No. of
storey
Year of
construc-
tion
Building
type
Building
frequency (Hz) Soil
frequ-
ency
(Hz) Longi-
tudinal
Tran-
verse
1 5 1962 school 3.4 3.1 3.3
2 3 1908 school 4.2 4.5 4.4
3 3 1911 school 4.4 4.2 4.0
4 5 1965 residential 4.8 3.9 3.9
6 3 1899 school 4.2 3.2 3.9
7 3 1855 school 3.6 3.4 3.5
10 3 1980 health center 3.3 3.3 3.6
4.4 Approximate calculation of base shear
using ESA A few assumptions have been applied including
some extracted data from standard school
constructions drawing obtained from Public Works
Department of Malaysia (JKR). Besides, other
considerations were also made according to standard
design practice of British Standard since most of
existing conventional structures in Malaysia were
designed to this standard. Table 8 shows the design
data applied in terms of building configurations,
material properties other assumptions used in the
calculation.
Table 8 Design data applied
Dimensions
and sizes
Total bay 20
Storey height 3.60 m
Bay spacing 3.00 m
Building width 7.50 m
Corridor slab width 2.10 m
Parapet wall height 1.05 m
Slab
Thickness 150 mm
Concrete density 24 kN/m3
Finishing 1.0 kN/m2
Brickwall
Thickness 150 mm
Plastering 20 mm/side
Clay brick density 26 kN/m3
Mortar density 21 kN/m3
Qk Imposed load Refer Table 1.
Since none of a national seismic code yet
introduced in this country, a seismic design code of
EC8 [2] has been referred for estimation of existing
building base shear force. The following
calculations are totally based on the expressions as
provided from this code and other related
supplementary Eurocode standards.
As a beginning, a total mass (in tonne) was
calculated based on equation (5) which taken from
clause 3.2.4 EC8 [2]. It was then computed to every
floor from the ground level until roof by taking the
combination coefficient for variable action, ΨE.i,
equal to 0.24 (where ΨE.i = ϕ ⋅Ψ2i with ϕ = 0.8 and
Ψ2i = 0.3). The summary of seismic masses
calculated for each level is given in Table 9.
Gk + ΨE.i.Qk (in kN) (5)
Table 9: Seismic mass calculation
Then, by taking 4.2 to 4.35 Hz (or 0.23 to 0.24 s
of natural period, TM) obtained from microtremor
Level Gk (kN) Qk (kN) Gk + ΨE.i Qk
(kN) Mass (tonne)
Roof 230.4 576.0 368.6 37.6
3 5,020.4 1,626.8 5,410.8 551.6
2 4,820.6 1,986.8 5,297.4 540.0
1 4,820.6 1,998.0 5,300.1 540.3
GF 4,970.7 1,615.5 5,358.4 546.2
Total seismic mass, m 2,216.3
Recent Advances in Civil and Mining Engineering
ISBN: 978-960-474-337-7 189
measurement, the site may be categorized in TB < T
< TC as explained in clause 3.2.2.2 in EC8 [2] when
the elastic response spectrum, Se(TM), can be
calculated by using equation (6) with all variables
taken as given in Table 10. The calculated Se(TM)
shows 0.32 m/s2 which similar to the peak
acceleration value given by the design response
spectrum curve as in Fig. 4, for TM between 0.23 to
0.24 s.
Se(T) = ag⋅S⋅η⋅2.5 (6)
Table 10 Computed values of Se(T) Variables Value Remarks
ag : design ground
acceleration
0.095
m/s2 See Fig. 7
η : damping
correction factor 1 Assume for viscous damping of 5%
S : soil factor 1.35
Assume type C with NSPT value of 15
to 50 occurred approximately at 30 m
depth
As stated in expression 4.5 from EC8 [2], the
base shear force can be determined as expressed in
equation (7), when λ is assumed 0.85 due to TM is
lesser than 2TC. From Fig. 4 again, TC is identified
close to 0.4 s.
F = Se(TM)⋅m⋅λ (7)
In the end of this calculation, it shows that the
estimated base shear force may achieve up to 602. 8
kN which bigger than 1.5 % provision of notional
horizontal load as stated in clause 3.1.4.2 from BS
8110 [3].
5 Conclusions Integration of geophysical method and standard
design code of practice may give to a bigger
perspective in re-evaluation of dynamic
characteristics and seismic performance of existing
non-seismically design RC structure. This
methodology can also benefit for a structure or site
which lack of specific design database due to poor
managing record system or the structure is too old.
However, verification via reasonable methods
should be carried out in order to produce a
significant and reliable finding.
In this study, the dynamic characteristics and
seismic performance of a new school RC building in
SK Sri Molek has shown to a successful prediction
by using integration methods of mictrotremor
technique and two standard codes of practices. The
predominant frequencies of building are determined
between 4.20 to 4.35 Hz in transverse and
longitudinal directions, whereby the highest top
displacement occurs on the upper floor and reducing
when lowering to the ground level. The influence of
bigger imposed load that mostly concentrated in the
mid-span and farther from staircases (may react as
bracing member) has increased the translation
displacement amplitude in transverse direction for
C11, but the amplitudes are reducing when
approaching to C1 and C21.
Meanwhile, the fundamental frequencies of site
have indicated between 2.69 to 3.20 Hz with
maximum Ao of 7.8 in NS direction and 2.79 to 2.98
Hz at 7.46 of Ao in EW direction. Reliability and
clarity checking are also performed as
recommended by SESAME [13] guideline. In terms
of resonance potential of site-structure, it is
expected to be classified in moderate level that
could be occurred under equal oscillation between
building and ground surface frequencies, possibly
by strong ground shaking which also lead to
structural damages.
Finally, from estimation of the total base shear
force to EC8 [2] made has indicated that, the
notional design ultimate horizontal load for
conventional load combination design applied in BS
8110 [3] on existing structure has been exceeded.
The design response spectrum is adopted from the
extreme earthquake experience ever recorded at 9.3
earthquake magnitude and 530 km of epicenter
distance in Kuala Lumpur by Looi et al. [1]. Even,
most expectation has been made that a low-rise
structure may survive and experiencing to less
potential to structural damage compared to high-rise
building, however lower natural period from this
kind of building that mostly reflected to the highest
peak of ground acceleration design response spectra
either on hard or soft ground stratification, may
influence to seismic damage potential especially for
building without seismic design provision.
Acknowledgement The authors would like express a great appreciation
to Ministry of Education Malaysia (Higher
Education) grants of ERGS 011 for their financial
support to this research, and also to Universiti Tun
Hussein Onn Malaysia for their sponsorship to this
publication. Besides, a lot of thanks to JKR, District
Education Office of Batu Pahat and SK Sri Molek
administration for their priceless co-operation and
permission along the period of this research being
conducted.
References:
[1] Looi, T.W., Hee, M.C., Tsang, H.H. and Lam,
N.T.K. (2013). Recommended Earthquake
loading model for Peninsular Malaysia.
Recent Advances in Civil and Mining Engineering
ISBN: 978-960-474-337-7 190

Jurutera: Civil and Structural Engineering, Vol
2013 No.4. ISSN 0126-9909, pp. 6-20.
[2] Eurocode 8 (2003). Design of Structures for
Earthquake Resistance; General Rules, Seismic
Actions and Rules for Buildings. Brussels,
European: EC 8: Part 1.
[3] British Standards Institution. (1997). Structural
Use of Concrete, Code of Practice for Design
and Construction. London: BS 8110: Part 1.
[4] Koong, N.K and Won, L.K. (2005). Earthquake
Hazard and Basic Concepts of Seismic
Resistant Design of Structure. Master Builders,
4th Quarter, pp. 90-95.
[5] Adnan, A., Marto, A., and Hendriyawan (2004).
Lesson learned from the effect of recent far
field Sumatra earthquakes to Peninsular
Malaysia. 13th World Conference on
Earthquake Engineering, B.C., Paper No. 416.
Canada: Vancouver.
[6] Megawati, K., Pan, T.C. & Koketsu, K. (2005).
Response spectral attenuation relationship for
Sumatran-subduction earthquake and the
seismic hazard implications to Singapore and
Kuala Lumpur. Soil Dynamics and Earthquake
Engineering, 25, pp.11-25.
[7] Pan, T.C. (1998). Estimation of peak ground
acceleration of the Malay Peninsula due to
distant Sumatran. GeoForschungs Zentrrum
Potsdam. Germany: Scientific Technical Report
STR98/14, pp. 340 – 359.
[8] Mukherjee, A. and Joshi, M. (2005). FRPC
reinforced concrete beam-column joints under
cylic excitation. Composite Structures, 70,
pp. 185-199.
[9] Balendra, T. and Li, Z. (2008). Seismic Hazard
of Singapore and Malaysia. EJSE Special Issue:
Earthquake Engineering in the low and
moderate seismic regions of Southeast Asia and
Australia (2008), pp. 57-63.
[10] Flores, J., Novaro, O., and Seligman, T.H.
(1987). Possible resonance effect in the
distribution of earthquake damage in Mexico
City. Nature, 326. pp. 783-785.
[11] Ivanovic, S.S., Trifunac, M.D., Novikova, E.I.
, Gladkov, A.A. and Todorovska, M.I. (2000).
Ambient vibration tests of a seven-story
reinforced concrete building in Van Nuys,
California, damaged by the 1994 Northridge
earthquake. Soil Dynamics and Earthquake
Engineering 19, pp. 391 – 411.
[12] Gioncu, V. and Mazzolani, F. (2011).
Earthquake engineering for structural design.
New York: Spon Press, pp. 1-527.
[13] SESAME. (2004). Guidelines for the
implementation of the H/V spectral ratio
technique on ambient vibrations:
measurements, processing and interpretation.
European Commission – Research General
Directorate Project No. EVG1-CT-2000-00026.
[14] Gosar, A. (2009). Microtremor soil-structure
resonance in the Bovec Basin (NW Slovenia)
related to 1998 and 2004 damaging earthquake,
In Mucciarelli, M., Herak, M. and Cassidy, J.,
Increasing Seismic Safety by Combining
Engineering Technologies and Seismological
Data, Netherlands: Springer, pp. 241-279.
[15] Nakamura, Y. (2000). Clear identification of
fundamental idea of Nakamura’s techniques
and its applications. Twelfth World Conference
on Earthquake Engineering, New Zealand, pp.
1–8.
[16] Sato, T, Nakamura, Y. and Saita, J. (2004).
Evaluation of the amplification characteristics
of subsurface using microtremor and strong
motion – the studies at Mexico City. 13th
World Conference on Earthquake Engineering,
Paper No. 862, Canada: Vancouver.
[17] Dwa Desa Warnana, Triwulan, Sungkono,
Widya Utama. (2011). Assessment to the soil-
structure resonance using microtremor analysis
on Pare - East Java, Indonesia. Asian
Transactions on Engineering (ATE ISSN: 2221-
4267) Volume 01, Issue 04, pp. 6-12.
[18] British Standards Institution. (1996). Loading
for buildings-Code of practice for dead and
imposed loads. London: BS 6399: Part 1.
[19] Marek, A.R., Bray, J.D., Abrahamson, N.A.
(2009). An empirical geotechnical seismic site
response procedure. In Mucciarelli, M., Herak,
M. and Cassidy, J., Increasing Seismic Safety
by Combining Engineering Technologies and
Seismological Data, Netherlands: Springer, pp.
353-380.
[20] Gosar, A. (2010). Site effects ad soil-structure
resonance study in the Kobarid basin (NW
Slovenia) using microtremors. Nat. Hazards
Earth Syst. Sci. 10, pp. 761-772.
[21] Masi, A and Vona, M. (2009). Estimation of the
period vibration of existing RC building types
Based on experimental data and numerical
result. In Mucciarelli, M., Herak, M. and
Cassidy, J., Increasing Seismic Safety by
Combining Engineering Technologies and
Seismological Data, Netherlands: Springer, pp.
207-225.
[22] Gosar, A. (2010). Microtremor study of site
effects and soil-structure resonance in The City
Of Ljubljana (central Slovenia). Bull.
Earthquake Eng. 8. pp. 571-592.
Recent Advances in Civil and Mining Engineering
ISBN: 978-960-474-337-7 191


![THE DYNAMIC CHARACTERISTICS OF BRIDGE PIERS …library.jsce.or.jp/jsce/open/00670/No42/CLI-42-0001.pdf · THE DYNAMIC CHARACTERISTICS OF BRIDGE PIERS ... Seismic Design [8]. ... Eurocode](https://static.fdocuments.us/doc/165x107/5b1443527f8b9a2f7c8c2b55/the-dynamic-characteristics-of-bridge-piers-the-dynamic-characteristics-of-bridge.jpg)