Episode 6.4 Advanced User’s Guide - Telestream 6.4 Advanced User’s Guide
Upload
bo-andersenCategory
view
225download
2description

AUTOMATED INTELLIGENCE Release 6.4
DYNAMIC AI . AUTOMATED INTELLIGENCE . RELEASE 6.4 DOCUMENTATION
Dynamic AI release 6.4
Dynamic AI version 6.4 introduces a number of new features to help end-users and developers get faster
results, overview and insight into data-sources connected to Dynamic AI.
The new features are:
On-report calculations
Cross-report calculations
Calendar reports with conditional formatting
More pre-programmed calculations options (% of row, % of column)
Calculated column support on column-grouped reports
Prefix and suffix options for totals (like adding %, $ etc.)
Filter defaults
Multi-select report option for ad-hoc creation of dashboards
New drop-down column based actions (date toggle, Hide sum, prefix)
Dictionary caption inheritance
Various improvements and bug fixes
This document describes the new functionality in detail.
DYNAMIC AI . AUTOMATED INTELLIGENCE . RELEASE 6.4 DOCUMENTATION
On-report calculations
On-report calculations are being introduced to Dynamic AI for the following reasons:
1. To give end-users the possibility to make calculations directly in Dynamic AI that would normally
require that the reports are being exported to a spreadsheet.
2. To give end-users with the rights to ad-hoc save or Design the opportunity to keep such
calculations as a fixed part of the report, avoiding having to make the same calculation
definitions more than once.
3. To make key-figure calculations much simpler to do for controllers and developers.
4. To simplify the addition of calculated columns on reports to a degree where end-users can do it
whenever needed.
5. To make Dynamic AI reports simpler to use as the source for calculating and monitoring of any
type of KPI’s.
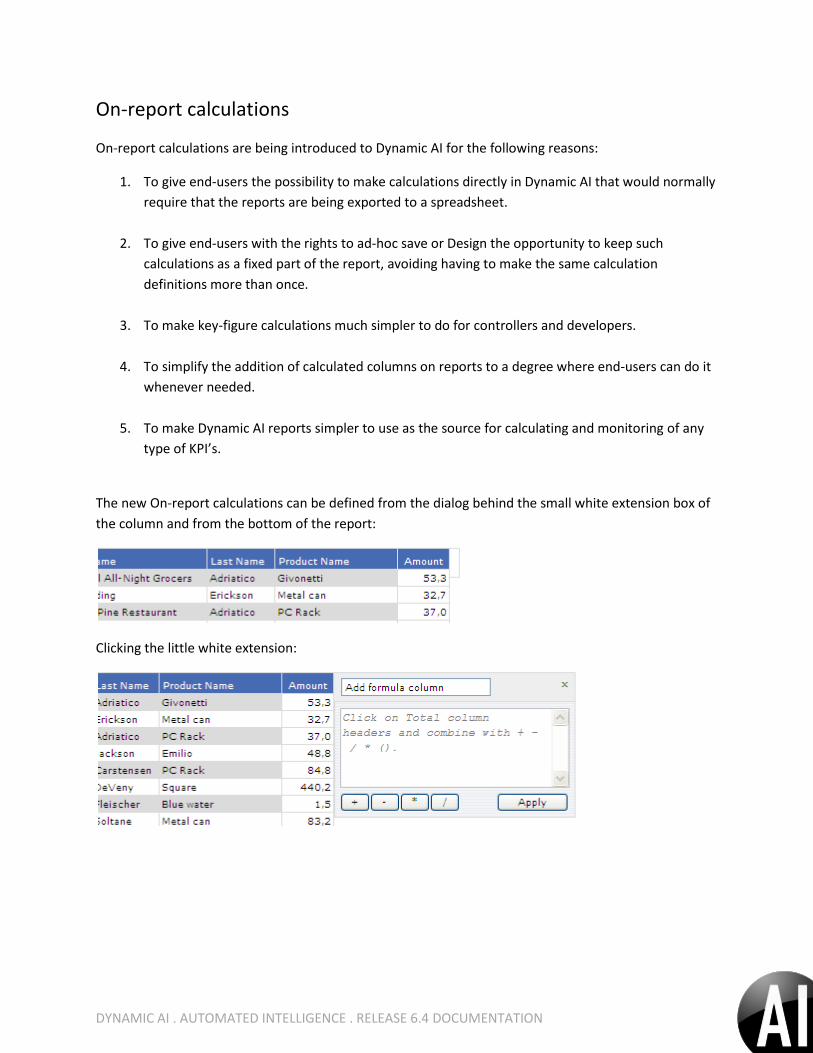
The new On-report calculations can be defined from the dialog behind the small white extension box of
the column and from the bottom of the report:
Clicking the little white extension:

DYNAMIC AI . AUTOMATED INTELLIGENCE . RELEASE 6.4 DOCUMENTATION
And to define key-figures:
Click on the small white extension:
For the purpose of a detailed explanation, the following definitions applies to On-report calculations, however for end-users below definitions are more or less irrelevant depending on the level of sophistication needed in calculations / the rights given to the end-user (see examples later in this chapter). On-report calculations can be any of the three following types of calculations:
A. SQL column calculations, similar to the current +Col (SQL type) definitions in Design. SQL column
calculations can utilize any SQL functions; CASE WHEN, IIF statements that are supported by the
underlying database engine.
SQL column calculations are added as extra columns to the returned data-set behind the report
at whatever level of the report.

DYNAMIC AI . AUTOMATED INTELLIGENCE . RELEASE 6.4 DOCUMENTATION
Example definition (syntax: column names in the data-source behind the report) :
Example results of a SQL column calculation (also showing the definition):
B. Dynamic AI Total (formula) calculations. Calculations that are done with a Dynamic AI specific
syntax on top of the results returned by the SQL statements behind the reports.
Total formula calculations are more limited in functionality, however being separated from the
SQL, Total columns have restricted scope and can therefore without impact on database security
be allowed to end-users that normally would have read access to a report.
Another difference to Total (formula) calculations in comparison to SQL column calculations is
that they calculate on the aggregated breaks/subtotals and totals of the report. I.e. some
calculations can only be done correct by using Total (formula) calculations.
Total (formula) calculations are added as additional report columns to the report.
DYNAMIC AI . AUTOMATED INTELLIGENCE . RELEASE 6.4 DOCUMENTATION
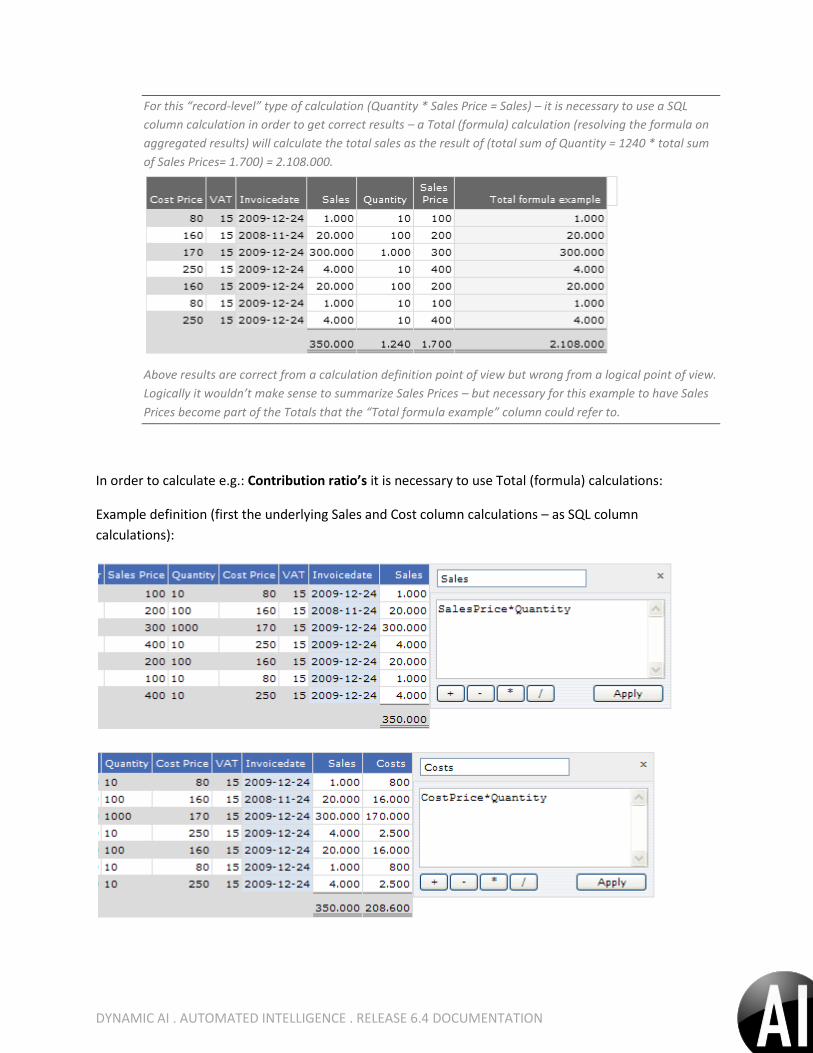
For this “record-level” type of calculation (Quantity * Sales Price = Sales) – it is necessary to use a SQL
column calculation in order to get correct results – a Total (formula) calculation (resolving the formula on
aggregated results) will calculate the total sales as the result of (total sum of Quantity = 1240 * total sum
of Sales Prices= 1.700) = 2.108.000.
Above results are correct from a calculation definition point of view but wrong from a logical point of view.
Logically it wouldn’t make sense to summarize Sales Prices – but necessary for this example to have Sales
Prices become part of the Totals that the “Total formula example” column could refer to.
In order to calculate e.g.: Contribution ratio’s it is necessary to use Total (formula) calculations:
Example definition (first the underlying Sales and Cost column calculations – as SQL column
calculations):
DYNAMIC AI . AUTOMATED INTELLIGENCE . RELEASE 6.4 DOCUMENTATION
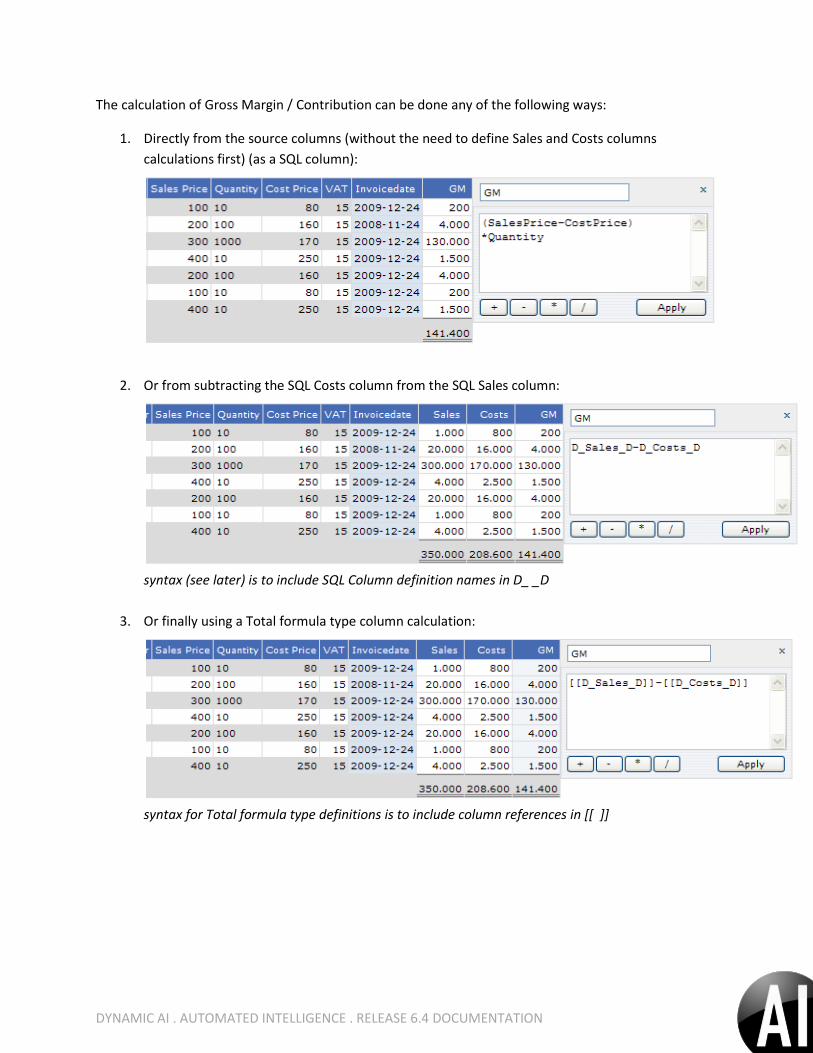
The calculation of Gross Margin / Contribution can be done any of the following ways:
1. Directly from the source columns (without the need to define Sales and Costs columns
calculations first) (as a SQL column):
2. Or from subtracting the SQL Costs column from the SQL Sales column:
syntax (see later) is to include SQL Column definition names in D_ _D
3. Or finally using a Total formula type column calculation:
syntax for Total formula type definitions is to include column references in [[ ]]

DYNAMIC AI . AUTOMATED INTELLIGENCE . RELEASE 6.4 DOCUMENTATION
The actual calculation of the Contribution ratio can only be done correctly by resolving the calculation also at the total level, i.e. a Total formula type calculation is needed:
And format as a % with 1 decimal:
And with a few drag-drop column actions the calculations can be turned into a report:
Delivering the calculated results at all combinations and total-breaks etc.

DYNAMIC AI . AUTOMATED INTELLIGENCE . RELEASE 6.4 DOCUMENTATION
C. Key-figure calculations, using a similar syntax as the Total (formula) calculations but with
additional filter possibilities to allow both horizontal and vertical restrictions to the calculation.
Key-figures are single calculations that are calculated on the totals and sub-totals of the report
and presented at the bottom of a report.
Key-figure calculations are separate from the SQL and calculated by Dynamic AI on the
aggregated results of a report at any level.
The results of a Key-figure calculation can be used across various reports (see “Cross-report
calculations”).
Example definition of a Key-figure – assuming that only the total Contribution ratio would be necessary
on the previous report:

DYNAMIC AI . AUTOMATED INTELLIGENCE . RELEASE 6.4 DOCUMENTATION
Key-figures can be part of Total formula calculations. E.g.: the difference between individual
Contribution ratio’s to the Total contribution ratio (keyfigure) can be calculated:
Key-figures are referred to with [[// //]] surrounding the name of the Key-figure.
Key-figures can reference other Key-figures.
Key-figures can refer to any total in reports using the following syntax:
[[totalcolumn]]
Or column/row sub-totals at any level:
[[totalcolumn::groupcolumn==value,groupcolumn==value….]]

DYNAMIC AI . AUTOMATED INTELLIGENCE . RELEASE 6.4 DOCUMENTATION
From a definition point of view – caused by the nature of the calculations described above, the following
calculation restrictions apply to the 3 types:
- SQL Column calculations are executed with the report and have no link to or reference to Total
Formula calculation results. However SQL Column calculations can theoretically reference
everything available in the database.
- Total (formula) calculations can refer to report totals from aggregated NUMERIC or INTEGER
columns, other Total (formula) columns, SQL Column calculations as well as Key-figure
calculations.
- Key-figure calculations can refer to and include other Key-figure calculations, the totals and sub-
totals of Total (formula) calculations as well as the totals from SQL Column calculations as well
as aggregations from the normal Report column results.
When removing SQL, Total or Key-figure columns that are being referred to – Dynamic AI will try to
resolve / replace and edit the formulas of the columns keeping the referring column calculations
unaffected by the removal.
When removing/hiding a Total (formula) or Key figure column from column drop-down menus, using
drag-drop gestures or directly in Design the columns are completely removed. I.e. a Total (formula) or a
key-figure exist only when appearing on the list – and cannot be selected multiple times through
available columns.
When removing/hiding a SQL Column from drop-down menus or using drag-drop gestures – only the
current column representation of the formula is removed – the basic definition stay’s as an available
column in order to be selected for other actions or re-applied at a later stage. Total removal of a SQL
Column definition can be done from the List tab in Design.
The basics of the3 calculations is identical to +Column and Key-figure features of previous versions of
Dynamic AI with some improvements.
A new feature of Dynamic AI version 6.4 is that SQL Column’s will automatically detect data-types and
will set that option on the List tab. For end-users creating formula’s directly on the reports this
additional information is handled automatically.
Validation of the validity of entered SQL will be checked and responded to the user/developer as soon
as the formula is applied.
Formula’s can be viewed and edited directly from drop-down actions on the individual columns using
the menu option “Formula”.
In Design columns can be switched – if compatible or edited formula syntax is kept – in-between the 3
types, keeping the position of the column in case of SQL Column to Total (formula) conversion.

DYNAMIC AI . AUTOMATED INTELLIGENCE . RELEASE 6.4 DOCUMENTATION
Referencing different instances of the same total column:
In order to specifically reference a function result of a Total column the following suffixes are applied to
the column names in the formulas:
Count: [[Quantity@COU]]
Minimum: [[Quantity@MIN]]
Maximum: [[Quantity@MAX]]
Average: [[Quantity@AVG]]
Standard deviation: [[Quantity@STD]]
Variance: [[Quantity@VAR]]
DYNAMIC AI . AUTOMATED INTELLIGENCE . RELEASE 6.4 DOCUMENTATION
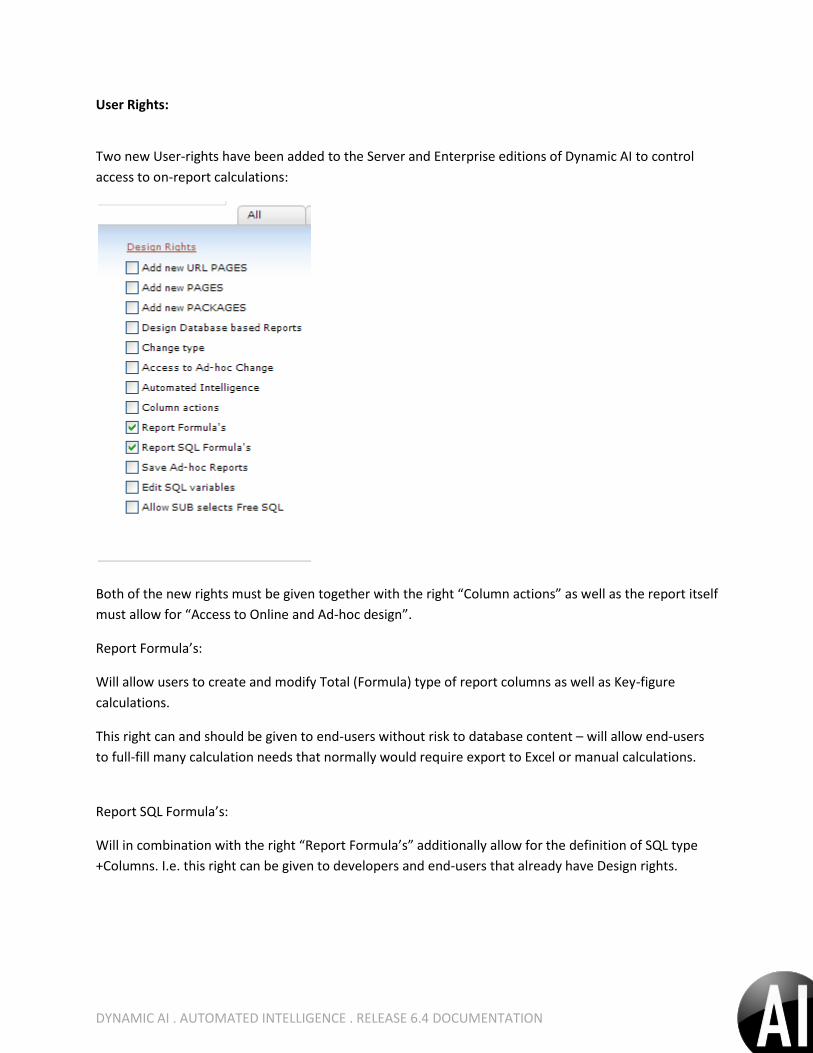
User Rights:
Two new User-rights have been added to the Server and Enterprise editions of Dynamic AI to control
access to on-report calculations:
Both of the new rights must be given together with the right “Column actions” as well as the report itself
must allow for “Access to Online and Ad-hoc design”.
Report Formula’s:
Will allow users to create and modify Total (Formula) type of report columns as well as Key-figure
calculations.
This right can and should be given to end-users without risk to database content – will allow end-users
to full-fill many calculation needs that normally would require export to Excel or manual calculations.
Report SQL Formula’s:
Will in combination with the right “Report Formula’s” additionally allow for the definition of SQL type
+Columns. I.e. this right can be given to developers and end-users that already have Design rights.

DYNAMIC AI . AUTOMATED INTELLIGENCE . RELEASE 6.4 DOCUMENTATION
Cross-report calculations
Key-figures can be referenced across reports using the syntax:
[[//keyfigurename@DAI:report_right_Id//]]
Example:
To retrieve the current result of the key-figure “Total contribution ratio” on report 1234:
[[//Total contribution ratio@DAI:1234//]]

DYNAMIC AI . AUTOMATED INTELLIGENCE . RELEASE 6.4 DOCUMENTATION
Calendar reports with conditional formatting
Dynamic AI version 6.4 introduce a new type of report for presenting information by periods of time in a flexible month calendar format that can apart from being used interactive within Dynamic AI, can be part of dashboards, e-mails etc. The calendar presentation requires a grouped listing on one date with optional display of a grouped value together with optional number of totals. A total column can (apart from the first one) be used to control conditional formatting for either “goal”-seeking presentations or capacity monitoring. An example of a list suitable for a calendar presentation:
With this drill-down defined:
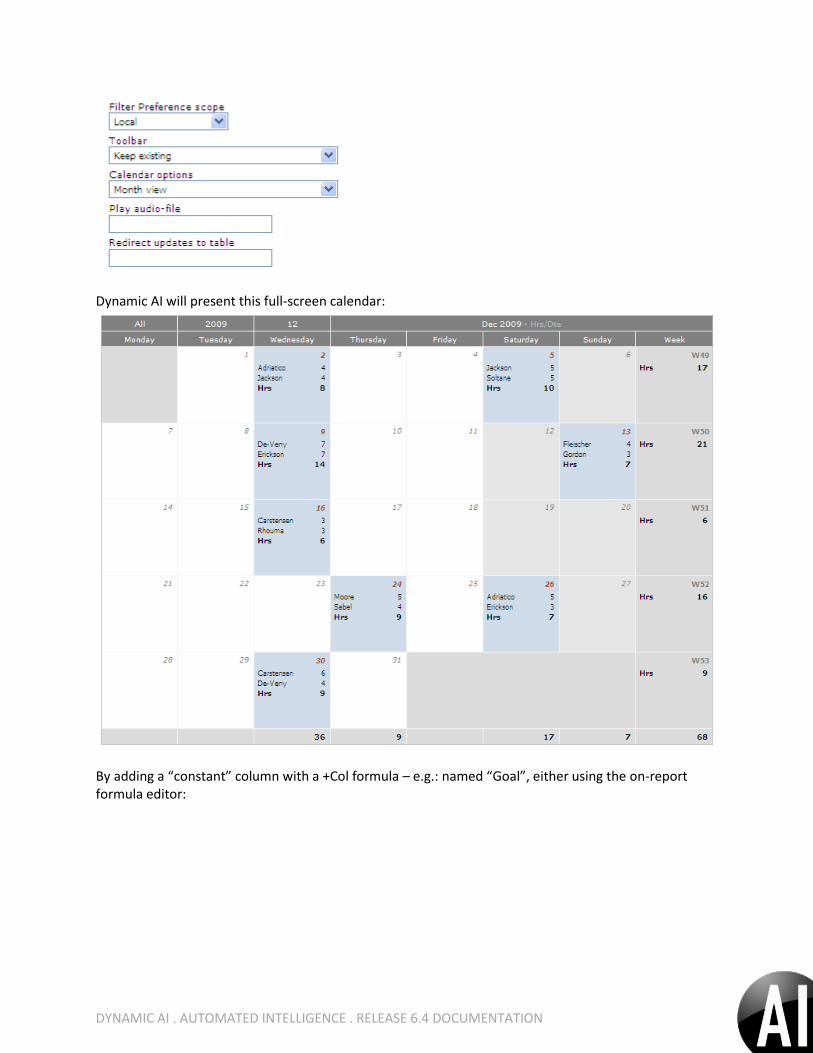
Using the Calendar option - Month view, that can be set on the Options page in Design:
DYNAMIC AI . AUTOMATED INTELLIGENCE . RELEASE 6.4 DOCUMENTATION
Dynamic AI will present this full-screen calendar:
By adding a “constant” column with a +Col formula – e.g.: named “Goal”, either using the on-report formula editor:

DYNAMIC AI . AUTOMATED INTELLIGENCE . RELEASE 6.4 DOCUMENTATION
And changing the “Goal” column to a “Minimum” type column – as target:
DYNAMIC AI . AUTOMATED INTELLIGENCE . RELEASE 6.4 DOCUMENTATION
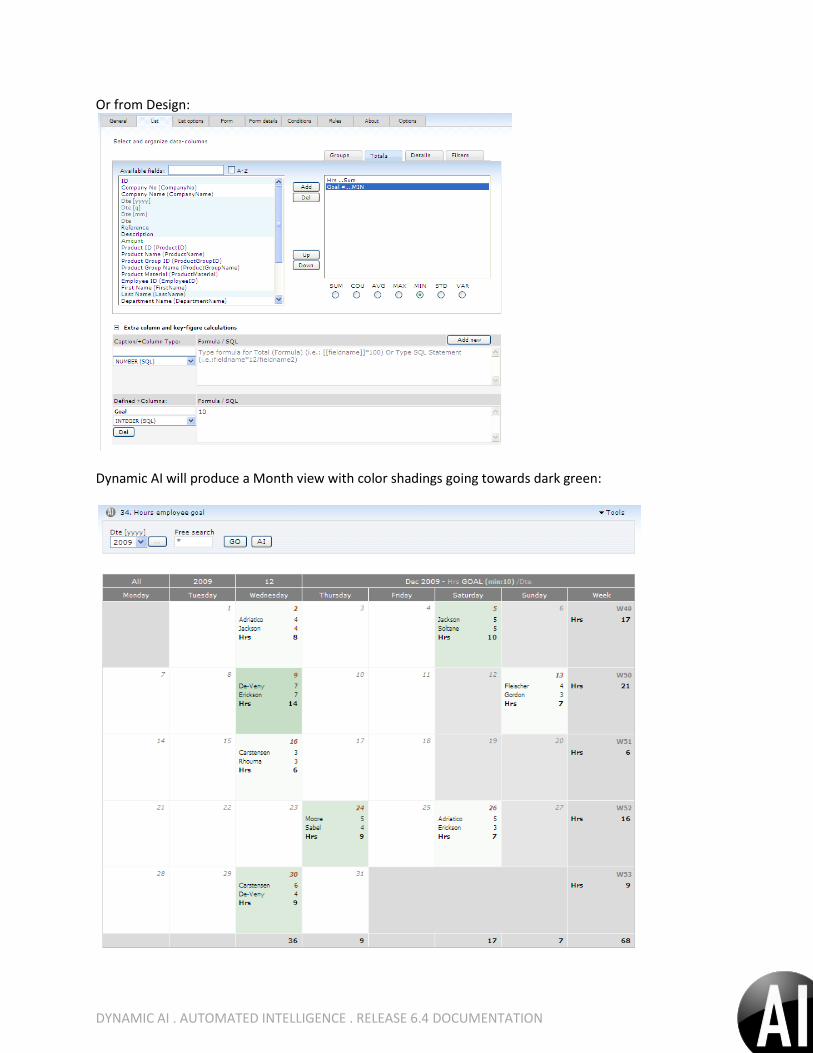
Or from Design:
Dynamic AI will produce a Month view with color shadings going towards dark green:
DYNAMIC AI . AUTOMATED INTELLIGENCE . RELEASE 6.4 DOCUMENTATION
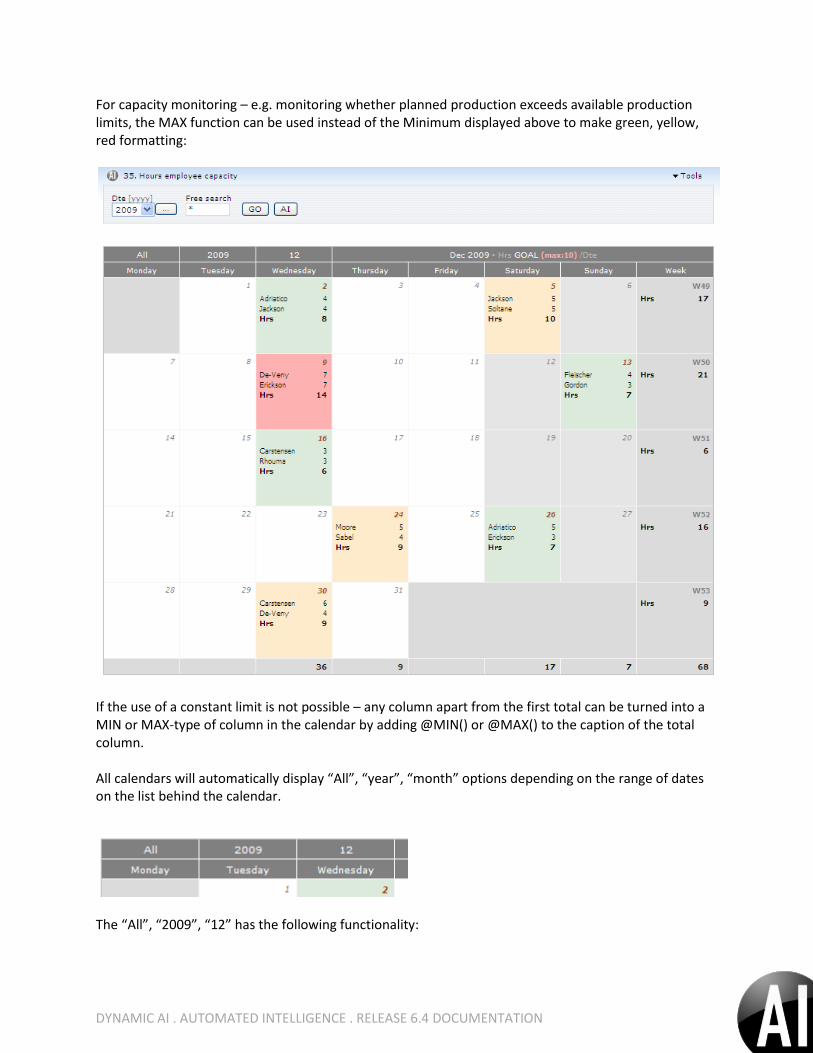
For capacity monitoring – e.g. monitoring whether planned production exceeds available production limits, the MAX function can be used instead of the Minimum displayed above to make green, yellow, red formatting:
If the use of a constant limit is not possible – any column apart from the first total can be turned into a MIN or MAX-type of column in the calendar by adding @MIN() or @MAX() to the caption of the total column. All calendars will automatically display “All”, “year”, “month” options depending on the range of dates on the list behind the calendar.
The “All”, “2009”, “12” has the following functionality:

DYNAMIC AI . AUTOMATED INTELLIGENCE . RELEASE 6.4 DOCUMENTATION
All – will present all month calendars in a compressed view that has data to present:
The year option will do the same – but for a specific year and in a format with more details:
Clicking on the title of a specific month will maximize that month only.
DYNAMIC AI . AUTOMATED INTELLIGENCE . RELEASE 6.4 DOCUMENTATION
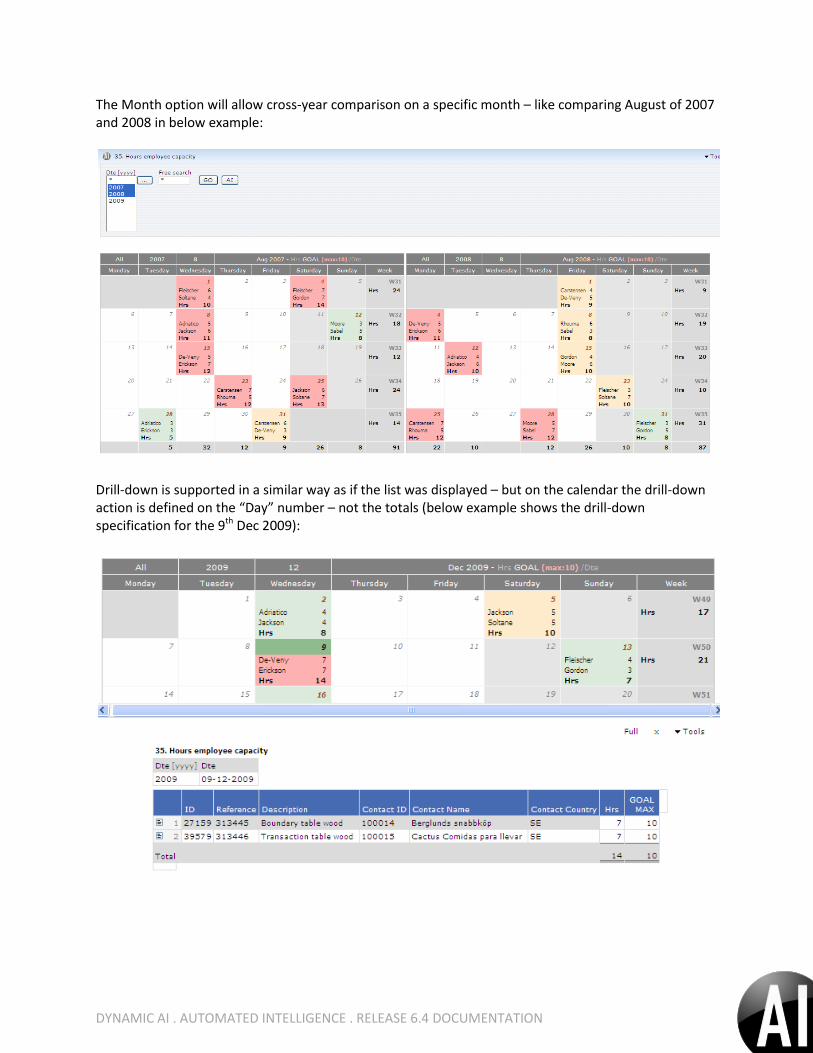
The Month option will allow cross-year comparison on a specific month – like comparing August of 2007 and 2008 in below example:
Drill-down is supported in a similar way as if the list was displayed – but on the calendar the drill-down action is defined on the “Day” number – not the totals (below example shows the drill-down specification for the 9th Dec 2009):

DYNAMIC AI . AUTOMATED INTELLIGENCE . RELEASE 6.4 DOCUMENTATION
Calendars can be part of dashboards and when presented on dashboards – a compressed format is used and only the current – or latest month of the date range selection is shown – drill-down is still supported from the dashboards as well as from e-mailed calendars.

DYNAMIC AI . AUTOMATED INTELLIGENCE . RELEASE 6.4 DOCUMENTATION
More pre-programmed calculations options (% of row, % of column)
For column-grouped reports where separate totals are calculated for grouped values on rows and
columns, new % of row and % of total options has been added.
With the below column grouped report as an example, where Quantity of sold items is summarized by
Customer, by Product:
Clicking on the Quantity Sum total presents the following options:
DYNAMIC AI . AUTOMATED INTELLIGENCE . RELEASE 6.4 DOCUMENTATION
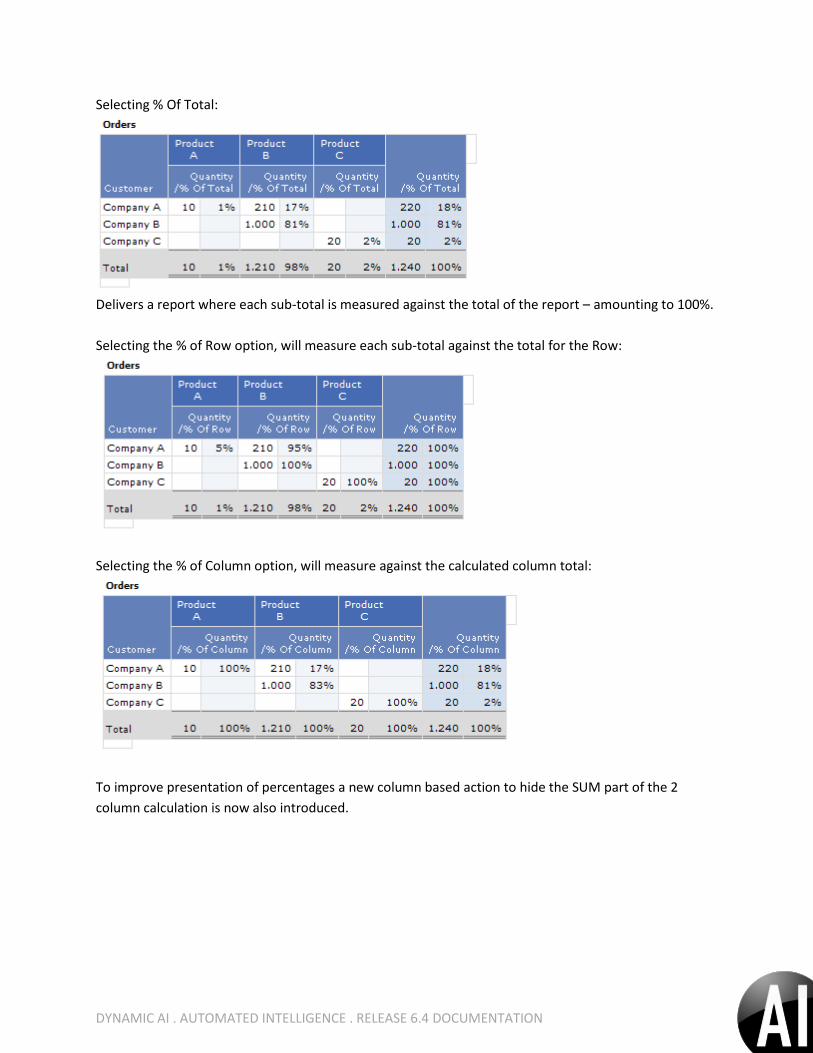
Selecting % Of Total:
Delivers a report where each sub-total is measured against the total of the report – amounting to 100%.
Selecting the % of Row option, will measure each sub-total against the total for the Row:
Selecting the % of Column option, will measure against the calculated column total:
To improve presentation of percentages a new column based action to hide the SUM part of the 2
column calculation is now also introduced.
DYNAMIC AI . AUTOMATED INTELLIGENCE . RELEASE 6.4 DOCUMENTATION
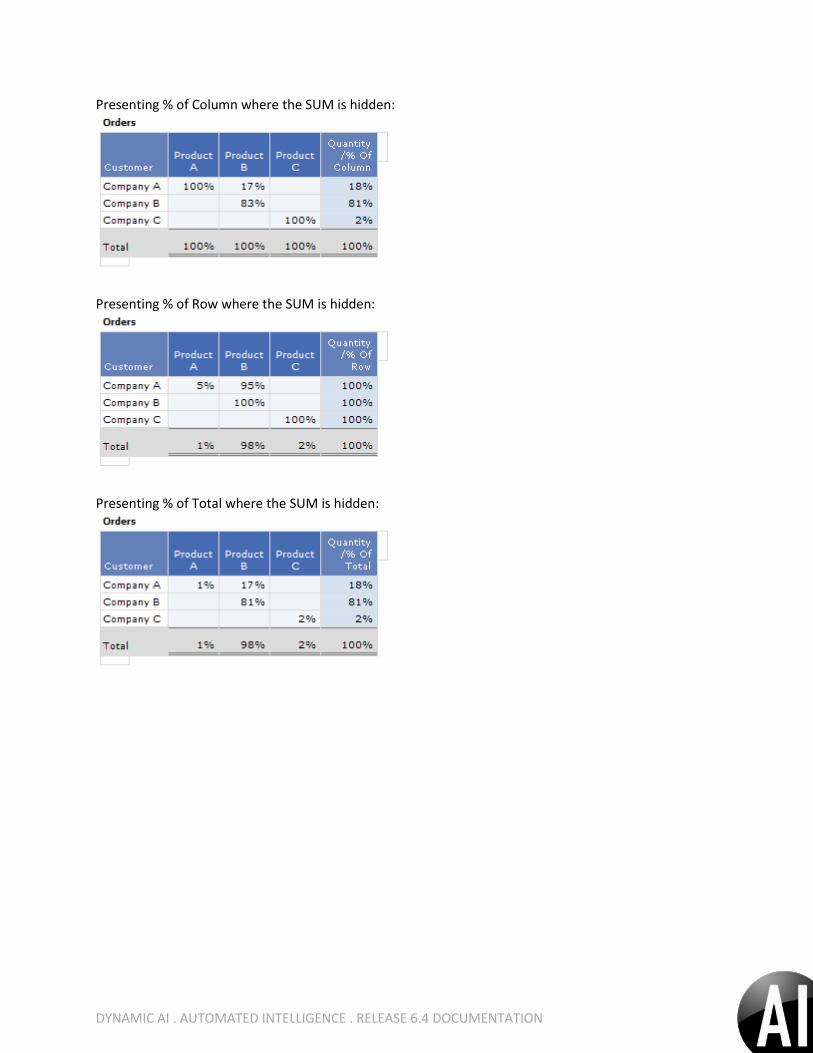
Presenting % of Column where the SUM is hidden:
Presenting % of Row where the SUM is hidden:
Presenting % of Total where the SUM is hidden:

DYNAMIC AI . AUTOMATED INTELLIGENCE . RELEASE 6.4 DOCUMENTATION
Calculated column support on column-grouped reports
In previous versions of Dynamic AI calculated additional columns (when solely a report type calculation
and not part of the SQL executed) could not be included on column-grouped reports. Dynamic AI version
6.4 now includes all calculated column types on both normal grouped and column-grouped type reports.
As in this example – a column-grouped report by Product, where the Sales and Costs columns are
calculated SQL columns added to the report. The Gross Margin Column is a column using the already
defined Sales and Costs columns in the calculation (will resolve to SQL in Dynamic AI) and the
Contribution Ratio column is a “Total (Formula)” type of calculation – performed by Dynamic AI – after
retrieving the data from the database, where it is possible to calculate on the aggregated subtotals.
In this case the Contribution Ratio must be a “Total (Formula)” type column in order to calculate the
correct % based on the aggregated Sales and Gross Margin:

DYNAMIC AI . AUTOMATED INTELLIGENCE . RELEASE 6.4 DOCUMENTATION
Prefix and suffix options for totals (like adding %, $ etc.)
In previous versions of Dynamic AI expressing the exact type of an amount in a specific total column had
to be done in the caption for the column. Like “Amount USD”. For Total columns it is now possible to
add a prefix and a suffix to the amounts presented on the reports. Like USD 12345, 12,34% etc.
4 pre-defined options are available directly on the drop-down columns of totals:
The prefix and suffix entries are restricted to maximum 3 digits.
Custom prefix and suffix formats can be entered on the List options tab in Design.
@PARn@ parameters from free-parameter Dynamic AI SQL views can be parsed to a prefix or suffix with
the syntax @p1.

DYNAMIC AI . AUTOMATED INTELLIGENCE . RELEASE 6.4 DOCUMENTATION
Filter defaults
A number of new default options for filters – especially for date related filters are introduced in Dynamic
AI version 6.4. The defaults will apply to the initial first run of a report or listing and will overwrite
eventually cached values from previous executions or from other reports running on the same data-
source.
The introduction of filter defaults offers the following new opportunities:
- Setting a default filter like year in a SELECT list without making the selection of a specific year
required for the listing (allowing multi-select and * options at the same time as setting a specific
year default).
- Ensuring that a (meaningful) filter value is specified when the list is initially being called from the
menu without having to stop the report execution with the “First page loads blank” option to
ask the user for input.
- Securing consistent filters are applied when calling the same report in an online session, as a
scheduled report executed automatically by the agent for e-mail delivery as well as for cross-
report key-figure calculations.
- Setting default year, year-1 to automatically create a compare view of a report already when
called from the menu.
DYNAMIC AI . AUTOMATED INTELLIGENCE . RELEASE 6.4 DOCUMENTATION
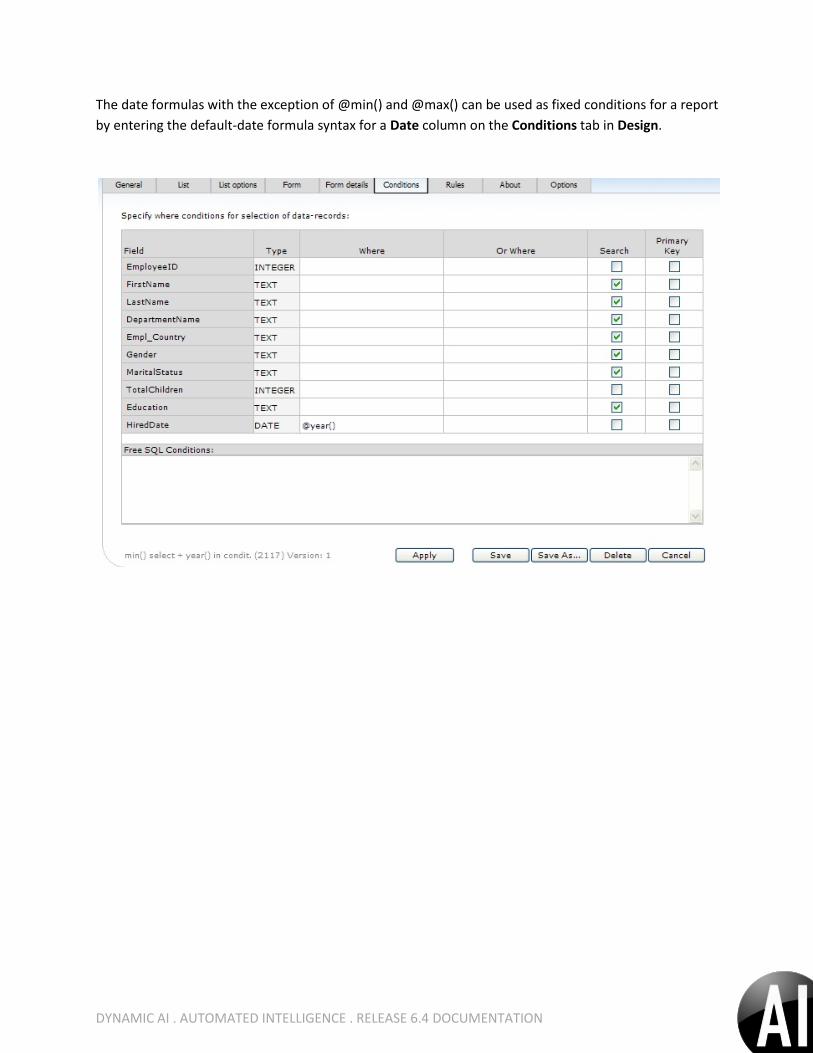
The date formulas with the exception of @min() and @max() can be used as fixed conditions for a report
by entering the default-date formula syntax for a Date column on the Conditions tab in Design.

DYNAMIC AI . AUTOMATED INTELLIGENCE . RELEASE 6.4 DOCUMENTATION
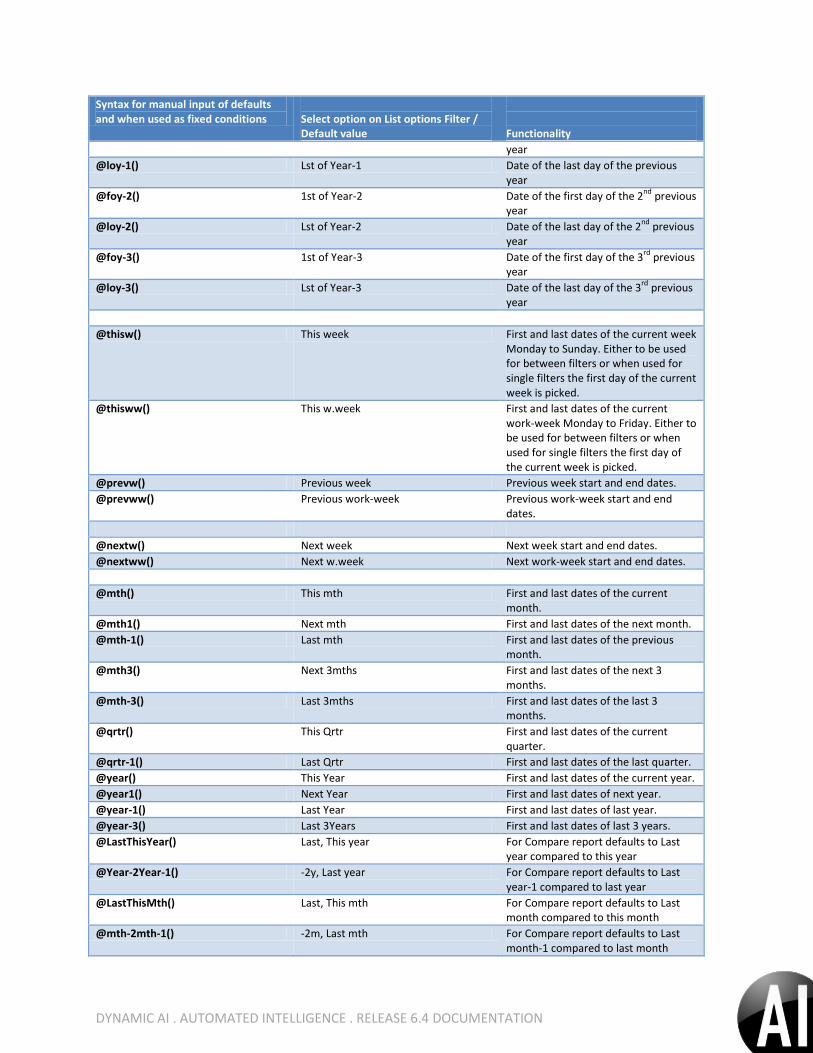
The default and condition options are:
Syntax for manual input of defaults and when used as fixed conditions
Select option on List options Filter / Default value
Functionality
@max() (not supported as fixed condition)
Max of data Analyzes data in the column and pick the maximum value
@min() (not supported as fixed condition)
Min of data Analyzes data in the column and pick the minimum value
@now() Now Current date + time
@date() Today Current date
@tom() Tomorrow Date of tomorrow
@yest() Yesterday Date of yesterday
@pwwd() Prv. ww day Previous work-week day (work week = Monday-Friday)
@nwwd() Next ww day Next work-week day (work week = Monday-Friday)
@fom() 1st of Mth Date of the first day in the current month
@lom() Lst of Mth Date of the Last day in the current month
@fom1() 1st of Mth+1 Date of the first day in next month
@lom1() Lst of Mth+1 Date of the last day in next month
@fom2() 1st of Mth+2 Date of the first day in 2nd
next month
@lom2() Lst of Mth+2 Date of the last day in 2nd
next month
@fom3() 1st of Mth+3 Date of the first day in 3rd
next month
@lom3() Lst of Mth+3 Date of the last day in 3rd
next month
@fom-1() 1st of Mth-1 Date of the first day in previous month
@lom-1() Lst of Mth-1 Date of the last day in previous month
@fom-2() 1st of Mth-2 Date of the first day in 2nd
previous month
@lom-2() Lst of Mth-2 Date of the last day in 2nd
previous month
@fom-3() 1st of Mth-3 Date of the first day in 3rd
previous month
@lom-3() Lst of Mth-3 Date of the last day in 3rd
previous month
@foq() 1st of Qrtr Date of the first day in the current quarter
@loq() Lst of Qrtr Date of the last day in the current quarter
@foq1() 1st of Qrtr+1 Date of the first day in the next quarter
@loq1() Lst of Qrtr+1 Date of the last day in the next quarter
@foq-1() 1st of Qrtr-1 Date of the first day in the previous quarter
@loq-1() Lst of Qrtr-1 Date of the last day in the previous quarter
@foy() 1st of Year Date of the first day of the current year
@loy() Lst of Year Date of the last day of the current year
@foy1() 1st of Year+1 Date of the first day of the next year
@loy1() Lst of Year+1 Date of the last day of the next year
@foy-1() 1st of Year-1 Date of the first day of the previous
DYNAMIC AI . AUTOMATED INTELLIGENCE . RELEASE 6.4 DOCUMENTATION
Syntax for manual input of defaults and when used as fixed conditions
Select option on List options Filter / Default value
Functionality
year
@loy-1() Lst of Year-1 Date of the last day of the previous year
@foy-2() 1st of Year-2 Date of the first day of the 2nd
previous year
@loy-2() Lst of Year-2 Date of the last day of the 2nd
previous year
@foy-3() 1st of Year-3 Date of the first day of the 3rd
previous year
@loy-3() Lst of Year-3 Date of the last day of the 3rd
previous year
@thisw() This week First and last dates of the current week Monday to Sunday. Either to be used for between filters or when used for single filters the first day of the current week is picked.
@thisww() This w.week First and last dates of the current work-week Monday to Friday. Either to be used for between filters or when used for single filters the first day of the current week is picked.
@prevw() Previous week Previous week start and end dates.
@prevww() Previous work-week Previous work-week start and end dates.
@nextw() Next week Next week start and end dates.
@nextww() Next w.week Next work-week start and end dates.
@mth() This mth First and last dates of the current month.
@mth1() Next mth First and last dates of the next month.
@mth-1() Last mth First and last dates of the previous month.
@mth3() Next 3mths First and last dates of the next 3 months.
@mth-3() Last 3mths First and last dates of the last 3 months.
@qrtr() This Qrtr First and last dates of the current quarter.
@qrtr-1() Last Qrtr First and last dates of the last quarter.
@year() This Year First and last dates of the current year.
@year1() Next Year First and last dates of next year.
@year-1() Last Year First and last dates of last year.
@year-3() Last 3Years First and last dates of last 3 years.
@LastThisYear() Last, This year For Compare report defaults to Last year compared to this year
@Year-2Year-1() -2y, Last year For Compare report defaults to Last year-1 compared to last year
@LastThisMth() Last, This mth For Compare report defaults to Last month compared to this month
@mth-2mth-1() -2m, Last mth For Compare report defaults to Last month-1 compared to last month
DYNAMIC AI . AUTOMATED INTELLIGENCE . RELEASE 6.4 DOCUMENTATION
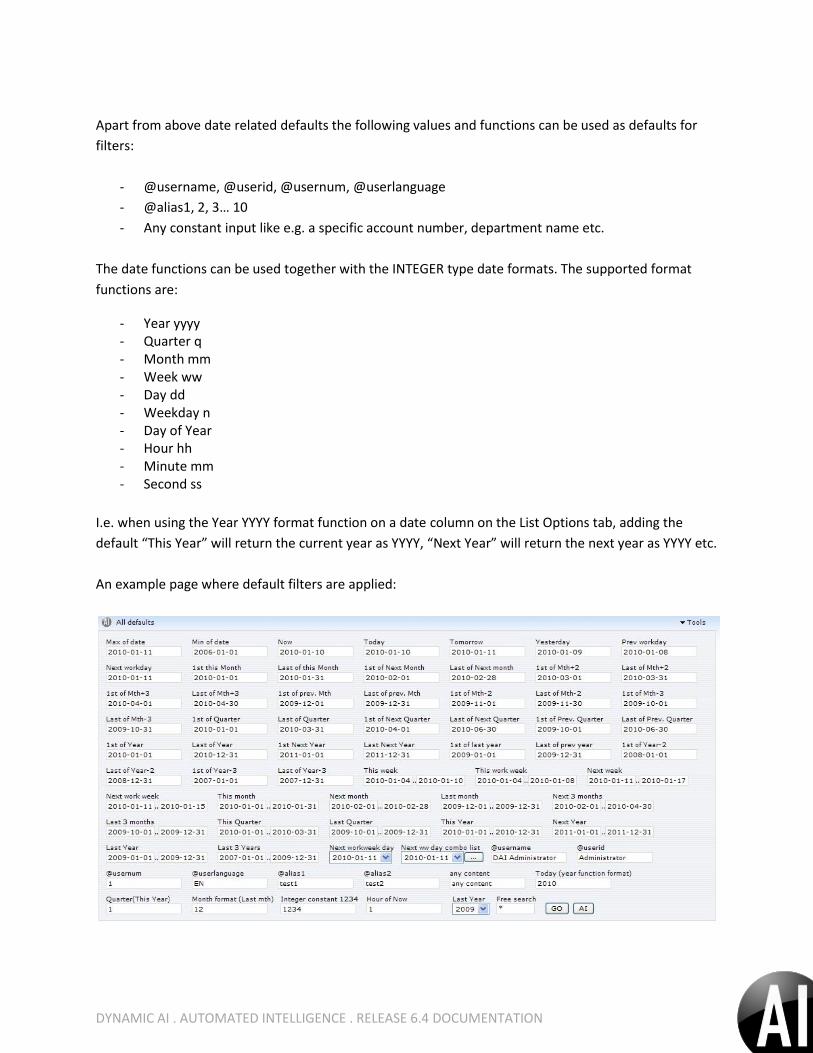
Apart from above date related defaults the following values and functions can be used as defaults for
filters:
- @username, @userid, @usernum, @userlanguage
- @alias1, 2, 3… 10
- Any constant input like e.g. a specific account number, department name etc.
The date functions can be used together with the INTEGER type date formats. The supported format
functions are:
- Year yyyy - Quarter q - Month mm - Week ww - Day dd - Weekday n - Day of Year - Hour hh - Minute mm - Second ss
I.e. when using the Year YYYY format function on a date column on the List Options tab, adding the
default “This Year” will return the current year as YYYY, “Next Year” will return the next year as YYYY etc.
An example page where default filters are applied:

DYNAMIC AI . AUTOMATED INTELLIGENCE . RELEASE 6.4 DOCUMENTATION
An example of using defaults for Compare filters automatically setting previous and last year for the
filters, presenting the report initially in “difference display mode”:
DYNAMIC AI . AUTOMATED INTELLIGENCE . RELEASE 6.4 DOCUMENTATION
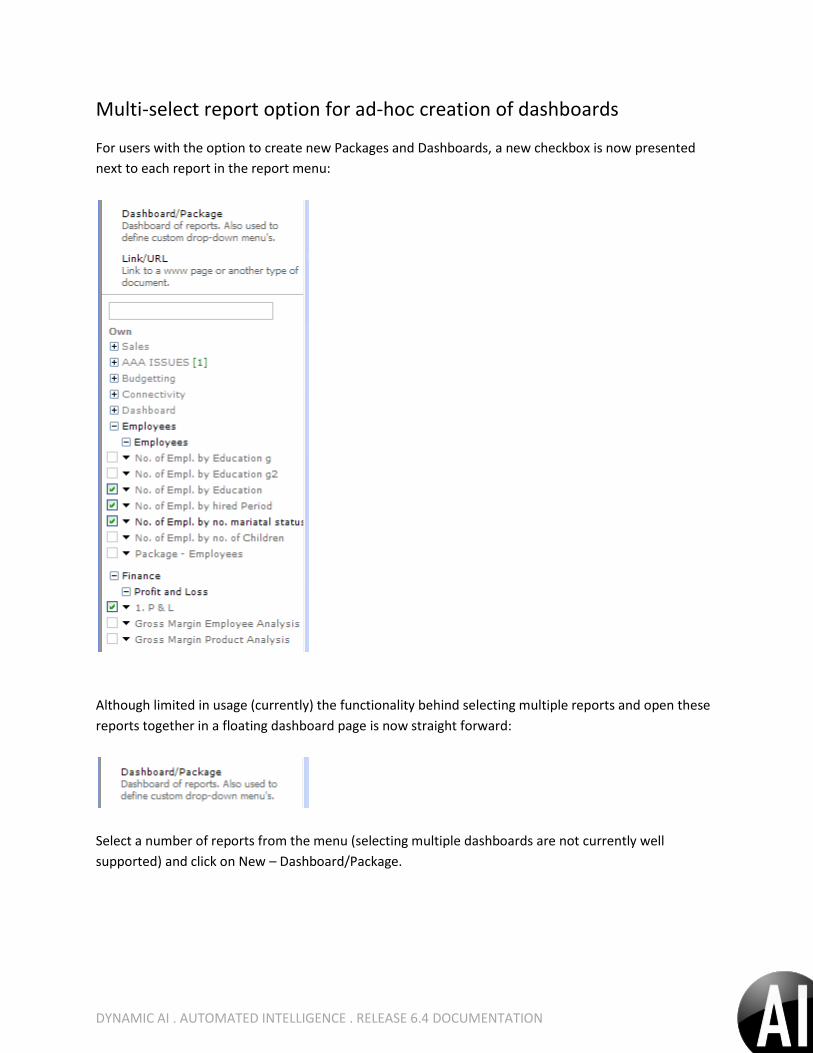
Multi-select report option for ad-hoc creation of dashboards
For users with the option to create new Packages and Dashboards, a new checkbox is now presented
next to each report in the report menu:
Although limited in usage (currently) the functionality behind selecting multiple reports and open these
reports together in a floating dashboard page is now straight forward:
Select a number of reports from the menu (selecting multiple dashboards are not currently well
supported) and click on New – Dashboard/Package.

DYNAMIC AI . AUTOMATED INTELLIGENCE . RELEASE 6.4 DOCUMENTATION
The below is an example of above selected reports in a automatic floating dashboard:
Using the mouse, the user can now drag (on the report titles) and re-order the position of the reports,
remove reports – by clicking on the x or use Tools to enter design for further options or saving the
dashboard.
The dashboard will pick filters from the first report of the dashboard. After re-ordering is complete –
either click GO or enter Tools to save before executing with filters again – to ensure that the correct set
of filters are being applied.

DYNAMIC AI . AUTOMATED INTELLIGENCE . RELEASE 6.4 DOCUMENTATION
In order to get consistent dashboard content during scheduling, the following rules apply for filters:
Filter-caching is always set to NONE during scheduled reporting. The reason is that the caching
eventually would be random depending on which reports were handled by the agent in that specific
instance. And because the filter-caching is an online/user specific feature that doesn't fit cross-user
scheduled e-mail reporting. Instead default filters will always be read for all reports as well as sub-
reports on package dashboards during scheduled email reporting.
This rule will have eventually have a confusing impact on the scenario where a report without defaults is
appearing on a packaged dashboard in an online session - inheriting filter-values - but when scheduling
the same report - it will be without those cached filters.
The way to deal with it is to set defaults on all relevant reports on a package dashboard where this could
be an issue OR set the filter caching preference to NONE on those particular reports - which will ensure
consistent handling online as well as scheduled.
DYNAMIC AI . AUTOMATED INTELLIGENCE . RELEASE 6.4 DOCUMENTATION
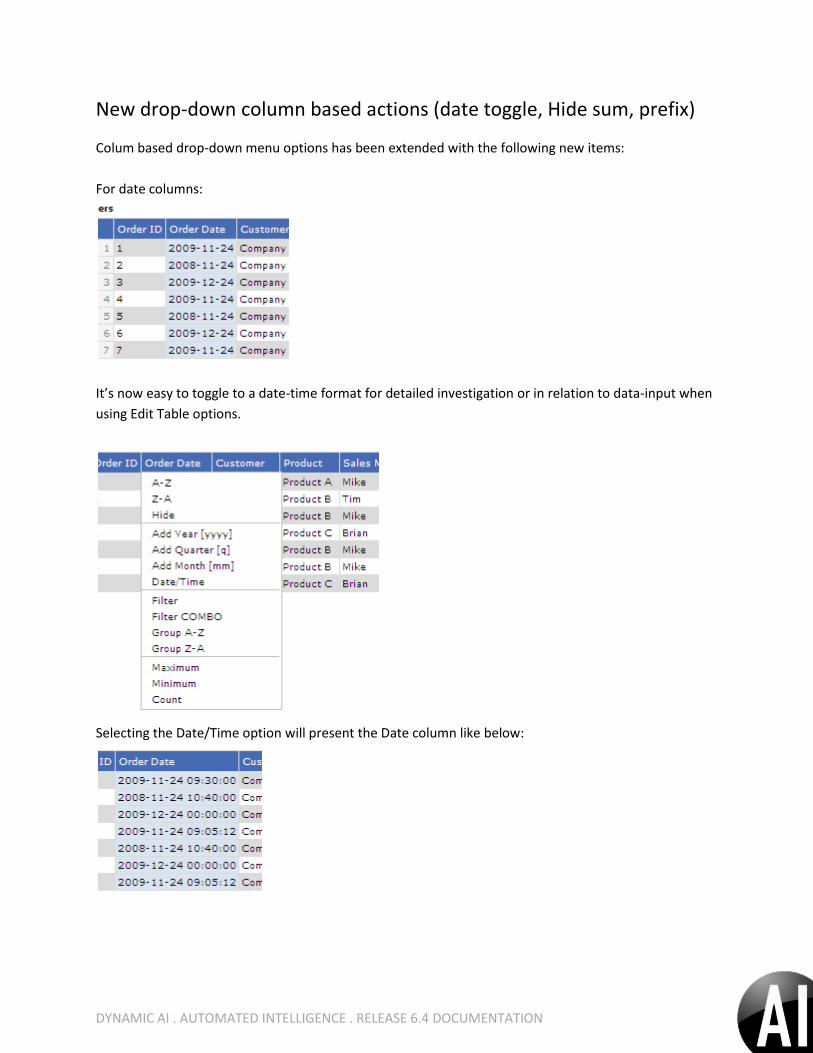
New drop-down column based actions (date toggle, Hide sum, prefix)
Colum based drop-down menu options has been extended with the following new items:
For date columns:
It’s now easy to toggle to a date-time format for detailed investigation or in relation to data-input when
using Edit Table options.
Selecting the Date/Time option will present the Date column like below:

DYNAMIC AI . AUTOMATED INTELLIGENCE . RELEASE 6.4 DOCUMENTATION
For numeric Total columns:
New prefix and suffix formatting options:
To ease the reading of reports and listings. The prefix and suffix will be excluded when exporting content
to ensure destination compatibility in e.g.: Excel.

DYNAMIC AI . AUTOMATED INTELLIGENCE . RELEASE 6.4 DOCUMENTATION
For key-figure columns:
Key-figures are now being presented with column drop-down options.
The options are:
Where:
The Formula option allows editing the definition of the key-figure calculation (see documentation for
new point-and-click definitions).
The 0,00 -> … options will allow increase and decrease of decimals.
The new 0,00%, €, $ and £ options are the prefix and suffix options.
“Total Format” will allow the split up of key-figure into different groups with total formatting like:

DYNAMIC AI . AUTOMATED INTELLIGENCE . RELEASE 6.4 DOCUMENTATION
Using the 0,00% format for the DG key-figure column delivers:
Key-figure columns can be deleted by dragging to the upper right (like normal columns in a report can
be deleted) as well as the order of key-figures can be changed by drag/dropping the captions.

DYNAMIC AI . AUTOMATED INTELLIGENCE . RELEASE 6.4 DOCUMENTATION
For running sum, % of row, % of totals, % of columns:
Dynamic AI 6.4 introduces a “Hide Sum” option for Running Sums, and the various % calculations.

DYNAMIC AI . AUTOMATED INTELLIGENCE . RELEASE 6.4 DOCUMENTATION
Dictionary caption inheritance To use already defined captions on known underlying dictionary objects when adding a Join-builder Dynamic AI view to the dictionary, Dynamic AI version 6.4 will now automatically include the already entered captions of the underlying objects to the new created dictionary object of a Join-builder view. For all other types of objects: Tables, Views, Synonyms and Dynamic AI SQL views, inheritance can be achieved by selecting the objects to inherit from during creation or update of dictionary entries. To get the option to multi-select DB explorer objects, the following system parameter must be entered:
To update the Dynamic AI view “View on Orders” with the captions already entered for the dictionary object on the table orders:
1- Click the selection checkbox next to the Table object Orders (the green drop-down indicates that a dictionary object exist in Dynamic AI).
2- Click on the drop-down next to the object (in this case the “View on Orders”) and click create or (in this case) Update Dictionary.
The captions are copied from the source objects to the destination dictionary items. I.e. changes will have to be manually applied using the same procedure.
DYNAMIC AI . AUTOMATED INTELLIGENCE . RELEASE 6.4 DOCUMENTATION
Various improvements and bug fixes
- Change of default filter functionality to ensure that scheduled reports would be delivered with
the same consistent results (due to filter settings) as emailed reports + allow defaults/required
combo's to have impact on scheduled reporting.
- Added AIIGNORE column to the Server and Enterprise editions of Dynamic AI to allow a
developer or database administrator to mark specific columns, NOT to be considered by
Automated Intelligence dashboards when calculating sub-reports and setting up time-
dimension.
- Fix to shift mouse-click selecting multiple fields/rows on list-edit listings. E.g. click on row x and
hold shift - click on row y - click delete and update to delete multiple rows or use the mouse to
select multiple rows for copying (Ctrl C, Ctrl V) etc.
- Implementing new default date functions for @PARn parameters on views. Format is
@DATE:datefunction
- Fix to ensure that check on/off on” Group values on each row” for Excel exports are read from
the tools dropdown consistently
- Fix to exporting column grouped reports to Excel. Added -1 to row-span to avoid Excel making
issues with column headers.
- Added a new YYYY-mmm date format option to present 2009-01 as 2009-Jan on column-
grouped reports.
- Implementing Roles to have impact also on Global SQL Vars
- Floating filters issue fixed (filters rendering when having multi-select filters in-front of other
filters)
- Added functionality to ensure that global SQL vars can resolve other global SQL vars without
those other SQL vars are being specifically used on the report. Global sql referring to previously
defined must have D_ _D around name: i.e. NewCol referring to OldCol by D_OldCol_D in the
NewCol SQL source definition.
- Enhanced functional scope of @PAR1@ parameters from Dynamic AI SQL views: Can now be
used in SQL +Cols definitions as e.g.: CostPrice*@PAR1@ e.g.: to make simulated calculations on
reports.
DYNAMIC AI . AUTOMATED INTELLIGENCE . RELEASE 6.4 DOCUMENTATION
- Graph option on AI dashboards can now be saved with the AI dashboard in order to initially
present the AI dashboard with graphs. The new option is named “Auto graph(s)” in the graphs
options on the General Tab in Design.
- Handling dropdown over Active X chart as well as World Map Flash object (objects are
temporarily hidden).
- Fix count distinct top list issue
- Fix to Excel Integer format issues
- Added the functionality to be able to refer to already defined Dynamic AI SQL views within other
Dynamic AI SQL view definitions using the syntax: @DYNAMIC_AI_SQL_VIEW:xxxx@
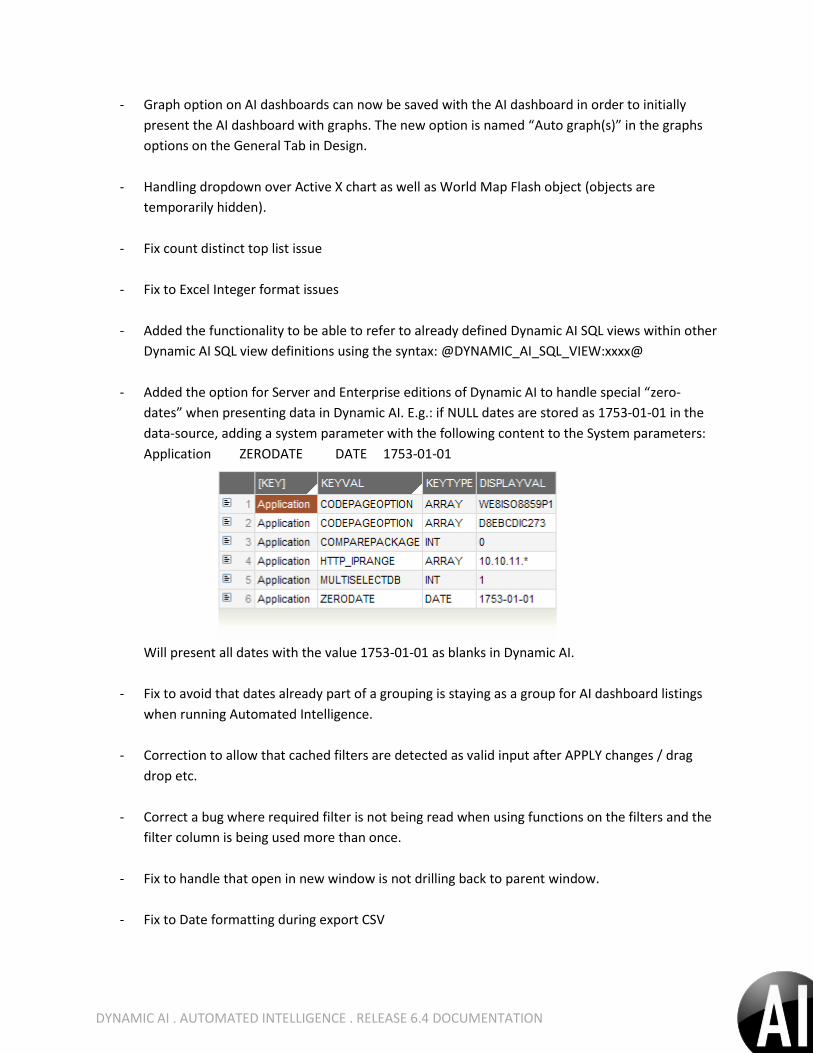
- Added the option for Server and Enterprise editions of Dynamic AI to handle special “zero-
dates” when presenting data in Dynamic AI. E.g.: if NULL dates are stored as 1753-01-01 in the
data-source, adding a system parameter with the following content to the System parameters:
Application ZERODATE DATE 1753-01-01
Will present all dates with the value 1753-01-01 as blanks in Dynamic AI.
- Fix to avoid that dates already part of a grouping is staying as a group for AI dashboard listings
when running Automated Intelligence.
- Correction to allow that cached filters are detected as valid input after APPLY changes / drag
drop etc.
- Correct a bug where required filter is not being read when using functions on the filters and the
filter column is being used more than once.
- Fix to handle that open in new window is not drilling back to parent window.
- Fix to Date formatting during export CSV

DYNAMIC AI . AUTOMATED INTELLIGENCE . RELEASE 6.4 DOCUMENTATION
- Removed ranking (1-25) from Reports menu, instead using the room for multi-select purposes
- Changed functionality of “Hidden” in the Reports option menu – to refresh the menu when
clicked instead of requiring a new click on the type of Navigation to use.
- Change to ensure that picture format of Graphs are being used for preview in Design on Server
and Enterprise editions for users having the Active X graph option selected. To avoid active X
overhead in the client browser.
- Bug fix to building select boxes on “other listings” during CSV, Fixed, XML exports.
- Added additional immediate validation to check that re-typing of a password in User
administration = the first typed password – instead of first getting the validation information
during save.
- Bug fix to ensure that Design changes are being applied when entering Design from the Report
menu without having ran the report first or saved the report in-between.
- When changing a grouped / group-caption list into a TOP 10/BOTTOM 10 the group caption will
now correctly be shown on the TOP lists.
- Setup will no longer overwrite Agent.ini
- Setup will no longer install AIAgent.exe – new .exe to use is the AIAgentPing.exe. AIAgentPing
will only “ping” the Dynamic AI server and disappear again from the windows system task list.
- It is now possible to schedule system reports like log reports, system parameters, list of users
etc.
- When using the option to Build SQL View from database explore object dropdown options – the
automatically generated SQL will now be formatted to show each column in a separate row.
- Bug-fix: Dynamic AI SQL Views with parameters are now correctly picking up parameter array
from dictionary.
- Bug-fix: Default length, format and decimals are now correctly being set to defaults when using
clipboard format to specify selected columns and no format is specified.

DYNAMIC AI . AUTOMATED INTELLIGENCE . RELEASE 6.4 DOCUMENTATION
- New option to break export FIXED format, CSV and XML into multiple files based on grouped
values and the use of the “page-break” option.
- Fix to allow SELECT Filter box definitions on BIN (true / false, 1/0) type columns on MS SQL Server
- Fix to allow the character “;” as part of grouped values.
- Visual and speed improvements.

DYNAMIC AI . AUTOMATED INTELLIGENCE . RELEASE 6.4 DOCUMENTATION
Copyright 1998-2010. All rights reserved.
Special thanks to:
Robert Cergol, Balmar Inc. GS Rai, EBS Langley
Christian Hartlieb, Somentec Software AG Bernd Jöckel, Somentec Software AG
For inspiration, requests and contributions to the new Dynamic AI improvements!