New synthetic routes to bisphosphonates as potential drugs ...

Bisphosphonate therapy for osteogenesis imperfecta (Review)
Dwan K, Phillipi CA, Steiner RD, Basel D
This is a reprint of a Cochrane review, prepared and maintained by The Cochrane Collaboration and published in The Cochrane Library
2014, Issue 7http://www.thecochranelibrary.com
Bisphosphonate therapy for osteogenesis imperfecta (Review)
Copyright © 2014 The Cochrane Collaboration. Published by John Wiley & Sons, Ltd.

T A B L E O F C O N T E N T S
1HEADER . . . . . . . . . . . . . . . . . . . . . . . . . . . . . . . . . . . . . . .1ABSTRACT . . . . . . . . . . . . . . . . . . . . . . . . . . . . . . . . . . . . . .2PLAIN LANGUAGE SUMMARY . . . . . . . . . . . . . . . . . . . . . . . . . . . . . .2BACKGROUND . . . . . . . . . . . . . . . . . . . . . . . . . . . . . . . . . . . .4OBJECTIVES . . . . . . . . . . . . . . . . . . . . . . . . . . . . . . . . . . . . .4METHODS . . . . . . . . . . . . . . . . . . . . . . . . . . . . . . . . . . . . . .6RESULTS . . . . . . . . . . . . . . . . . . . . . . . . . . . . . . . . . . . . . . .
13DISCUSSION . . . . . . . . . . . . . . . . . . . . . . . . . . . . . . . . . . . . .16AUTHORS’ CONCLUSIONS . . . . . . . . . . . . . . . . . . . . . . . . . . . . . . .16ACKNOWLEDGEMENTS . . . . . . . . . . . . . . . . . . . . . . . . . . . . . . . .17REFERENCES . . . . . . . . . . . . . . . . . . . . . . . . . . . . . . . . . . . . .20CHARACTERISTICS OF STUDIES . . . . . . . . . . . . . . . . . . . . . . . . . . . . .39DATA AND ANALYSES . . . . . . . . . . . . . . . . . . . . . . . . . . . . . . . . . .
Analysis 1.1. Comparison 1 Oral bisphosphonates versus placebo, Outcome 1 Fracture risk reduction. . . . . . 42Analysis 1.2. Comparison 1 Oral bisphosphonates versus placebo, Outcome 2 Rate of fractures. . . . . . . . . 43Analysis 1.3. Comparison 1 Oral bisphosphonates versus placebo, Outcome 3 Number of people with at least one
fracture. . . . . . . . . . . . . . . . . . . . . . . . . . . . . . . . . . . . . 43Analysis 1.4. Comparison 1 Oral bisphosphonates versus placebo, Outcome 4 Mean change (z score) in spine BMD
(DEXA). . . . . . . . . . . . . . . . . . . . . . . . . . . . . . . . . . . . 44Analysis 1.5. Comparison 1 Oral bisphosphonates versus placebo, Outcome 5 Mean % change in spine BMD (DEXA). 45Analysis 1.6. Comparison 1 Oral bisphosphonates versus placebo, Outcome 6 Mean % change in total femur BMD
(DEXA). . . . . . . . . . . . . . . . . . . . . . . . . . . . . . . . . . . . 46Analysis 1.7. Comparison 1 Oral bisphosphonates versus placebo, Outcome 7 Change in height. . . . . . . . 46Analysis 1.8. Comparison 1 Oral bisphosphonates versus placebo, Outcome 8 Change in bone pain scores. . . . . 47Analysis 1.9. Comparison 1 Oral bisphosphonates versus placebo, Outcome 9 Change in analgesic use (days per week). 48Analysis 1.10. Comparison 1 Oral bisphosphonates versus placebo, Outcome 10 Change in well-being score. . . . 48Analysis 1.11. Comparison 1 Oral bisphosphonates versus placebo, Outcome 11 Change in self-care score (PEDI). . 49Analysis 1.12. Comparison 1 Oral bisphosphonates versus placebo, Outcome 12 Change in total mobility score
(WeeFIM). . . . . . . . . . . . . . . . . . . . . . . . . . . . . . . . . . . . 49Analysis 1.13. Comparison 1 Oral bisphosphonates versus placebo, Outcome 13 Hearing (assessed by % rinnie). . . 50Analysis 2.1. Comparison 2 IV bisphosphonates versus placebo or no treatment, Outcome 1 Number of participants with
at least one fracture. . . . . . . . . . . . . . . . . . . . . . . . . . . . . . . . . 50Analysis 2.2. Comparison 2 IV bisphosphonates versus placebo or no treatment, Outcome 2 Incidence of lower extremity
fractures. . . . . . . . . . . . . . . . . . . . . . . . . . . . . . . . . . . . 51Analysis 2.3. Comparison 2 IV bisphosphonates versus placebo or no treatment, Outcome 3 Incidence of upper extremity
fractures. . . . . . . . . . . . . . . . . . . . . . . . . . . . . . . . . . . . 51Analysis 2.4. Comparison 2 IV bisphosphonates versus placebo or no treatment, Outcome 4 Mean % change (from
baseline) in spine BMD (DEXA). . . . . . . . . . . . . . . . . . . . . . . . . . . . 52Analysis 2.5. Comparison 2 IV bisphosphonates versus placebo or no treatment, Outcome 5 Mean % change (z score) in
spine BMD (DEXA). . . . . . . . . . . . . . . . . . . . . . . . . . . . . . . . 53Analysis 2.6. Comparison 2 IV bisphosphonates versus placebo or no treatment, Outcome 6 Mean % change in total hip
BMD (DEXA). . . . . . . . . . . . . . . . . . . . . . . . . . . . . . . . . . 54Analysis 2.7. Comparison 2 IV bisphosphonates versus placebo or no treatment, Outcome 7 Change in vertical growth
(cm/year). . . . . . . . . . . . . . . . . . . . . . . . . . . . . . . . . . . . 55Analysis 2.8. Comparison 2 IV bisphosphonates versus placebo or no treatment, Outcome 8 Bone pain scores. . . 55Analysis 2.9. Comparison 2 IV bisphosphonates versus placebo or no treatment, Outcome 9 Muscle strength. . . . 56Analysis 2.10. Comparison 2 IV bisphosphonates versus placebo or no treatment, Outcome 10 BAMF (10-point gross
motor assessment). . . . . . . . . . . . . . . . . . . . . . . . . . . . . . . . . 56Analysis 3.1. Comparison 3 Oral versus IV bisphosphonates, Outcome 1 Annualised fracture rates. . . . . . . 57Analysis 3.2. Comparison 3 Oral versus IV bisphosphonates, Outcome 2 Spine BMD z scores. . . . . . . . . 57Analysis 3.3. Comparison 3 Oral versus IV bisphosphonates, Outcome 3 Change in alkaline phosphonate (IU/liter). 58
iBisphosphonate therapy for osteogenesis imperfecta (Review)
Copyright © 2014 The Cochrane Collaboration. Published by John Wiley & Sons, Ltd.

Analysis 3.4. Comparison 3 Oral versus IV bisphosphonates, Outcome 4 Change in bone alkaline phosphatase (IU/liter). 58Analysis 3.5. Comparison 3 Oral versus IV bisphosphonates, Outcome 5 Change in NTX/Cr (nMBCE/mM). . . 59Analysis 4.1. Comparison 4 Different doses of oral or IV bisphosphonates, Outcome 1 Number of crush-fractured
vertebrae. . . . . . . . . . . . . . . . . . . . . . . . . . . . . . . . . . . . 59Analysis 4.2. Comparison 4 Different doses of oral or IV bisphosphonates, Outcome 2 Number of fractures suffered by
participant. . . . . . . . . . . . . . . . . . . . . . . . . . . . . . . . . . . 60Analysis 4.3. Comparison 4 Different doses of oral or IV bisphosphonates, Outcome 3 Lumbar spine bone mineral
density. . . . . . . . . . . . . . . . . . . . . . . . . . . . . . . . . . . . . 60Analysis 4.4. Comparison 4 Different doses of oral or IV bisphosphonates, Outcome 4 Lumbar spine z score BMD. . 61Analysis 4.5. Comparison 4 Different doses of oral or IV bisphosphonates, Outcome 5 Length z score. . . . . . 61Analysis 4.6. Comparison 4 Different doses of oral or IV bisphosphonates, Outcome 6 Height z score at 2 years. . . 62Analysis 5.1. Comparison 5 IV versus IV, Outcome 1 Change in number of fractures per patient from baseline. . . 62Analysis 5.2. Comparison 5 IV versus IV, Outcome 2 Lumbar spine BMD at month 12. . . . . . . . . . . 63Analysis 5.3. Comparison 5 IV versus IV, Outcome 3 Supine height. . . . . . . . . . . . . . . . . . 63Analysis 5.4. Comparison 5 IV versus IV, Outcome 4 Vertebral spine length. . . . . . . . . . . . . . . 64
64ADDITIONAL TABLES . . . . . . . . . . . . . . . . . . . . . . . . . . . . . . . . . .69WHAT’S NEW . . . . . . . . . . . . . . . . . . . . . . . . . . . . . . . . . . . . .69HISTORY . . . . . . . . . . . . . . . . . . . . . . . . . . . . . . . . . . . . . . .70CONTRIBUTIONS OF AUTHORS . . . . . . . . . . . . . . . . . . . . . . . . . . . . .70DECLARATIONS OF INTEREST . . . . . . . . . . . . . . . . . . . . . . . . . . . . . .70DIFFERENCES BETWEEN PROTOCOL AND REVIEW . . . . . . . . . . . . . . . . . . . . .71INDEX TERMS . . . . . . . . . . . . . . . . . . . . . . . . . . . . . . . . . . . .
iiBisphosphonate therapy for osteogenesis imperfecta (Review)
Copyright © 2014 The Cochrane Collaboration. Published by John Wiley & Sons, Ltd.

[Intervention Review]
Bisphosphonate therapy for osteogenesis imperfecta
Kerry Dwan1 , Carrie A Phillipi2, Robert D Steiner3,4, Donald Basel5
1Department of Biostatistics, University of Liverpool, Liverpool, UK. 2Pediatrics Department, Oregon Health & Science University,Portland, Oregon, USA. 3Marshfield Clinic Research Foundation, Marshfield, Wisconsin, USA. 4Departments of Pediatrics andMolecular and Medical Genetics, Institute on Development and Disability, Doernbecher Children’s Hospital, Oregon Health & ScienceUniversity, Portland, Oregon, USA. 5Department of Pediatrics, Division of Genetics. MC#716, Milwaukee, Wisconsin, USA
Contact address: Donald Basel, Department of Pediatrics, Division of Genetics. MC#716, 9000W Wisconsin Avenue, Milwaukee,Wisconsin, WI 53226, USA. [email protected].
Editorial group: Cochrane Cystic Fibrosis and Genetic Disorders Group.Publication status and date: Edited (no change to conclusions), published in Issue 7, 2014.Review content assessed as up-to-date: 17 July 2014.
Citation: Dwan K, Phillipi CA, Steiner RD, Basel D. Bisphosphonate therapy for osteogenesis imperfecta. Cochrane Database of
Systematic Reviews 2014, Issue 7. Art. No.: CD005088. DOI: 10.1002/14651858.CD005088.pub3.
Copyright © 2014 The Cochrane Collaboration. Published by John Wiley & Sons, Ltd.
A B S T R A C T
Background
Osteogenesis imperfecta is caused by a genetic defect resulting in an abnormal type I collagen bone matrix which typically results inmultiple fractures with little or no trauma. Bisphosphonates are used in an attempt to increase bone mineral density and reduce thesefractures in people with osteogenesis imperfecta.
Objectives
To assess the effectiveness and safety of bisphosphonates in increasing bone mineral density, reducing fractures and improving clinicalfunction in people with osteogenesis imperfecta.
Search methods
We searched the Cochrane Cystic Fibrosis and Genetic Disorders Group Inborn Errors of Metabolism Trials Register which comprisesreferences identified from comprehensive electronic database searches, handsearches of journals and conference proceedings. We addi-tionally searched PubMed and major conference proceedings.
Date of the most recent search: 07 April 2014.
Selection criteria
Randomised and quasi-randomised controlled trials comparing bisphosphonates to placebo, no treatment, or comparator interventionsin all types of osteogenesis imperfecta.
Data collection and analysis
Two authors independently extracted data and assessed the risk of bias of the included trials.
Main results
Fourteen trials (819 participants) were included. Overall, the trials were mainly at a low risk of bias, although selective reporting was anissue in several of the trials. Data for oral bisphosphonates versus placebo could not be aggregated; a statistically significant differencefavouring oral bisphosphonates in fracture risk reduction and number of fractures was noted in two trials. No differences were reported
1Bisphosphonate therapy for osteogenesis imperfecta (Review)
Copyright © 2014 The Cochrane Collaboration. Published by John Wiley & Sons, Ltd.

in the remaining three trials which commented on fracture incidence. Five trials reported data for spine bone mineral density; all foundstatistically significant increased lumbar spine density z scores for at least one time point studied. For intravenous bisphosphonatesversus placebo, aggregated data from two trials showed no statistically significant difference for the number of participants with atleast one fracture, risk ratio 0.56 (95% confidence interval 0.30 to 1.06). In the remaining trial no statistically significant differencewas noted in fracture incidence. For spine bone mineral density, no statistically significant difference was noted in the aggregateddata from two trials, mean difference 9.96 (95% confidence interval -2.51 to 22.43). In the remaining trial a statistically significantdifference in mean per cent change in spine bone mineral density z score favoured intravenous bisphosphonates at six and 12 months.Data describing growth, bone pain, and functional outcomes after oral or intravenous bisphosphonate therapy, or both, as comparedto placebo were incomplete among all studies, but do not show consistent improvements in these outcomes. Two studies compareddifferent doses of bisphosphonates. No differences were found between doses when bone mineral density, fractures, and height or lengthz score were assessed. One study compared oral versus intravenous bisphosphonates and found no differences in primary outcomes. Twostudies compared the intravenous bisphosphonates zoledronic acid and pamidronate. There were no significant differences in primaryoutcome. However, the studies were at odds as to the relative benefit of zoledronic acid over pamidronate for lumbosacral bone mineraldensity at 12 months.
Authors’ conclusions
Bisphophonates are commonly prescribed to individuals with osteogenesis imperfecta. Current evidence, albeit limited, demonstratesoral or intravenous bisphosphonates increase bone mineral density in children and adults with this condition. These were not shownto be different in their ability to increase bone mineral density. It is unclear whether oral or intravenous bisphosphonate treatmentconsistently decreases fractures, though multiple studies report this independently and no studies report an increased fracture ratewith treatment. The studies included here do not show bisphosphonates conclusively improve clinical status (reduce pain; improvegrowth and functional mobility) in people with osteogenesis imperfecta. Given their current widespread and expected continued use,the optimal method, duration of therapy and long-term safety of bisphosphonate therapy require further investigation. In addition,attention should be given to long-term fracture reduction and improvement in quality of life indicators.
P L A I N L A N G U A G E S U M M A R Y
Bisphosphonate therapy for osteogenesis imperfecta
Osteogenesis imperfecta is also known as brittle bone disease. It is a genetic condition which can be passed on from a parent to childor occur in the child without any other family history. An affected person is at risk for frequent breaks of the long bones or collapseof the vertebral bones. There is no cure for osteogenesis imperfecta and treatment is mostly supportive. This review looked at trialsstudying one of the groups of medications known as bisphosphonates which are more typically used to treat osteoporosis. They areused in osteogenesis imperfecta to try and reduce the number of bone fractures in affected individuals.
We included 14 trials, and most of these did not show a major reduction in fractures in affected individuals when treated withbisphosphonates. Each trial independently showed significant improvements in bone mineral density after treatment with oral orintravenous bisphosphonates. Bone pain, growth and quality of life indicators were not reported in enough detail and the effects of thistreatment need further investigation. The long-term effectiveness and safety of bisphosphates, as well as dose and duration of therapy,require extended evaluation.
B A C K G R O U N D
A definition of terms is available at: http://www.cochrane.org/glossary.
Description of the condition
Osteogenesis imperfecta (OI) is an inherited, and most often auto-somal dominant condition, caused by mutations in genes encodingtype I collagen (Steiner 2013). Several recessive genetic defects have
2Bisphosphonate therapy for osteogenesis imperfecta (Review)
Copyright © 2014 The Cochrane Collaboration. Published by John Wiley & Sons, Ltd.

been identified as causing OI. This condition (sometimes calledbrittle bone disease) is characterized by bone fragility, and predis-position to fractures, in many cases with minimal or no trauma.Low bone mass is a common but not universal feature. In additionto multiple fractures, individuals with OI also commonly exhibitjoint hypermobility, blue or grey-blue scleral colour, dentinogen-esis imperfecta, and premature hearing loss (Cole 2002).Type I collagen is the most abundant protein of bone and isalso present in ligaments, tendons, dentin, sclera, and skin. Nor-mal bone matrix is composed of 90% Type I collagen fibersand 10% non-collagenous proteins. These collagen fibers areusually oriented in a preferential direction with hydroxyapatite[Ca10(PO4)6(OH)2] crystals located in the ground substancewithin these fibers. Hydroxyapatite crystals provide mechanicalrigidity and strength to bone whereas collagen fibers provide re-silience. Individuals with OI have less or poorer quality (or both)type-I collagen than unaffected people, causing their bones to de-form or fracture (or both). In 80% to 90% of people with OI,mutations in one of the two genes encoding type I collagen chains,COL1A1 and COL1A2, are found (Byers 1991).The exact incidence of OI is unknown as milder forms may beunrecognized. Finnish data published in 2002 by Kuurila suggest6 per 100,000 individuals are affected with the disorder (Kuurila2002). Other studies suggest the incidence of severe OI may be ashigh as 1 in 25,000 live births (Byers 2000; Connor 1985; Orioli1995). Parents with OI caused by collagen mutations have a 50%chance with each pregnancy of having an affected child and themajority of children with OI have inherited the disorder from aparent. However, de novo mutations account for approximately35% of children with OI (OIF 2008).Prior to the availability of molecular genetic analyses, four majorphenotypic classifications of OI were identified based on Sillencecriteria which includes inheritance mode, clinical presentation andradiographic findings (Sillence 1979). Further refinement of theseclassifications was made with molecular genetic analyses (Byers1991; Byers 1992; Glorieux 2000; OIF 2008; Steiner 2013). How-ever, recently, the classification has once again been reviewed asthe clinical utility of multiple subtypes of OI based on moleculardiagnoses was limited. A return to the more clinically useful classi-fication scheme has been recommended as represented in Table 1(Sillence 2012). The diagnosis is made by a combination of historyincluding family history, clinical examination, and radiographicfindings with genetic and/or biochemical testing available for di-agnostic confirmation.In about 80% to 90% of individuals affected by OI, mutations ineither of the genes encoding the pro-α1 or pro-α2 chains of typeI collagen (COL1A1 or COL1A2) can be identified (Byers 2013).Of those without collagen gene mutations, a number will havemutations in proteins involved in post-translational modificationor transport of type 1 collagen. These mutations tend to resultin the progressively deforming type of OI (formerly Type III) orlethal OI (formerly Type II) and are inherited in an autosomal
recessive manner. Genes involved include the following; CRTAP,P3H1/LEPRE1, PPIB, FKBP10, SERPINH1, SP7/OSX, SER-PINF1, BMP1 and WNT1 (Alanay 2010; Barnes 2006; Becker2011; Cabral 2007; Cho 2012; Christiansen 2010; Lapunzina2010; Martinez-Glez 2012; Pyott 2013 Van Dijk 2009). The sub-type of OI associated with interosseous calcification and hyper-trophic callus and inherited in an autosomal dominant mannerwas recently identified to be caused by a 5’UTR mutation of theIFITM5 gene (Semler 2012).
Description of the intervention
There is no cure for OI and therapy is largely supportive at present.Therapy is varied and individualized depending upon OI severity,degree of impairment and age of the individual. Orthopedic man-agement is paramount; surgical intervention or bracing of lowerlimbs, or both, is often required. Physical and occupational therapyare mainstays of therapy. Pharmacologic agents including growthhormone, calcitonin, parathyroid hormone, sodium fluoride, andvitamins have been administered in attempts to reduce fracturesand deformities in OI. Oral and intravenous (IV) bisphosphonatesare currently the most promising pharmacologic therapy and areroutinely used for OI, since clinical trials of these agents have con-sistently shown improvements in bone mineral density (BMD) inpeople with OI. A prior version of this review and other system-atic reviews have since found consistent improvements of BMDin people with OI who are treated with various bisphosphonates(Castillo 2009). Some trials also show fracture risk reduction andgrowth enhancement.
How the intervention might work
Bisphosphonates act by inactivating osteoclasts, the cells that breakdown bone tissue, thereby inhibiting bone resorption (Fisher1999). There are two different types of bisphosphonates, nitroge-nous and non-nitrogenous. Nitrogenous bisphosphonates disruptosteoclast formation, survival and cytoskeletal dynamics. Non-ni-trogenous bisphosphonates initiate osteoclast apoptosis. The bis-phosphonates vary in their efficacy and absorption when takenorally, making direct comparison challenging. An additional tablelists the currently available bisphosphonates (Table 2).Bisphosphonates are widely used in post-menopausal women totreat osteoporosis where they have been shown to increase bonedensity, decrease bone turnover (Reid 2002) and reduce fractures(Black 1996). Although increases in BMD are not expected toalter the underlying defective Type I collagen in OI, it is antici-pated that increased BMD might lead to decreased fracture ratesanalogous to bisphosphonate therapy in post-menopausal womenwith osteoporosis (Reid 2002). Animal models give reason for op-timism as increases in BMD in a mouse model of OI are accom-panied by decreases in fracture rate (Camacho 2001). Still, cau-
3Bisphosphonate therapy for osteogenesis imperfecta (Review)
Copyright © 2014 The Cochrane Collaboration. Published by John Wiley & Sons, Ltd.

tion is advised, since the biology of OI differs from osteoporosisand improving bone density without altering resiliency may notlead to desired functional improvements (Marini 2003). A reportof bisphosphonate-induced osteopetrosis validates these concerns(Whyte 2003).
Why it is important to do this review
There is currently no consensus on the effectiveness and safetyof these agents in the treatment of OI. Optimal timing of treat-ment in both children and adults remains undefined, as does doseand duration of treatment. Additionally, it is not fully understoodwhether fracture healing or post-surgical healing (or both) in peo-ple with OI will be impacted by bisphosphonate therapy. Theoptimal duration of bisphosphonate use is unclear even in post-menopausal women (FDA 2011). Emerging data from clinicaltrials and observational studies support an association betweenbisphosphonate use and atypical subtrochanteric femur fractures.These observations prompted the FDA to issue a warning regard-ing this possible adverse event (Erviti 2013). One of the authors(RS) observed such a complication in a teenage patient treatedwith alendronate.Children’s natural proclivity towards increased BMD and growth,coupled with the tendency for decreased fractures with advancingage in children with OI, make data comparison between adultsand children difficult. Large, multicentre, randomised, placebo-controlled trials to better assess the specific effects of bisphospho-nate therapy for OI are still indicated. The goals for use of phar-macologic agents in OI include increased bone density as mea-sured by dual-energy X-ray absorptiometry (DEXA), decreasedfracture incidence, lessening of deformity, reduced pain, and im-proved growth and mobility.The publication is an update of a Cochrane Review first publishedin 2008 (Phillipi 2008).
O B J E C T I V E S
To assess the effectiveness and safety of bisphosphonates in increas-ing BMD, reducing fractures and improving clinical function inpeople with OI.
M E T H O D S
Criteria for considering studies for this review
Types of studies
Randomised controlled trials (RCTs) and quasi-randomised trials,published or unpublished.
Types of participants
Children (defined as age 0 to 18 years) and adults with OI diag-nosed using accepted diagnostic criteria, based on clinical or lab-oratory findings, or both. Individuals affected with all types of OIare included in this review.
Types of interventions
Bisphosphonates to improve BMD in OI compared to placebo,no treatment control group, or comparator interventions, such assodium fluoride; testosterone; vitamin C; vitamin D; flavonoids;calcitonin; growth hormone; parathyroid hormone; and differentformulations or treatment regimens of bisphosphonates.
Types of outcome measures
Primary outcomes
1. Fracture reduction (numbers and rates)2. Change in BMD as assessed by DEXA
Secondary outcomes
1. Change in biochemical markers of bone and mineralmetabolism (e.g., bone alkaline phosphatase measurements)
2. Growth (z scores; vertebral heights)3. Bone pain (as assessed by self-reported questionnaires of
pain and analgesic use)4. Quality of life (e.g., functional changes in mobility,
strength, well-being and completion of activities of daily living(ADLs))
5. Lung function (e.g., pulmonary function testing)Outcome data were grouped at six months and then annually. Ifoutcome data had been recorded at other time periods, consider-ation was given to examining these as well.
Search methods for identification of studies
Electronic searches
We searched the Cystic Fibrosis and Genetic Disorders Group’sInborn Errors of Metabolism Trials Register using the term: Os-teogenesis Imperfecta.The Inborn Errors of Metabolism Trials Register is compiled fromelectronic searches of the Cochrane Central Register of Controlled
4Bisphosphonate therapy for osteogenesis imperfecta (Review)
Copyright © 2014 The Cochrane Collaboration. Published by John Wiley & Sons, Ltd.

Trials (CENTRAL) (updated each new issue of The Cochrane Li-
brary), quarterly searches of MEDLINE and the prospective hand-searching of one journal - Journal of Inherited Metabolic Disease.Unpublished work was identified by searching through the ab-stract books of the Society for the Study of Inborn Errors ofMetabolism conference and the SHS Inborn Error Review Series.For full details of all searching activities for the register, please seethe relevant section of the Cochrane Cystic Fibrosis and GeneticDisorders Group Module.We previously ran searches of PubMed and Ovid MEDLINE from1966 to March 2006. The search strategies are listed in the addi-tional tables (Table 3; Table 4).Date of the most recent search of the Group’s Cystic Fibrosis andGenetic Disorders Group Inborn Errors of Metabolism Trials Reg-ister: 07 April 2014.
Searching other resources
The major conference proceedings from the Osteogenesis Imper-fecta Foundation national conference, 1995 to March 2005, andthe American Society for Bone and Mineral Research annual meet-ing proceedings, 1996 to March 2005, were also hand searchedin order to identify pertinent unpublished work. In addition, theauthors contacted the pharmaceutical companies, who manufac-ture bisphosphonates (November 2004), for information on anyrelevant RCTs, but only one manufacturer responded. The datafrom the Novartis study concluded on 03 June 2008 are includedin this review.
Data collection and analysis
Selection of studies
Two authors (CP and RS, or CP and DB) read the papers identifiedby the review search strategy for relevancy and then assessed thetrials for inclusion in the review based on the criteria outlinedabove. They identified important comparisons within each class(e.g. oral versus IV bisphosphonates). If disagreement arose on thesuitability of a trial for inclusion in the review or its quality, theyreached a consensus by discussion.
Data extraction and management
Two authors (CP and KD) independently extracted data using astructured form including date of publication, participant charac-teristics (especially demographics and type of OI), setting, detailednature of intervention and control or, comparator, detailed natureof outcomes (i.e. bone density by DEXA, fractures, linear growth,bone turnover markers, bone pain and functional assessments).
Assessment of risk of bias in included studies
Previous versions of this review assessed the methodological qualityof included studies based on the methods described by Jüni (Jüni2001).This version of the review has used the Cochrane risk of biasassessment as described in the Cochrane Hadbook for Systematic
Reviews of Interventions 5.1 (Higgins 2011a). Two authors (CP andKD) evaluated the included studies independently for the domainslisted below as ’low risk’, ’high risk’ or ’unclear risk’ of bias andresolved any disagreement by discussion.
1. Random sequence generation2. Concealment of allocation3. Blinding of participants, personnel, outcome assessment4. Incomplete outcome data5. Selective reporting6. Other potential sources of bias
Measures of treatment effect
For binary outcome measures (fracture reduction) the authors col-lected data on the number of participants for each outcome eventand allocated treatment group. The authors calculated a pooledestimate of the treatment effect for each outcome across trials us-ing risk ratios (RR) and 95% confidence intervals (CIs) where ap-propriate.For continuous outcomes (change in BMD, change in biochemi-cal markers of bone and mineral metabolism, growth, bone pain,quality of life, lung function) the authors recorded either the meanchange from baseline for each group or mean post-treatment orintervention values and standard deviation (SD) or standard er-ror (SE) for each group. The authors calculated a pooled estimateof treatment effect by calculating the mean difference (MD) and95% CIs.
Unit of analysis issues
The authors included one cross-over trial in the review and treatedthe data from this trial as parallel data; i.e. as if the results from thetwo periods were independent (Seikaly 2005), Elbourne reportsthat using this approach is conservative, due to the fact that itignores the within-patient correlation (Elbourne 2002).For count data (number of fractures) the authors calculated therelative rate from the information given in the published papersfrom three trials using Poisson regression (Bishop 2010; Sakkers2004; Senthilnathan 2008).
Dealing with missing data
When the original papers presented data in a graph form, theauthors sometimes estimated values for use in the review (Chevrel2006). They calculated SDs when investigators reported SEs ofthe mean data (Seikaly 2005). The investigators of the Adami and
5Bisphosphonate therapy for osteogenesis imperfecta (Review)
Copyright © 2014 The Cochrane Collaboration. Published by John Wiley & Sons, Ltd.

Gatti trials kindly provided unpublished data on BMD (Adami2003; Gatti 2005).
Assessment of heterogeneity
The authors will assess heterogeneity by visual inspection of theforest plots, Chi2 test and I2 statistic. The I2 statistic describesthe percentage of total variation across trials due to heterogeneityrather than chance (Higgins 2003). The values of I2 lie between0% and 100%, and a simplified categorization of heterogeneitythat the authors plan to use is of low (I2 value of 25%), moderate(I2 value of 50%), and high (I2 value of 75%) (Higgins 2003).
Assessment of reporting biases
In future reports, the authors plan to create a funnel plot in orderto assess publication bias. If the authors observe asymmetry, theywill investigate other reasons for this. Heterogeneity and selectiveoutcome reporting would be possible sources for this bias.
Data synthesis
In this review the authors have analysed data using a fixed-effectsmodel. However, if in future updates, if they include a sufficientnumber of trials and find significant heterogeneity, they plan touse a random-effects model of statistical analysis and investigatepossible causes of heterogeneity further (see below).The authors used meta-analytic methods such as the inverse vari-ance method for continuous outcomes and the Mantel-Haenszelmethod for categorical outcomes.Meta-analysis of the available data was limited due to the differentagents used (oral versus IV bisphosphonates), different outcomemeasures, different populations (adults versus children), differentreporting indices (z score versus t score versus total BMD), andvariable inclusion of a placebo or control group.
Subgroup analysis and investigation of heterogeneity
Where the authors find heterogeneity, and if they have sufficienttrials included in a meta-analysis (i.e. four or more), they willinvestigate the possible causes further. Proposed subgroup analysesare by age (adults versus child); type of OI; and severity of disease(mild or severe).
Sensitivity analysis
When the authors include sufficient trials, they will perform asensitivity analysis based on the overall risk of bias of the trials,including and excluding quasi-randomized trials.
R E S U L T S
Description of studies
Please also refer to ’Table 5’ for further details.
Results of the search
Twenty-one trials were identified and reviewed, of which 14 (in-cluding 819 participants) RCTs met the inclusion criteria (Adami2003; Barros 2012; Bishop 2010; Bishop 2013; Chevrel 2006;DiMeglio 2006; Gatti 2005; Letocha 2005; Rauch 2009; Sakkers2004; Seikaly 2005; Senthilnathan 2008; Ward 2010; ZoledronicAcid 2008).
Included studies
Six trials compared an oral bisphosphonate to placebo (Bishop2013; Chevrel 2006; Rauch 2009; Sakkers 2004; Seikaly 2005;Ward 2010), while three trials compared an IV bisphosphonateto placebo (Adami 2003; Gatti 2005; Letocha 2005). One trialcompared different doses of oral bisphosphonates (Bishop 2010)and one trial compared different doses of IV bisphosphonates(Senthilnathan 2008). One trial compared oral to IV bisphospho-nates (DiMeglio 2006). Two trials compared different IV bispho-sphonates (Barros 2012; Zoledronic Acid 2008).Twelve trials enrolled 709 children, one of which included partici-pants up to 19 years of age (Ward 2010), which we included as chil-dren (Barros 2012; Bishop 2010; Bishop 2013; DiMeglio 2006;Gatti 2005; Letocha 2005; Sakkers 2004; Rauch 2009; Seikaly2005; Senthilnathan 2008; Ward 2010; Zoledronic Acid 2008)and two trials enrolled 110 adults (Adami 2003; Chevrel 2006).
Excluded studies
Eight trials were excluded from the review (Antoniazzi 1996;Antoniazzi 2006; Antoniazzi 2010; DiMeglio 2004; Gerber 1998;Granda 1977; Nagamani 2013; Ward 2005). Four trials were notRCTs (Antoniazzi 1996; Antoniazzi 2006; DiMeglio 2004; Ward2005). A further trial did not evaluate bisphosphonates but ratherlong-leg braces (Gerber 1998). One trial studied pyrophosphatelevels in OI disease severity rather than improvement in bonedensity or fracture reduction (Granda 1977), and a further trialinvestigated response to growth hormone rather than bisphos-phonates (Antoniazzi 2010). The eighth trial investigated teri-paratide, a parathyroid hormone analogue and not a bisphospho-nates (Nagamani 2013).
Risk of bias in included studies
The risk of bias has been assessed for this update and informationis included below and in Characteristics of included studies tables.
6Bisphosphonate therapy for osteogenesis imperfecta (Review)
Copyright © 2014 The Cochrane Collaboration. Published by John Wiley & Sons, Ltd.

Allocation
Generation of the allocation sequence
Six trials were described as randomised, by computer-generatedrandom numbers and were deemed to have a low risk of bias(Bishop 2010; Chevrel 2006; DiMeglio 2006; Letocha 2005;Sakkers 2004; Seikaly 2005). One further trial used an interactivevoice response system and was deemed to have a low risk of bias(Bishop 2013).Six trials were described as randomised, although no informationon the randomised procedures used was given and the trials aretherefore at an unclear risk of bias (Adami 2003; Barros 2012;Rauch 2009; Senthilnathan 2008; Ward 2010; Zoledronic Acid2008). Similarly, the Gatti trial was described as a RCT but themethod was not fully described and participants were assignedaccording to OI type to either an active or control group (unclearrisk of bias) (Gatti 2005).
Concealment of allocation
For eight trials, the method of allocation concealment was notstated and therefore were at an unclear risk of bias (Adami2003; Barros 2012; Gatti 2005; Letocha 2005; Rauch 2009;Senthilnathan 2008; Ward 2010; Zoledronic Acid 2008).For the Sakkers trial, generation of the randomisation sequencewas done independently of the researchers by an outside group,therefore concealment was deemed at low risk of bias (Sakkers2004). Similarly, for the Seikaly trial allocation was concealed bya pharmacist at the institution and was found to be at a low risk ofbias (Seikaly 2005). For the Cheverel trial, allocation was concealedby giving the randomised list to the researchers who then assignedeach new trial participant the subsequent number on the list (lowrisk of bias) (Chevrel 2006). For the DiMeglio trial, allocationconcealment was ensured by a clinic nurse who assigned treatment(low risk of bias) (DiMeglio 2006). Two trials used allocation bya remote telephone system randomisation and was at a low risk ofbias (Bishop 2010; Bishop 2013).
Blinding
Six trials were described as double blinded and therefore are at alow risk of bias (Bishop 2010; Bishop 2013; Chevrel 2006; Sakkers2004; Seikaly 2005; Ward 2010).The Adami trial it was stated that “prevalent vertebral fractureswere identified and graded blindly by a semi quantitative scale”,so was therefore at a low risk of bias for outcome assessors (Adami2003). The Letocha trial was described as unblinded but the in-vestigators were stated as blinded to vertebral area/compression(Letocha 2005) so outcome assessors were at a low risk of bias.The Gatti trial was not described as blinded and is therefore at anunclear risk of bias (Gatti 2005).
Two trials were open label and therefore at a high risk of bias(Barros 2012; DiMeglio 2006). One trial was open label but theoutcome assessors were blind to treatment allocation therefore thistrial was deemed at a low risk of bias (Zoledronic Acid 2008).One trial had carers, participants and outcome assessors blindedand was therefore at low risk of bias (Senthilnathan 2008). Detailsof blinding were not stated in one trial and was therefore at anunclear risk of bias (Rauch 2009).
Incomplete outcome data
For the Sakkers trial, an intention-to-treat analysis was undertaken.Two participants (one placebo and one treatment) withdrew fromthe trial but were accounted for in the final analysis and is at lowrisk of bias (Sakkers 2004). It was also reported that intention-to-treat analyses were performed in the Cheverel trial, and dropoutswere described, therefore the trial is at a low risk of bias (Chevrel2006).In the Adami trial, per protocol analyses were performed; althoughintention-to-treat analyses were planned, they were not applied asall participants completed the treatment follow up, indicating alow risk of bias (Adami 2003). Similarly, in the Gatti trial, inten-tion-to-treat analyses were planned but not applied as all partici-pants completed the treatment follow up (Gatti 2005).In the Letocha trial a per protocol and repeated-measures modelwas used but its is not clear if all participants completed the trial,so is therefore at an unclear risk of bias (Letocha 2005).For the Seikaly trial it is unclear whether intention-to-treat analyseswere performed introducing potential attrition bias, therefore thistrial is at an unclear risk of bias (Seikaly 2005).The type of analysis performed is not stated for the DiMeglio trial,although changes in group assignment were made when partic-ipants had difficulty tolerating the assigned regimen (DiMeglio2006). Loss to follow up for each group is reported therefore thetrial is at low risk of bias.One trial did not provide any information on the reasons thatparticipants dropped out of the trial and they did not state if anintention-to-treat analysis was used (Barros 2012). This trial wastherefore deemed at an unclear risk of bias.For six trials all dropouts were reported indicating a low risk of bias(Bishop 2010; Bishop 2013; Rauch 2009; Senthilnathan 2008;Ward 2010; Zoledronic Acid 2008).
Selective reporting
Eight trials were classified as having a low risk of bias as outcomesstated in the methods sections were reported (Adami 2003; Bishop2013; Chevrel 2006; Gatti 2005; Seikaly 2005; Senthilnathan2008; Ward 2010; Zoledronic Acid 2008). However, we had noaccess to protocols for this judgement, although trial registry in-formation was available for one trial (Zoledronic Acid 2008).Five trials were judged as having high risk of bias as outcomes
7Bisphosphonate therapy for osteogenesis imperfecta (Review)
Copyright © 2014 The Cochrane Collaboration. Published by John Wiley & Sons, Ltd.

were only reported as non-significant and no further data werereported (Bishop 2010; DiMeglio 2006; Letocha 2005; Rauch2009; Sakkers 2004). One trial was classed as having an unclearrisk of bias as decreased fracture rate was not fully reported (Barros2012).
Other potential sources of bias
Some trials employed retrospective methods to assess fracture ratesand may be subject to recall bias (Adami 2003; Bishop 2010;DiMeglio 2006; Gatti 2005; Letocha 2005). The natural procliv-ity towards reduced fractures and growth with age makes compar-ison difficult if adjusted scoring such as z scores are not used byresearchers.
Effects of interventions
As mentioned above, data were sometimes estimated when pre-sented in graph form (Chevrel 2006). Standard deviations werecalculated when SEs of the mean data were reported by the trialinvestigators (Seikaly 2005). For the Adami and Gatti trials, theintervention groups each received treatment for 24 and 36 monthsrespectively, and the control groups also began active therapy at 12months for the remainder of each trial (Adami 2003; Gatti 2005).Data are reported in this review at the 6 and 12 month time-pointsfor both trials where there is a comparison between interventionversus control (Adami 2003; Gatti 2005).One cross-over trial was included in the review, data from thistrial were treated as parallel data (Seikaly 2005). For count data(number of fractures), the relative rate was calculated from theinformation given in the published papers or received from authorsfrom five trials using Poisson regression (Adami 2003; Bishop2010; Gatti 2005; Sakkers 2004; Senthilnathan 2008).
Oral bisphosphonates compared to placebo or no
treatment control group
Six trials were included in this comparison (Bishop 2013; Chevrel2006; Rauch 2009; Sakkers 2004; Seikaly 2005; Ward 2010).
Primary outcomes
1. Fracture incidence
Each of the six trials reported on this outcome (Bishop 2013;Chevrel 2006; Rauch 2009; Sakkers 2004; Seikaly 2005; Ward2010). The Sakkers trial reported a 31% reduction in relativerisk for fracture after treatment with oral olpadronate, and whenanalysed in the review this produced a hazard ratio of 0.69 (95%CI 0.52 to 0.91) (Analysis 1.1 - as reported in the paper) and astatistically significantly decreased fracture number, relative rate
(RR) 0.40 (95% CI 0.24 to 0.69) (Analysis 1.2) (Sakkers 2004).The Bishop trial also reported risk of recurrent clinical fractureand when analysed in the review this produced a HR of 0.58(95% CI: 0.37 to 0.92) (P = 0.0416) at 12 months, which wasstatistically significant in favour of oral risendronate (Analysis 1.1).The Bishop trial also reported statistically significant differences inclinical non-vertebral (29/92 versus 24/49, P = 0.0446) and long-bone fractures (18/94 versus 17/49) and time to first fracture, HR0.53 (95% CI 0.31 to 0.92) (P = 0.0337) (Bishop 2013).Seikaly noted “a tendency to decrease the frequency of bone frac-tures” with alendronate versus placebo that did not reach signifi-cance (Seikaly 2005). Data cannot be entered into the meta-anal-ysis for this cross-over trial as the total number of fractures (andnot number of participants with one fracture or more) were re-ported across treatment groups. Three trials (Chevrel 2006; Rauch2009; Ward 2010) also showed no statistically significant differ-ence in the number of people with at least one fracture with bis-phosphonates compared to placebo, two trials at 24 months, RR1.05 (95% CI 0.82 to 1.35) (Rauch 2009; Ward 2010) and oneat 36 months, RR 0.97 (95% CI 0.48 to 1.95) (Chevrel 2006)(Analysis 1.3). However, Chevrel was not adequately powered todetect differences in fracture rate (Chevrel 2006). Rauch reported11 fractures from 7 of the 13 participants (0 to 2 per participant)in the risedronate group and 11 fractures from 6 of the 13 partici-pants (0 to 4 per participant) in the placebo group (Rauch 2009).
2. Change in BMD as assessed by DEXA
a. Mean per cent change in spine BMD
Each of the six trials reported on this outcome (Bishop 2013;Chevrel 2006; Rauch 2009; Sakkers 2004; Seikaly 2005; Ward2010). For the Sakker trial, data are not available in an appro-priate form to be entered into the meta-analyses (Sakkers 2004).Data for this trial were presented as within-group changes (notpresented in this review) showing statistically significant improve-ments in the bisphosphonates group and statistically non-signifi-cant changes in the placebo group (Sakkers 2004). One trial founda statistically significantly increase in lumbar spine density z scoresat six months, in favour of oral bisphosphonates, MD 0.39 (95%CI 0.28, 0.50) (Analysis 1.4) (Bishop 2013). Two trials found astatistically significantly increased lumbar spine density z scores at12 months, in favour of oral bisphosphonates, MD 0.51 (95%CI0.35 to 0.68) (Analysis 1.4) (Bishop 2013; Seikaly 2005). Twotrials reported a significant change in lumbar spine area BMD zscore at 24 months, MD 0.99 (95% CI 0.70, 1.28) in favour oforal bisphosphonates (Analysis 1.4) (Rauch 2009; Ward 2010).Chevrel reported a significant increase in lumbar spine BMDthroughout the three years of the trial (Chevrel 2006). It was re-ported that the increase was much greater after the first 12 months,although this continued, without reaching a plateau to the end
8Bisphosphonate therapy for osteogenesis imperfecta (Review)
Copyright © 2014 The Cochrane Collaboration. Published by John Wiley & Sons, Ltd.

of treatment at 36 months; for lumbar spine at 12 months, MD7.00 (95% CI 3.87 to 10.13) and at 36 months, MD 9.40 (95%CI 5.44 to 13.36) (Chevrel 2006) (Analysis 1.5). Three studiesreported a significant difference at two years, MD 17.31 (95% CI5.01 to 29.62) although there was a considerable amount of het-erogeneity (I2 = 77%) (Chevrel 2006; Rauch 2009; Ward 2010)(Analysis 1.5).
b. Mean per cent change in total femur BMD
One trial reported on this outcome (Chevrel 2006). The meanper cent change in total femur BMD were reported by Chevrel at36 months, the increase in the alendronate group was statisticallysignificantly greater than that in the placebo group; total femurBMD, MD 3.00 (95% CI 2.73 to 3.27) (Chevrel 2006) (Analysis1.6).
Secondary Outcomes
1. Change in biochemical markers of bone and mineral
metabolism and bone histology
The varied markers chosen for study in the included trials wereviewed prohibited direct comparison, but a narrative descriptionof the findings are presented.Each of the six trials reported on this outcome (Chevrel 2006;Bishop 2013; Rauch 2009; Sakkers 2004; Seikaly 2005; Ward2010). Sakkers reported (in narrative format only) no statisti-cally significant change in urine or serum markers between the ol-padronate and placebo groups (Sakkers 2004). Seikaly also foundno change in serum or urinary markers of bone turnover betweenthe alendronate and placebo groups. However, since data forthis cross-over trial were presented separately by treatment armfor each of the four arms of the trial, we were unable to analysethis as if it were a parallel trial as planned (See: Unit of analysisissues) (Seikaly 2005). A decrease in some bone resorption mark-ers (collagen peptides, osteocalcin) with alendronate administra-tion was noted by Chevrel while alkaline phosphatase levels wereunchanged (Chevrel 2006). In the Ward trial, no difference wasfound in serum alkaline phosphatase, but there was a difference inuNTx to creatinine ratio (Ward 2010). Rauch reported a differencein risedronate and placebo for serum NTX %, but no differencefor alkaline phosphatase % and urine NTX/Cr % (Rauch 2009).The Bishop trial trial reported normal and unchanged values forserum 25-hydroxyvitamin D and intact parathyroid hormone atall time-points for both treatment groups (Bishop 2013). Theyadditionally report statistically significant changes in both urineNTx/Cr and bone-specific alkaline phosphatase at the 6- and 12-month time periods (Bishop 2013).
2. Growth
Five trials reported on this outcome (Bishop 2013; Rauch 2009;Sakkers 2004; Seikaly 2005; Ward 2010). Sakkers narratively re-ported no differences in seated height or radiographic assessmentsof lumbar vertebral height between olpadronate and placebo at 24-months follow up (Sakkers 2004). Bishop and Seikaly found a sta-tistically significant increase in height growth z scores in responseto 12 months of alendronate therapy, MD 0.24 (95% CI 0.04 to0.43) (Bishop 2013; Seikaly 2005), but Rauch and Ward did notfind a statistically significant difference at 24 months, MD 0.08(95% CI -0.19 to 0.35) (Rauch 2009; Ward 2010) (Analysis 1.7).This outcome was not addressed in the remaining trial (Chevrel2006).
3. Bone pain
Five trials reported on this outcome (Bishop 2013; Chevrel 2006;Rauch 2009; Seikaly 2005; Ward 2010). For the alendronategroup, statistically significant decreases in pain scores and analgesicuse at 12 months were reported by Seikaly, MD -3.63 (95% CI -5.17 to -2.09) and MD -2.00 (95% CI -3.57 to -0.43), respectively(Analysis 1.8; Analysis 1.9) (Seikaly 2005). Here, the interactionof treatment and order were not statistically significant, indicat-ing that differences found between alendronate and placebo werenot explained by order of administration. At 24 months Ward re-ported a non-significant difference (in favour of the alendronategroup), MD -0.73 (95% CI -2.64, 1.18) (Ward 2010). The num-ber of patients with bone pain was also reported as 37% (38 outof 102) in the alendronate group and 57% (17 out of 30) in theplacebo group. Chevrel narratively reported that the pain score wassimilar in both groups from 0 to 30 months and reported end oftrial data that showed an increase at 36 months with alendronate,MD 1.30 (95% CI 0.14 to 2.46) (Analysis 1.8) (Chevrel 2006).Rauch reported that the number of patients suffering from bonepain at the end of the study was 31% (4 out of 13) in both therisedronate group and the placebo group and the difference wasnot statistically significant (Rauch 2009). Bishop did not identifya difference in pain scales between the groups and the data was notshown. However, they do report pain as an adverse events reportedby at least 10% of patients in either study group (pain in 14 outof 94 versus 5 out of 49 and pain in the arms and back in 20 outof 94 versus 14 out of 49) (Bishop 2013).Bone pain was not evaluated by Sakkers (Sakkers 2004).
4. Quality of life
Four of the included trials evaluated at least one quality of lifeoutcome (Chevrel 2006; Sakkers 2004; Seikaly 2005; Ward 2010).Seikaly reported a statistically significant increase in well-beingas assessed by scored participant recall, MD 3.19 (95% CI 2.25to 4.13) (Seikaly 2005) (Analysis 1.10); improved self-care skillsor ADLs (assessed by Pediatric Evaluation of Disability Inventory
9Bisphosphonate therapy for osteogenesis imperfecta (Review)
Copyright © 2014 The Cochrane Collaboration. Published by John Wiley & Sons, Ltd.

(PEDI), a validated measurement tool) with alendronate versusplacebo, MD 3.58 (95% CI 1.06 to 6.10) (Analysis 1.11); butno improvements in mobility as assessed by WeeFIM (a validatedmeasurement tool for transfers, locomotion, access to stairs), MD0.79 (95% CI -3.31 to 4.89) (Analysis 1.12). In contrast, Sakkerscompared olpadronate to placebo and narratively reported thatthere were no changes in functional outcomes as assessed by PEDI,nor did the authors find changes in grip or hip flexor strength.Mobility as assessed by another validated scale (Bleck) was alsonot improved when compared to placebo controls (Sakkers 2004).These functional outcomes were not addressed in other includedstudies (Chevrel 2006). Chevrel was the only trial to assess hearingand did not find any difference (as assessed by Rinne testing %)with alendronate administration, MD -0.10 (95% CI -2.88 to2.68) (Chevrel 2006) (Analysis 1.13).The Ward trial reported no change from baseline in self-care, mo-bility and grip force at 24 months; self-care, MD 2.01 (95% CI -1.31 to 5.33) (Analysis 1.11); and mobility, MD 1.50 (95% CI -4.55, 7.55) (Ward 2010) (Analysis 1.12).Two trials did not report on quality of life (Bishop 2013; Rauch2009).
5. Lung function
None of the included trials reported on this outcome (Bishop2013; Chevrel 2006; Rauch 2009; Sakkers 2004; Seikaly 2005;Ward 2010).
IV Bisphosphonates compared to placebo or no
treatment control group
Three trials were included in this comparison (Adami 2003; Gatti2005; Letocha 2005).
Primary outcomes
1. Fracture incidence
Each of the included trials reported on this outcome (Adami 2003;Gatti 2005; Letocha 2005). For the Adami and Gatti trials, data onthe number of participants with at least one fracture were obtainedfrom the primary investigators. There was no statistically signifi-cant difference between the treatment and control groups, RR 0.56(95% CI 0.30 to 1.06) (Adami 2003; Gatti 2005) (Analysis 2.1).Data were also obtained on the total number of fractures amongstparticipants for the treatment and control groups and these were1 out of 31 and 2 out of 15 (respectively) for the Adami trial and13 out of 42 and 18 out of 22 for the Gatti trial (Adami 2003;Gatti 2005). For the Letocha trial the incidence of fractures of thelower and upper extremities at 12 months did not change statis-tically significantly between the pamidronate and placebo groupsfrom baseline, MD -0.11 (95% CI -0.96 to 0.74) (Analysis 2.2;);
MD -0.22 (95% CI -0.67 to 0.23), respectively (Letocha 2005)(Analysis 2.3).
2. Change in BMD as assessed by DEXA
a. Mean per cent change in spine BMD
Each of the included trials reported on this outcome (Adami2003; Gatti 2005; Letocha 2005). Adami reported BMD at sixmonth intervals from 6 to 24 months. In this trial, the interventiongroup received neridronate for 24 months and the control groupbegan therapy at 12 months which continued for 12 months. Wetherefore report data here for the six- and 12-month time points tocompare intervention versus no treatment (Adami 2003). Whensummary statistics from two studies were calculated, there was nostatistically significant differences between treatment and controlgroups in spine BMD at six months, MD 9.96 (95% CI -2.51 to22.43) (I2 = 89%) and at 12 months, MD 14.68 (95% CI -6.08to 35.45) (I2 = 95%) (Analysis 2.4) (Adami 2003; Gatti 2005).However, it should be noted that the I2 values are very large,representing a considerable amount of heterogeneity, I2 = 89%and 95% respectively, although there are only two studies. Letochainvestigated the mean per cent change in spine BMD z score andfound statistically significant increases with IV pamidronate at sixmonths, MD 21.59 (95% CI 5.79 to 37.39) and 12 months, MD25.60 (95% CI 11.48 to 39.72) (Letocha 2005) (Analysis 2.5).
b. Mean per cent change in hip BMD
Two of the included trials reported on this outcome (Adami 2003;Gatti 2005). Adami and Gatti reported data on total hip BMDat six and 12 months. No statistically significant differences werenoted when hip BMD data from these trials were combined, MD6.16 (95% CI -3.57 to 15.90) and MD 11.27 (95% CI -3.69 to26.22), respectively (Adami 2003; Gatti 2005) (Analysis 2.6).We note for both mean per cent change in spine and hip BMD forthe Adami and Gatti trials that there are large differences in theSDs reported for each of these two trials and whilst clinically it isappropriate for these trials to be combined, we plan to investigatethis heterogeneity further once more trials are included (Adami2003; Gatti 2005).
Secondary Outcomes
1. Change in biochemical markers of bone and mineral
metabolism and bone histology
Two trials reported on this outcome (Adami 2003; Gatti 2005).Information was provided narratively within the text for each
10Bisphosphonate therapy for osteogenesis imperfecta (Review)
Copyright © 2014 The Cochrane Collaboration. Published by John Wiley & Sons, Ltd.

trial. Adami reported a decrease in: bone specific alkaline phos-phatase (BSAP); serum C-telopeptide (sCTx); and urinary free-de-oxy pyridinoline (ufDPD) in the neridronate group (within groupdata not presented) (Adami 2003). In the Gatti trial, statisticallysignificant decreases in alkaline phosphatase were found with IVadministration of neridronate in children (Gatti 2005).
2. Growth
One trial reported on this outcome (Letocha 2005). There were nostatistically significant improvements in growth rate at 12 months,MD 1.07 (95% CI -2.24 to 4.38) (Letocha 2005) (Analysis 2.7).Growth was not measured in the remaining trials (Adami 2003;Gatti 2005).
3. Bone pain
One trial reported on this outcome (Letocha 2005). No changesin self-reported bone pain on a self-evaluation four-point scalewere found by Letocha, MD -0.11 (95% CI -0.83 to 0.61) (Letocha 2005) (Analysis 2.8). Bone pain was not addressed bythe remaining two trials using IV bisphosphonates (Adami 2003;Gatti 2005).
4. Quality of life
One trial reported on this outcome (Letocha 2005). Letocha in-vestigated muscle strength and gross motor function (using BAMF(Brief Assessment of Motor Function), a 10-point gross motor as-sessment tool) (Letocha 2005). No differences in muscle strengthor functional mobility were noted between the IV pamidronateand control groups during treatment, MD -3.18 (95% CI -18.97to 12.61) (Analysis 2.9); MD -0.80 (95% CI -2.42 to 0.82), re-spectively (Letocha 2005) (Analysis 2.10). Outcomes reflectingquality of life were not evaluated or reported in the remaining IVbisphosphonates trials (Adami 2003; Gatti 2005).
5. Lung function
None of the included trials reported on this outcome (Adami 2003;Gatti 2005; Letocha 2005).
Oral versus IV bisphosphonates
One trial was included in this comparison (DiMeglio 2006).
Primary outcomes
1. Fracture incidence
DiMeglio reported annualised fracture rates and found no dif-ference between oral alendronate and IV pamidronate treatment
groups, MD 0.50 (95% CI -0.64 to 1.64) (DiMeglio 2006)(Analysis 3.1).
2. Change in BMD as assessed by DEXA
DiMeglio did not find a difference in BMD when they comparedoral to IV therapy at 12 months, MD 0.30 (95% CI -1.11 to 1.71)and 24 months, MD 0.20 (95% CI -1.32 to 1.72) (DiMeglio2006) (Analysis 3.2).
Secondary Outcomes
1. Change in biochemical markers of bone and mineral
metabolism and bone histology
DiMeglio reported that there were no statistically significant dif-ferences in response between the two treatment groups at 4, 12,or 24 months (DiMeglio 2006). Data were reported for the four-and 24-month time-periods for change in alkaline phosphonate(IU/L)) at four months, MD -12.00 (95% CI -86.09 to 62.09)and 12 months, MD -35.00 (95% CI -115.36 to 45.36) (Analysis3.3); change in bone alkaline phosphonate (IU/L) at four months,MD 5.00 (95% CI -22.36 to 32.36) and 12 months, MD -12.00(95% CI -39.78 to 15.78) (Analysis 3.4); and change in NTX/Cr(nMBCE/mM) at four months, MD -108.00 (95% CI -300.32 to84.32) and 12 months, MD -111.00 (95% CI -269.38 to 47.38)(DiMeglio 2006) (Analysis 3.5).
2. Growth
DiMeglio found no statistically significant difference in heightcompared to baseline in the oral or IV groups (within-group data)(DiMeglio 2006).
3. Bone pain
DiMeglio did not investigate bone pain (DiMeglio 2006).
4. Quality of life
DiMeglio did not address quality of life indicators (DiMeglio2006).
5. Lung function
DiMeglio did not investigate lung function (DiMeglio 2006).
11Bisphosphonate therapy for osteogenesis imperfecta (Review)
Copyright © 2014 The Cochrane Collaboration. Published by John Wiley & Sons, Ltd.

Different doses of oral or IV bisphosphonates
Two trials were included in this comparison (Bishop 2010;Senthilnathan 2008). Bishop considered different doses of oralbisphosphonates and Senthilnathan considered different doses ofIV bisphosphonates and were therefore not pooled in the analysis(Bishop 2010; Senthilnathan 2008).
Primary outcomes
1. Fracture incidence
Senthilnathan found no difference in the 6 mg/kg and 12 mg/kgdose in the number of crush-fractured vertebrae with rate ratio1.28 (95% CI 0.67 to 2.45) (Senthilnathan 2008) (Analysis 4.1).Bishop found no difference in fracture reduction when comparingeach of the three dose groups (0.2, 1, 2 mg/kg/week), RR 0.87(95% CI 0.48 to 1.57), RR 0.78 (95% CI 0.44 to 1.37), RR 0.89(95% CI 0.51 to 1.54), respectively (Bishop 2010) (Analysis 4.2).
2. Change in BMD as assessed by DEXA
Senthilnathan found no difference in lumbar spine BMD at 12months between the different doses, MD 45.00 (95% CI -30.15to 120.15) (Senthilnathan 2008) (Analysis 4.3).Bishop found a statistically significant difference in lumbar spinez score BMD adjusting for the baseline value of each outcome andage when comparing 0.2 mg/kg versus 2 mg/kg, MD -1.18 (95%CI -1.97 to -0.39) (Bishop 2010) (Analysis 4.4). No differencewas found at remaining two dose groups: 0.2 mg/kg/week versus1 mg/kg/week, MD -0.50 (95% CI -1.29 to 0.29); 1 mg/kg/weekversus 2 mg/kg/week, MD -0.68 (95% CI -1.46 to 0.10) (Bishop2010) (Analysis 4.4).
Secondary Outcomes
1. Change in biochemical markers of bone and mineral
metabolism and bone histology
In the Senthilnatahn study, the mean (SD) serum bone specificALP declined from 235 (49) IU/l at baseline to 170 (46) IU/l at 12months, remaining well above the upper limit of the adult normalrange (48 IU/l). NTx fell from 2089 (1612) to 551 (120) nmolBCE/mmol creatinine over the same period. In percentage terms,ALP fell by 28% (17%) and NTx by 74% (27%) (Senthilnathan2008).In the Bishop study, bone specific alkaline phosphatase activitydeclined by 1% from 81 ± 28 to 80 ± 39 IU/l (maximum declinefor any child was 63%) and NTx by 21% from 2575 ± 1618 to2044 ± 1031 nmol/mmol BCE (maximum decline for any child70%) over the two year period of the study (Bishop 2010).
2. Growth
Senthilnathan reported no difference in final length z score be-tween the two dose groups, MD 2.10 (95% CI -0.50 to 4.70)(one trial) (Analysis 4.5) (Senthilnathan 2008). Bishop also foundno difference in height z score for the three dose groups (0.2, 1,2 mg/kg/week) at two years, (MD -0.56 (95% CI -2.46 to 1.34)(one trial), MD -1.15 (95% CI -2.87 to 0.57) (one trial), MD-0.59 (95% CI -2.34 to 1.16,) (one trial), respectively (Analysis4.6) (Bishop 2010).
3. Bone pain
Bishop found no difference between the groups in pain scoresbut no data was presented (Bishop 2010). Senthilnathan did notmeasure bone pain (Senthilnathan 2008).
4. Quality of life
Bishop reported that there were no statistically significant differ-ences in PEDI and Gross Motor Function Measure scores betweenthe groups. Mean (SD) grip strength in the right and left handsrespectively was 33.6 (23.9) lb and 31.8 (21.6) lb at study initia-tion and 38.4 (20.9) lb and 39.3 (21.8) lb at study end. Neitherdifference was statistically significant and data are not presentedseparately for each treatment group (Bishop 2010).Senthilnathan did not measure quality of life outcomes (Senthilnathan 2008).
5. Lung function
Neither of the included trials reported on this outcome (Bishop2010; Senthilnathan 2008).
IV versus IV bisphosphonates
Two trials were included in this comparison which comparedzoledronic acid to pamidronate efficacy in OI (Barros 2012;Zoledronic Acid 2008).
Primary outcomes
1. Fracture incidence
The zoledronic acid trial reported that there was no difference inthe number of patients with fractures (32 (43%) versus 31 (41%))(Zoledronic Acid 2008). The trial investigators also reported nodifference in the change in number of fractures per patient frombaseline, MD -0.41 (95% CI -1.45 to 0.63) (Analysis 5.1).The Barros trial reported that at the end of the follow-up period,both groups showed a decrease in the fracture rate (P = 0.025 andP = 0.048, respectively). No further data were reported (Barros2012).
12Bisphosphonate therapy for osteogenesis imperfecta (Review)
Copyright © 2014 The Cochrane Collaboration. Published by John Wiley & Sons, Ltd.

2. Change in BMD as assessed by DEXA
The zoledronic trial reported a statistically significant change inlumbar spine BMD, MD 8.06 (95% CI 0.48 to 15.64) favouringzoledronic acid (Zoledronic Acid 2008) (Analysis 5.2).The Barros trial appears to favour pamidronate in the analysis, MD-1.50 (95% CI -2.86 to -0.14) (Analysis 5.2), however, the trialreport indicates that compared with the pamidronate group, thezoledronic acid group had a significant increase in lumbar spine zscore at one year (P = 0.053) (Barros 2012).
Secondary Outcomes
1. Change in biochemical markers of bone and mineral
metabolism and bone histology
The zoledronic trial reported that there was a statistically signifi-cant reduction in CTx , P1NP and BSALP in the zoledronic groupcompared to the pamidronate group at both six and 12 months(Zoledronic Acid 2008).There was no significant difference in osteocalcin (OC) or serumCTx between the groups. Data on other markers are reported in’Table 2’ of the trial report (Barros 2012).
2. Growth
The increases in both supine length and vertebral spine lengthwere numerically greater in the pamidronate group compared tothe zoledronic acid group, but the results were not statisticallysignificant: MD -0.50 (95% CI -2.62 to 1.62) (Analysis 5.3); MD-0.80 (95% CI -2.39 to 0.79), respectively (Analysis 5.4). Heightwas not adjusted for age so it was not possible to tell from the dataif there was an improvement in growth (z score) in patients onbisphosphonates (Zoledronic Acid 2008).In the Barros trial, there was no significant change in height inboth groups throughout the treatment (pamidronate 111.7 (30.3)versus zoledronic acid 97.0 (16)). It is not clear what the numberof patients were in each group so this data could not be includedin the forest plot (Barros 2012).
3. Bone pain
In one trial, bone pain was assessed using the Wong-Baker FACESat baseline, 6 and 12 months and did not identify a clear increase inbone pain compared to baseline nor did it identify a clear differencebetween treatment groups (Zoledronic Acid 2008). Most patientshad no pain or minimal pain at baseline and at the end of thestudy. Data are fully reported but were not summarised. Pain wasalso reported as an adverse event that occurred in at least 10% ofpatients in either treatment group (safety population, zoledronicacid 17.6% versus pamidronate 5.1%).The Barros trial did not report on this outcome (Barros 2012).
4. Quality of life
Neither of the included trials reported on this outcome (Barros2012; Zoledronic Acid 2008).
5. Lung function
Neither of the included trials reported on this outcome (Barros2012; Zoledronic Acid 2008).
D I S C U S S I O N
Summary of main results
Fourteen trials were included in this review; 12 of these enrolledchildren (Barros 2012; Bishop 2010; Bishop 2013; DiMeglio2006; Gatti 2005; Letocha 2005; Rauch 2009; Sakkers 2004;Seikaly 2005; Senthilnathan 2008; Ward 2010; Zoledronic Acid2008) and two enrolled adults (Adami 2003; Chevrel 2006). Tovarying degrees, these studies investigated changes in BMD, frac-ture rate, markers of bone turnover, growth, pain and quality oflife with bisphosphonate therapy. For a summary of outcomes re-ported, see ’Additional tables’ (Table 5).
Overall completeness and applicability ofevidence
All trials assessing BMD independently reported statistically sig-nificant increases after treatment with either oral or IV bisphos-phonate and sometimes at separate sites (spine, hip, femur). How-ever, it is difficult to compare these trials directly as different pop-ulations were included (adults versus children; for accurate com-parisons children cannot be compared to adults due to high boneturnover during childhood and adolescence and open epiphyses).Additionally, different reporting indices were used (z score versust score versus total BMD). As previously mentioned, the expectedgrowth and BMD increases in children and adolescents with OI,coupled with their tendency for decreased fractures, make datacomparison challenging. Statistically significant gains in spine andhip BMD were not seen with IV bisphosphonate administrationat 6 and 12 months with combined summary statistics, indicat-ing need for continued rigorous study (Adami 2003; Gatti 2005).Interestingly, multiple trials reported the largest gains in BMDin the first year of therapy (Adami 2003; Bishop 2013; Chevrel2006; Gatti 2005; Letocha 2005; Rauch 2009; Ward 2010) andgains in BMD were independent of administration of therapyin a placebo-controlled cross-over trial (Seikaly 2005). Two tri-als showed greater increases with higher dosing (Bishop 2010;Senthilnathan 2008); one of which showed a statistically signifi-cant increase in BMD only at the higher dosing schedule (Bishop
13Bisphosphonate therapy for osteogenesis imperfecta (Review)
Copyright © 2014 The Cochrane Collaboration. Published by John Wiley & Sons, Ltd.

2010). These data possibly argue for the study and considerationof short-course bisphosphonate therapy. When oral and IV bis-phosphonates were directly compared, both statistically signifi-cantly increased spine BMD z scores at 12 and 24 months, butthere were no differences in BMD between groups when route ofadministration was considered (DiMeglio 2006) (Analysis 3.2).The combined data analyses supporting a change in fracture in-cidence after bisphosphonate therapy are less straightforward.Adami reported a 14% reduction of fractures after adults weretreated with IV neridronate (Adami 2003). Sakkers found a 31%reduction in the relative risk of fracture of long bones after treat-ment with oral olpadronate in children affected with OI (Sakkers2004). Relative risk of fracture was also reduced by 0.36% inanother trial (Gatti 2005). Seikaly noted a non-significant trendtoward decreased fractures (Seikaly 2005). DiMeglio found nodifferences in fracture incidence with oral versus IV bisphospho-nate administration and noted a decreased fracture incidence withtime, but only when oral and IV groups were combined (DiMeglio2006). Letocha found decreased upper extremity but not lowerextremity fracture rates in the first year of therapy but no furtherincreases were noted when therapy was extended (Letocha 2005).Bishop reported an overall tendency to reduced fracture incidencewhen compared to the fracture incidence over the prior two years.They noted no statistically significant difference between the doseof oral bisphosphonates (Bishop 2010). A larger study by Bishopreported statistically significant difference in fracture incidencebetween children treated with risedronate and the placebo con-trol group; 31% versus 49% respectively. However, during the fol-lowing two years of open-label study, the same groups reportedfracture incidence of 53% and 65% respectively (Bishop 2013).Chevrel found no difference in vertebral or peripheral fracture ratesbut was not adequately powered to detect a difference (Chevrel2006). A further three trials did not identify a statistically signifi-cant difference in fracture incidence, although the Senthilnathantrial did make note of an improvement in infant spinal crush frac-ture (Rauch 2009; Senthilnathan 2008; Ward 2010). It should benoted that none of the 14 included trials reported increased frac-tures with bisphosphonate treatment. When we further analysedthe number of participants with at least one fracture, we foundno difference in fractures in patients treated with IV neridronatecompared to the control population (Adami 2003; Gatti 2005)(Analysis 2.1). These trials employed retrospective fracture recallas a method for comparison, leading to potential recall bias. Thenumber of patients randomised versus those lost to follow up wasalso unclear in one trial (Adami 2003). Consideration of reportedheterogeneous results, in addition to the aforementioned naturaltendency toward reduction in fractures with age highlight the im-portance of continued prospective, placebo-controlled evaluationof bisphosphonates and fracture incidence in children. This is pos-sible given widespread bisphosphonate use.All 14 trials measured serum and urine markers (or both) of eitherbone formation or resorption (or both). The trials did not focus on
the same biochemical markers, but each applied best practice withrespect to sample collection and remained consistent to the markerchosen to represent bone turnover. Twelve trials reported decreasesin serum (Adami 2003; Barros 2012; Bishop 2010; Chevrel 2006;DiMeglio 2006; Gatti 2005; Rauch 2009; Senthilnathan 2008;Zoledronic Acid 2008) or urine type I collagen by products (Adami2003; Bishop 2013; DiMeglio 2006; Seikaly 2005; Ward 2010)whereas two trials reported no statistical difference in biochemicalmarkers of bone turnover between treatment and control groupsor from baseline (Letocha 2005; Sakkers 2004). The clinical sig-nificance and utilization of these biochemical markers of boneturnover are not universally utilized, however, the assumption isthey act as a proxy for efficacy of therapy. These markers are notspecific to process but indicate a change in bone homeostasis andare not reliable indicators of acute change. The varied markerschosen for study in the trials we reviewed prohibited direct com-parison, but more systematic study of these markers could assistinvestigators in assessing response to individual bisphosphonatesand their dosing, as well as participant compliance or concordance,or both, with therapy.Bisphosphonate therapy was not conclusively shown to impactvertical growth. Ten trials included in this review commented ongrowth. Seikaly reported increased height z scores with oral bis-phosphonates (Seikaly 2005). Growth as assessed by height andlength combined z scores compared to normal children was in-creased in another trial when children receiving oral and IV ther-apies were combined (DiMeglio 2006). Letocha found growthrates were unchanged by bisphosphonate therapy (Letocha 2005).Seated height and vertebral height were also not different in thetreatment versus placebo group of another trial (Sakkers 2004).Two trials compared different bisphosphonates to one anotherand did not show a significant difference in vertical growth ratesbetween the therapies under investigation, they however did notcompare data to normalized standards and thus no commentarycan be made on their impact on vertical growth (Barros 2012;Zoledronic Acid 2008). No difference in z scores were noted inthe remaining five trials (Bishop 2010; Bishop 2013; Rauch 2009;Senthilnathan 2008; Ward 2010). It is not within the scope ofthis review to distinguish between bisphosphonate responsivenessin different OI types, however it is interesting to note that milderforms of OI showed more improvements in growth and BMD inat least one trial (DiMeglio 2006).It is important to determine whether bisphosphonate adminis-tration translates into functional changes. Bone pain and qualityof life were addressed in several trials. Decreased pain scores anddecreased analgesic use were reported in one trial (Seikaly 2005).The remaining trials which included pain and other quality of lifemeasures found no difference in self-reported pain scores (Bishop2010; Bishop 2013; Chevrel 2006; Letocha 2005; Rauch 2009;Ward 2010; Zoledronic Acid 2008). The exception within thesedata was of increased pain with bisphosphonates at 36 months only(Chevrel 2006). When the authors re-evaluated this difference,
14Bisphosphonate therapy for osteogenesis imperfecta (Review)
Copyright © 2014 The Cochrane Collaboration. Published by John Wiley & Sons, Ltd.

they found it statistically significant in the intention-to-treat anal-ysis, but not in the per protocol analysis. Seikaly found improvedwell-being scores and increases in self-care abilities but no changein mobility (Seikaly 2005). However, Sakkers found no changes inself-care abilities, nor did the authors find changes in strength ormobility when compared to placebo controls (Sakkers 2004). Ad-ditionally, no differences in gross motor abilities or other qualityof life measures were found in several trials (Bishop 2010; Bishop2013 ; Letocha 2005; Rauch 2009; Ward 2010). Chevrel was theonly trial to assess hearing and found no change in Rinne testingwith bisphosphonate therapy (Chevrel 2006). Taken together, thedata presented here do not support consistent improvements inthese quality of life indicators with bisphosphonate administra-tion. Nevertheless, clinicians caring for people affected by OI havethe strong anecdotal impression bisphosphonate treatment resultsin reduction in pain and subsequent increased mobility and func-tionality. These secondary outcomes were assessed by a few trialsin this review, but represent an important need in future research.One may argue fracture rates may not be the only appropriate pri-mary outcome of interest if a population with fragile bones wereto have increased mobility as a result of treatment. It is difficultto quantify general well-being, perhaps a more granular analysisneeds to be developed looking at participation in daily events withless emphasis on pain.Trials including IV and oral bisphosphonate use were includedin this review. Mean bisphosphonate oral bioavailability (alen-dronate) in children is comparable to that found in adult trials,with approximately 50% localizing to bone (Ward 2005). How-ever, individual oral bioavailability of alendronate varies as muchas ten-fold and could contribute to variable responsiveness (Ward2005). It was noted that there was a large individual variance inbioavaliability of zolendronate in children, but there was no ap-parent effect of gender, body weight or creatinine clearance in pa-tients with normal renal function (Zoledronic Acid 2008). Wedid not separately assess different bisphosphonate preparations al-though we have distinguished between oral and IV therapy. Differ-ent preparations and pharmacogenetic variability potentially un-derlie heterogeneous responses in individual participants. Addi-tionally, although we made no attempt to distinguish between OItype and response to bisphosphonate therapy, it is entirely plau-sible different OI types will respond to therapy differently as onetrial suggests (DiMeglio 2004).Although specific data were not extracted, bisphosphonate ther-apy administered for one to three years appears to be safe andwell-tolerated in the adults and children treated here. Adverse ef-fects of bisphosphonates are few and minor in this population(gastrointestinal complaints - often comparable to placebo in thetrials we reviewed, fever, headache, small decreases in lympho-cyte counts) and the drugs are generally well-tolerated (Bishop2013; DiMeglio 2006; Letocha 2005; Rauch 2009; Ward 2005;Senthilnathan 2008; Ward 2010; Zoledronic Acid 2008). Flu-likesymptoms described as “acute phase reactions” were common with
IV administration of bisphosphonates, particularly with the firstinfusion (DiMeglio 2006; Letocha 2005; Zoledronic Acid 2008)but rarely contributed to trial withdrawal. Intravenous access wasdifficult in one trial not included in this review where four of ninechildren less than three years required central line placement forIV bisphosphonate administration (DiMeglio 2004). Intravenousaccess was otherwise not reported to be problematic in childrenor adults. Clinical and laboratory evidence of hypocalcemia wasreported in the zoledronic acid clinical trial which identified 22%of the participants treated with zolderonic acid and 9% of partici-pants treated with pamidronate to have hypocalcemia (ZoledronicAcid 2008). However, clinical or laboratory evidence of hypocal-cemia was not found (Bishop 2013; Seikaly 2005; Ward 2005) norwas evidence or hepatic or renal dysfunction or changes in nephro-calcinosis as measured by ultrasound in patients treated with bis-phosphonates (Barros 2012; Sakkers 2004; Seikaly 2005). Emerg-ing data from clinical trials and observational studies do, how-ever, support a concern for bisphosphonate use and atypical sub-trochanteric femur fractures (Erviti 2013). The optimal method,dose, initiation and duration of therapy remain unclear. However,IV neridronate has been administered to infants with OI as youngas neonates with reported improved growth and lowered fractureincidence (Antoniazzi 2006). A more extensive safety review ofbisphosphonate use in children with low BMD and fragility frac-tures in juvenile idiopathic arthritis has been recently published(Thornton 2006). A rare, but serious side effect of bisphonates isosteonecrosis of the jaw. This presumably occurs from over-sup-pression of bone turnover and occurs more commonly in elderlypatients with cancer taking primarily IV bisphosphonates (Woo2006). To our knowledge, osteonecrosis of the jaw has not beenreported in children or adults with OI.We identified a recent abstract outlining an RCT evaluat-ing subcutaneous teriparatide in adults (http://www.ashg.org/2013meeting/abstracts/fulltext/f130121209.htm). These datashow statistically significant changes in BMD as well as significantchanges in markers of bone metabolism. No comment was madeof fracture incidence but as this data has not yet been published ina peer-review journal, further analysis and discussion of this datawas not undertaken. The use of parathyroid analogues is furthersupported by another recent publication where patients who con-tinued to fracture after bisphosphonate therapy were treated withteriparatide and showed a positive response in biomarkers (Gatti2013). To date, the focus of pharmacological treatment for OI hasbeen on bisphosphonates. Byers reviewed pharmacological agentsused prior to 1991 (Byers 1992).
Quality of the evidence
Nineteen studies were identified and reviewed, 14 of which wererandomised control trials and met the inclusion criteria. These 14trials represent a total of 819 participants. The majority of trialsanalysed were small and not powered to show a statistically sig-
15Bisphosphonate therapy for osteogenesis imperfecta (Review)
Copyright © 2014 The Cochrane Collaboration. Published by John Wiley & Sons, Ltd.

nificant difference in many outcome measures. The primary andsecondary outcome measures were reasonably evenly representedwithin these trials, methodologies varied and direct comparison ofdata was at times not possible. Meta-analysis of the available datawas limited due to the different agents used (oral versus IV bis-phosphonates), different outcome measures, different populations(adults versus children), different reporting indices (z score versust score versus total BMD), and variable inclusion of a placebo orcontrol group. Sufficient commonality existed amongst the statedprimary and secondary outcomes to enable reliable data compar-ison to internal validation of conclusions drawn.
Potential biases in the review process
This version of the review has used the Cochrane risk of biasassessment as described in the Cochrane Handbook for Systematic
Reviews of Interventions 5.1 (Higgins 2011b).As stated above, the meta-analysis was limited due to the variabilityacross the studies and potential biases were acknowledged duringthis analysis and subsequent data extrapolation.
Agreements and disagreements with otherstudies or reviews
One other relevant review has been published (Castillo 2009).The authors reviewed seven studies and concluded that the studiesfavoured an overall improvement in BMD but that fracture re-duction and growth improvement were not universally supported.They additionally concluded that further studies were required toevaluate the broader impact of therapy, including, but not limitedto, deformity, daily function and quality of life.
A U T H O R S ’ C O N C L U S I O N S
Implications for practice
The results from the included trials provide evidence, for statisti-cally significant improvement in BMD in individuals affected withOI when treated with either oral or IV bisphosphonates. It remainsto be seen whether this increase in BMD is a surrogate marker forfracture reduction and clinical functional improvement. At thistime, comparative data remains inconclusive though several trialsreported here individually show improvements in fracture inci-dence. Additionally, the long-term safety of bisphosphonates inOI, particularly when used in children, and the risk of bisphos-phonates to cause atypical femur fractures, impair perioperative orfracture bone healing (or both), as well as increased bone density ifunmonitored, have not been sufficiently evaluated. The durationof use once BMD is improved requires thoughtful study. Effects of
bisphosphonates on growth, bone deformity, mobility, and painhave been reviewed but absolute benefits remain inconclusive,
Implications for research
Despite widespread use, a number of questions concerning bis-phosphonate therapy in children and adults with OI remain unan-swered. In particular whether increases in BMD convincinglytranslate into fracture reduction and functional improvement.
Additionally, the following remain unclear.
• Are bisphosphonates are equally safe and effective inchildren and adults? What are the long-term effects of osteoclastinhibitors like bisphosphonates on the immature growingskeleton? Will they be licensed for use in children (www.fda.gov/cder/foi/esum/2003/20560se1-038BPCA.PDF)?
• Are there differences in the safety or efficacy of IV versusoral bisphosphonates? Are there differences in safety and efficacyof individual bisphosphonates in OI? Does the optimal method,dosage, length of therapy as well as optimal therapeutic windowalso warrant investigation?
• Will the efficacy of bisphosphonates in increasing BMDwill be confirmed in larger studies, and with more heterogeneousparticipants? Does the efficacy of bisphosphonates differ by OIclinical type or mutation type? Are bisphosphonates useful in OItypes which do not increase bone turnover?
• Do bisphosphonates, when used in people with OI, delayor impair fracture healing, or peri-operative bone healing?
Well-designed, adequately-powered, placebo-controlled RCTs as-sessing the longitudinal effects of bisphosphonates on BMD, frac-ture reduction and healing, and changes in quality of life indicatorssuch as function and pain should be studied in both children andadults with OI. These trials should be prospective, longitudinal,double-blinded, using comparable assessments of change includ-ing z scores for BMD and vertical growth, as well as validated as-sessments measuring pain and quality of life outcomes. Quality oflife outcomes should be broadened to other include other factorsimportant to people with OI, such as hearing and dentition andbiochemical markers of bone turnover should be carefully assessedto determine if they are an adequate proxy for dose efficacy andsubject concordance with therapy. Spontaneous versus non-spon-taneous fractures should be investigated in these trials as well asbone healing after fractures and operative intervention with bis-phosphonates.
A C K N O W L E D G E M E N T S
16Bisphosphonate therapy for osteogenesis imperfecta (Review)
Copyright © 2014 The Cochrane Collaboration. Published by John Wiley & Sons, Ltd.

Janet Reeder (JR) was the lead author on the original publishedprotocol and her valuable contributions to this review are gratefullyacknowledged.
Tracey Remmington (TR) was a co-author on a previous versionof the review (Phillipi 2008).
The authors acknowledge the Osteogenesis Imperfecta Founda-tion for providing useful background information and for theirencouragement. We also thank the investigators of specific trials(Adami 2003 and Gatti 2005) for providing unpublished data.
R E F E R E N C E S
References to studies included in this review
Adami 2003 {published and unpublished data}∗ Adami S, Gatti D, Colapietro F, Fracassi E, Braga V,Rossini M, et al.Intravenous neridronate in adults withosteogenesis imperfecta. Journal of Bone and Mineral
Research 2003;18(1):126–30.Gatti D, Viapiana O, Lippolis I, Braga V, Prizzi R, RossiniM, et al.Intravenous bisphosphonate therapy increasesradial width in adults with osteogenesis imperfecta. Journal
of Bone and Mineral Research 2005;20(8):1323–6.
Barros 2012 {published data only}
Barros ER, Saraiva GL, de Oliveira TP, Lazaretti-Castro M.Safety and efficacy of a 1-year treatment with zoledronicacid compared with pamidronate in children withosteogenesis imperfecta. Journal of Pediatric Endocrinology
and Metabolism 2012;25(5-6):485–91.
Bishop 2010 {published data only}
Bishop N, Harrison R, Ahmed F, Shaw N, Eastell R,Campbell M, et al.A randomised controlled dose-rangingstudy of risedronate in children with moderate and severeosteogenesis imperfecta. Journal of Bone and Mineral
Research 2010;25(1):32–40.
Bishop 2013 {published data only}
Bishop N, Adami S, Ahmed SF, Antón J, Arundel P,Burren CP, et al.Risedronate in children with osteogenesisimperfecta:a randomised, double-blind, placebo-controlledtrial. Lancet 2013;382(9902):1424–32.
Chevrel 2006 {published data only}
Chevrel G, Schott AM, Fontanges E, Charrin JE, Lina-Granade G, Duboeuf F, et al.Effects of oral alendronate onBMD in adult patients with osteogenesis imperfecta: a 3-year randomized placebo-controlled trial. Journal of Bone
and Mineral Research 2006;21(2):300–6.
DiMeglio 2006 {published data only}∗ DiMeglio LA, Peacock M. Two-year clinical trial of oralalendronate versus intravenous pamidronate in childrenwith osteogenesis imperfecta. Journal of Bone and Mineral
Research 2006;21(1):132–40.Dimeglio LA, Ford L, McClintock C, Peacock M. Acomparison of oral and intravenous bisphosphonate therapy
for children with osteogenesis imperfecta. Journal of
Pediatric Endocrinology and Metabolism 2005;18(1):43–53.
Gatti 2005 {published and unpublished data}
Gatti D, Antoniazzi F, Prizzi R, Braga V, Rossini M, Tato L,et al.Intravenous neridronate in children with osteogenesisimperfecta: A randomized controlled study. Journal of Bone
and Mineral Research 2005;20(5):758–63.
Letocha 2005 {published data only}
Letocha AD, Cintas HL, Troendle JF, Reynolds JC, CannCE, Chernoff EJ, et al.Controlled trial of pamidronatein children with types III and IV osteogenesis imperfectaconfirms vertebral gains but not short-term functionalimprovement. Journal of Bone and Mineral Research 2005;20(6):977–86.
Rauch 2009 {published data only}
Rauch F, Munns CF, Land C, Cheung M, Glorieux FH.Risedronate in the treatment of mild pediatric osteogenesisimperfecta: a randomized placebo-controlled study. Journal
of Bone and Mineral Research 2009;24(7):1282-9.
Sakkers 2004 {published data only}
Sakkers R, Kok D, Engelbert R, van Dongen A, Jansen M,Pruijs H, et al.Skeletal effects and functional outcome witholpadronate in children with osteogenesis imperfecta: a 2-year randomised placebo-controlled study. Lancet 2004;363
(9419):1427–31. [CRS–ID: 5500100000002556]
Seikaly 2005 {published data only}
Seikaly MG, Kopanati S, Salhab N, Waber P, Patterson D,Browne R, et al.Impact of alendronate on quality of life inchildren with osteogenesis imperfecta. Journal of Pediatric
Orthopaedics 2005;25(6):786–91.
Senthilnathan 2008 {published data only}
Senthilnathan S, Walker E, Bishop NJ. Two doses ofpamidronate in infants with osteogenesis imperfecta.Archives of Disease in Childhood 2008;93(5):398–400.
Ward 2010 {published data only}
Glorieux FH, Rauch F, Ward LM, Smith P, VerbruggenN, Heydon N, et al.Alendronate in the treatment ofpediatric osteogenesis imperfecta [abstract]. Journal of
17Bisphosphonate therapy for osteogenesis imperfecta (Review)
Copyright © 2014 The Cochrane Collaboration. Published by John Wiley & Sons, Ltd.

Bone and Mineral Research 2004;20 Suppl:S12. [CRS–ID:5500100000003043]Ward LM, Rauch F, Whyte MP, D’Astous J, Gates PE,Grogan D, et al.Alendronate for the treatment of pediatricosteogenesis imperfecta: a randomized placebo-controlledstudy. Journal of Clinical Endocrinology and Metabolism
2011;96(2):355–64.
Zoledronic Acid 2008 {unpublished data only}
Food, Drug Administration (FDA). Center for DrugEvaluation and Research. Statistical review andevaluation - clinical studies: Zometa (zoledronicacid) intravenous injection (i.v.) 4 mg lyophilizedpowder. Treatment of children with osteogenesisimperfecta (OI). http://www.fda.gov/downloads/drugs/developmentapprovalprocess/developmentresources/ucm072901.pdf (accessed 07 April 2014).NCT00063479. Bisphosphonate treatment of osteogenesisimperfecta. http://clinicaltrials.gov/show/NCT00063479(accessed 08 March 2013).
References to studies excluded from this review
Antoniazzi 1996 {published data only}
Antoniazzi F, Bertoldo F, Mottes M, Valli M, SirpresiS, Zamboni G, et al.Growth hormone treatment inosteogenesis imperfecta with quantitative defect of type Icollagen synthesis. Journal of Pediatrics 1996;129(3):432–9.
Antoniazzi 2006 {published data only}
Antoniazzi F, Zamboni G, Lauriola S, Donadi L, AdamiS, Tato L. Early bisphosphonate treatment in infants withsevere osteogenesis imperfecta. Journal of Pediatrics 2006;149(2):174–9.
Antoniazzi 2010 {published data only}
Antoniazzi F, Monti E, Venturi G, Franceschi R, Doro F,Gatti D, et al.GH in combination with bisphosphonatetreatment in osteogenesis imperfecta. European Journal of
Endocrinology 2010;163(3):479–87.
DiMeglio 2004 {published data only}
DiMeglio LA, Ford L, McClintock C, Peacock M.Intravenous pamidronate treatment of children under 36months of age with osteogenesis imperfecta. Bone 2004;35
(5):1038–45.
Gerber 1998 {published data only}
Gerber LH, Binder H, Berry R, Siegel KL, Kim H,Weintrob J, et al.Effect of withdrawal of bracing in matchedpairs of children with osteogenesis imperfecta. Archives of
Physical Medicine and Rehabilitation 1998;79(1):46–51.
Granda 1977 {published data only}
Granda JL, Falva KA, Bullough PG. Phyrophosphate levelsand magnesium oxide therapy in osteogenesis imperfecta.Clinical Orthopaedics and Related Research 1977;Jul-Aug
(216):228–31.
Nagamani 2013 {unpublished data only}
NCT00131469. Study of Teriparatide (FORTEO) toTreat Adults With Osteogenesis Imperfecta (OI). http://
clinicaltrials.gov/show/NCT00131469 (accessed 08 March2013). [CRS–ID: 5500100000003940]Nagamani S, Shapiro J, Veith S, Wang Y, Lapidus J, ReederJL, et al.Teriparatide, the first anabolic agent for treatmentof osteogenesis imperfecta improves bone mineral densityat the hip and spine: a randomized, blinded, placebo-controlled trial [abstract]. Proceedings of the 63rd AnnualMeeting of the American Society of Human Genetics; 2013Oct 22-26; Boston. Boston: American Society of HumanGenetics, 2013:27.
Ward 2005 {published data only}
Ward LM, Denker AE, Porras A, Shugarts S, KlineW, Travers R, et al.Single-dose pharmacokinetics andtolerability of alendronate 35- and 70-milligram tablets inchildren and adolescents with osteogenesis imperfecta typeI. Journal of Clinical Endocrinology and Metabolism 2005;90
(7):4051–6.
Additional references
Alanay 2010
Alanay Y, Avaygan H, Camacho N, Utine GE, BodurogluK, Aktas D, et al.Mutations in the gene encoding the RERprotein FKBP65 cause autosomal-recessive osteogenesisimperfecta. American Journal of Human Genetics 2010;86
(4):551–9.
Barnes 2006
Barnes AM, Chang W, Morello R, Cabral WA, Weis MA,Eyre DR, et al.Deficiency of cartilage-associated proteinin recessive lethal osteogenesis imperfecta. New England
Journal of Medicine 2006;355(26):2757–64.
Becker 2011
Becker J, Semler O, Gilissen C, Li Y, Bolz HJ, Giunta C,et al.Exome sequencing identifies truncating mutations inhuman SERPINF1 in autosomal-recessive osteogenesisimperfecta. American Journal of Human Genetics 2011;88
(3):362–71.
Black 1996
Black DM, Cummings SR, Karpf DB, Cauley JA,Thompson DE, Nevitt MC, et al.Randomized trial of effectof alendronate on risk of fracture in women with existingvertebral fractures. Lancet 1996;348(9041):1535–41.
Byers 1991
Byers PH, Wallis GA, Willing MC. Osteogenesis imperfecta:translation of mutation to phenotype. Journal of Medical
Genetics 1991;28(7):433–42.
Byers 1992
Byers PH, Steiner RD. Osteogenesis imperfecta. Annual
Review of Medicine 1992;43:269–82.
Byers 2000
Byers PH. Osteogenesis imperfecta: perspectives andopportunities. Current Opinion in Pediatrics 2000;12(6):603–9.
Byers 2013
Byers 2013 [pers comm]. OI [personal communication].Email to: D Basel 2013.
18Bisphosphonate therapy for osteogenesis imperfecta (Review)
Copyright © 2014 The Cochrane Collaboration. Published by John Wiley & Sons, Ltd.

Cabral 2007
Cabral WA, Chang W, Barnes AM, Weis M, Scott MA,Leikin S, et al.Prolyl 3-hydroxylase 1 deficiency causes arecessive metabolic bone disorder resembling lethal/severeosteogenesis imperfecta. Nature Genetics 2007;39(3):359–65.
Camacho 2001
Camacho NP, Raggio CL, Doty SB, Root L, Zraick V, IlgWA, et al.A controlled study of the effects of alendronatein a growing mouse model of osteogenesis imperfecta.Calcified Tissue International 2001;69(2):94–101.
Castillo 2009
Castillo H, Samson-Fang L, American Academy forCerebral Palsy and Developmental Medicine TreatmentOutcomes Committee Review Panel. Effects ofbisphosphonates in children with osteogenesis imperfecta:an AACPDM systematic review. Developmental Medicine
and Child Neurology 2009;51(1):17–29.
Cho 2012
Cho TJ, Lee KE, Lee SK, Song SJ, Kim KJ, Jeon D, etal.A Single Recurrent Mutation in the 5’-UTR of IFITM5Causes Osteogenesis Imperfecta Type V. American Journal of
Human Genetics 2012;91(2):343–8.
Christiansen 2010
Christiansen HE, Schwarze U, Pyott SM, AlSwaid A, AlBalwi M, Alrasheed S, et al.Homozygosity for a missensemutation in SERPINH1, which encodes the collagenchaperone protein HSP47, results in severe recessiveosteogenesis imperfecta. American Journal of Human
Genetics 2010;86(3):389–98.
Cole 2002
Cole WG. Advances in Osteogenesis Imperfecta. Clinical
Orthopaedics and Related Research 2002;401:6–16.
Connor 1985
Connor JM, Connor RA, Sweet EM, Gibson AA, PatrickWJ, McNay MB, et al.Lethal neonatal chondrodysplasiasin the West of Scotland 1970-1983 with a description of athanatophoric, dysplasialike, autosomal recessive disorder,Glasgow variant. American Journal of Medical Genetics
1985;22(2):243–53.
Elbourne 2002
Elbourne DR, Altman DG, Higgins JP, Curtin F,Worthington HV, Vail A. Meta-analyses involving cross-over trials: methodological issues. International Journal of
Epidemiology 2002;31(1):140–9.
Erviti 2013
Erviti J, Alonso A, Oliva B, Gorricho J, López A,Timoner J, et al.Oral bisphosphonates are associated withincreased risk of subtrochanteric and diaphyseal fracturesin elderly women: a nested case-control study. http://bmjopen.bmj.com/content/3/1/e002091 (accessed 06February 2013).
FDA 2011
Food, Drug Administration (FDA). Background documentfor meeting of Advisory Committee for Reproductive
Health Drugs and Drug Safety and Risk ManagementAdvisory Committee. http://www.fda.gov/downloads/AdvisoryCommittees/CommitteesMeetingMaterials/Drugs/DrugSafetyandRiskManagementAdvisoryCommittee/UCM270958.pdf (accessed 07 March 2013).
Fisher 1999
Fisher JE, Rogers MJ, Halasy JM, Luckman SP, HughesDE, Masarachia PJ, et al.Alendronate mechanism of action:geranylgeraniol, an intermediate in the mevalonate pathway,prevents inhibition of osteoclast formation, bone resorption,and kinase activation in vitro [abstract]. Proceedings of the
National Academy of Sciences of the United States of America
1999;96:133–8.
Gatti 2013
Gatti D, Rossini M, Viapiana O, Povino MR, Liuzza S,Fracassi E, et al.Teriparatide treatment in adult patients withosteogenesis imperfecta type I. Calcified Tissue International
2013;93(5):448–52.
Glorieux 2000
Glorieux FH, Rauch F, Plotkin H, Ward L, Travers R,Roughley P, et al.Type V osteogenesis imperfecta: a newform of brittle bone disease. Journal of Bone and Mineral
Research 2000;15(9):1650–8.
Glorieux 2004
Glorieux FH, Rauch F, Ward LM, Smith P, Verbruggen N,Heyden N, et al.Alendronate in the treatment of pediatricosteogenesis imperfecta [abstract]. Journal of Bone and
Mineral Research 2004;20(Suppl):1043.
Higgins 2003
Higgins JPT, Thompson SG, Deeks JJ, Altman DG.Measuring inconsistency in meta-analyses. BMJ 2003;327
(7414):557–60.
Higgins 2011a
Higgins JPT, Green S (editors). Cochrane Handbook forSystematic Reviews of Interventions Version 5.1.0 [updatedMarch 2011]. The Cochrane Collaboration 2011. Availablefrom www.cochrane-handbook.org.
Higgins 2011b
Higgins JPT, Altman DG (editors). Chapter 8: Assessingrisk of bias in included studies. In: Higgins JPT, GreenS (editors). Cochrane Handbook for Systematic Reviewsof Interventions Version 5.1.0 [updated March 2011].The Cochrane Collaboration, 2011. Available fromwww.cochrane-handbook.org.
Jüni 2001
Jüni T, Altman, DG, Egger M. Systematic reviews in healthcare: Assessing the quality of controlled clinical trials. BMJ
2001;323(7303):42–6.
Kuurila 2002
Kuurila K, Kaitila I, Johansson R, Grenman R. Hearing lossin Finnish adults with osteogenesis imperfecta: a nationwidesurvey. The Annals of Otology, Rhinology, and Laryngology
2002;111(10):939–46.
19Bisphosphonate therapy for osteogenesis imperfecta (Review)
Copyright © 2014 The Cochrane Collaboration. Published by John Wiley & Sons, Ltd.

Lapunzina 2010
Lapunzina P, Aglan M, Temtamy S, Caparros-Martin JA,Valencia M, Leton R, et al.Identification of a frameshiftmutation in Osterix in a patient with recessive osteogenesisimperfecta. American Journal of Human Genetics 2010;87
(1):110–4.
Marini 2003
Marini JC. Do bisphosphonates make children’s bonesbetter or brittle?. New England Journal of Medicine 2003;349(5):423–6.
Martinez-Glez 2012
Martínez-Glez V, Valencia M, Caparrós-Martín JA, AglanM, Temtamy S, Tenorio J, et al.Identification of a mutationcausing deficient BMP1/mTLD proteolytic activity inautosomal recessive osteogenesis imperfecta. Human
Mutation 2012;33(2):343–50.
OIF 2008
Osteogenesis Imperfecta Foundation. Facts aboutOsteogenesis Imperfecta. www.oif.org (accessed August2008).
Orioli 1995
Orioli IM, Castilla EE, Scarano G, Mastroiacovo P. Effectof paternal age in achondroplasia, thanatophoric dysplasia,and osteogenesis imperfecta. American Journal of Medical
Genetics 1995;59(2):209–17.
Pyott 2013
Pyott SM, Tran TT, Leistritz DF, Pepin MG, MendelsohnNJ, Temme RT, et al.WNT1 mutations in families affectedby moderately severe and progressive recessive osteogenesisimperfecta. American Journal of Human Genetics 2013;92
(4):590–7.
Reid 2002
Reid IR, Brown JP, Burckhardt P, Horowitz Z, RichardsonP, Trechsel U, et al.Intravenous zoledronic acid inpostmenopausal women with low bone mineral density.New England Journal of Medicine 2002;346(9):653–61.
Semler 2012
Semler O, Garbes L, Keupp K, Swan D, Zimmermann K,Becker J, et al.A Mutation in the 5’-UTR of IFITM5 Createsan In-Frame Start Codon and Causes Autosomal-DominantOsteogenesis Imperfecta Type V with Hyperplastic Callus.American Journal of Human Genetics 2012;91(2):349–57.
Sillence 1979
Sillence DO, Senn A, Danks DM. Genetic heterogeneity inosteogenesis imperfecta. Journal of Medical Genetics 1979;16(2):101–16.
Sillence 2012
Sillence D. Osteogenesis Imperfecta. Internationalcommittee for constitutional disorders of the skeleton.Sydney, 2012.
Steiner 2013
Steiner RD, Adsit J, Basel D. Gene Reviews;COL1A1/2-Related Osteogenesis Imperfecta. http://www.ncbi.nlm.nih.gov/books/NBK1295/ (Initial Posting:January 28, 2005; Last Update: February 14, 2013).
Thornton 2006
Thornton J, Ashcroft DM, Mughal MZ, Elliott RA, O’NeillTW, Symmons D. Systematic review of effectiveness ofbisphosphonates in treatment of low bone mineral densityand fragility fractures in juvenile idiopathic arthritis.Archives of Disease in Childhood 2006;91(9):753–61.
Van Dijk 2009
van Dijk FS, Nesbitt IM, Zwikstra EH, Nikkels PGJ,Piersma SR, Fratantoni SA, et al.PPIB mutations causesevere osteogenesis imperfecta. American Journal of Human
Genetics 2009;85(4):521–7.
Whyte 2003
Whyte MP, Wenkert D, Clements KL, McAlister WH,Mumm S. Bisphosphonate-induced osteopetrosis. New
England Journal of Medicine 2003;349(5):457–63.
Woo 2006
Woo SB, Hellstein JW, Kalmar JR. Narrative [corrected]review: bisphosphonates and osteonecrosis of the jaws.Annals of Internal Medicine 2006;144(10):753–61.
References to other published versions of this review
Phillipi 2008
Phillipi CA, Remmington T, Steiner RD. Bisphosphonatetherapy for osteogenesis imperfecta. Cochrane Database
of Systematic Reviews 2008, Issue 4. [DOI: 10.1002/14651858.CD005088.pub2]
∗ Indicates the major publication for the study
20Bisphosphonate therapy for osteogenesis imperfecta (Review)
Copyright © 2014 The Cochrane Collaboration. Published by John Wiley & Sons, Ltd.

C H A R A C T E R I S T I C S O F S T U D I E S
Characteristics of included studies [ordered by study ID]
Adami 2003
Methods Single centre, double-blinded, placebo-controlled RCT.Parallel for 1 year then the control group crossed over for an additional year
Participants 46 adults (23 male) were randomised.Mean age (range): 34.9 years (21 to 50 years).Any type of OI.
Interventions IV neridronate versus no treatment.Dosage: 100 mg diluted in 250 ml of saline solution infused intravenously in 30 minevery 3 months.Study period: 24 months.Groups: 31 participants in the neridronate group versus 15 in the control group.After 12 months the control group also received intervention (neridronate)All participants seen at 3-month intervals, but full clinical evaluation including bonedensitometry measurements by DXA and fasting serum and urinary (second morningvoiding) biochemistry was obtained per-protocol every 6 months. Radiographs of thespine (anteroposterior and lateral views) were obtained at baseline and after 12 and 24months
Outcomes Fractures, spine BMD, hip BMD, BSAP, sCTX , ufDPD.
Notes
Risk of bias
Bias Authors’ judgement Support for judgement
Random sequence generation (selectionbias)
Unclear risk Randomised according to type of OI.
Allocation concealment (selection bias) Unclear risk Not stated.
Blinding (performance bias and detectionbias)All outcomes
Low risk Prevalent vertebral fractures were identifiedand graded blindly by a semi quantitativescale
Incomplete outcome data (attrition bias)All outcomes
Low risk 46 of 78 consented participants completedthe study. Per protocol analyses were per-formed; although intention-to-treat analy-ses were planned they were not applied as allparticipants completed the treatment fol-low up - interim analysis
21Bisphosphonate therapy for osteogenesis imperfecta (Review)
Copyright © 2014 The Cochrane Collaboration. Published by John Wiley & Sons, Ltd.

Adami 2003 (Continued)
Selective reporting (reporting bias) Low risk Change in biochemical markers of boneand mineral metabolism is partially re-ported as a graph. Other outcomes men-tioned are reported
Other bias Low risk None.
Barros 2012
Methods Parallel, open-label RCT.
Participants Children and adolescents with a diagnosis of OI (types I, III and IV) with a history ofat least one minimal trauma fracture in the past year and no prior exposure to bisphos-phonatesAge: 1 - 15 years.17 males and 6 females.Exclusion criteria not stated.
Interventions PAM: < 3 years of age (1 mg/kg/day over 2 consecutive days every 3 months); > 3 yearsof age (1 mg/kg/day over 2 consecutive days every 4 months)ZOL: < 3 years of age (0.025 mg/kg/day over 2 consecutive days every 3 months); > 3years of age (0.050 mg/kg/day over 2 consecutive days every 4 months)Treatment period: 1 year.
Outcomes HeightWeightBiochemistryBMD (lumbar spine and total body)BMC
Notes Baseline characteristics differ between the groups.
Risk of bias
Bias Authors’ judgement Support for judgement
Random sequence generation (selectionbias)
Unclear risk Only stated as randomised. Baseline characteristics appearto differ between the groups12 pieces of paper marked with treatment 1 and 12 piecesof paper marked with treatment 2 were put in a closed box.As the patients were seen and agreed to participate, onepaper was drawn from the box to define which treatmentthe patient would receive, because of this, the age could notbe paired
Allocation concealment (selection bias) Unclear risk Not stated.
22Bisphosphonate therapy for osteogenesis imperfecta (Review)
Copyright © 2014 The Cochrane Collaboration. Published by John Wiley & Sons, Ltd.

Barros 2012 (Continued)
Blinding (performance bias and detectionbias)All outcomes
High risk Open label.
Incomplete outcome data (attrition bias)All outcomes
Unclear risk No information given.
Selective reporting (reporting bias) Unclear risk Decreased fracture rate not reported completely, but no in-dication if this is due to the results
Other bias Low risk None.
Bishop 2010
Methods Multi-centre, parallel, double-blinded RCT dose-ranging study of risedronate
Participants 53 children randomised and 48 received treatment0.2 mg/kg/wk = 171 mg/kg/wk = 182 mg/kg/wk = 18Mean age0.2 mg/kg/wk = 10.8 (3.8 - 17) years1 mg/kg/wk = 10.8 (5.2 - 16.5) years2 mg/kg/wk = 11 (5.8 - 17) yearsSex of participants (M/F)0.2 mg/kg/wk = 6/111 mg/kg/wk = 8/102 mg/kg/wk = 4/14OI type (I, III, IV)0.2 mg/kg/wk = 0/4/131 mg/kg/wk = 0/2/162 mg/kg/wk = 1/1/16
Interventions Children were randomised to receive 0.2 mg, 1 mg or 2 mg/kg/week risedronate for 2years, dose prescribed to the nearest 5 mg. Oral doses administered were multiples ofthe same tablet of sizes 2.5, 5, 15, 30 or 35 mg; for instance a child weighing 50 kgrandomised to 2 mg/kg/week would receive 3 x 35 mg i.e. 105 mg
Outcomes Fracture reduction as assessed by skeletal surveyChange in BMDChange in biochemical markers of bone/mineral metabolismGrowthBone pain/functional outcomePediatric evaluation of disability inventory (PEDI)Gros motor function measure (GMFM)Grip strength at study initiation vs 24 months
Notes
23Bisphosphonate therapy for osteogenesis imperfecta (Review)
Copyright © 2014 The Cochrane Collaboration. Published by John Wiley & Sons, Ltd.

Bishop 2010 (Continued)
Risk of bias
Bias Authors’ judgement Support for judgement
Random sequence generation (selectionbias)
Low risk Randomization was by multiple permutedblocks, stratified according to age (up to 10.99 years, or above) allocated by a remotetelephone system
Allocation concealment (selection bias) Low risk Allocation was by a remote telephone sys-tem.
Blinding (performance bias and detectionbias)All outcomes
Low risk Children, their families and medical staffwere blinded to the treatment assignment
Incomplete outcome data (attrition bias)All outcomes
Low risk 5 participants withdrew during the 2-yearperiod of the study and were lost to fol-low up. 1 child did not like the taste of thetablets, 1 developed an inflammatory bowelcondition thought not to be related to themedication, 3 withdrew without giving areason. The 5 children were distributedbetween groups 1/2/2. Consort diagramshown
Selective reporting (reporting bias) High risk Bishop states that there was no differencebetween the groups in pain scores but nodata was presented. For quality of life, datawas not presented separately by treatmentgroup
Other bias Low risk None
Bishop 2013
Methods Parallel, double-blind RCT.
Participants Children and adolescents with a diagnosis of OI (types not stated) with a history of atleast 1 non-traumatic/low-impact fracture and BMD z score of -1.0 or less for total bodyor LS OR a real BMD z score of -2.0 or less regardless of fracture historyPatients were ineligible weighed less than 10kg, had cancer or untreated rickets, had lowvit D or prior treatments which might have affected the results or disease severe enoughthey would have normally been given treatment anyway4 - 15 years71 females72 males
24Bisphosphonate therapy for osteogenesis imperfecta (Review)
Copyright © 2014 The Cochrane Collaboration. Published by John Wiley & Sons, Ltd.

Bishop 2013 (Continued)
Interventions 94 risedronate49 placebo(10 kg - 30 kg) 2.5 mg daily(> 30 kg) 5 mg daily
Outcomes Primary:% change from baseline lumbar spine BMDSecondary:% change from baseline in total body BMD at Month 12% change from baseline in lumbar spine BMC at month 12% change from baseline in total body BMC at month 12Lumbar spine z score - % change from baseline to month 12Total body z score - % change from baseline to month 12% change from baseline in lumbar spine bone area at month 12% change from baseline in total body bone area month 12New morphometric vertebral fracture at month 12Categorization by number of new morphometric vertebral fracture at month 12Probability of fracture in 12 monthsNumber of clinical fractures, month 12Serum BAP - % change from baseline to month 12Urine NTX/Cr - % change from baseline at month 12Wong-Baker FACES Pain Rating Scale - change from baseline to month 12Bone Age (years), change from baseline to month 12Annualized growth velocity - change from baseline to month 12
Notes
Risk of bias
Bias Authors’ judgement Support for judgement
Random sequence generation (selectionbias)
Low risk Randomized in a 2:1 ratio by a telephone based interactivevoice response system
Allocation concealment (selection bias) Low risk Telephone based interactive voice response system
Blinding (performance bias and detectionbias)All outcomes
Low risk The study treatment was masked from patients, investi-gators, and trial centre personnel during the first year
Incomplete outcome data (attrition bias)All outcomes
Low risk 7 participants discontinued in the intervention arm andreasons were provided. An ITT analysis was undertaken
Selective reporting (reporting bias) Low risk All outcomes are reported.
Other bias Low risk None
25Bisphosphonate therapy for osteogenesis imperfecta (Review)
Copyright © 2014 The Cochrane Collaboration. Published by John Wiley & Sons, Ltd.

Chevrel 2006
Methods Single-centre, double-blinded, placebo-controlled RCT.Parallel trial.
Participants 64 adults (39 males) were randomised.Age range: > 20 years (treatment: mean (SD) 37 (12); placebo mean (SD) 36 (12).All types of OI.
Interventions Oral alendronate vs placebo.Dosage: 10 mg.Study period: 36 months.Participants seen at baseline and during the 3 years of the study: every year in Lyon withintermediary visits at months 6, 18, and 30 by their local physician. BMD of the lumbarspine and of both hips (total femur) was measured at baseline and at 12, 24, and 36months. Radiographs of the spine (anteroposterior and lateral views) were obtained atbaseline and 36 months. Overall pain score was evaluated at baseline and every 6 monthsduring 3 years with a visual analog scale score (0 - 10). Each participant underwentaudiometry and impedancometry at baseline and at 36 months
Outcomes Dietary calcium intake, spine BMD, hip BMD, spine radiographs, fractures, pain score,audiometry, impedancometry, serum and urine samples for biochemical markers of boneturnover, transiliac bone biopsies
Notes Allocation intervention - adequate. Computer-generated list.Not adequately powered for fracture outcome.
Risk of bias
Bias Authors’ judgement Support for judgement
Random sequence generation (selectionbias)
Low risk Computer-generated list was drawn up bythe pharmacy department
Allocation concealment (selection bias) Low risk Allocation was concealed by giving the ran-domised list to the researchers who thenassigned each new trial subject the subse-quent number on the list
Blinding (performance bias and detectionbias)All outcomes
Low risk Double-blinded (study personnel and par-ticipants)
Incomplete outcome data (attrition bias)All outcomes
Low risk An intention-to-treat analyses were per-formed. BMD follow-up was complete for62 randomised patients, including the 3 inthe alendronate group and 1 in the placebogroup who withdrew from the study forpersonal reasons without drug related ad-verse effects
26Bisphosphonate therapy for osteogenesis imperfecta (Review)
Copyright © 2014 The Cochrane Collaboration. Published by John Wiley & Sons, Ltd.

Chevrel 2006 (Continued)
Selective reporting (reporting bias) Low risk Outcomes are reported.
Other bias Unclear risk Not adequately powered for fracture out-come.
DiMeglio 2006
Methods Single centre, unblinded RCT.Parallel trial.
Participants 18 children (7 males) were randomised.Mean age: 8.7 years. Oral arm mean: 9 years (range 3.8 - 12.7 years); IV arm mean: 8.4years (3 - 13.7 years).OI types I, III, IV included.
Interventions IV pamidronate disodium 1 mg/kg/day every 4 months compared to oral alendronate 1mg/kg daily.Pamidronate diluted in 250 or 500 ml of normal saline given by slow infusion over 4hours. Alendronate was given as 1 or 2 10 mg tablets, rounded to the nearest 10 mg dosefor weight.Study period: 24 months.BMD, BMC, and area at the spine (L2-L4) and total body were measured every 4 monthsby DXA
Outcomes BMC, BMD, posteroanterior radiographs of left hand and wrist, radiographs of suspectedfractures, blood and urine samples
Notes Allocation of intervention - adequate. Computer random number generator
Risk of bias
Bias Authors’ judgement Support for judgement
Random sequence generation (selectionbias)
Low risk A statistician created a randomisationschedule with a computer random num-ber generator using a block-randomisationscheme. Participants were stratified accord-ing to clinical severity of OI, pubertal stage,and bone age
Allocation concealment (selection bias) Low risk Random number sequences were con-cealed until the principal investigator as-signed a group according to the stratifica-tion scheme. A nurse then consulted therandomisation schedule and determinedwhether the patient would receive oral orIV treatment
27Bisphosphonate therapy for osteogenesis imperfecta (Review)
Copyright © 2014 The Cochrane Collaboration. Published by John Wiley & Sons, Ltd.

DiMeglio 2006 (Continued)
Blinding (performance bias and detectionbias)All outcomes
High risk Open label.
Incomplete outcome data (attrition bias)All outcomes
Unclear risk The type of analysis performed is not statedfor the DiMeglio trial, although changes ingroup assignment were made when partici-pants had difficulty tolerating the assignedregimen. One child on oral alendronatewas lost to follow up after 8 months and istherefore not included in this analysis
Selective reporting (reporting bias) High risk Height was partially reported as graphswith groups combined as there was nostatistically significant difference betweengroups. Bone pain was also not reported al-though not stated as measured
Other bias Low risk None.
Gatti 2005
Methods Single centre, unblinded, RCT. No placebo control.Parallel trial.
Participants 64 children 6 - 11 years were assigned to neridronate for 3 years (n = 44) or received notreatment for one year then received neridronate for two years (n = 22).All OI types included.
Interventions Neridronate (2 mg/kg every 3 months) compared to no treatment.Study period: 36 months. After 12 months, the control group also received treatment(neridronate)All participants were seen at 3-monthly intervals, but full clinical evaluation, includ-ing bone densitometry measurements by DXA and fasting serum and urinary (secondmorning voiding) biochemistry, was obtained per-protocol every 6 months before theinfusion of neridronate
Outcomes BMD and height/projected area of spine and total hip, fractures, markers of bone turnover
Notes Allocation of intervention - unclear.
Risk of bias
Bias Authors’ judgement Support for judgement
Random sequence generation (selectionbias)
Unclear risk Participants were assigned according to OItype to either an active or control groupwith a ratio 2:1
28Bisphosphonate therapy for osteogenesis imperfecta (Review)
Copyright © 2014 The Cochrane Collaboration. Published by John Wiley & Sons, Ltd.

Gatti 2005 (Continued)
Allocation concealment (selection bias) Unclear risk Not stated.
Blinding (performance bias and detectionbias)All outcomes
Unclear risk Not stated.
Incomplete outcome data (attrition bias)All outcomes
Low risk Intention-to-treat analyses were plannedbut not applied as all participants com-pleted the treatment follow-up
Selective reporting (reporting bias) Low risk Graphs only presented for change in bio-chemical markers of bone and mineralmetabolism
Other bias Low risk None.
Letocha 2005
Methods Single centre, non blinded, RCT. No placebo control.Parallel trial.
Participants 18 children were randomised.Age range: 4 - 13 years.OI type III and IV included.
Interventions IV pamidronate versus control.Dosage: 10 mg/m2/day for 3 days every 3 months.Study period: 12 months initially, then 7 participants in the treatment group were givenan additional 6 - 21 months of IV pamidronate.Note: 4 children in each group were receiving recombinant growth hormone (rGH) (0.06 mg/kg/day for 6 days/week)All participants were seen quarterly at the National Institutes of Health Clinical Center.Serum markers of bone formation and growth parameters were measured at each visit.Antero-posterior (AP) and lateral radiographs of the spine and lower extremity longbones and DXA at vertebrae L1-L4 were obtained at baseline and every 6 months. QCTscans of the spine were performed at the National Institutes of Health Clinical Centerat 0 and 12 months
Outcomes L1 - L4 DXA, spine QCT, spine radiographs, musculoskeletal and functional testing
Notes Allocation of intervention - adequate. “Randomly-generated numbers”
Risk of bias
Bias Authors’ judgement Support for judgement
Random sequence generation (selectionbias)
Low risk Randomly-generated numbers.
29Bisphosphonate therapy for osteogenesis imperfecta (Review)
Copyright © 2014 The Cochrane Collaboration. Published by John Wiley & Sons, Ltd.

Letocha 2005 (Continued)
Allocation concealment (selection bias) Unclear risk Not stated.
Blinding (performance bias and detectionbias)All outcomes
Unclear risk Trial was stated as non-blind but duringmeasurements,the investigator was blinded to patientidentifiers,the order of the films, and whether theycame from thetreatment or control groups.
Incomplete outcome data (attrition bias)All outcomes
Unclear risk a per protocol and repeated-measuresmodel was used. It is not clear if all ran-domised participants completed the study
Selective reporting (reporting bias) High risk Reported no significant change in bio-chemical markers of bone and mineralmetabolism
Other bias Low risk None.
Rauch 2009
Methods Single centre, placebo-controlled RCT.Parallel trial.
Participants Risedronate: 13Placebo: 13Mean age (SD): 11.9 (4) years placebo, 11.7 (3.6) years risedronate15 male, 11 femaleOI types I
Interventions Risedronate (or placebo)15 mg once per week if < 40 kg30 mg once per week if > 40 kg
Outcomes Every 3 months for bone pain, grip force, blood and urine tests and anthropometricmeasurementsEvery 12 months for bone age, radiographs of spine, BMD by DXABaseline and 24 months for radiographs of long bones (or whenever a fracture sustained)Bone biopsy at 24 months
Notes
Risk of bias
Bias Authors’ judgement Support for judgement
30Bisphosphonate therapy for osteogenesis imperfecta (Review)
Copyright © 2014 The Cochrane Collaboration. Published by John Wiley & Sons, Ltd.

Rauch 2009 (Continued)
Random sequence generation (selectionbias)
Unclear risk “Patients were randomised in equal num-ber to receive either risedronate or placebo.Both risedronate and placebo pills wereprovided by the manufacturer.”
Allocation concealment (selection bias) Unclear risk Not stated.
Blinding (performance bias and detectionbias)All outcomes
Unclear risk Not stated.
Incomplete outcome data (attrition bias)All outcomes
Low risk Risedronate: 2 withdrew (lack of effect, re-fused to take pills)Placebo: 1 withdrew (lack of effect).
Selective reporting (reporting bias) High risk Bone age stated as measured but not re-ported and grip strength was reported asnot significant. Authors have been con-tacted for data
Other bias Low risk None.
Sakkers 2004
Methods Single centre, double-blinded, placebo-controlled RCT.Parallel trial.
Participants 34 children (16 male) were randomised.Age range: 3 - 18 years.OI types I, III and IV.
Interventions Oral olpadronate versus placebo.Dosage: 10 mg/m2 daily.Study period: 24 months.
Outcomes Fractures, spinal BMC, spinal BMD, calcaneal BMC, calcaneal BMD, muscle strength,self care, mobility, height (body and seated), arm span, head circumference, body weight,heights of each lumbar vertebral body, urinary analysis, blood samples (but only 9 fromeach group).Adverse effects reported.BMC and BMD of the lumbar spine (L1 - L4) and of the os calcis were measured beforerandomisation, after 1 year, and at the end of the study. Domains of functional outcomewere measured at the beginning of the study and every 6 months, and anthropometricand radiographic variables were measured every 12 months. All laboratory assessmentswere done at baseline and at 3 months, 12 months, and 24 months
Notes Allocation of intervention by computer-generated randomisation
31Bisphosphonate therapy for osteogenesis imperfecta (Review)
Copyright © 2014 The Cochrane Collaboration. Published by John Wiley & Sons, Ltd.

Sakkers 2004 (Continued)
Risk of bias
Bias Authors’ judgement Support for judgement
Random sequence generation (selectionbias)
Low risk Computer-generated randomisation.
Allocation concealment (selection bias) Low risk Researchers were not aware of treatment al-location. Generation of the randomisationsequence was done independently of theresearchers by an outside group. For eachpatient the Julius Centre was contacted bytelephone for treatment allocation
Blinding (performance bias and detectionbias)All outcomes
Low risk Double blinded (outcome assessors blind).
Incomplete outcome data (attrition bias)All outcomes
Low risk An intention-to-treat analysis was under-taken. 2 participants (1 placebo and 1 treat-ment) withdrew from the trial but were ac-counted for in the final analysis. Consortdiagram presented
Selective reporting (reporting bias) High risk Reported no significant change in bio-chemical markers of bone and mineralmetabolism and narratively reported nodifferences in seated height or radiographicassessments of lumbar vertebral heightbetween olpadronate and placebo at 24months follow up
Other bias Low risk None.
Seikaly 2005
Methods Single centre, double-blinded, placebo-controlled RCT.Cross-over trial.
Participants 20 children (11 males) were randomised. 17 completed.Age range: 3 - 15 years. Mean (SD) 9.8 (1.06) years; median 10.53 years.OI types: I, III, IV.
Interventions Oral alendronate versus placebo.Dosage: 5 mg/d (participants who weighed < 30 kg); or 10 mg/d (participants whoweighed > 30 kg).Study period: 24 months (12 months each study period).Participants were evaluated at baseline, every 3 months thereafter (except when otherwise
32Bisphosphonate therapy for osteogenesis imperfecta (Review)
Copyright © 2014 The Cochrane Collaboration. Published by John Wiley & Sons, Ltd.

Seikaly 2005 (Continued)
indicated), and at the conclusion of the study
Outcomes Physical evaluation, food records, blood and urine analysis, stool guaiac, DEXA, renalultrasound, skeletal survey
Notes Allocation of intervention - adequate. Computer-generated randomisation
Risk of bias
Bias Authors’ judgement Support for judgement
Random sequence generation (selectionbias)
Low risk Computer-generated randomisation bypharmacist.
Allocation concealment (selection bias) Low risk Allocation was concealed by a pharmacistat the institution.
Blinding (performance bias and detectionbias)All outcomes
Low risk Double-blinded.
Incomplete outcome data (attrition bias)All outcomes
Unclear risk Unclear whether intention-to-treat analy-ses were performed introducing potentialattrition bias
Selective reporting (reporting bias) Low risk Outcomes reported.
Other bias Low risk None.
Senthilnathan 2008
Methods Single-centre, parallel, double blinded, RCT.
Participants 12 randomised, 6 in each group.Number who received treatment and were analysedLow dose = 6High dose = 4Infants with OI who had long bone fractures with consequent deformity at birth orwithin the first 3 months of life, and/or multiple crush fractured vertebrae7 males and 5 females under one year of age.
Interventions 6 or 12 mg/kg/year of pamidronate by IV infusion.
Outcomes Change in BMD as assessed by DEXA,Change in biochemical markers of bone and mineral metabolism (e.g., bone alkalinephosphatase measurements), growth
Notes
33Bisphosphonate therapy for osteogenesis imperfecta (Review)
Copyright © 2014 The Cochrane Collaboration. Published by John Wiley & Sons, Ltd.

Senthilnathan 2008 (Continued)
Risk of bias
Bias Authors’ judgement Support for judgement
Random sequence generation (selectionbias)
Unclear risk Randomised.
Allocation concealment (selection bias) Unclear risk Not stated.
Blinding (performance bias and detectionbias)All outcomes
Unclear risk Carers and participants blinded and out-come assessors.
Incomplete outcome data (attrition bias)All outcomes
Low risk One infant died from pneumonia 3 weeksafter receiving the first infusion and one in-fant was withdrawn due to non attendancefor scheduled infusions. Both were in the12 mg/kg group (high dose)
Selective reporting (reporting bias) Low risk Outcomes reported.
Other bias Unclear risk Problems with accrual.
Ward 2010
Methods Multicentre, parallel, double-blinded placebo-controlled RCT
Participants 139 randomised4 - 19 years (ALN 11.0 (3.6) years; placebo 11.1 (4.0) years78 males61 femalesChildren and adolescents with a diagnosis of OI types III or IV or a diagnosis of ORtype I associated with 1 or more of the following: chronic pain; more than 3 fractures(including vertebrae) per year with minimal trauma for the previous 2 years; or limbdeformity requiring surgery
Interventions ALN or placebo for 24 months(< 40 kg) 5 mg daily(> 40 kg) 10 mg dailyPlacebo = 30ALN = 109Analysed: ALN = 83; placebo = 26
Outcomes Fracture reductionChange in BMD as assessed by DEXAChange in biochemical markers of bone and mineral metabolismGrowthBone pain
34Bisphosphonate therapy for osteogenesis imperfecta (Review)
Copyright © 2014 The Cochrane Collaboration. Published by John Wiley & Sons, Ltd.

Ward 2010 (Continued)
PEDI scoreGrip strength
Notes
Risk of bias
Bias Authors’ judgement Support for judgement
Random sequence generation (selectionbias)
Unclear risk Randomized in a 3:1 ratio and stratifiedaccording to their weight at baseline
Allocation concealment (selection bias) Unclear risk Not stated.
Blinding (performance bias and detectionbias)All outcomes
Low risk double blind. outcome assessors blind.
Incomplete outcome data (attrition bias)All outcomes
Low risk Total = 30, ALN = 26, Placebo = 4. Rea-sons given per group in figure 1 - consortdiagram. Modified ITT
Selective reporting (reporting bias) Low risk Outcomes reported.
Other bias Low risk None.
Zoledronic Acid 2008
Methods Randomized (Phase II), open-label, active control, parallel assignment, safety/efficacytrial9 clinic sites: UCLA (Los Angeles, USA); Alfred I. DuPont Hospital for Children(Delaware, USA); Intermountain Orthopedics (Idaho, USA); St Jude Children’s Re-search Hospital (Illinois, USA); Children’s Hospital (Nebraska, USA); Children’s Hos-pital Medical Center (Ohio, USA); Oregon Health & Science University (Portland,USA); Vanderbilt University Medical Center (Tennessee, USA); Texas Chilren’s Hospital(Texas, USA)
Participants Children 1 to 17 years of ageN = 155 randomised but baseline data collected on 150.Mean (SD) age: zoledronic acid = 8.6 (4.25); pamidronate = 8.5 (4.20)Zoledronic acid: female n = 36, male n = 38.Pamidronate: female n = 31, male n = 45.Inclusion criteria (included, but not limited to):• Children age 1 to 17• OI type III or IV or• OI type I with ≥ 3 minimal trauma fractures (including vertebral fractures) in the 2previous years or with a history of limb deformity requiring surgery• Serum 25 hydroxy vitamin D ≥ 15 ng/mL
35Bisphosphonate therapy for osteogenesis imperfecta (Review)
Copyright © 2014 The Cochrane Collaboration. Published by John Wiley & Sons, Ltd.

Zoledronic Acid 2008 (Continued)
Exclusion criteria (included but not limited to)• Renal disease: defined as a serum creatinine value above the upper limit of normal (ageand sex-matched) or pathologic proteinuria (any patient with a urine protein to creatinineratio of > 0.3 is to be excluded) or history of prior clinically significant renal disease(e.g. nephritis or nephrotic syndrome). One repeat assessment of the urine protein tocreatinine was allowed. The assessment was made within 2 weeks of the first assessmentand the sample was a urine collection of a first morning void, after an overnight fast• Any disease or abnormality that would prevent accurate BMD measurements of thelumbar spine (i.e. intra-abdominal calcification that may prohibit accurate data collec-tion/interpretation; severe scoliosis, kyphosis, or metal implants, etc.)• Any clinically significant clinical laboratory abnormalities at screening• History or evidence of an intestinal malabsorption syndrome
Interventions Zoledronic acid patients ≥ 1 to < 3 years of age were to be administered 0.025 mg/kgas a 30 to 45-minute IV infusion every 3 months for one year. Patients ≥3 years to ≤
17 years of age were to be administered 0.05 mg/kg as a 30-minute IV infusion every 3months for one yearPamidronate patients were to be administered 4-hour IV infusions of the trial drug.Patients ≥1 year to < 2 years of age were to be administered 0.5 mg/kg/day on each ofthree consecutive days every 2 months for one year. Patients ≥2 years to < 3 years ofage were to be administered 0.75 mg/kg/day on each of three consecutive days every 3months for one year. Patients ≥ 3 years to ≤ 17 years of age were to be administered 1mg/kg/day on each of three consecutive days every 3 months for one yearZA = 74; P = 76.
Outcomes Primary outcome measure: change in lumbar spine BMD at month 12 relative to baselineSecondary outcome measure: change in z score of the lumbar spine at month 12 relativeto baseline
Notes Multicenter trial. USA.Financial assistance: Novartis.
Risk of bias
Bias Authors’ judgement Support for judgement
Random sequence generation (selectionbias)
Unclear risk Randomised in a 1:1 ratio.
Allocation concealment (selection bias) Unclear risk Not stated.
Blinding (performance bias and detectionbias)All outcomes
Low risk Because of the difference in dosing be-tween the active controlled infusions it wasnot possible to blind the patients or treat-ing physicians to the trial drugs. However,the radiologists responsible for assessingthe primary endpoints (e.g. change frombaseline in LS BMD at 12 months) wereblinded to treatment assignments
36Bisphosphonate therapy for osteogenesis imperfecta (Review)
Copyright © 2014 The Cochrane Collaboration. Published by John Wiley & Sons, Ltd.

Zoledronic Acid 2008 (Continued)
Incomplete outcome data (attrition bias)All outcomes
Low risk 155 were randomised and the intent-to-treat population included 63 patients in thezoledronic acid group and 68 patients inthe pamidronate group. Patients who didnot have a baseline measurement or werelost to follow up without any post-base-line measurement were excluded from theanalyses. Missing values were imputed us-ing the last post-baseline observation car-ried forward (LOCF). Reasons for patientswho dropped out were described
Selective reporting (reporting bias) Unclear risk No protocol available. Data analysed andpresented in different ways. Graphs pre-sented for some outcomes
Other bias Low risk None.
ALN: alendronateBMC: bone mineral contentBMD: bone mineral densityBSAP: bone-specific alkaline phosphataseDEXA, DXA: dual-energy x-ray absorptiometryIV: intravenousNTx: N-linked telopeptidesOI: osteogenesis imperfectaPAM: pamidronateQCT:quantitative computer-assisted tomographyRCT: randomised controlled trialsCTX: serum cross-lapsSD: standard deviationufDPD: urinary free-deoxy pyridinolinevs: versusZOL: zoledronic acid
Characteristics of excluded studies [ordered by study ID]
Study Reason for exclusion
Antoniazzi 1996 Not a randomised controlled trial.
Antoniazzi 2006 Not a randomised controlled trial.
Antoniazzi 2010 Investigated response to growth hormone rather than bisphosphonates
37Bisphosphonate therapy for osteogenesis imperfecta (Review)
Copyright © 2014 The Cochrane Collaboration. Published by John Wiley & Sons, Ltd.

(Continued)
DiMeglio 2004 Not a randomised controlled trial.
Gerber 1998 Not a bisphosphonate therapy - leg braces.
Granda 1977 Evaluated pyrophosphate levels in OI disease severity not improved in bone density or fracture reduction
Nagamani 2013 Patients were randomised to teriparatide 20 mcg sub-q or placebo and this is not a bisphosphonate
Ward 2005 Not a randomised controlled trial. An open label, oral bioavailability study. Does not address the outcomes ofinterest
mcg: microgramOI: osteogenesis imperfectasub-q: subcutaneously
38Bisphosphonate therapy for osteogenesis imperfecta (Review)
Copyright © 2014 The Cochrane Collaboration. Published by John Wiley & Sons, Ltd.

D A T A A N D A N A L Y S E S
Comparison 1. Oral bisphosphonates versus placebo
Outcome or subgroup titleNo. of
studies
No. of
participants Statistical method Effect size
1 Fracture risk reduction 2 Hazard ratio (Fixed, 95% CI) Totals not selected1.1 1 year follow up 1 Hazard ratio (Fixed, 95% CI) 0.0 [0.0, 0.0]1.2 2 year follow up 1 Hazard ratio (Fixed, 95% CI) 0.0 [0.0, 0.0]
2 Rate of fractures 1 Relative rate (Fixed, 95% CI) Totals not selected2.1 2 year follow up 1 Relative rate (Fixed, 95% CI) 0.0 [0.0, 0.0]
3 Number of people with at leastone fracture
3 Risk Ratio (M-H, Fixed, 95% CI) Subtotals only
3.1 24 months 2 150 Risk Ratio (M-H, Fixed, 95% CI) 1.05 [0.82, 1.35]3.2 36 months 1 64 Risk Ratio (M-H, Fixed, 95% CI) 0.97 [0.48, 1.95]
4 Mean change (z score) in spineBMD (DEXA)
4 Mean Difference (IV, Fixed, 95% CI) Subtotals only
4.1 At 6 months 1 131 Mean Difference (IV, Fixed, 95% CI) 0.39 [0.28, 0.50]4.2 At 12 months 2 168 Mean Difference (IV, Fixed, 95% CI) 0.51 [0.35, 0.68]4.3 At 24 months 2 138 Mean Difference (IV, Fixed, 95% CI) 0.99 [0.70, 1.28]
5 Mean % change in spine BMD(DEXA)
3 Mean Difference (IV, Random, 95% CI) Subtotals only
5.1 12 months 1 64 Mean Difference (IV, Random, 95% CI) 7.0 [3.87, 10.13]5.2 24 months 3 202 Mean Difference (IV, Random, 95% CI) 17.31 [5.01, 29.62]5.3 36 months 1 64 Mean Difference (IV, Random, 95% CI) 9.4 [5.44, 13.36]
6 Mean % change in total femurBMD (DEXA)
1 Mean Difference (IV, Fixed, 95% CI) Totals not selected
6.1 At 36 months 1 Mean Difference (IV, Fixed, 95% CI) 0.0 [0.0, 0.0]7 Change in height 4 Mean Difference (IV, Fixed, 95% CI) Subtotals only
7.1 At 12 month (z score) 2 171 Mean Difference (IV, Fixed, 95% CI) 0.24 [0.04, 0.43]7.2 At 24 months (z score) 2 149 Mean Difference (IV, Fixed, 95% CI) 0.08 [-0.19, 0.35]
8 Change in bone pain scores 3 Mean Difference (IV, Fixed, 95% CI) Totals not selected8.1 At 12 months 1 Mean Difference (IV, Fixed, 95% CI) 0.0 [0.0, 0.0]8.2 At 24 months 1 Mean Difference (IV, Fixed, 95% CI) 0.0 [0.0, 0.0]8.3 At 36 months 1 Mean Difference (IV, Fixed, 95% CI) 0.0 [0.0, 0.0]
9 Change in analgesic use (daysper week)
1 Mean Difference (IV, Fixed, 95% CI) Totals not selected
10 Change in well-being score 1 Mean Difference (IV, Fixed, 95% CI) Totals not selected11 Change in self-care score
(PEDI)2 Mean Difference (IV, Fixed, 95% CI) Totals not selected
11.1 At 12 months 1 Mean Difference (IV, Fixed, 95% CI) 0.0 [0.0, 0.0]11.2 At 24 months 1 Mean Difference (IV, Fixed, 95% CI) 0.0 [0.0, 0.0]
12 Change in total mobility score(WeeFIM)
2 Mean Difference (IV, Fixed, 95% CI) Totals not selected
12.1 At 12 months 1 Mean Difference (IV, Fixed, 95% CI) 0.0 [0.0, 0.0]12.2 At 24 months 1 Mean Difference (IV, Fixed, 95% CI) 0.0 [0.0, 0.0]
13 Hearing (assessed by % rinnie) 1 Mean Difference (IV, Fixed, 95% CI) Totals not selected
39Bisphosphonate therapy for osteogenesis imperfecta (Review)
Copyright © 2014 The Cochrane Collaboration. Published by John Wiley & Sons, Ltd.

Comparison 2. IV bisphosphonates versus placebo or no treatment
Outcome or subgroup titleNo. of
studies
No. of
participants Statistical method Effect size
1 Number of participants with atleast one fracture
2 Risk Ratio (M-H, Fixed, 95% CI) Subtotals only
1.1 At 1 year 2 110 Risk Ratio (M-H, Fixed, 95% CI) 0.56 [0.30, 1.06]2 Incidence of lower extremity
fractures1 Mean Difference (IV, Fixed, 95% CI) Totals not selected
2.1 At 12 months 1 Mean Difference (IV, Fixed, 95% CI) 0.0 [0.0, 0.0]3 Incidence of upper extremity
fractures1 Mean Difference (IV, Fixed, 95% CI) Totals not selected
3.1 At 12 months 1 Mean Difference (IV, Fixed, 95% CI) 0.0 [0.0, 0.0]
4 Mean % change (from baseline)in spine BMD (DEXA)
2 Mean Difference (IV, Random, 95% CI) Subtotals only
4.1 At 6 months 2 125 Mean Difference (IV, Random, 95% CI) 9.96 [-2.51, 22.43]4.2 At 12 months 2 125 Mean Difference (IV, Random, 95% CI) 14.68 [-6.08, 35.45]
5 Mean % change (z score) inspine BMD (DEXA)
1 Mean Difference (IV, Fixed, 95% CI) Totals not selected
5.1 At 6 months 1 Mean Difference (IV, Fixed, 95% CI) 0.0 [0.0, 0.0]5.2 At 12 months 1 Mean Difference (IV, Fixed, 95% CI) 0.0 [0.0, 0.0]
6 Mean % change in total hipBMD (DEXA)
2 Mean Difference (IV, Random, 95% CI) Subtotals only
6.1 06 months 2 108 Mean Difference (IV, Random, 95% CI) 6.16 [-3.57, 15.90]6.2 12 months 2 108 Mean Difference (IV, Random, 95% CI) 11.27 [-3.69, 26.22]
7 Change in vertical growth(cm/year)
1 Mean Difference (IV, Fixed, 95% CI) Totals not selected
7.1 At 12 months 1 Mean Difference (IV, Fixed, 95% CI) 0.0 [0.0, 0.0]8 Bone pain scores 1 Mean Difference (IV, Fixed, 95% CI) Totals not selected
8.1 At 12 months 1 Mean Difference (IV, Fixed, 95% CI) 0.0 [0.0, 0.0]9 Muscle strength 1 Mean Difference (IV, Fixed, 95% CI) Totals not selected
9.1 At 12 months 1 Mean Difference (IV, Fixed, 95% CI) 0.0 [0.0, 0.0]10 BAMF (10-point gross motor
assessment)1 Mean Difference (IV, Fixed, 95% CI) Totals not selected
10.1 At 12 months 1 Mean Difference (IV, Fixed, 95% CI) 0.0 [0.0, 0.0]
Comparison 3. Oral versus IV bisphosphonates
Outcome or subgroup titleNo. of
studies
No. of
participants Statistical method Effect size
1 Annualised fracture rates 1 Mean Difference (IV, Fixed, 95% CI) Totals not selected2 Spine BMD z scores 1 Mean Difference (IV, Fixed, 95% CI) Totals not selected
2.1 At 12 months 1 Mean Difference (IV, Fixed, 95% CI) 0.0 [0.0, 0.0]2.2 At 24 months 1 Mean Difference (IV, Fixed, 95% CI) 0.0 [0.0, 0.0]
3 Change in alkaline phosphonate(IU/liter)
1 Mean Difference (IV, Fixed, 95% CI) Totals not selected
40Bisphosphonate therapy for osteogenesis imperfecta (Review)
Copyright © 2014 The Cochrane Collaboration. Published by John Wiley & Sons, Ltd.

3.1 At 4 months 1 Mean Difference (IV, Fixed, 95% CI) 0.0 [0.0, 0.0]3.2 At 12 months 1 Mean Difference (IV, Fixed, 95% CI) 0.0 [0.0, 0.0]
4 Change in bone alkalinephosphatase (IU/liter)
1 Mean Difference (IV, Fixed, 95% CI) Totals not selected
4.1 At 4 months 1 Mean Difference (IV, Fixed, 95% CI) 0.0 [0.0, 0.0]4.2 At 12 months 1 Mean Difference (IV, Fixed, 95% CI) 0.0 [0.0, 0.0]
5 Change in NTX/Cr(nMBCE/mM)
1 Mean Difference (IV, Fixed, 95% CI) Totals not selected
5.1 At 4 months 1 Mean Difference (IV, Fixed, 95% CI) 0.0 [0.0, 0.0]5.2 At 12 months 1 Mean Difference (IV, Fixed, 95% CI) 0.0 [0.0, 0.0]
Comparison 4. Different doses of oral or IV bisphosphonates
Outcome or subgroup titleNo. of
studies
No. of
participants Statistical method Effect size
1 Number of crush-fracturedvertebrae
1 Rate Ratio (Fixed, 95% CI) Totals not selected
1.1 IV 6 mg/kg versus 12mg/kg
1 Rate Ratio (Fixed, 95% CI) 0.0 [0.0, 0.0]
2 Number of fractures suffered byparticipant
1 Rate Ratio (Fixed, 95% CI) Totals not selected
2.1 Oral 0.2 v 1 1 Rate Ratio (Fixed, 95% CI) 0.0 [0.0, 0.0]2.2 Oral 0.2 v 1 1 Rate Ratio (Fixed, 95% CI) 0.0 [0.0, 0.0]2.3 Oral 1 v 2 1 Rate Ratio (Fixed, 95% CI) 0.0 [0.0, 0.0]
3 Lumbar spine bone mineraldensity
1 Mean Difference (IV, Fixed, 95% CI) Totals not selected
3.1 IV 12 mg/kg versus 6mg/kg at 12 months
1 Mean Difference (IV, Fixed, 95% CI) 0.0 [0.0, 0.0]
4 Lumbar spine z score BMD 1 Mean Difference (IV, Fixed, 95% CI) Totals not selected4.1 Oral 0.2 v 1 1 Mean Difference (IV, Fixed, 95% CI) 0.0 [0.0, 0.0]4.2 Oral 0.2 v 2 1 Mean Difference (IV, Fixed, 95% CI) 0.0 [0.0, 0.0]4.3 Oral1 v 2 1 Mean Difference (IV, Fixed, 95% CI) 0.0 [0.0, 0.0]
5 Length z score 1 Mean Difference (IV, Fixed, 95% CI) Totals not selected
5.1 IV 12 mg/kg versus 6mg/kg at 12 months
1 Mean Difference (IV, Fixed, 95% CI) 0.0 [0.0, 0.0]
6 Height z score at 2 years 1 Mean Difference (IV, Fixed, 95% CI) Totals not selected6.1 Oral 0.2 v 1 1 Mean Difference (IV, Fixed, 95% CI) 0.0 [0.0, 0.0]6.2 Oral 0.2 v 2 1 Mean Difference (IV, Fixed, 95% CI) 0.0 [0.0, 0.0]6.3 Oral 1 v 2 1 Mean Difference (IV, Fixed, 95% CI) 0.0 [0.0, 0.0]
41Bisphosphonate therapy for osteogenesis imperfecta (Review)
Copyright © 2014 The Cochrane Collaboration. Published by John Wiley & Sons, Ltd.
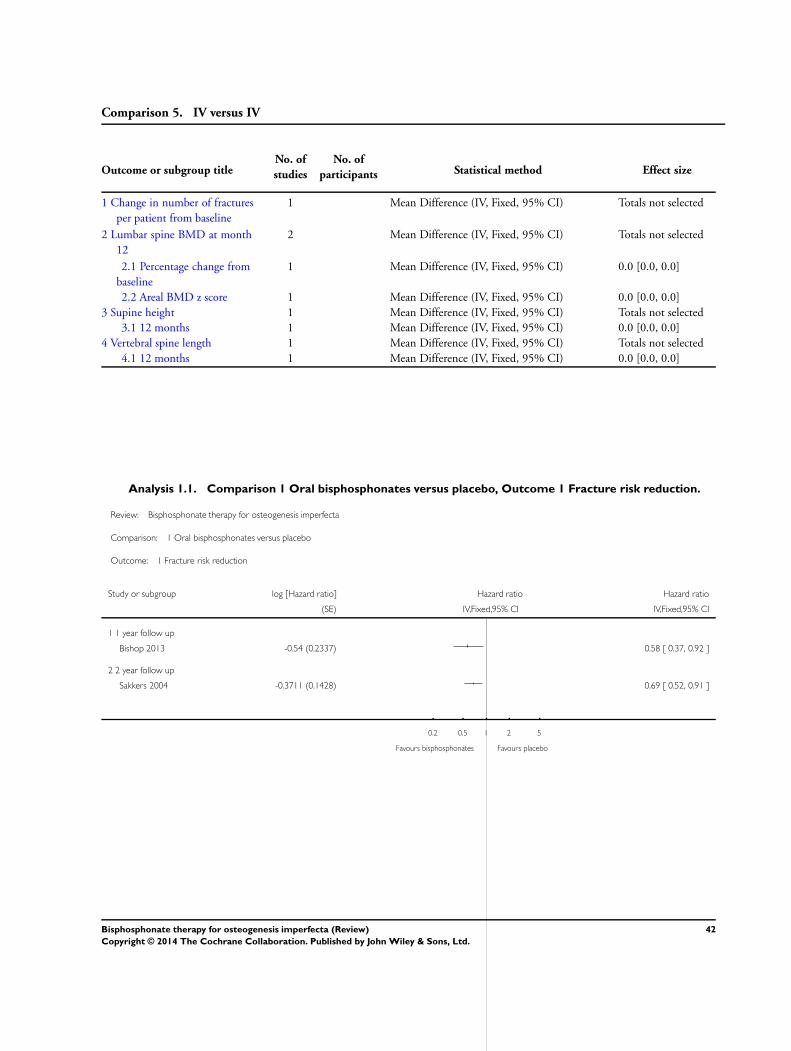
Comparison 5. IV versus IV
Outcome or subgroup titleNo. of
studies
No. of
participants Statistical method Effect size
1 Change in number of fracturesper patient from baseline
1 Mean Difference (IV, Fixed, 95% CI) Totals not selected
2 Lumbar spine BMD at month12
2 Mean Difference (IV, Fixed, 95% CI) Totals not selected
2.1 Percentage change frombaseline
1 Mean Difference (IV, Fixed, 95% CI) 0.0 [0.0, 0.0]
2.2 Areal BMD z score 1 Mean Difference (IV, Fixed, 95% CI) 0.0 [0.0, 0.0]3 Supine height 1 Mean Difference (IV, Fixed, 95% CI) Totals not selected
3.1 12 months 1 Mean Difference (IV, Fixed, 95% CI) 0.0 [0.0, 0.0]4 Vertebral spine length 1 Mean Difference (IV, Fixed, 95% CI) Totals not selected
4.1 12 months 1 Mean Difference (IV, Fixed, 95% CI) 0.0 [0.0, 0.0]
Analysis 1.1. Comparison 1 Oral bisphosphonates versus placebo, Outcome 1 Fracture risk reduction.
Review: Bisphosphonate therapy for osteogenesis imperfecta
Comparison: 1 Oral bisphosphonates versus placebo
Outcome: 1 Fracture risk reduction
Study or subgroup log [Hazard ratio] Hazard ratio Hazard ratio
(SE) IV,Fixed,95% CI IV,Fixed,95% CI
1 1 year follow up
Bishop 2013 -0.54 (0.2337) 0.58 [ 0.37, 0.92 ]
2 2 year follow up
Sakkers 2004 -0.3711 (0.1428) 0.69 [ 0.52, 0.91 ]
0.2 0.5 1 2 5
Favours bisphosphonates Favours placebo
42Bisphosphonate therapy for osteogenesis imperfecta (Review)
Copyright © 2014 The Cochrane Collaboration. Published by John Wiley & Sons, Ltd.

Analysis 1.2. Comparison 1 Oral bisphosphonates versus placebo, Outcome 2 Rate of fractures.
Review: Bisphosphonate therapy for osteogenesis imperfecta
Comparison: 1 Oral bisphosphonates versus placebo
Outcome: 2 Rate of fractures
Study or subgroup log [Relative rate] Relative rate Relative rate
(SE) IV,Fixed,95% CI IV,Fixed,95% CI
1 2 year follow up
Sakkers 2004 -0.9039 (0.2749) 0.40 [ 0.24, 0.69 ]
0.2 0.5 1 2 5
Favours bisphosphonates Favours placebo
Analysis 1.3. Comparison 1 Oral bisphosphonates versus placebo, Outcome 3 Number of people with at
least one fracture.
Review: Bisphosphonate therapy for osteogenesis imperfecta
Comparison: 1 Oral bisphosphonates versus placebo
Outcome: 3 Number of people with at least one fracture
Study or subgroup Bisphosphonates Placebo Risk Ratio Weight Risk Ratio
n/N n/N M-H,Fixed,95% CI M-H,Fixed,95% CI
1 24 months
Rauch 2009 7/13 6/13 15.7 % 1.17 [ 0.54, 2.53 ]
Ward 2010 71/95 21/29 84.3 % 1.03 [ 0.80, 1.33 ]
Subtotal (95% CI) 108 42 100.0 % 1.05 [ 0.82, 1.35 ]
Total events: 78 (Bisphosphonates), 27 (Placebo)
Heterogeneity: Chi2 = 0.09, df = 1 (P = 0.76); I2 =0.0%
Test for overall effect: Z = 0.41 (P = 0.68)
2 36 months
Chevrel 2006 10/31 11/33 100.0 % 0.97 [ 0.48, 1.95 ]
Subtotal (95% CI) 31 33 100.0 % 0.97 [ 0.48, 1.95 ]
Total events: 10 (Bisphosphonates), 11 (Placebo)
Heterogeneity: not applicable
Test for overall effect: Z = 0.09 (P = 0.93)
0.2 0.5 1 2 5
Favours bisphosphonates Favours placebo
43Bisphosphonate therapy for osteogenesis imperfecta (Review)
Copyright © 2014 The Cochrane Collaboration. Published by John Wiley & Sons, Ltd.

Analysis 1.4. Comparison 1 Oral bisphosphonates versus placebo, Outcome 4 Mean change (z score) in
spine BMD (DEXA).
Review: Bisphosphonate therapy for osteogenesis imperfecta
Comparison: 1 Oral bisphosphonates versus placebo
Outcome: 4 Mean change (z score) in spine BMD (DEXA)
Study or subgroup Bisphosphonates PlaceboMean
Difference WeightMean
Difference
N Mean(SD) N Mean(SD) IV,Fixed,95% CI IV,Fixed,95% CI
1 At 6 months
Bishop 2013 84 0.48 (0.45) 47 0.09 (0.22) 100.0 % 0.39 [ 0.28, 0.50 ]
Subtotal (95% CI) 84 47 100.0 % 0.39 [ 0.28, 0.50 ]
Heterogeneity: not applicable
Test for overall effect: Z = 6.65 (P < 0.00001)
2 At 12 months
Bishop 2013 82 0.43 (0.49) 46 -0.01 (0.49) 87.3 % 0.44 [ 0.26, 0.61 ]
Seikaly 2005 20 0.89 (0.85) 20 -0.12 (0.63) 12.7 % 1.01 [ 0.55, 1.47 ]
Subtotal (95% CI) 102 66 100.0 % 0.51 [ 0.35, 0.68 ]
Heterogeneity: Chi2 = 5.10, df = 1 (P = 0.02); I2 =80%
Test for overall effect: Z = 6.06 (P < 0.00001)
3 At 24 months
Rauch 2009 13 0.65 (0.65) 13 -0.15 (0.39) 50.4 % 0.80 [ 0.39, 1.21 ]
Ward 2010 86 1.32 (1.14) 26 0.14 (0.88) 49.6 % 1.18 [ 0.76, 1.60 ]
Subtotal (95% CI) 99 39 100.0 % 0.99 [ 0.70, 1.28 ]
Heterogeneity: Chi2 = 1.62, df = 1 (P = 0.20); I2 =38%
Test for overall effect: Z = 6.62 (P < 0.00001)
-2 -1 0 1 2
Favours placebo Favours bisphosphonates
44Bisphosphonate therapy for osteogenesis imperfecta (Review)
Copyright © 2014 The Cochrane Collaboration. Published by John Wiley & Sons, Ltd.

Analysis 1.5. Comparison 1 Oral bisphosphonates versus placebo, Outcome 5 Mean % change in spine BMD
(DEXA).
Review: Bisphosphonate therapy for osteogenesis imperfecta
Comparison: 1 Oral bisphosphonates versus placebo
Outcome: 5 Mean % change in spine BMD (DEXA)
Study or subgroup Bisphosphonates PlaceboMean
Difference WeightMean
Difference
N Mean(SD) N Mean(SD) IV,Random,95% CI IV,Random,95% CI
1 12 months
Chevrel 2006 31 7.5 (8) 33 0.5 (4) 100.0 % 7.00 [ 3.87, 10.13 ]
Subtotal (95% CI) 31 33 100.0 % 7.00 [ 3.87, 10.13 ]
Heterogeneity: not applicable
Test for overall effect: Z = 4.38 (P = 0.000012)
2 24 months
Chevrel 2006 31 9 (8.5) 33 0.2 (6) 45.6 % 8.80 [ 5.17, 12.43 ]
Rauch 2009 13 23.8 (15.4) 13 6.8 (10.6) 35.9 % 17.00 [ 6.84, 27.16 ]
Ward 2010 86 50.7 (60.09) 26 11.9 (47.61) 18.6 % 38.80 [ 16.52, 61.08 ]
Subtotal (95% CI) 130 72 100.0 % 17.31 [ 5.01, 29.62 ]
Heterogeneity: Tau2 = 83.07; Chi2 = 8.61, df = 2 (P = 0.01); I2 =77%
Test for overall effect: Z = 2.76 (P = 0.0058)
3 36 months
Chevrel 2006 31 10.1 (9.8) 33 0.7 (5.7) 100.0 % 9.40 [ 5.44, 13.36 ]
Subtotal (95% CI) 31 33 100.0 % 9.40 [ 5.44, 13.36 ]
Heterogeneity: not applicable
Test for overall effect: Z = 4.65 (P < 0.00001)
-50 -25 0 25 50
Favours placebo Favours bisphosphonates
45Bisphosphonate therapy for osteogenesis imperfecta (Review)
Copyright © 2014 The Cochrane Collaboration. Published by John Wiley & Sons, Ltd.

Analysis 1.6. Comparison 1 Oral bisphosphonates versus placebo, Outcome 6 Mean % change in total femur
BMD (DEXA).
Review: Bisphosphonate therapy for osteogenesis imperfecta
Comparison: 1 Oral bisphosphonates versus placebo
Outcome: 6 Mean % change in total femur BMD (DEXA)
Study or subgroup Bisphosphonates PlaceboMean
DifferenceMean
Difference
N Mean(SD) N Mean(SD) IV,Fixed,95% CI IV,Fixed,95% CI
1 At 36 months
Chevrel 2006 31 3.3 (0.5) 33 0.3 (0.6) 3.00 [ 2.73, 3.27 ]
-4 -2 0 2 4
Favours placebo Favours bisphosphonates
Analysis 1.7. Comparison 1 Oral bisphosphonates versus placebo, Outcome 7 Change in height.
Review: Bisphosphonate therapy for osteogenesis imperfecta
Comparison: 1 Oral bisphosphonates versus placebo
Outcome: 7 Change in height
Study or subgroup Bisphosphonates PlaceboMean
Difference WeightMean
Difference
N Mean(SD) N Mean(SD) IV,Fixed,95% CI IV,Fixed,95% CI
1 At 12 month (z score)
Bishop 2013 84 0.1 (0.91) 47 -0.08 (0.31) 82.5 % 0.18 [ -0.03, 0.39 ]
Seikaly 2005 20 0.41 (0.94) 20 -0.09 (0.49) 17.5 % 0.50 [ 0.04, 0.96 ]
Subtotal (95% CI) 104 67 100.0 % 0.24 [ 0.04, 0.43 ]
Heterogeneity: Chi2 = 1.50, df = 1 (P = 0.22); I2 =34%
Test for overall effect: Z = 2.38 (P = 0.017)
2 At 24 months (z score)
Rauch 2009 13 0.13 (0.52) 13 -0.04 (0.28) 71.2 % 0.17 [ -0.15, 0.49 ]
Ward 2010 98 -0.3 (1.3385) 25 -0.17 (1.0969) 28.8 % -0.13 [ -0.64, 0.38 ]
Subtotal (95% CI) 111 38 100.0 % 0.08 [ -0.19, 0.35 ]
Heterogeneity: Chi2 = 0.97, df = 1 (P = 0.33); I2 =0.0%
Test for overall effect: Z = 0.61 (P = 0.54)
-1 -0.5 0 0.5 1
Favours placebo Favours bisphosphonates
46Bisphosphonate therapy for osteogenesis imperfecta (Review)
Copyright © 2014 The Cochrane Collaboration. Published by John Wiley & Sons, Ltd.

Analysis 1.8. Comparison 1 Oral bisphosphonates versus placebo, Outcome 8 Change in bone pain scores.
Review: Bisphosphonate therapy for osteogenesis imperfecta
Comparison: 1 Oral bisphosphonates versus placebo
Outcome: 8 Change in bone pain scores
Study or subgroup Bisphosphonates PlaceboMean
DifferenceMean
Difference
N Mean(SD) N Mean(SD) IV,Fixed,95% CI IV,Fixed,95% CI
1 At 12 months
Seikaly 2005 20 -3.13 (2.82) 20 0.5 (2.1) -3.63 [ -5.17, -2.09 ]
2 At 24 months
Ward 2010 100 -0.88 (3.2908) 30 -0.15 (5.0255) -0.73 [ -2.64, 1.18 ]
3 At 36 months
Chevrel 2006 31 1.3 (2.6) 33 0 (2.1) 1.30 [ 0.14, 2.46 ]
-4 -2 0 2 4
Favours bisphosphonates Favours placebo
47Bisphosphonate therapy for osteogenesis imperfecta (Review)
Copyright © 2014 The Cochrane Collaboration. Published by John Wiley & Sons, Ltd.

Analysis 1.9. Comparison 1 Oral bisphosphonates versus placebo, Outcome 9 Change in analgesic use (days
per week).
Review: Bisphosphonate therapy for osteogenesis imperfecta
Comparison: 1 Oral bisphosphonates versus placebo
Outcome: 9 Change in analgesic use (days per week)
Study or subgroup Bisphosphonates PlaceboMean
DifferenceMean
Difference
N Mean(SD) N Mean(SD) IV,Fixed,95% CI IV,Fixed,95% CI
Seikaly 2005 20 -1.44 (2.91) 20 0.56 (2.1) -2.00 [ -3.57, -0.43 ]
-4 -2 0 2 4
Favours bisphosphonates Favours placebo
Analysis 1.10. Comparison 1 Oral bisphosphonates versus placebo, Outcome 10 Change in well-being score.
Review: Bisphosphonate therapy for osteogenesis imperfecta
Comparison: 1 Oral bisphosphonates versus placebo
Outcome: 10 Change in well-being score
Study or subgroup Bisphosphonates PlaceboMean
DifferenceMean
Difference
N Mean(SD) N Mean(SD) IV,Fixed,95% CI IV,Fixed,95% CI
Seikaly 2005 20 3.25 (1.83) 20 0.06 (1.12) 3.19 [ 2.25, 4.13 ]
-4 -2 0 2 4
Favours placebo Favours bisphosphonates
48Bisphosphonate therapy for osteogenesis imperfecta (Review)
Copyright © 2014 The Cochrane Collaboration. Published by John Wiley & Sons, Ltd.

Analysis 1.11. Comparison 1 Oral bisphosphonates versus placebo, Outcome 11 Change in self-care score
(PEDI).
Review: Bisphosphonate therapy for osteogenesis imperfecta
Comparison: 1 Oral bisphosphonates versus placebo
Outcome: 11 Change in self-care score (PEDI)
Study or subgroup Bisphosphonates PlaceboMean
DifferenceMean
Difference
N Mean(SD) N Mean(SD) IV,Fixed,95% CI IV,Fixed,95% CI
1 At 12 months
Seikaly 2005 20 3.82 (2.28) 20 0.24 (5.28) 3.58 [ 1.06, 6.10 ]
2 At 24 months
Ward 2010 94 5.05 (9.0523) 28 3.04 (7.4783) 2.01 [ -1.31, 5.33 ]
-4 -2 0 2 4
Favours placebo Favours bisphosphonates
Analysis 1.12. Comparison 1 Oral bisphosphonates versus placebo, Outcome 12 Change in total mobility
score (WeeFIM).
Review: Bisphosphonate therapy for osteogenesis imperfecta
Comparison: 1 Oral bisphosphonates versus placebo
Outcome: 12 Change in total mobility score (WeeFIM)
Study or subgroup Bisphosphonates PlaceboMean
DifferenceMean
Difference
N Mean(SD) N Mean(SD) IV,Fixed,95% CI IV,Fixed,95% CI
1 At 12 months
Seikaly 2005 20 3 (8.23) 20 2.21 (4.47) 0.79 [ -3.31, 4.89 ]
2 At 24 months
Ward 2010 94 6.46 (16.5217) 28 4.96 (13.6067) 1.50 [ -4.55, 7.55 ]
-10 -5 0 5 10
Favours placebo Favours bisphosphonates
49Bisphosphonate therapy for osteogenesis imperfecta (Review)
Copyright © 2014 The Cochrane Collaboration. Published by John Wiley & Sons, Ltd.
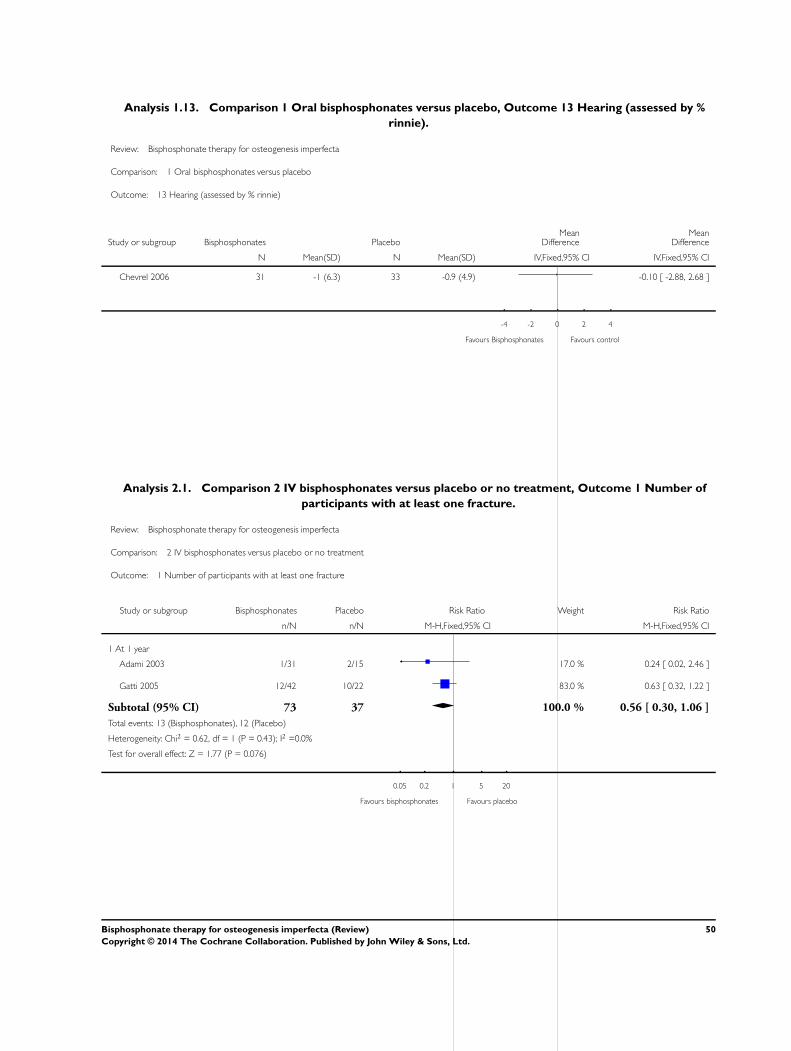
Analysis 1.13. Comparison 1 Oral bisphosphonates versus placebo, Outcome 13 Hearing (assessed by %
rinnie).
Review: Bisphosphonate therapy for osteogenesis imperfecta
Comparison: 1 Oral bisphosphonates versus placebo
Outcome: 13 Hearing (assessed by % rinnie)
Study or subgroup Bisphosphonates PlaceboMean
DifferenceMean
Difference
N Mean(SD) N Mean(SD) IV,Fixed,95% CI IV,Fixed,95% CI
Chevrel 2006 31 -1 (6.3) 33 -0.9 (4.9) -0.10 [ -2.88, 2.68 ]
-4 -2 0 2 4
Favours Bisphosphonates Favours control
Analysis 2.1. Comparison 2 IV bisphosphonates versus placebo or no treatment, Outcome 1 Number of
participants with at least one fracture.
Review: Bisphosphonate therapy for osteogenesis imperfecta
Comparison: 2 IV bisphosphonates versus placebo or no treatment
Outcome: 1 Number of participants with at least one fracture
Study or subgroup Bisphosphonates Placebo Risk Ratio Weight Risk Ratio
n/N n/N M-H,Fixed,95% CI M-H,Fixed,95% CI
1 At 1 year
Adami 2003 1/31 2/15 17.0 % 0.24 [ 0.02, 2.46 ]
Gatti 2005 12/42 10/22 83.0 % 0.63 [ 0.32, 1.22 ]
Subtotal (95% CI) 73 37 100.0 % 0.56 [ 0.30, 1.06 ]
Total events: 13 (Bisphosphonates), 12 (Placebo)
Heterogeneity: Chi2 = 0.62, df = 1 (P = 0.43); I2 =0.0%
Test for overall effect: Z = 1.77 (P = 0.076)
0.05 0.2 1 5 20
Favours bisphosphonates Favours placebo
50Bisphosphonate therapy for osteogenesis imperfecta (Review)
Copyright © 2014 The Cochrane Collaboration. Published by John Wiley & Sons, Ltd.

Analysis 2.2. Comparison 2 IV bisphosphonates versus placebo or no treatment, Outcome 2 Incidence of
lower extremity fractures.
Review: Bisphosphonate therapy for osteogenesis imperfecta
Comparison: 2 IV bisphosphonates versus placebo or no treatment
Outcome: 2 Incidence of lower extremity fractures
Study or subgroup Bisphosphonates ControlMean
DifferenceMean
Difference
N Mean(SD) N Mean(SD) IV,Fixed,95% CI IV,Fixed,95% CI
1 At 12 months
Letocha 2005 9 0.67 (0.87) 9 0.78 (0.97) -0.11 [ -0.96, 0.74 ]
-2 -1 0 1 2
Favours bisphosphonates Favours control
Analysis 2.3. Comparison 2 IV bisphosphonates versus placebo or no treatment, Outcome 3 Incidence of
upper extremity fractures.
Review: Bisphosphonate therapy for osteogenesis imperfecta
Comparison: 2 IV bisphosphonates versus placebo or no treatment
Outcome: 3 Incidence of upper extremity fractures
Study or subgroup Bisphosphonates ControlMean
DifferenceMean
Difference
N Mean(SD) N Mean(SD) IV,Fixed,95% CI IV,Fixed,95% CI
1 At 12 months
Letocha 2005 9 0.22 (0.44) 9 0.44 (0.53) -0.22 [ -0.67, 0.23 ]
-2 -1 0 1 2
Favours bisphosphonates Favours control
51Bisphosphonate therapy for osteogenesis imperfecta (Review)
Copyright © 2014 The Cochrane Collaboration. Published by John Wiley & Sons, Ltd.

Analysis 2.4. Comparison 2 IV bisphosphonates versus placebo or no treatment, Outcome 4 Mean %
change (from baseline) in spine BMD (DEXA).
Review: Bisphosphonate therapy for osteogenesis imperfecta
Comparison: 2 IV bisphosphonates versus placebo or no treatment
Outcome: 4 Mean % change (from baseline) in spine BMD (DEXA)
Study or subgroup Bisphosphonates ControlMean
Difference WeightMean
Difference
N Mean(SD) N Mean(SD) IV,Random,95% CI IV,Random,95% CI
1 At 6 months
Adami 2003 46 3 (6.4) 15 -0.8 (9.1) 51.6 % 3.80 [ -1.16, 8.76 ]
Gatti 2005 42 18.03 (12.44) 22 1.5 (13.14) 48.4 % 16.53 [ 9.87, 23.19 ]
Subtotal (95% CI) 88 37 100.0 % 9.96 [ -2.51, 22.43 ]
Heterogeneity: Tau2 = 72.05; Chi2 = 9.03, df = 1 (P = 0.003); I2 =89%
Test for overall effect: Z = 1.57 (P = 0.12)
2 At 12 months
Adami 2003 46 3.6 (5.4) 15 -0.8 (7.7) 51.5 % 4.40 [ 0.20, 8.60 ]
Gatti 2005 42 29 (18.54) 22 3.4 (14.73) 48.5 % 25.60 [ 17.27, 33.93 ]
Subtotal (95% CI) 88 37 100.0 % 14.68 [ -6.08, 35.45 ]
Heterogeneity: Tau2 = 213.40; Chi2 = 19.86, df = 1 (P<0.00001); I2 =95%
Test for overall effect: Z = 1.39 (P = 0.17)
-20 -10 0 10 20
Favours control Favours bisphosphonates
52Bisphosphonate therapy for osteogenesis imperfecta (Review)
Copyright © 2014 The Cochrane Collaboration. Published by John Wiley & Sons, Ltd.

Analysis 2.5. Comparison 2 IV bisphosphonates versus placebo or no treatment, Outcome 5 Mean %
change (z score) in spine BMD (DEXA).
Review: Bisphosphonate therapy for osteogenesis imperfecta
Comparison: 2 IV bisphosphonates versus placebo or no treatment
Outcome: 5 Mean % change (z score) in spine BMD (DEXA)
Study or subgroup Bisphosphonates ControlMean
DifferenceMean
Difference
N Mean(SD) N Mean(SD) IV,Fixed,95% CI IV,Fixed,95% CI
1 At 6 months
Letocha 2005 8 18.67 (20.86) 9 -2.92 (9.76) 21.59 [ 5.79, 37.39 ]
2 At 12 months
Letocha 2005 9 28.12 (17.11) 9 2.52 (13.2) 25.60 [ 11.48, 39.72 ]
-50 -25 0 25 50
Favours control Favours bisphosphonates
53Bisphosphonate therapy for osteogenesis imperfecta (Review)
Copyright © 2014 The Cochrane Collaboration. Published by John Wiley & Sons, Ltd.

Analysis 2.6. Comparison 2 IV bisphosphonates versus placebo or no treatment, Outcome 6 Mean %
change in total hip BMD (DEXA).
Review: Bisphosphonate therapy for osteogenesis imperfecta
Comparison: 2 IV bisphosphonates versus placebo or no treatment
Outcome: 6 Mean % change in total hip BMD (DEXA)
Study or subgroup Bisphosphonates ControlMean
Difference WeightMean
Difference
N Mean(SD) N Mean(SD) IV,Random,95% CI IV,Random,95% CI
1 06 months
Adami 2003 29 1.2 (3.5) 15 -0.2 (4.1) 52.1 % 1.40 [ -1.03, 3.83 ]
Gatti 2005 42 13.24 (8.8) 22 1.9 (9.12) 47.9 % 11.34 [ 6.69, 15.99 ]
Subtotal (95% CI) 71 37 100.0 % 6.16 [ -3.57, 15.90 ]
Heterogeneity: Tau2 = 45.82; Chi2 = 13.78, df = 1 (P = 0.00020); I2 =93%
Test for overall effect: Z = 1.24 (P = 0.21)
2 12 months
Adami 2003 29 3.5 (3.9) 15 -0.5 (5.2) 52.5 % 4.00 [ 1.01, 6.99 ]
Gatti 2005 42 24.98 (17.2) 22 5.7 (12.18) 47.5 % 19.28 [ 12.00, 26.56 ]
Subtotal (95% CI) 71 37 100.0 % 11.27 [ -3.69, 26.22 ]
Heterogeneity: Tau2 = 108.68; Chi2 = 14.49, df = 1 (P = 0.00014); I2 =93%
Test for overall effect: Z = 1.48 (P = 0.14)
-20 -10 0 10 20
Favours control Favours bisphosphonates
54Bisphosphonate therapy for osteogenesis imperfecta (Review)
Copyright © 2014 The Cochrane Collaboration. Published by John Wiley & Sons, Ltd.

Analysis 2.7. Comparison 2 IV bisphosphonates versus placebo or no treatment, Outcome 7 Change in
vertical growth (cm/year).
Review: Bisphosphonate therapy for osteogenesis imperfecta
Comparison: 2 IV bisphosphonates versus placebo or no treatment
Outcome: 7 Change in vertical growth (cm/year)
Study or subgroup Bisphosphonates ControlMean
DifferenceMean
Difference
N Mean(SD) N Mean(SD) IV,Fixed,95% CI IV,Fixed,95% CI
1 At 12 months
Letocha 2005 9 4.44 (2) 9 3.37 (4.66) 1.07 [ -2.24, 4.38 ]
-4 -2 0 2 4
Favours control Favours bisphosphonates
Analysis 2.8. Comparison 2 IV bisphosphonates versus placebo or no treatment, Outcome 8 Bone pain
scores.
Review: Bisphosphonate therapy for osteogenesis imperfecta
Comparison: 2 IV bisphosphonates versus placebo or no treatment
Outcome: 8 Bone pain scores
Study or subgroup Bisphosphonates ControlMean
DifferenceMean
Difference
N Mean(SD) N Mean(SD) IV,Fixed,95% CI IV,Fixed,95% CI
1 At 12 months
Letocha 2005 9 3.44 (0.82) 9 3.55 (0.73) -0.11 [ -0.83, 0.61 ]
-2 -1 0 1 2
Favours bisphosphonates Favours control
55Bisphosphonate therapy for osteogenesis imperfecta (Review)
Copyright © 2014 The Cochrane Collaboration. Published by John Wiley & Sons, Ltd.

Analysis 2.9. Comparison 2 IV bisphosphonates versus placebo or no treatment, Outcome 9 Muscle
strength.
Review: Bisphosphonate therapy for osteogenesis imperfecta
Comparison: 2 IV bisphosphonates versus placebo or no treatment
Outcome: 9 Muscle strength
Study or subgroup Bisphosphonates ControlMean
DifferenceMean
Difference
N Mean(SD) N Mean(SD) IV,Fixed,95% CI IV,Fixed,95% CI
1 At 12 months
Letocha 2005 9 71.42 (19.48) 9 74.6 (14.3) -3.18 [ -18.97, 12.61 ]
-20 -10 0 10 20
Favours control Favours bisphosphonates
Analysis 2.10. Comparison 2 IV bisphosphonates versus placebo or no treatment, Outcome 10 BAMF (10-
point gross motor assessment).
Review: Bisphosphonate therapy for osteogenesis imperfecta
Comparison: 2 IV bisphosphonates versus placebo or no treatment
Outcome: 10 BAMF (10-point gross motor assessment)
Study or subgroup Bisphosphonates ControlMean
DifferenceMean
Difference
N Mean(SD) N Mean(SD) IV,Fixed,95% CI IV,Fixed,95% CI
1 At 12 months
Letocha 2005 9 6.22 (2.11) 9 7.02 (1.31) -0.80 [ -2.42, 0.82 ]
-4 -2 0 2 4
Favours control Favours bisphosphonates
56Bisphosphonate therapy for osteogenesis imperfecta (Review)
Copyright © 2014 The Cochrane Collaboration. Published by John Wiley & Sons, Ltd.

Analysis 3.1. Comparison 3 Oral versus IV bisphosphonates, Outcome 1 Annualised fracture rates.
Review: Bisphosphonate therapy for osteogenesis imperfecta
Comparison: 3 Oral versus IV bisphosphonates
Outcome: 1 Annualised fracture rates
Study or subgroup Oral IntravenousMean
DifferenceMean
Difference
N Mean(SD) N Mean(SD) IV,Fixed,95% CI IV,Fixed,95% CI
DiMeglio 2006 9 1.4 (1.5) 9 0.9 (0.9) 0.50 [ -0.64, 1.64 ]
-4 -2 0 2 4
Favours oral Favours intravenous
Analysis 3.2. Comparison 3 Oral versus IV bisphosphonates, Outcome 2 Spine BMD z scores.
Review: Bisphosphonate therapy for osteogenesis imperfecta
Comparison: 3 Oral versus IV bisphosphonates
Outcome: 2 Spine BMD z scores
Study or subgroup Oral IntravenousMean
DifferenceMean
Difference
N Mean(SD) N Mean(SD) IV,Fixed,95% CI IV,Fixed,95% CI
1 At 12 months
DiMeglio 2006 9 -1.8 (1.2) 9 -2.1 (1.8) 0.30 [ -1.11, 1.71 ]
2 At 24 months
DiMeglio 2006 9 -1.1 (1.2) 9 -1.3 (2) 0.20 [ -1.32, 1.72 ]
-4 -2 0 2 4
Favours oral Favours IV
57Bisphosphonate therapy for osteogenesis imperfecta (Review)
Copyright © 2014 The Cochrane Collaboration. Published by John Wiley & Sons, Ltd.

Analysis 3.3. Comparison 3 Oral versus IV bisphosphonates, Outcome 3 Change in alkaline phosphonate
(IU/liter).
Review: Bisphosphonate therapy for osteogenesis imperfecta
Comparison: 3 Oral versus IV bisphosphonates
Outcome: 3 Change in alkaline phosphonate (IU/liter)
Study or subgroup Oral IntravenousMean
DifferenceMean
Difference
N Mean(SD) N Mean(SD) IV,Fixed,95% CI IV,Fixed,95% CI
1 At 4 months
DiMeglio 2006 9 237 (90) 9 249 (69) -12.00 [ -86.09, 62.09 ]
2 At 12 months
DiMeglio 2006 9 209 (73) 9 244 (99) -35.00 [ -115.36, 45.36 ]
-200 -100 0 100 200
Favours oral Favours intravenous
Analysis 3.4. Comparison 3 Oral versus IV bisphosphonates, Outcome 4 Change in bone alkaline
phosphatase (IU/liter).
Review: Bisphosphonate therapy for osteogenesis imperfecta
Comparison: 3 Oral versus IV bisphosphonates
Outcome: 4 Change in bone alkaline phosphatase (IU/liter)
Study or subgroup Oral IntravenousMean
DifferenceMean
Difference
N Mean(SD) N Mean(SD) IV,Fixed,95% CI IV,Fixed,95% CI
1 At 4 months
DiMeglio 2006 9 76 (35) 9 71 (23) 5.00 [ -22.36, 32.36 ]
2 At 12 months
DiMeglio 2006 9 66 (28) 9 78 (32) -12.00 [ -39.78, 15.78 ]
-100 -50 0 50 100
Favours oral Favours intravenous
58Bisphosphonate therapy for osteogenesis imperfecta (Review)
Copyright © 2014 The Cochrane Collaboration. Published by John Wiley & Sons, Ltd.

Analysis 3.5. Comparison 3 Oral versus IV bisphosphonates, Outcome 5 Change in NTX/Cr (nMBCE/mM).
Review: Bisphosphonate therapy for osteogenesis imperfecta
Comparison: 3 Oral versus IV bisphosphonates
Outcome: 5 Change in NTX/Cr (nMBCE/mM)
Study or subgroup Oral IntravenousMean
DifferenceMean
Difference
N Mean(SD) N Mean(SD) IV,Fixed,95% CI IV,Fixed,95% CI
1 At 4 months
DiMeglio 2006 9 366 (216) 9 474 (200) -108.00 [ -300.32, 84.32 ]
2 At 12 months
DiMeglio 2006 9 240 (200) 9 351 (137) -111.00 [ -269.38, 47.38 ]
-500 -250 0 250 500
Favours oral Favours intravenous
Analysis 4.1. Comparison 4 Different doses of oral or IV bisphosphonates, Outcome 1 Number of crush-
fractured vertebrae.
Review: Bisphosphonate therapy for osteogenesis imperfecta
Comparison: 4 Different doses of oral or IV bisphosphonates
Outcome: 1 Number of crush-fractured vertebrae
Study or subgroup log [Rate Ratio] Rate Ratio Rate Ratio
(SE) IV,Fixed,95% CI IV,Fixed,95% CI
1 IV 6 mg/kg versus 12 mg/kg
Senthilnathan 2008 0.25 (0.33) 1.28 [ 0.67, 2.45 ]
0.05 0.2 1 5 20
Favours 6mg/kg Favours 12mg/kg
59Bisphosphonate therapy for osteogenesis imperfecta (Review)
Copyright © 2014 The Cochrane Collaboration. Published by John Wiley & Sons, Ltd.

Analysis 4.2. Comparison 4 Different doses of oral or IV bisphosphonates, Outcome 2 Number of fractures
suffered by participant.
Review: Bisphosphonate therapy for osteogenesis imperfecta
Comparison: 4 Different doses of oral or IV bisphosphonates
Outcome: 2 Number of fractures suffered by participant
Study or subgroup log [Rate Ratio] Rate Ratio Rate Ratio
(SE) IV,Fixed,95% CI IV,Fixed,95% CI
1 Oral 0.2 v 1
Bishop 2010 -0.14 (0.3) 0.87 [ 0.48, 1.57 ]
2 Oral 0.2 v 1
Bishop 2010 -0.25 (0.29) 0.78 [ 0.44, 1.37 ]
3 Oral 1 v 2
Bishop 2010 -0.12 (0.28) 0.89 [ 0.51, 1.54 ]
0.1 0.2 0.5 1 2 5 10
Favours lower dose Favours higher dose
Analysis 4.3. Comparison 4 Different doses of oral or IV bisphosphonates, Outcome 3 Lumbar spine bone
mineral density.
Review: Bisphosphonate therapy for osteogenesis imperfecta
Comparison: 4 Different doses of oral or IV bisphosphonates
Outcome: 3 Lumbar spine bone mineral density
Study or subgroup 12 mg/kg 6 mg/kgMean
DifferenceMean
Difference
N Mean(SD) N Mean(SD) IV,Fixed,95% CI IV,Fixed,95% CI
1 IV 12 mg/kg versus 6 mg/kg at 12 months
Senthilnathan 2008 4 153 (59) 6 108 (60) 45.00 [ -30.15, 120.15 ]
-100 -50 0 50 100
Favours 6mg/kg Favours 12mg/kg
60Bisphosphonate therapy for osteogenesis imperfecta (Review)
Copyright © 2014 The Cochrane Collaboration. Published by John Wiley & Sons, Ltd.

Analysis 4.4. Comparison 4 Different doses of oral or IV bisphosphonates, Outcome 4 Lumbar spine z score
BMD.
Review: Bisphosphonate therapy for osteogenesis imperfecta
Comparison: 4 Different doses of oral or IV bisphosphonates
Outcome: 4 Lumbar spine z score BMD
Study or subgroup Lower dose Higher doseMean
DifferenceMean
Difference
N Mean(SD) N Mean(SD) IV,Fixed,95% CI IV,Fixed,95% CI
1 Oral 0.2 v 1
Bishop 2010 16 -0.56 (1.16) 16 -0.06 (1.12) -0.50 [ -1.29, 0.29 ]
2 Oral 0.2 v 2
Bishop 2010 16 -0.56 (1.16) 16 0.62 (1.12) -1.18 [ -1.97, -0.39 ]
3 Oral1 v 2
Bishop 2010 16 -0.06 (1.12) 16 0.62 (1.12) -0.68 [ -1.46, 0.10 ]
-2 -1 0 1 2
Favours higher dose Favours lower dose
Analysis 4.5. Comparison 4 Different doses of oral or IV bisphosphonates, Outcome 5 Length z score.
Review: Bisphosphonate therapy for osteogenesis imperfecta
Comparison: 4 Different doses of oral or IV bisphosphonates
Outcome: 5 Length z score
Study or subgroup 12 mg/kg 6 mg/kgMean
DifferenceMean
Difference
N Mean(SD) N Mean(SD) IV,Fixed,95% CI IV,Fixed,95% CI
1 IV 12 mg/kg versus 6 mg/kg at 12 months
Senthilnathan 2008 4 -2.8 (0.8) 6 -4.9 (3.1) 2.10 [ -0.50, 4.70 ]
-20 -10 0 10 20
Favours 6 mg/kg Favours 12 mg/kg
61Bisphosphonate therapy for osteogenesis imperfecta (Review)
Copyright © 2014 The Cochrane Collaboration. Published by John Wiley & Sons, Ltd.

Analysis 4.6. Comparison 4 Different doses of oral or IV bisphosphonates, Outcome 6 Height z score at 2
years.
Review: Bisphosphonate therapy for osteogenesis imperfecta
Comparison: 4 Different doses of oral or IV bisphosphonates
Outcome: 6 Height z score at 2 years
Study or subgroup Lower dose Higher doseMean
DifferenceMean
Difference
N Mean(SD) N Mean(SD) IV,Fixed,95% CI IV,Fixed,95% CI
1 Oral 0.2 v 1
Bishop 2010 16 -3.28 (2.7) 16 -2.72 (2.78) -0.56 [ -2.46, 1.34 ]
2 Oral 0.2 v 2
Bishop 2010 16 -3.28 (2.7) 16 -2.13 (2.24) -1.15 [ -2.87, 0.57 ]
3 Oral 1 v 2
Bishop 2010 16 -2.72 (2.78) 16 -2.13 (2.24) -0.59 [ -2.34, 1.16 ]
-10 -5 0 5 10
Favours lower dose Favours higher dose
Analysis 5.1. Comparison 5 IV versus IV, Outcome 1 Change in number of fractures per patient from
baseline.
Review: Bisphosphonate therapy for osteogenesis imperfecta
Comparison: 5 IV versus IV
Outcome: 1 Change in number of fractures per patient from baseline
Study or subgroup Zolodronic acid PamidronateMean
DifferenceMean
Difference
N Mean(SD) N Mean(SD) IV,Fixed,95% CI IV,Fixed,95% CI
Zoledronic Acid 2008 68 -1.96 (3.84) 67 -1.55 (2.08) -0.41 [ -1.45, 0.63 ]
-10 -5 0 5 10
Favours zoledronic acid Favours pamidronate
62Bisphosphonate therapy for osteogenesis imperfecta (Review)
Copyright © 2014 The Cochrane Collaboration. Published by John Wiley & Sons, Ltd.

Analysis 5.2. Comparison 5 IV versus IV, Outcome 2 Lumbar spine BMD at month 12.
Review: Bisphosphonate therapy for osteogenesis imperfecta
Comparison: 5 IV versus IV
Outcome: 2 Lumbar spine BMD at month 12
Study or subgroup Zoledronic acid PamidronateMean
DifferenceMean
Difference
N Mean(SD) N Mean(SD) IV,Fixed,95% CI IV,Fixed,95% CI
1 Percentage change from baseline
Zoledronic Acid 2008 63 42.71 (22.21) 68 34.65 (22.01) 8.06 [ 0.48, 15.64 ]
2 Areal BMD z score
Barros 2012 10 -3.8 (1.1) 11 -2.3 (2) -1.50 [ -2.86, -0.14 ]
-10 -5 0 5 10
Favours pamidronate Favours zoledronic acid
Analysis 5.3. Comparison 5 IV versus IV, Outcome 3 Supine height.
Review: Bisphosphonate therapy for osteogenesis imperfecta
Comparison: 5 IV versus IV
Outcome: 3 Supine height
Study or subgroup Zoledronic acid PamidronateMean
DifferenceMean
Difference
N Mean(SD) N Mean(SD) IV,Fixed,95% CI IV,Fixed,95% CI
1 12 months
Zoledronic Acid 2008 63 6 (5.3) 68 6.5 (7) -0.50 [ -2.62, 1.62 ]
-10 -5 0 5 10
Favours pamidronate Favours zoledronic acid
63Bisphosphonate therapy for osteogenesis imperfecta (Review)
Copyright © 2014 The Cochrane Collaboration. Published by John Wiley & Sons, Ltd.

Analysis 5.4. Comparison 5 IV versus IV, Outcome 4 Vertebral spine length.
Review: Bisphosphonate therapy for osteogenesis imperfecta
Comparison: 5 IV versus IV
Outcome: 4 Vertebral spine length
Study or subgroup Zoledronic acid PamidronateMean
DifferenceMean
Difference
N Mean(SD) N Mean(SD) IV,Fixed,95% CI IV,Fixed,95% CI
1 12 months
Zoledronic Acid 2008 63 1.9 (3.2) 68 2.7 (5.8) -0.80 [ -2.39, 0.79 ]
-10 -5 0 5 10
Favours pamidronate Favours zoledronic acid
A D D I T I O N A L T A B L E S
Table 1. Classification of osteogenesis imperfecta
Syndrome names # of subtypes Subtypes and genetic basis Previous type
Classic Non-deforming OIwith Blue Sclerae
2 Ia - With normal teeth or OpalescentDentine caused by COL1A1Ib - caused by COL1A2
I
Common variable OI withNormal Sclerae
2 IVa - caused by COL1A1IVb - caused by COL1A2
IV
OI with calcification in in-terosseous membranes
1 V - caused by 5’UTR mutation inIFITM5
V
Progressively Deforming OIwith normal sclerae
10 III -gene xIII-COL1A1 or COL1A2 inherited asautosomal dominantIII - CRTAP, P3H1/LEPRE1, PPIB,FKBP10, SERPINH1, SP7/OSX, SER-PINF1 and BMP 1
III
International Nomenclature Committee for Constitutional Disorders of the Skeleton, Australia.
64Bisphosphonate therapy for osteogenesis imperfecta (Review)
Copyright © 2014 The Cochrane Collaboration. Published by John Wiley & Sons, Ltd.

Table 2. Current bisphosphonates
Bisphosphonate Mechanism of action Route of administration
Alendronate* (Fosamax) Nitrogenous Oral
Clodronate (Bonefos) Non-nitrogenous Oral, IV
Etidronate (Didronel) Non-nitrogenous Oral
Ibandronate (Boniva) Nitrogenous Oral
Neridronate* Nitrogenous IV
Olpadronate* Nitrogenous Oral, IV
Pamidronate* (Aredia) Nitrogenous IV
Risendronate (Actonel) Nitrogenous Oral
Tiludronate (Skelid) Non-nitrogenous Oral
Zolendronate (Zometa, Reclast) Nitrogenous IV
Nitrogenous bisphosphonates disrupt osteoclast formation, survival and cytoskeletal dynamics. They contain nitrogen (a colourlesstasteless odourless element that as a diatomic gas is relatively inert and constitutes 78% of the atmosphere and that is a constituentof organic compounds found in all living tissues).
Non-nitrogenous bisphosphonates initiate osteoclast apoptosis.IV: intravenous
Table 3. Search strategy - PubMed 1996 to June 2006
MESH terms
1. osteogenesis imperfecta (827)2. randomised controlled trial or Randomized Controlled Trials (49443)3. 1 and 2 (4)4. from 4 keep (2)
Table 4. Search strategy - Ovid MEDLINE 1996 to June 2006
Search terms
1. osteogenesis imperfecta (163)2. randomised controlled trial (11846)3. Randomized Controlled Trials (11906)4. Combine 1, 2, 3 (7)
65Bisphosphonate therapy for osteogenesis imperfecta (Review)
Copyright © 2014 The Cochrane Collaboration. Published by John Wiley & Sons, Ltd.

Table 4. Search strategy - Ovid MEDLINE 1996 to June 2006 (Continued)
5. From 7 keep 2 (2)
Table 5. Study comparison: outcome data reported by individual studies
Study ID Biochemical
markers
BMD Fracture
incidence
Growth Bone pain Quality of life
Adami 2003 Decrease inbone-specific al-kaline phos-phatase 20%, de-crease 25% inserum sCTx, de-crease 20% inurinary free-de-oxypyridi-noline in IV Ner-idronate groupvs placebo
Increase spineBMD 3.0 +/- 4.6%, hip 4.3 +/-3.9% vs no sig-nificant changeplacebo
14% decrease inrate of fracture.
Not addressed. Not addressed. Not addressed.
Barros 2012 Not addressed. At the end of thefollow-up period, bothgroupsshoweda decrease in thefracture rate (P =0.025 and P = 0.048,respectively) butnoinformation wasgiven comparingthe groups
Therewas no signifi-cant change inheight in bothgroups through-outthe treatment
Not addressed. Not addressed.
Bishop 2010 De-crease in bone-specific alkalinephosphatase 1%,decrease21% serum NTxover 2-year trialperiod (groupeddata)
Lum-bar spine BMDincreased signif-icantly only inthe 2 mg/kg/wkgroup
Overall re-duction in non-vertebral fractureincidence in allgroupsduring trial ascompared to twoyears prior. Dosegroups did notdiffer
No dif-ference betweengroups in heightz scores.
No differencebetween groupsin pain scores.
No differencebetween groupsin grip strengthor self reportedfunction
Bishop 2013 The mean valuesfor serum 25-hy-
Lum-bar spine BMD
signif-icant decrease in
No dif-ference between
no difference inpain scales be-
Not addressed.
66Bisphosphonate therapy for osteogenesis imperfecta (Review)
Copyright © 2014 The Cochrane Collaboration. Published by John Wiley & Sons, Ltd.

Table 5. Study comparison: outcome data reported by individual studies (Continued)
droxyvita-min D and intactparathyroid hor-monewere within nor-mal ranges,and the changesfrom baselinewere small at alltime-pointsfor both treat-ment groups
increased signifi-cantly
risk of recurrentclinical fracture
groups in heightz scores.
tween the groupsand the data wasnot shown
Chevrel 2006 Decrease in boneresorption mark-ers (colla-gen peptides, os-teocalcin) at oneyear. Alka-line phosphataseunchanged
Increase spineBMD. Increasefemur BMD. Ef-fects seen pri-marily in firstyear of therapy
No difference invertebral or pe-ripheral fracturerate. Not ade-quately powered
Not addressed. No difference inpain except anincrease with al-endronate at 36month timepoint
Not addressed.
DiMeglio 2006 Decrease in alka-line phosphataseand bone alka-line phos-phatase; decreasein urine NTX/Cr
Increase BMD,BMC and areaz scores in bothoral and IV ther-apy
Decreased frac-ture incidencewith time whenboth groups arecombined
Increase heightand length com-bined group zscores comparedto normal chil-dren
Not addressed. Not addressed.
Gatti 2005 Significantdecrease in alka-line phosphatasefrombaseline. Groupsdid not differ
Increasespine BMD infirst 12 months,then groups wereno longer differ-ent. BMD con-tinued to be dif-ferent from base-line. Ini-tial increase (first12 months) inheight/projectedlumbar spinearea, followed byno change at 12 -26 months
Relative risk re-duction 0.36%(CI, 0.15 - 0.87;P < 0.02).
Ini-tial increase (first12 months) inheight/projectedlumbar spinearea, followed byno change at 12 -26 months
Not addressed. Not addressed.
Letocha 2005 No sig-nificant change
Increasespine BMD in
Decreased upperextremity frac-
Growth rateswere unchanged.
No difference inself-reported
No difference inmuscle strength
67Bisphosphonate therapy for osteogenesis imperfecta (Review)
Copyright © 2014 The Cochrane Collaboration. Published by John Wiley & Sons, Ltd.

Table 5. Study comparison: outcome data reported by individual studies (Continued)
from baseline asmeasured at eachinfusion time
treatment groupas compared tocon-trol group. In-creases were seenin the first 12months but nofurther increaseswere noted withextendedtherapy
tures in the firstyear of treatmentwith no furtherdecrease in thesecond year. Nochange in frac-ture incidence oflower extremitylong bone frac-ture in the first orsecond year
pain scores. or gross motorabilities.
Zoledronic Acid2008
The secondaryendpoints of rel-ative changefrom baseline inbiomarkersof bone turnover(serum À-CTx,P1NPand BALP, inpatients greaterthan or equalto 3 years ofage) all had sta-tistically signifi-cant greater re-ductions in thezoledronic acidgroup comparedtothe pamidronategroup at both 6and 12 months
Theprimary analysisof the percent-age change in LSBMD at month12relative to base-line in the ITT(LOCF) popula-tion demon-strated that zole-dronic acid wasnot only non-in-ferior, but supe-rior,to pamidronatewith an 8%greater increasein LS BMD andboth 95% con-fidence intervalsabove zero
No dif-ference betweengroups in frac-tures.
No dif-ference betweengroups in meansupine length,mean vertebralspine length andheight
No statis-tically significantdifferences wereidentified be-tween treatmentgroups
Not addressed.
Rauch 2009 Decrease col-lagen type-1 N-telopep-tide in treatmentgroup comparedto placebo
Increase spineBMD in treat-mentgroup comparedto placebo.
No detectabledifference in newfractures.
No difference inheight z scores.
No difference inbone pain.
No difference ingrip force.
Sakkers 2004 No signif-icant change be-tween groups.
Increase spine zscore 1.67 SDvs no significantchange placebo
31% decrease inrate of fracture.
No significantchange.
Not addressed. No signifi-cant difference inmobility / am-bulation; musclestrength or selfcare
68Bisphosphonate therapy for osteogenesis imperfecta (Review)
Copyright © 2014 The Cochrane Collaboration. Published by John Wiley & Sons, Ltd.

Table 5. Study comparison: outcome data reported by individual studies (Continued)
Seikaly 2005 Decreasein urinary NTX/Cr. No changein serum markersor other urinarymarkers of boneturnover
Increase in BMDz score 0.89 withalendronatecompared to -0.12 with placebo
Non-significanttrend toward de-creased fractures.
Increased heightz scores (0.41 vs0.11) when alen-dronate is com-pared to placebo
Decreased painscores and de-creased use ofanalgesia.
Improvedwell being scores.Increase in selfcare. No changein mobility
Senthilnathan2008
Decrease in bonespecific alkalinephosphatase andserum NTx inboth groups
Increasein LSB mass forboth groups. In-creased LSBMDin 12/mg/kg/yrgroup after ad-justment
No differences incrush fracturedvertebraebetween groups.Improved crushfractures in allbut one infant
No difference inlength z scoresbetween groups.
Not addressed. Not addressed.
Ward 2010 Decreasein uNTx (62%)compared toplacebo (32%).
Increase in LS-BMD comparedto placebo.
No difference infractures.
No difference inheight z scores.
No difference inbone pain.
No difference inmobility.
IV: intravenousNTX/Cr: N-linked telopeptides/creatininesCTx: serum cross-lapsvs: versus
W H A T ’ S N E W
Last assessed as up-to-date: 17 July 2014.
Date Event Description
28 July 2014 Amended Contact details updated.
H I S T O R Y
Protocol first published: Issue 1, 2005
Review first published: Issue 4, 2008
69Bisphosphonate therapy for osteogenesis imperfecta (Review)
Copyright © 2014 The Cochrane Collaboration. Published by John Wiley & Sons, Ltd.

Date Event Description
17 July 2014 New citation required but conclusions have not changed The review update six new trials. Two trials evalu-ated oral bisphosphonates versus placebo (Bishop 2013;Rauch 2009); one trial evaluated different doses oforal bisphosphonates (Bishop 2010); one trial evaluateddifferent doses of intravenous infused bisphosphonates(Senthilnathan 2008); and two trials compared differentintravenous bisphosphonates (Barros 2012; ZoledronicAcid 2008).No major changes to the conclusions were made as com-pared to the previous published version (Phillipi 2008).
17 July 2014 New search has been performed A search of the Group’s Inborn Errors of Metabolism Reg-ister identified six new trials eligible for inclusion in thereview (Barros 2012; Bishop 2010; Bishop 2013; Rauch2009; Senthilnathan 2008; Zoledronic Acid 2008). In ad-dition to this, one already included trial, previously pub-lished in abstract form only (Glorieux 2004), has nowbeen published in full and further information has beenincluded in the review (Ward 2010).
28 May 2008 Amended Converted to new review format.
C O N T R I B U T I O N S O F A U T H O R S
Robert Steiner (RS) conceived the review.
RS and JR wrote the protocol.
Kerry Dwan (KD), Carrie Phillipi (CP) and RS independently examined and evaluated all relevant studies and drafted the text, withinput from Tracey Remmington (TR) and Donald Basel (DB).
CP,TR and KD input the data into the review.
CP and DB revised the background and discussion from the original written by JR and RS, and RS edited these.
DB acts as guarantor of the review.
D E C L A R A T I O N S O F I N T E R E S T
RS has participated in clinical trials of pharmacologic agents for OI sponsored by Shriners Hospitals, Merck, Novartis, and Aventis/Proctor and Gamble. RS was a co-investigator with JR (lead author on the protocol only) on an investigator-initiated study of treatmentfor adults with OI which is financially supported by Eli Lilly, the Osteogenesis Imperfecta Foundation and the National Institutes ofHealth, but for which RS does not receive individual financial support.
JR has been a guest lecturer for Aventis Pharmaceuticals, Inc.
CP, KD and DB report no potential conflicts.
70Bisphosphonate therapy for osteogenesis imperfecta (Review)
Copyright © 2014 The Cochrane Collaboration. Published by John Wiley & Sons, Ltd.

D I F F E R E N C E S B E T W E E N P R O T O C O L A N D R E V I E W
Title change from ’Pharmacologic therapy for osteogenesis imperfecta’ to more accurately refect the content of the review.
I N D E X T E R M SMedical Subject Headings (MeSH)
Bone Density [drug effects]; Bone Density Conservation Agents [∗therapeutic use]; Diphosphonates [∗therapeutic use]; Fractures,Bone [∗prevention & control]; Osteogenesis Imperfecta [∗drug therapy]; Randomized Controlled Trials as Topic
MeSH check words
Humans
71Bisphosphonate therapy for osteogenesis imperfecta (Review)
Copyright © 2014 The Cochrane Collaboration. Published by John Wiley & Sons, Ltd.