Dust and Nebular Emission. I. Models for Normal … GRASIL already provides a sound treatment of all...
16
arXiv:astro-ph/0307096v1 4 Jul 2003 Astronomy & Astrophysics manuscript no. dust2 March 14, 2018 (DOI: will be inserted by hand later) Dust and Nebular Emission. I. Models for Normal Galaxies. P. Panuzzo 1 ,⋆ , A. Bressan 2,1 , G. L. Granato 2 , L. Silva 3 , and L. Danese 1 1 Scuola Internazionale Superiore di Studi Avanzati, Via Beirut 4, I-34014 Trieste, Italy 2 INAF, Osservatorio Astronomico di Padova, Vicolo dell’Osservatorio 5, I-35122 Padova, Italy 3 INAF, Osservatorio Astronomico di Trieste, Via G. B. Tiepolo 11, I-34131 Trieste, Italy Received ; accepted Abstract. We present a model for nebular emission in star forming galaxies, which takes into account the effects of dust reprocessing. The nebular emissions (continuum emission, 54 H and He recombination lines and 60 nebular lines from UV to IR) have been computed with CLOUDY and then included into GRASIL, our spectrophotometric code specifically developed for dusty galaxies. The interface between nebular emission and population synthesis is based on a set of pre-computed H region emission models covering a wide range of physical quantities (metallicity, density, geometry and number of H , He and O ionizing photons). These quantities are fully adequate to describe the emission properties of the majority of star-forming and starburst galaxies. Concerning the extinction properties of normal star forming galaxies, we are able to interpret the observed lack of correlation between the attenuation measured at Hα and in the UV band as a consequence of age selective extinction. We also find that, for these galaxies with modest SFR, the ratio FIR/UV provides the best constraints on the UV attenuation. The accurate treatment of lines and continuum in dusty galaxies also allows to deal with different SFR estimators in a consistent way, from the UV to radio wavelengths, and to discuss the uncertainties arising from the different physical conditions encountered in star forming galaxies. We provide our best estimates of SFR/luminosity calibrations, together with their expected range of variation. It results that SFR derived through Hα, even when corrected for extinction using the Balmer decrement, is affected by important uncertainties due to age selective extinction. Another remarkable result is that SFR from UV luminosity corrected by means of the ratio FIR/UV has a small uncertainty. Finally, our model provides a calibration of SFR from radio luminosity; its value differs from estimates from other works, but we are able to reproduce the observed FIR/radio ratio. These results are relevant to estimates of the contribution of disk galaxies to the cosmic SFR at z ≤ 1. Key words. HII regions; galaxies: ISM; galaxies: star formation; galaxies: evolution 1. Introduction Massive stars in young stellar generations leave their signature as UV, ionizing photons and supernova (SN) explosions. Thus, ongoing star formation in galaxies is traced by the reprocess- ing of stellar radiation (line and continuum emission from the surrounding ionized gas, thermal emission by dust grains) and by synchrotron emission of SN accelerated electrons. The hy- drogen recombination lines have been widely used as tracers of the current star formation rate (SFR), because of the direct pro- portionality between their intensity and the number of living massive stars. In the absence of dust, nebular emission models predict an almost constant ratio of Hα to Hβ for a large variety of environments (e.g. Osterbrock 1989); so, the dust absorp- tion can be estimated by comparing the observed ratio to the theoretical one (Balmer decrement method). However, the discovery by IRAS of powerful and highly dust enshrouded starbursts (Soifer et al. 1986), namely the Luminous and Ultra Luminous Infrared Galaxies, has under- lined the necessity to model nebular emission by consistently taking into account dust reprocessing. Moreover, an impressive ⋆ e-mail: [email protected] wealth of information is coming from infrared spectral region. Both star formation and a possible nuclear activity contribute to infrared luminosity, but with different emission properties (Rigopoulou et al. 1999). The combination of different indi- cators (such as optical, near- and mid-infrared emission lines, mid-infrared PAH bands, shape of the continuum from the far- ultraviolet to the radio wavelengths) should then allow to obtain a fair picture of the star formation process and possible AGN contribution for a wide class of active galaxies. Two models have been recently published in which spec- tral synthesis and photo-ionization codes are coupled. Charlot & Longhetti (2001, henceforth CL01) combined a popula- tion synthesis code with the photo-ionization code CLOUDY (Ferland 2001), including an approximate prescription to es- timate the dust absorption. According to CL01, the presence of dust increases the uncertainty of standard SFR estimators such as Hα or [O ] luminosities, from a factor of a few to several decades. Only the simultaneous consideration of sev- eral other lines and spectral features can reduce the uncertainty within a factor of a few. In a similar way, Moy et al. (2001, hereafter MRF01) interfaced the evolutionary synthesis model P ´ EGASE (Fioc & Rocca-Volmerange 1997) with CLOUDY. In
Transcript of Dust and Nebular Emission. I. Models for Normal … GRASIL already provides a sound treatment of all...

arX
iv:a
stro
-ph/
0307
096v
1 4
Jul
200
3Astronomy & Astrophysicsmanuscript no. dust2 March 14, 2018(DOI: will be inserted by hand later)
Dust and Nebular Emission. I. Models for Normal Galaxies.
P. Panuzzo1,⋆, A. Bressan2,1, G. L. Granato2, L. Silva3, and L. Danese1
1 Scuola Internazionale Superiore di Studi Avanzati, Via Beirut 4, I-34014 Trieste, Italy2 INAF, Osservatorio Astronomico di Padova, Vicolo dell’Osservatorio 5, I-35122 Padova, Italy3 INAF, Osservatorio Astronomico di Trieste, Via G. B. Tiepolo 11, I-34131 Trieste, Italy
Received ; accepted
Abstract. We present a model for nebular emission in star forming galaxies, which takes into account the effects of dustreprocessing. The nebular emissions (continuum emission,54 H and He recombination lines and 60 nebular lines from UV toIR) have been computed with CLOUDY and then included into GRASIL, our spectrophotometric code specifically developedfor dusty galaxies. The interface between nebular emissionand population synthesis is based on a set of pre-computed H
region emission models covering a wide range of physical quantities (metallicity, density, geometry and number of H, He andO ionizing photons). These quantities are fully adequate to describe the emission properties of the majority of star-forming andstarburst galaxies. Concerning the extinction propertiesof normal star forming galaxies, we are able to interpret theobservedlack of correlation between the attenuation measured at Hα and in the UV band as a consequence of age selective extinction. Wealso find that, for these galaxies with modest SFR, the ratio FIR/UV provides the best constraints on the UV attenuation. Theaccurate treatment of lines and continuum in dusty galaxiesalso allows to deal with different SFR estimators in a consistent way,from the UV to radio wavelengths, and to discuss the uncertainties arising from the different physical conditions encounteredin star forming galaxies. We provide our best estimates of SFR/luminosity calibrations, together with their expected range ofvariation. It results that SFR derived through Hα, even when corrected for extinction using the Balmer decrement, is affectedby important uncertainties due to age selective extinction. Another remarkable result is that SFR from UV luminosity correctedby means of the ratio FIR/UV has a small uncertainty. Finally, our model provides a calibration of SFR from radio luminosity;its value differs from estimates from other works, but we are able to reproduce the observed FIR/radio ratio. These results arerelevant to estimates of the contribution of disk galaxies to the cosmic SFR atz ≤ 1.
Key words. HII regions; galaxies: ISM; galaxies: star formation; galaxies: evolution
1. Introduction
Massive stars in young stellar generations leave their signatureas UV, ionizing photons and supernova (SN) explosions. Thus,ongoing star formation in galaxies is traced by the reprocess-ing of stellar radiation (line and continuum emission from thesurrounding ionized gas, thermal emission by dust grains) andby synchrotron emission of SN accelerated electrons. The hy-drogen recombination lines have been widely used as tracersofthe current star formation rate (SFR), because of the directpro-portionality between their intensity and the number of livingmassive stars. In the absence of dust, nebular emission modelspredict an almost constant ratio of Hα to Hβ for a large varietyof environments (e.g. Osterbrock 1989); so, the dust absorp-tion can be estimated by comparing the observed ratio to thetheoretical one (Balmer decrement method).
However, the discovery by IRAS of powerful and highlydust enshrouded starbursts (Soifer et al. 1986), namely theLuminous and Ultra Luminous Infrared Galaxies, has under-lined the necessity to model nebular emission by consistentlytaking into account dust reprocessing. Moreover, an impressive
⋆ e-mail:[email protected]
wealth of information is coming from infrared spectral region.Both star formation and a possible nuclear activity contributeto infrared luminosity, but with different emission properties(Rigopoulou et al. 1999). The combination of different indi-cators (such as optical, near- and mid-infrared emission lines,mid-infrared PAH bands, shape of the continuum from the far-ultraviolet to the radio wavelengths) should then allow to obtaina fair picture of the star formation process and possible AGNcontribution for a wide class of active galaxies.
Two models have been recently published in which spec-tral synthesis and photo-ionization codes are coupled. Charlot& Longhetti (2001, henceforth CL01) combined a popula-tion synthesis code with the photo-ionization code CLOUDY(Ferland 2001), including an approximate prescription to es-timate the dust absorption. According to CL01, the presenceof dust increases the uncertainty of standard SFR estimatorssuch as Hα or [O ] luminosities, from a factor of a few toseveral decades. Only the simultaneous consideration of sev-eral other lines and spectral features can reduce the uncertaintywithin a factor of a few. In a similar way, Moy et al. (2001,hereafter MRF01) interfaced the evolutionary synthesis modelPEGASE (Fioc & Rocca-Volmerange 1997) with CLOUDY. In

2 P. Panuzzo et al.: Dust and Nebular Emission. I. Models for Normal Galaxies.
these models the dust processes are partially treated (extinctionbut not emission) using a simple screen approximation.1
However, growing evidence has been collected in the re-cent past showing that a physical understanding of dust effectsin galaxies requires the inclusion of different environments, ar-ranged in a rather complex geometry. A sophisticated treatmenttends to become more and more important as the obscurationgets higher.
In this paper, we propose a new method to compute nebu-lar emission in star forming galaxies. The method was imple-mented in the spectrophotometric synthesis model GRASIL2
The main advantage with respect to previous treatments isthat GRASIL already provides a sound treatment of all the as-pects of dust reprocessing, since it makes use of a geometrywhich is much closer to reality than a screen between the starsand the observer. Dust modeling is thus related to real phys-ical parameters, describing the different distributions of dustand stars in molecular complexes and diffuse components, andtheir age dependence.
One of its important features is that it takes into accountthat, since stars are born in dense environments (the molecularclouds) and progressively become less obscured, the relativegeometrical arrangement of dust and stars depends on the ageof the stellar generation considered. Granato et al. (2000)haveshown that this age-dependent extinction can explain the dif-ferences between the observed attenuation laws in normal andstarburst galaxies (see also Poggianti et al. 2001).
GRASIL has been shown to reproduce the UV to radio con-tinuum SEDs of galaxies, at low and high redshift, and in dif-ferent evolutionary stages (Silva et al. 1998, Franceschini et al.1998, Granato et al. 2000, Rodighiero et al. 2000, Granato etal. 2001).
The paper is organized as follows. In Sect. 2 we describehow we modeled stellar radiation and the computation of neb-ular emission from the single H regions. Sect. 3 explains thecalculation of nebular emission from galaxies and in the fol-lowing sections our model is applied to the case of normal star-forming galaxies. In particular in Sect. 4 the different methodsto estimate the attenuation are discussed. In Sect. 5 differentSFR estimators, together with their uncertainties, are presented.In Sect. 6 we discuss the use of IR nebular lines. Thus, in Sect.7 the main results of the paper are discussed, and then summa-rized in the last section. Finally, some technical details of Sect.2.2.1 and 3 are described in appendix A and B.
2. Population synthesis with gas and dust
In this section we summarize the main features of our popu-lation synthesis code GRASIL. More details can be found inSilva et al. (1998) and Granato et al. (2000). GRASIL repre-sents galaxies by means of two main components characterized
1 Additional details on these models are given and compared toourmethod in Sect. 3.
2 The GRASIL code and updated information on it can be found atthe URL:http://web.pd.astro.it/granato/grasil/grasil.html.(Silva et al. 1998), and then it was used to study the properties ofnormal star-forming galaxies.
by different geometries: a spheroidal component (the bulge)and a disky component. Dust, that may be present in both com-ponents, is divided in two phases: i) dense molecular clouds(MCs), where star formation is active, and ii) diffuse medium(or cirrus).
Young stars are assumed to be born into MCs, and to leavethem progressively as their age increases. As a consequence,the fraction of light of young simple stellar populations (SSPs)radiated inside MCs is a decreasing function of SSPs age, pa-rameterized by the “escape time”. Thus, the light of young starswill be attenuated by both the MCs and the cirrus, while olderpopulations will only be affected by dust in the cirrus compo-nent. The molecular cloud is modeled as a thick spherical shellof dense gas (and dust) around a central point source, represent-ing all the stellar content of the cloud. The time dependenceof the escape fraction gives rise to the age-selective extinctionbecause younger stellar generations are more attenuated thanolder ones.
Massive stars are supposed to ionize the surroundingmedium and to give rise to the corresponding line and contin-uum nebular emissions. This radiation comes generally fromwithin MCs and it is accordingly extinguished. However, it isworth noticing that, when the escape time is short enough, asignificant number of ionizing photons can arise from star gen-erations outside MCs and, consequently, we will also considerH regions extinguished only by the cirrus component. Tocompute nebular emission we have used the photo-ionizationcode CLOUDY (version 94), as detailed in the following sec-tions.
Since our interest is focused on the star formation pro-cess and the obscuration of star-forming regions, we do notinclude in our model the emission due to an Active GalacticNucleus (AGN). We neglect the ionization due to UV radia-tion from post-AGB stars, since in presence of even a modeststar formation activity their contribution is very low (Binetteet al. 1994). Moreover, we neglect the contribution of shocksproduced by SN explosions, that is typically low (Kewleyet al. 2001). Finally, we do not include line emission fromphoto-dissociation regions and diffuse warm neutral/low ion-ized medium, although some fine structure IR lines are effi-ciently produced in these media. As a consequence their lumi-nosities in our model will be only lower limits; this problemwill be discussed in Sect. 2.3.
The final output of our model is a complete and detailedspectrum of star-forming galaxies, from far-UV to the radiowavelengths (an extension to X-ray band is in progress, Silvaet al. in preparation), including stellar absorption features, neb-ular emission, dust and PAH emission.
2.1. Stellar Radiation
SEDs of stellar generations (SSP, simple stellar populations)have been computed by following the prescriptions outlinedinBressan et al. (1994) and in Silva et al. (1998). These SEDscover a wide range in age and metal content. They can be com-puted for an arbitrary initial mass function (IMF) and allowtheuse of different atmosphere models, from the low-resolution

P. Panuzzo et al.: Dust and Nebular Emission. I. Models for Normal Galaxies. 3
(but covering a wide parameter space) Kurucz-Lejeune mod-els (Kurucz 1993; Lejeune et al. 1998), to the intermediate-resolution models of Pickles (1998) and Jacoby et al. (1984). Inthe latter two cases, which are derived from observed stars,thecorresponding fluxes have been extended into the unobservedregion by means of the Lejeune et al. (1998) models. The useof higher resolution models is particularly useful when dealingwith emission lines superimposed to absorption features oftheintermediate age populations. As for the most massive stars, wehave adopted the atmospheric models by Schaerer et al. (1996)for mass-losing blue supergiants, and the models by Schmutz,Leitherer & Gruenwald (1992) in the Wolf Rayet (WR) phase.It will be stressed below that the emission from H regionshas been computed in a way that is almost independent of thedetailed shape of the adopted SEDs of stellar populations.
2.2. H regions model
The emission spectrum from a single H region depends ontwo main ingredients: the SED of the ionizing star cluster andthe properties of the excited gas. For a given stellar evolutionscenario, the SED is determined by the IMF and the total mass,age and metallicity of the cluster, as well as by the adoptedmodel atmospheres. On the other hand, the important proper-ties of the excited gas are the density, the chemical compositionand the geometry. In a galaxy the situation is more complicatedand star forming regions possibly have different ages and differ-ent metallicities. In starbursts, star clusters of different ages andmetallicities may coexist within the same star forming region.To compute the line emission intensities, one should considerthe spectrum of the ionizing source, provided by the recent starformation history, and use a photoionization code with suitablevalues of the gas parameters. To reduce the computing cost, onecan use a pre-built library of line intensities, corresponding todifferent ages of the ionizing SSP and different metal contentsof both the SSP and the gas. This still requires different librariesfor different masses of the ionizing SSPs, assumed IMFs andmodel atmospheres. It becomes particularly time consuminginapplications requiring a large number of models.
Our approach has been to pick out the physical parameterswhich actually affect the emission properties of H regions.The analysis described in the following section shows that theemission line spectrum of an H region with fixed gas proper-ties (metallicity, density and geometry) is described withrea-sonable precision by only three quantities: the number of ion-izing photons for H, He and O (QH, QHe, andQO, definedin eq. 2). This method allows us to get rid of the particular SSPmodel and IMF. In fact, different ionizing sources that providethe same values ofQH, QHe, andQO, will produce the sameemission line spectra, within a reasonable accuracy.
Thus, we computed a library of photoionization models asa function ofQH, QHe, and QO. When estimating the actualline emission due to a given stellar population, we computeQH,QHe, andQO from the corresponding SED, and then interpolatethe value from the above library.
The H region library can be freely retrieved through theGRASIL web page (see Sect. 1).
In the following, we will describe the adopted procedureand test its accuracy.
2.2.1. Ionizing spectra
In order to have photoionization models as a function ofQH,QHe, and QO, we approximate real SEDs with piece-wiseblackbodies, in a way such that the space ofQ parameters iscovered as much as possible.
The Lyman continuum spectra of typical young stellar pop-ulations show two prominent discontinuities, at 504.1 Å and227.8 Å, corresponding respectively to the ionizing energiesfor He and He. At wavelengths smaller than 227.8 Å thereare very few photons. Between the Lyman break, He break,and He break, spectra can be reasonably well represented byblackbodies. Thus, when computing the libraries, we used thefollowing functional representation of the ionizing SEDs:
Fν =
0 for λ < 227.8 ÅAHeBν(THe) for 227.8 Å < λ < 504.1 ÅAHBν(TH) for 504.1 Å < λ < 911.76 ÅAniBν(Tni) for 911.76 Å < λ
, (1)
whereBν(T ) is the Planck function at temperatureT . This func-tion depends on the 6 quantitiesAHe, THe, AH, TH, Ani andTni.However, we found that the SEDs of young stellar populationscan be well approximated by writing these 6 quantities in termsof only three parameters. These are the numbers of ionizingphotons for H, He and O (QH, QHe, andQO):
QH =
∫ ∞
νH
Fνhν
dν , QHe =
∫ ∞
νHe
Fνhν
dν , QO =
∫ ∞
νO
Fνhν
dν , (2)
whereνH, νHe andνO are the photoionization threshold frequen-cies for respectively H, He, and O (the last one correspondto λO = 350.7 Å). The relationship between theQ values andthe parameters of analytical spectra is described in appendix A.
We built a library for a grid of values ofQH, QHe, andQO,and for different assumptions on the gas density, metallicity andfilling factor (ǫ). When the filling factor is different from 1, thegas in the H region is supposed to be divided in small clumps,andǫ is defined as the ratio between the volume occupied bythe clumps and the total volume of the H region. The gasdensity refers to the hydrogen density inside the clumps. Hregions are assumed to be spherical and ionization bounded,with a constant density along the radius, and with a coveringfactor of 1. The abundance of elements respect to H are fromMcGaugh (1991). These abundances are relative to gas phase,thus they already account for the fraction stored in dust (deple-tion).
The characteristics of dust inside H regions and its effectson the emerging emission are still poorly known. However, itis reasonable that the main effect is that a fractionfd (typically∼ 30%, see DeGioia-Eastwood, 1992) of ionizing photons isabsorbed by dust. To approximate the consequence, one canmultiply the nebular emission of a dust-free model by a factor1 − fd. Thus, absorption by internal dust has not been consid-ered in H region models presented here. Moreover, includingdust inside photo-ionization models would introduce new free

4 P. Panuzzo et al.: Dust and Nebular Emission. I. Models for Normal Galaxies.
parameters, and the library could be coherently used only insome specific cases.
It is worth noticing that the emission properties of the ion-ized gas (i.e. the ratio of different line intensities) at a fixed den-sity do not depend directly on the geometry of the gas, whileit shows a dependence on the ionization parameterU, that ex-presses the number of ionizing photons per particle. For a thinspherical shell at distanceR from a central ionizing source, theionization parameter isU = QH/(4πR2cnH); it can be shown(see appendix B) that the volume averaged ionization parame-ter 〈U〉 for a sphere, with densitynH and filling factorǫ, is
〈U〉 =3α2/3
B (H, T )
4c
(
3QHnHǫ2
4π
)1/3
, (3)
whereαB(H, T ) is the recombination coefficient of hydrogenin the case B. Thus, in our geometry〈U〉 is proportional to(QHnHǫ
2)1/3 while for the plane parallel geometryU ∝ QH/nH.As a consequence, our results remain also valid for different
geometries and/or filling factors, provided that we renormalizeQH to maintain the same value of〈U〉.
The computed lines are 54 H and He recombination linesand 60 nebular line of other elements with wavelength from UVto FIR. The complete list of lines and the space of parameterscovered by the library can be found in the web page.
2.2.2. Nebular continuum emission
The nebular continuum emission can be easily evaluated us-ing the Stromgren theory for the case B approximation (seeOsterbrock 1989) and added to the emerging spectrum.
We get
Eν = QHγν(H, T )αB(H, T )
+ QHeγν(He, T )αB(He, T )
, (4)
where γν(He, T ) and γν(H, T ) are the total emission coeffi-cients andαB(He, T ) andαB(H, T ) are the recombination coef-ficients, respectively of helium and hydrogen. In the formerco-efficients we take into account recombination, free-free emis-sion of H and He and the Lyα two photons decay emission.Free-free emission is computed as described in Bressan et al.(2002), while other coefficients are from Burgess & Summers(1976), Aller (1984), Osterbrock (1989), Ferland (1980) andNussbaumer & Schmutz (1984). The He contribution to thenebular emission is very small and can be neglected.
2.2.3. Accuracy
Before proceeding further, we need to analyze the errors intro-duced by adopting the analytic SEDs (equation 1) instead ofthe real SSP with the sameQ values.
A first problem is that our analytical spectra neglect pho-tons with energy higher than the He ionization threshold(hereafter we will refer to these photons as high energy pho-tons). This does not allow a realistic evaluation of the lumi-nosity of the He lines. However, nebular He lines are su-perimposed to the generally more intense photospheric lines,emitted in the stellar atmospheres of WR stars (Conti, 1991,
Fig. 1. Differences between H region models excited by SSPspectra with and without high energy photons. Crosses are fordifference smaller than 1%, empty squares for difference be-tween 1% and 5%; circled symbols refer to very low luminos-ity lines. Gas and star metallicity is 0.008; the stellar mass is3 · 104 M⊙.
Schaerer et al. 1999). We also cannot compute line intensitiesof highly ionized elements, such as O or Ne. These linesare typically either not observed, or very faint in pure starform-ing galaxies, so that they are often interpreted as a signature ofAGN activity. The impact of neglecting high energy photons onother lines is quantified by comparing the calculated emissionof H regions excited by SSP spectra with and without highenergy photons, normalized in order to have the sameQH. Theresults (for some ages and metallicities) are shown in Fig. 1fora Salpeter IMF between 0.15 and 120 M⊙. The difference inthe two cases is always< 10%, and typically< 1%; the highestdifference appears at SSP ages at which the WR stars producetheir maximum flux in high energy photons. We conclude thatthe lack of high energy photons is not very important, at leastfor the lines considered here.
The comparison between line intensities of H regionmodels excited by an SSP spectrum and those excited by aparametric spectrum with the same values ofQH, QHe, andQO
is shown in Fig. 2. Typical differences in the emission lines arelower than 10%, with the larger ones arising at lower valuesof QH, i.e. older ages. Most of them are due to discrepanciesbetween the SSP and parametric SEDs at wavelengths longerthan the Lyman break. Indeed, photons with wavelengths corre-sponding to Lyman serie lines can be efficiently absorbed andre-emitted in optical lines. When the ionizing flux decreaseswith respect to the non-ionizing one, this effect can be impor-tant. Notice however that, when computing the lines emittedbya combination of H regions excited by clusters with different

P. Panuzzo et al.: Dust and Nebular Emission. I. Models for Normal Galaxies. 5
Fig. 2. Differences between H region models excited by SSPspectra and parametric spectra with the sameQs. Empty trian-gles represent differences between 5% and 10%, filled trianglesrepresent differences greater than 10%.
ages, the most important contribution arises from the youngestpopulations.
As noticed in previous works (see e.g. Stasinska et al. 2001or Rubin et al. 2001), the photo-ionization models cannot beac-curate when the gas metallicity exceeds the solar value, forsev-eral reasons. As the metallicity increases, fine structure infraredlines of metals (that depend little on temperature) dominate thecooling processes, but their transition probabilities have not yetbeen well determined. On the other hand, optical collisionallyexcited lines, that depend strongly on the electronic tempera-ture, become uncertain because the temperature is regulated byinfrared lines. Furthermore, the thermal instability of the gasaffects the line intensity when the temperature is low and themetallicity is high. Finally, a further source of uncertainty athigh metallicity is due to the poorly known depletion of metalsinto dust grains. In order to minimize this problem, we useda set of abundances measured by McGaugh (1991) in the gasphase.
In order to check the flexibility of our procedure, we com-pare in Fig. 3 the results obtained by repeating the above testwhen adopting a very different IMF, namely a top-heavy mod-ified Kennicutt’s IMF (d logN/d logm = −0.4 for 0.15 M⊙ <m < 1 M⊙ and d logN/d logm = −1 for 1 M⊙ < m < 120 M⊙,Kennicutt, 1983). The differences between H region modelsexcited by SSP spectra and analytical ones with the sameQ val-ues are not larger than in the case of the Salpeter IMF, despitethe very different slope of the IMF.
In conclusion, our analytical spectra can reproduce with agood accuracy the nebular emission properties of H regionsexcited by star clusters with different IMF, age and metallicity
Fig. 3. As Fig. 2, but with SSPs with a top-heavy modifiedKennicutt’s IMF.
by only making use of the three quantitiesQH, QHe, andQO.Obviously this accuracy could be improved by adding someother quantity to describe the SED with more details, but thiswould dramatically increase the number of H region modelsused for the library.
2.3. C and O infrared lines
C , C and O fine structure infrared lines are produced notonly in H regions, but also in warm neutral and ionized in-terstellar medium and photodissociation regions (PDR). [O]63.2µm and 145.5µm, [C ]369µm and 610µm infrared lineshave upper energy levels respectively of 228 K, 326 K, 62.5K and 23.6 K (Kaufman et al. 1999), so they can easily be pro-duced in neutral medium. Because carbon has a ionization po-tential (11.26 eV) which is lower than H, the C ion is presentin PDR and in neutral medium illuminated by far-UV stellarradiation. Indeed, the [C]157.7µm line is the most importantcoolant of warm neutral medium. The relative contribution ofdifferent media to these lines is still a matter of debate (Heiles1994, Malhotra et al. 2001). Since our model does not includePDR or neutral gas emission, the luminosities predicted forthese lines must be taken as a lower limit.
2.4. Comparison with observed H galaxies
In Fig. 4 we compare our H library with observations of asample of H galaxies (crosses) from Dessauges-Zavadsky etal. (2000), a revision of the Terlevich’s catalogue (Terlevich etal. 1991). H galaxies are typically defined as galaxies withspectra very similar to those of H regions; these objects areinterpreted as bursting dwarf galaxies. In the figure we showthedependence of models on〈U〉 (or QH via the equation 3) and

6 P. Panuzzo et al.: Dust and Nebular Emission. I. Models for Normal Galaxies.
Fig. 4. Diagnostic diagram Log([O]/Hβ) vs. Log([S]/Hα). Crosses are observed H galaxies from Dessauges-Zavadsky etal. (2000). The three solid closed lines show the regions occupied by H region models from our library with three values ofQHe/QH (0.5, 0.275 and 0.05). The arrows show shifts at increasing〈U〉, QHe/QH, or QO/QHe. Log(〈U〉) ranges from -0.867to -3.534, andQO/QHe from 0.13 to 0.63. The models have a gas metallicity of 0.004,while the closed dotted line shows theposition of models with solar metallicity andQHe/QH = 0.275. All the models have a hydrogen density of 10 cm−3. The thicklong dashed line separates the region occupied by H galaxies (on the left) from the AGN region, as empirically defined byVeilleux & Osterbrock (1987); the thick dot-dashed line delineates the same separation computed by Kewley et al. (2001).
on the hardness of the ionizing SED, expressed byQHe/QH andQO/QHe.
The library covers the region of the [O]/Hβ vs. [S]/Hαdiagnostic diagram populated by observed H galaxies. Somemodels fall in the region of the diagnostic diagrams occupiedby AGNs; these models are produced by the hardest spectra inthe library (QHe/QH ≃ 0.5), harder than the spectra that can bebuilt with true SSPs.
3. Nebular emission from a star-forming galaxy
When considering a star-forming galaxy as a whole, we needto integrate the emission lines resulting from the effects of dif-ferent stellar populations. This cannot simply be obtainedbycalculating the ionizing photon fluxesQH, QHe, andQO of theintegrated spectrum and by getting the corresponding line in-tensities from our interpolation tables. Indeed, the intensity ofmetal lines also depends on the hardness of the ionizing spectraand on the ionization parameter. To obtain a more realistic de-scription of the nebular emission, it is then necessary to modelthe formation and evolution of the population of H regions,each one characterized by a different intensity, hardness andionizing parameter. This may be accomplished by splitting therecent SF history in subsequent episodes of suitable duration,and by computing their separate contributions to the emissionlines.
The total emission in the linel (El) at the epoch of obser-vationT , may be written as
El =∑
j
NH ii, jE∗l (Q∗H, j,Q
∗He, j,Q
∗O, j, Zgas) , (5)
whereNH ii, j is the number of H regions that have formed inthe time interval [T−t j+1, T−t j], Q∗H,He,O, j are the correspondingionizing photon fluxes,Zgas is the current metallicity of the gasandE∗l is the emission from the single H region.
NH ii, j is obtained by assuming that each H region is illu-minated by a single cluster of total massM∗, so that
NH ii, j =
∫ t j+1
t jΨ(T − t)dt
M∗, (6)
whereΨ is the SFR.Q∗H, j for the single H region at differentages can be obtained by
Q∗H, j =∫ ∞
νH
L∗ν, j
hνdν =
=
∫ ∞
νH
∫ t j+1
t jΨ(T − t)(S ν(t, Z(T − t))/hν)dtdν
NH ii, j(7)
where we have emphasized the dependence on the metallicityof the ionizing spectra. Similar expressions hold forQ∗He, j, andQ∗O, j.
The emission properties of thej population depend on theratios Q∗He, j/Q
∗H, j and Q∗O, j/Q
∗He, j, that are constrained by the
age of thej population, and on the average ionization parameterof the H regions〈U〉∗j.

P. Panuzzo et al.: Dust and Nebular Emission. I. Models for Normal Galaxies. 7
The correspondence between the integrated Lyman contin-uum of the populationj (expressed byNH ii, j×Q∗H, j) and〈U〉∗j isdetermined by the stellar massM∗ of ionizing clusters throughequations 6, 7 and
〈U〉∗j =3α2/3
B
4c
3Q∗H, jnHǫ2
4π
1/3
. (8)
As shown in Fig. 4, H galaxies exhibit a big variation of theionization parameter value, which means that the value of stel-lar massM∗ and/or of the filling factor are subject to substantialvariations. Observations (e.g. Kennicutt 1984) suggest that M∗
varies approximately from 1000 to 106 M⊙ andǫ from 0.1 to0.001.
The duration of the subsequent episodes in which we splitthe SF history should be chosen by considering the evolutionof the shape of the ionizing spectra. A lower limit is set byconsidering that each H region will be illuminated by all thestars formed within the finite formation time of a typical starcluster, that we assume to be 1 Myr (see e.g. Fuente et al. 2001).
As remarked in Sect. 2.2.1, the presence of dust inside H
regions can be important. Thus one can multiply the nebularemission obtained from eq. 5 by a factor 1− fd.
Finally, the emission lines are extinguished in the same wayas the stellar populations that produced them (see Sect. 2).
In galaxies with normal dust content, almost all the pho-tons in the resonant Lyα line are reprocessed via two-photondecay and dust absorption and re-emission. In our model weassume that all Lyα photons decade via two-photons emission,and then these photons are possibly absorbed by dust. Anyhow,their contribution to the IR luminosity amounts to≤ 10%. Onlyin the case of very low dust content, the relative contributionof absorbed Lyα photons increases respect to the contributionfrom absorbed stellar continuum and may be significant. A de-tailed treatment of the Lyα transfer should also include the ef-fects of winds and outflows, which strongly reduce the resonantscattering.
We conclude this section by comparing our method withother approaches found in literature.
Fioc & Rocca-Volmerange (1997) computedQH from theintegrated spectrum and then analytically obtain the Hβ line in-tensity. Other hydrogen and metals lines are then rescaled infixed proportions. Moy et al. (2001) have improved the previ-ous model by coupling the integrated spectrum with CLOUDY.
A more detailed analysis of emission properties in starforming galaxies is by CL01. These authors obtained the emis-sion from the galaxy by summing the line intensities of sep-arate SSPs of given constant average metallicity, weightedbythe corresponding SFR. CL01 also have a more detailed modelfor dust absorption (see Charlot & Fall 2000) that accounts foran age selective extinction.
Compared to MRF01, our model accounts for the coexis-tence of different populations of H regions, while at variancewith CL01, it quickly computes the line emissions for differentchoices ofM∗ and gas density. Also, the H regions library canbe used for different IMFs, and we relax the hypothesis that themetallicities of the excited gas and of the ionizing stellarpopu-lation are the same (but a non-negligible difference is expected
only in extreme situations). Finally, our library can be easilyused for other population synthesis models.
4. Attenuation properties of normal star forminggalaxies
In star forming galaxies, the intrinsic UV luminosity is directlyrelated to the star formation rate; on the other hand, the UVflux is heavily affected by extinction. Therefore it is importantto understand how dust absorption affects the UV luminosityand, as a consequence, the SFR estimates.
In this section we discuss several methods to estimate theattenuation in normal star forming galaxies by consideringtheUV, optical emission lines and FIR properties. We will showthat observations require the extinction of different stellar pop-ulations to vary with age, with younger populations suffering alarger extinction.
Notice that we will use the termattenuation when it refersto the amount of light lost at a give wavelength from a complexsystem (i.e. a galaxy) and the termextinction for the light lostfrom a simple source (as a star) with dust along the line of sight.
4.1. Estimation of UV attenuation
Attenuation in local star forming galaxies can be derived inseveral ways.
A common method is to relate the UV attenuation to theattenuation in Hα. Calzetti (1997) suggested that the attenua-tion of the stellar continuum is only a fraction (∼ 0.44) of theattenuation of the ionized gas. By extending this assumption tothe UV while adopting a suitable extinction law, it is straight-forward to obtain (atλUV = 2000 Å, e.g. Buat et al. 2002)
A2000= 1.6AHα . (9)
The gas attenuation at Hα is derived from the Balmer decre-ment:
AHα = 1.0861
eβα − 1ln
(
jHβjHα
LHα
LHβ
)
, (10)
whereeβα = τHβ/τHα is derived from the adopted extinctionlaw andjHβ/ jHα is the ratio of Hβ and Hα emission coefficients(typically assumed 2.87 at an electronic temperature of 104 K,see Osterbrock 1989).
An alternative method to derive the UV attenuation is toconsider the reprocessing of star light into the infrared emis-sion. Meurer et al. (1999) (see also Calzetti et al. 2000) as-sumed that the energy re-emitted by dust in a galaxy is providedprimarily by the UV flux of young star populations. They re-lated (eq. 10 of their paper) the ratio between the FIR and UVfluxes (nowλ = 1600 Å), FFIR/F1600, to the UV attenuationby:
A1600= 2.5 log
(
FFIR
0.84F1600+ 1
)
, (11)
where the infrared fluxFFIR is defined as the flux in the [40–120]µm interval derived from the 60 and 100µm IRAS bands(Helou et al. 1988), andF1600= λ1600· f1600 (in W cm−2). Notethat this relation was derived for starburst galaxies.

8 P. Panuzzo et al.: Dust and Nebular Emission. I. Models for Normal Galaxies.
In the same framework, Buat et al. (1999) proposed a re-lation between the UV attenuation and theFFIR/FUV ratio(λUV = 2000Å), which is suited for normal star forming galax-ies:
A2000= 0.466+ log
(
FFIR
F2000
)
+ 0.433
[
log
(
FFIR
F2000
)]2
. (12)
Buat et al. (2002, hereafter B02) compared theAUV derivedfrom the ratioFFIR/FUV (eq. 12) with the attenuation sufferedby Hα in a sample (called SFG sample) of normal star form-ing galaxies. The SFG sample consists of 47 spiral and irregu-lar galaxies in nearby clusters. They were observed in the UV(λUV = 2000 Å) with the SCAP, FOCA and FAUST instru-ments (Boselli et al. 2001), in the optical (Gavazzi et al. 2002),and in the FIR by IRAS. The galaxies were selected to haveEW(Hα)> 6 Å in order to minimize the errors in Hα and Hβfluxes. Galaxies with Seyfert activity were excluded from thesample. Metallicity of the galaxies in the sample ranges from∼ Z⊙/4 to∼ 2Z⊙.
Fig. 5. On the ordinate,A2000 derived from the ratioFFIR/F2000
(using eq. 12); on the abscissa,AHα from Balmer decrement.Filled circles show SFG sample data. Lines connect models(see Sect. 4.2) with the sameMG and star formation history,but differentτMC. Solid lines:MG = 1011 M⊙, νsch= 0.3 Gyr−1,τinf = 18 Gyr, solar metallicity; dashed lines:MG = 1010 M⊙,νsch = 0.7 Gyr−1, τinf = 6 Gyr, solar metallicity. To empha-size the dependence on metallicity, we show the first model(solid lines) forτesc = 3 Myr but Z = 0.04 (dot-dashed line)or Z = 0.004 (dotted line). For simplicity only models withθ = 45◦ are shown here.
In Fig. 5 we report the attenuation in Hα versus the value ofAUV derived from the ratioFFIR/FUV for the SFG sample, as inFig. 2 of their paper. As pointed out by Buat and collaborators,the two quantities show a lack of correlation, contrary to whatis expected from eq. 9.
Table 1. Values of the relevant parameters used to model nor-mal star forming galaxies. Ref. model: see Sect. 5.
Param. All models Ref. modelτinf 6 – 18 Gyr 12 Gyrνsch 0.3 – 0.7 Gyr−1 0.3 Gyr−1
MG 1010 – 1011 M⊙ 1010 M⊙Z 0.004 – 0.04 0.02τesc 1 – 9 Myr 3 MyrτMC 0.1 – 1.25 0.5θ 0◦ – 90◦
fd 0.3 0.3
4.2. AUV in simulated normal star-forming galaxies
In order to give an interpretation of this observational problem,we simulated a set of disk galaxies by exploring the space ofparameters appropriate for normal star forming galaxies. Wecomputed the star formation history, gas fraction and metalen-richment with our chemical evolution code (Silva et al. 1998).In order to point out the dependence of the results on metallic-ity, we considered different values for the metallicity of starsand gas obtained from the chemical code.
The parameters that regulate the star formation history inour models are the baryonic mass of the galaxy (MG), the gasinfall time scale (τinf ), and the star formation efficiencyνsch ofthe assumed linear Schmidt law. The age of the galaxies hasbeen set to 10 Gyr. The parameters that regulate the attenua-tion are the escape timeτesc, the optical thickness of MC at 1µm (τMC), and the orientationθ of the disk galaxy with respectto the celestial plane (θ = 0◦ means face-on models). The dust(extinction and emission) properties are similar to the galacticone (see Silva et al. 1998 for more details). The dust/gas ra-tio is assumed to be proportional to the metallicity. Emissionlines are computed for different gas densitiesnH, filling factorsǫ and stellar masses of clustersM∗; however we concentrateon H recombination lines that do not depend onnH, M∗ or ǫ.Table 1 summarizes the values of the parameters used in ourcomputations.
The models are compared with data in Fig. 5; the attenua-tion at Hα is derived from the Balmer decrement (eq. 10, wherewe assumeeβα = 1.47), while the attenuation in UV has beenderived by using eq. 12. For simplicity, we only represent themost dusty (solid lines) and less dusty (dashed lines) models;all other cases range between the two. Models refer to a 45◦
inclination; face-on models show a slightly lower attenuation,while edge-on models have larger attenuations and scatter.
The models cover quite well the location of the observedgalaxies in this diagram and confirm a real lack of correlationbetween the UV attenuation, as derived from theFFIR/FUV ra-tio andAHα.
In order to clarify the origin of this scatter and to identifya good estimator of UV attenuation, we contrast the intrinsicUV attenuation – directly extracted from our models (AUV =
−2.5 log(LUV/LUV0)) – respectively withAHα from the Balmerdecrement andFFIR/FUV (see Figs. 6 and 7).

P. Panuzzo et al.: Dust and Nebular Emission. I. Models for Normal Galaxies. 9
Fig. 6. UV attenuation in the models versus the attenuation atHα derived from the Balmer decrement. Almost vertical linesconnect models with the same optical thickness of MC (τMC)and escape time (τesc), but different SF histories and dust con-tent in cirrus. Only the less and most dusty models are associedto symbols which refer to the escape time. The thick solid linerefers to equation 9.
4.2.1. Attenuation from Balmer decrement
The scatter in Fig. 6 must be entirely ascribed to the interplaybetween the different stellar lifetimes associated to the emis-sion properties and the geometry set by the critical escape time.In fact, Hα is mainly produced by ionizing massive stars witha lifetime around 3 Myr, while UV is also emitted by less mas-sive and longer-living stars. We may devise the following typi-cal cases.
Escape time shorter than the typical lifetime of an ionizingstar: crosses. Independently ofτMC, the models tend to definea relation which seems however steeper than eq. 9. This is dueto the fact that both Hα and UV emissions are mainly producedoutside MCs, so that they do not respond to differences inτMC
and the attenuation is mainly due to the diffuse medium.Escape time longer than the typical lifetime of an ionizing
star: triangles. Emission lines are produced only inside MCs,soAHα essentially measuresτMC. WhenτMC > 0.5 the UV fluxproduced inside MCs is completely reprocessed into the IR.Thus,AUV saturates whileAHα still increases. This results in analmost horizontal displacement in Fig. 6.
Escape time comparable to the typical lifetime of an ioniz-ing star: open squares. At increasingτMC, the Hα to Hβ ratioincreases from the emitted value to a maximum value fixed bythe Hβ emitted outside the MCs and by the sum of the Hα stillcoming from within the MCs (the attenuation is lower at Hαthan at Hβ) and from outside. Then the ratio decreases again tothe asymptotic value fixed by the attenuation of the diffuse gas.This causes a behavior that is intermediate between the formertwo cases and, in particular, gives rise to the turnover shownat highτMC. As a consequence, the attenuation in Hα derivedfrom the Balmer decrement is underestimated.
Fig. 7. UV attenuation vs the ratioFFIR/FUV ; lines refer to eq.11, eq. 12 and our fits.
The variation in dust content of the galaxy and/or of the in-clination, at constantτMC andτesc, shifts the models in Fig. 6along a constant direction, somewhat steeper than that of eq. 9;furthermore, a variation in metallicity corresponds to a varia-tion of the amount of dust which varies the attenuation due tothe diffuse component. These effects add further dispersion tothe data.
Our models suggest that galaxies in Fig. 5 withAHα ≥ 1.5mag may be characterized by escape times larger than the typ-ical lifetime of the ionizing stars. Models withAHα ≥ 2.5 havean equivalent width EW(Hα) lower than 6Å; there are sev-eral possible explanations for the higher observedAHα withlarge EW(Hα), such as a small burst (increasing the equiva-lent width), or an underestimate of Hβ or [N ] lines (givinghigherAHα).
The results of models and observations described abovepoint out that age selective extinction is present in normalstar-forming galaxies and complicates the picture of extinctioningalaxies. The simple hypothesis of screen extinction does notwork in this kind of galaxies; different ways to compute atten-uation give inconsistent results because they rise from specificpopulations (ionizing and non-ionizing UV emitters) that havedifferent lifetimes and live at different optical depths.
4.2.2. Attenuation from the continuum
A more robust estimation of the UV attenuation can be ob-tained by considering the energy reprocessed by dust in the IR.
In Fig. 7 we plot the intrinsicAUV against the ratioFFIR/FUV. The solid line represents eq. 12 and the short dashedline refers to eq. 113. Models show that, contrary to the case ofBalmer decrement, the UV attenuation correlates quite tightlywith the FFIR/FUV ratio. The origin of this correlation is thatthe FIR flux is essentially provided by the UV emission of
3 To convert attenuation at 1600 Å of eq. 11 intoAUV at 2000Å we assumeF1600 = F2000 and A2000 = 0.9 · A1600 = 0.9 ·2.5 log(FFIR/0.84F2000+ 1), as in B02.

10 P. Panuzzo et al.: Dust and Nebular Emission. I. Models forNormal Galaxies.
young stellar populations as assumed by Meurer et al. (1999)and Buat et al. (1999). Thus, theFFIR/FUV measures the ra-tio between the reprocessed energy flux and the residual en-ergy flux in the UV. Outside the MCs, a contribution to the FIRcomes from the optical emission of old stellar populations;thiscauses a dispersion around the average relation.
Similar results were obtained by Gordon et al. (2000); theirmodels show that theAUV–FFIR/FUV relationship is valid fordifferent assumptions on dust properties. The dispersion foundby Gordon et al. (2000) is much smaller than in our simulations,but in their models all the stellar populations suffer the sameextinction (i.e. no dependence on age is introduced).
Models also show that edge-on systems tend to follow adifferent relation from what is found for face-on systems; thisis due to the greater contribution of the diffuse medium to at-tenuation in the direction of the plane of the galaxy.
Our models suggest the following relation for face-on sys-tems:
A2000= 2.5 log
(
FFIR
1.25F2000+ 1
)
; (13)
while for edge-on systems it is preferable to use
A2000= 2.03 log
(
FFIR
0.5F2000+ 1
)
. (14)
In Fig. 7 we also compared the relations proposed byMeurer et al. (1999) (eq. 11) and by Buat et al. (1999) (eq. 12)with models. The former seems to better agree with our model,and lies between face-on and edge-on models, while the sec-ond tends to underestimate the UV attenuation (but only by 0.8mag in the least favorable case).
Meurer et al. (1999) showed that the observed locus inthe diagramFFIR/FUV vs the UV spectral indexβ in starburstgalaxies could be well reproduced by a screen dust model withincreasing optical thickness. They obtained the followingrela-tion betweenAUV andβ:
A1600= 4.43+ 1.99β . (15)
Recently, Bell (2002) compared the spectral indexβ withAUV(FIR/UV) for a sample of normal star-forming galaxiesand found thatβ is typically greater (redder) than the expectedvalue for starbursts.
We also found a looseβ−AUV correlation for disk galaxies.Indeed, it is worth noticing that in these galaxies the contribu-tion from stars outside star forming regions is quite substantialand can significantly affect even the UV slope.
5. SFR estimators
In the previous section we justified the tangled relation betweenthe attenuation properties of star forming galaxies as seenatdifferent wavelengths, by means of a model that accounts forthe complex interplay between geometry, obscuration time andstellar lifetimes.
Using these models, we have obtained calibrations of theSFR for a wide range of different observables from the UV tothe radio regime. Only models withτesc≤ 9 My are used here
Table 2. Calibrations of SFR (SFR/Luminosity) from dustemission, in 10−37 M⊙yr−1W−1 (or a: 10−33 M⊙yr−1W−1Å), andfrom UV luminosity (lower panel, in 10−23 M⊙yr−1W−1Hz).
Band SFR/L ∆(SFR/L)IR8−1000 3.99 3.12–7.39IR 4.98 3.62–8.93FIR 8.82 6.12–16.4PAH 7.7µm 46.7 31.3–81.5aISO LW3 79.9 70.9–135.MIPS 24 48.0 34.6–114.MIPS 70 9.23 6.19–17.0MIPS 160 7.66 6.15–13.7UV 284.5 103.4-622.8UVβ 125.9 92.7-184.0UVFIR 104.5 90.7-114.5
because the majority of the data in Fig. 5 can be explained withshort escape times,≃ 3 Myr, in agreement with other evidencescoming from the analysis of the UV SEDs and from the numbercounts in HR diagrams of massive stars (Silva et al. 1998). Inorder to give a useful reference value of the calibration, weselected a reference model whose parameters are summarizedin Table 1. This model is represented by a star in Fig. 5. Unlessotherwise specified, all calibrations refer to a Salpeter IMF withminf = 0.15 M⊙ andmup = 120 M⊙ and solar metallicity.
5.1. SFR from the continuum
Infrared luminosity is one of the most common SFR estimators.The interstellar dust is able to convert in IR emission a substan-tial fraction of the UV light emitted by young stars. Thus, theIR luminosity is proportional to the SFR.
The relation between the SFR and the infrared luminosityis summarized in Table 2. The first column indicates the ob-served quantity, the second column provides the value of thecalibration for the reference model described above, and thelast column provides the range of variation of the calibrationamong the set of models.
The row labeled IR8−1000 refers to the total dust emissionfrom 8 to 1000µm, while IR refers to the infrared emissionestimated with the four IRAS bands (Sanders & Mirabel 1996)and FIR refers to the far-infrared emission estimated from the60 and 100µm IRAS bands (as described in Helou et al. 1988).
In the following rows of Table 2, we show the calibration ofthe specific luminosity at the peak of the PAH emission featureat 7.7µm (PAH 7.7µm), the flux in the ISO band LW3, and theSIRTF experiment MIPS at 24µm, 70µm and 160µm.
The infrared estimators exhibit larger variations in normalstar-forming galaxies than in starburst galaxies. Inspection ofthe above table shows that the calibrations can vary by up to80% around the reference model. In the case of normal galax-ies a considerable part of radiation from young stars is not ab-sorbed by MCs clouds, so that variations in the duration of theobscuration by MCs and in the optical depth of MCs producean important change in IR emission. Furthermore, the absorp-
P. Panuzzo et al.: Dust and Nebular Emission. I. Models for Normal Galaxies. 11
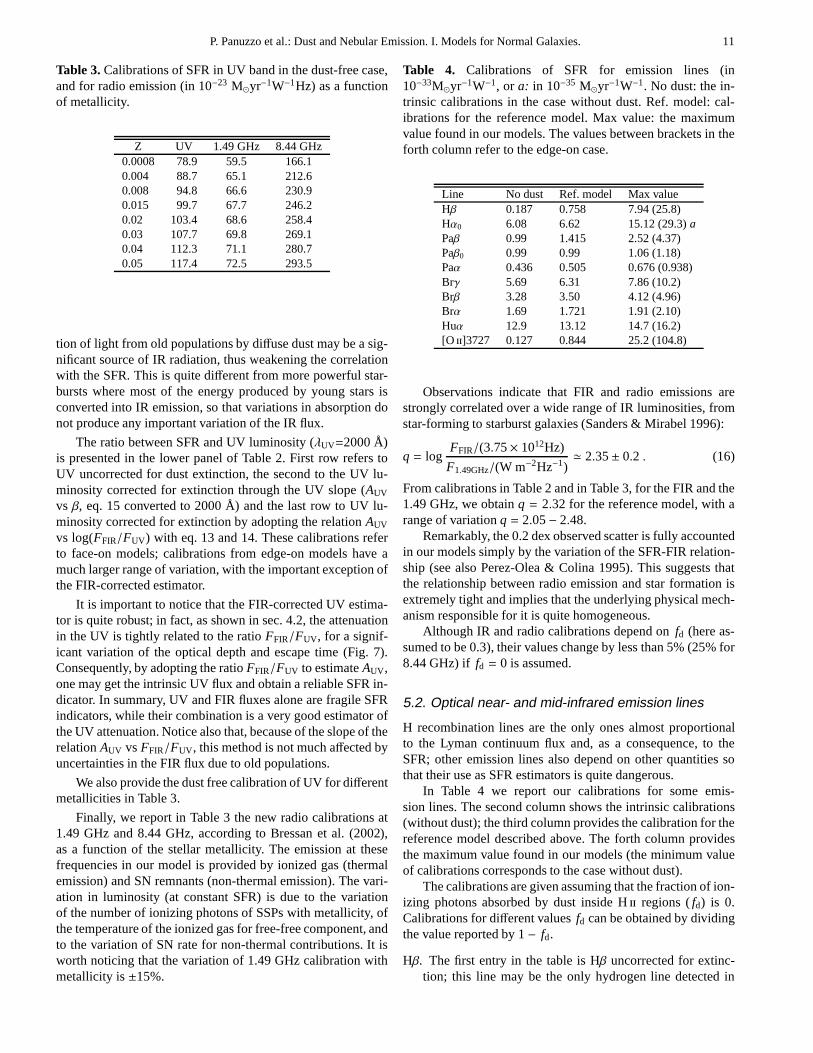
Table 3. Calibrations of SFR in UV band in the dust-free case,and for radio emission (in 10−23 M⊙yr−1W−1Hz) as a functionof metallicity.
Z UV 1.49 GHz 8.44 GHz0.0008 78.9 59.5 166.10.004 88.7 65.1 212.60.008 94.8 66.6 230.90.015 99.7 67.7 246.20.02 103.4 68.6 258.40.03 107.7 69.8 269.10.04 112.3 71.1 280.70.05 117.4 72.5 293.5
tion of light from old populations by diffuse dust may be a sig-nificant source of IR radiation, thus weakening the correlationwith the SFR. This is quite different from more powerful star-bursts where most of the energy produced by young stars isconverted into IR emission, so that variations in absorption donot produce any important variation of the IR flux.
The ratio between SFR and UV luminosity (λUV=2000 Å)is presented in the lower panel of Table 2. First row refers toUV uncorrected for dust extinction, the second to the UV lu-minosity corrected for extinction through the UV slope (AUV
vs β, eq. 15 converted to 2000 Å) and the last row to UV lu-minosity corrected for extinction by adopting the relationAUV
vs log(FFIR/FUV) with eq. 13 and 14. These calibrations referto face-on models; calibrations from edge-on models have amuch larger range of variation, with the important exception ofthe FIR-corrected estimator.
It is important to notice that the FIR-corrected UV estima-tor is quite robust; in fact, as shown in sec. 4.2, the attenuationin the UV is tightly related to the ratioFFIR/FUV, for a signif-icant variation of the optical depth and escape time (Fig. 7).Consequently, by adopting the ratioFFIR/FUV to estimateAUV ,one may get the intrinsic UV flux and obtain a reliable SFR in-dicator. In summary, UV and FIR fluxes alone are fragile SFRindicators, while their combination is a very good estimator ofthe UV attenuation. Notice also that, because of the slope oftherelationAUV vs FFIR/FUV , this method is not much affected byuncertainties in the FIR flux due to old populations.
We also provide the dust free calibration of UV for differentmetallicities in Table 3.
Finally, we report in Table 3 the new radio calibrations at1.49 GHz and 8.44 GHz, according to Bressan et al. (2002),as a function of the stellar metallicity. The emission at thesefrequencies in our model is provided by ionized gas (thermalemission) and SN remnants (non-thermal emission). The vari-ation in luminosity (at constant SFR) is due to the variationof the number of ionizing photons of SSPs with metallicity, ofthe temperature of the ionized gas for free-free component,andto the variation of SN rate for non-thermal contributions. It isworth noticing that the variation of 1.49 GHz calibration withmetallicity is±15%.
Table 4. Calibrations of SFR for emission lines (in10−33M⊙yr−1W−1, or a: in 10−35 M⊙yr−1W−1. No dust: the in-trinsic calibrations in the case without dust. Ref. model: cal-ibrations for the reference model. Max value: the maximumvalue found in our models. The values between brackets in theforth column refer to the edge-on case.
Line No dust Ref. model Max valueHβ 0.187 0.758 7.94 (25.8)Hα0 6.08 6.62 15.12 (29.3)aPaβ 0.99 1.415 2.52 (4.37)Paβ0 0.99 0.99 1.06 (1.18)Paα 0.436 0.505 0.676 (0.938)Brγ 5.69 6.31 7.86 (10.2)Brβ 3.28 3.50 4.12 (4.96)Brα 1.69 1.721 1.91 (2.10)Huα 12.9 13.12 14.7 (16.2)[O ]3727 0.127 0.844 25.2 (104.8)
Observations indicate that FIR and radio emissions arestrongly correlated over a wide range of IR luminosities, fromstar-forming to starburst galaxies (Sanders & Mirabel 1996):
q = logFFIR/(3.75× 1012Hz)
F1.49GHz/(W m−2Hz−1)≃ 2.35± 0.2 . (16)
From calibrations in Table 2 and in Table 3, for the FIR and the1.49 GHz, we obtainq = 2.32 for the reference model, with arange of variationq = 2.05− 2.48.
Remarkably, the 0.2 dex observed scatter is fully accountedin our models simply by the variation of the SFR-FIR relation-ship (see also Perez-Olea & Colina 1995). This suggests thatthe relationship between radio emission and star formationisextremely tight and implies that the underlying physical mech-anism responsible for it is quite homogeneous.
Although IR and radio calibrations depend onfd (here as-sumed to be 0.3), their values change by less than 5% (25% for8.44 GHz) if fd = 0 is assumed.
5.2. Optical near- and mid-infrared emission lines
H recombination lines are the only ones almost proportionalto the Lyman continuum flux and, as a consequence, to theSFR; other emission lines also depend on other quantities sothat their use as SFR estimators is quite dangerous.
In Table 4 we report our calibrations for some emis-sion lines. The second column shows the intrinsic calibrations(without dust); the third column provides the calibration for thereference model described above. The forth column providesthe maximum value found in our models (the minimum valueof calibrations corresponds to the case without dust).
The calibrations are given assuming that the fraction of ion-izing photons absorbed by dust inside H regions (fd) is 0.Calibrations for different valuesfd can be obtained by dividingthe value reported by 1− fd.
Hβ. The first entry in the table is Hβ uncorrected for extinc-tion; this line may be the only hydrogen line detected in

12 P. Panuzzo et al.: Dust and Nebular Emission. I. Models forNormal Galaxies.
the spectra of intermediate–redshift galaxies and, in thatcase there is no way to correct it for extinction. The cali-bration we provide here shows that for a typical SFR of afew M⊙/yr, the inferred SFR may be underestimated by afactor of three.
Hα0. The Hα0 row refers to the Hα luminosity corrected forextinction using the Balmer decrement (eq. 10). We noticethat the decrement has been evaluated from comparisons ofthe observed ratio of the intensity of the emissions at Hαand Hβ with the expected ratio. We did not attempt to sim-ulate a real measure of the Balmer decrement in a syntheticspectrum. Thus, our calibration assumes that one is able tocorrect the lines for the contribution of the underlying olderpopulations.It is worth noticing that, due to the age selective extinction,the calibration may change by a factor of two, or even morebecause the extinction at Hα is underestimated, as demon-strated in Sect. 4.2.1, when the escape time is similar to thelifetime of ionizing stars.Another factor of uncertainty is provided by the orientationof the observed galaxy because the extinction from diffusemedium is characterized by a mixed geometry, which tendsto produce a higher ratio between attenuation and redden-ing than for the screen geometry.
Paβ, Paβ0. In Table 4 then Paβ follows, either uncorrected orcorrected (Paβ0) for extinction, assuming that the intrinsicvalue of Paβ/Brγ is 5.65 (andτPaβ/τBrγ = 2.95). In thiscase the extinction is lower and the SFR can be obtainedwith a large accuracy. However, it must be kept in mindthat at these wavelengths uncertainties in the photometryof different wavebands may constitute the larger source ofuncertainty in the estimated extinction (eg. Calzetti et al.1996).
Paα. The table continues with Paα uncorrected for extinction.This line sits at the short wavelength border of the K band(λ=18752Å); like Hβ, it may be detected by ground obser-vations only in the spectra of intermediate redshift galaxies.
Brγ, Brβ, Brα, Huα. The following entries in the table areBrγ, Brβ, Brα and Huα uncorrected for extinction. As ex-pected, the extinction effects decrease when the wavelengthincreases, except for Huα (λ = 12.369µm) that falls in theabsorption feature of silicates.
[O ]3727. The table closes with the [O]3727 line uncor-rected for extinction (note we only use solar metallicity).The importance of this line is that in high redshift galax-ies this is the only bright line that, once redshifted, remainsin the optical domain. Recently, Jansen et al. (2001) inves-tigated the use of this line as SFR tracer, and found thatSFR estimations by means of [O]3727 agree with the Hα0
value, as long as the line intensity is corrected for extinc-tion and calibrated for metallicity. However, it is not pos-sible to perform these corrections without observing otherlines that (if visible) are better estimators of SFR; thereforewe conclude that [O]3727 is a poor indicator of SFR.
6. Infrared nebular metallic lines
The IR spectral range contains numerous bright forbidden fine-structure lines that are excellent diagnostics of gas density,hardness of the exciting radiation field and abundance of im-portant elements.
6.1. Density and ionizing spectrum hardnessdiagniostics
Different IR fine structure transitions of the same ion havedifferent sensitivity to collisional deexcitation. This can beused to identify the typical electron density of the emittinggas (Rubin et al. 1994). Typical line pairs used for this pur-pose are [Ar]21.8µm/9µm, with a maximum sensitivity tothe electron density at log(ne) = 4.7, [Ne]36/15.5µm (log(ne)= 4.7), [O]52/88µm (log(ne) = 2.9), [S]19/33µm (log(ne)= 3.5), and [N]122/205µm (log(ne) = 1.8). Though collisionstrengths for these lines may need to be reexamined (Rubinet al. 2001), it appears that they can trace the density of theemitting gas over a wide range, fromnH = 10 cm−3 to nH =
105cm−3, i.e. possibly encompassing the typical densities ofstar forming regions in normal galaxies as well as in compactobscured starbursts (Bressan et al. 2002).
The hardness of the ionizing spectrum and the average ion-ization parameter may be derived by analyzing ratios of lineintensities in different ionization stages of suitable elements.Typical ratios are [Ne]/[Ne ], [Ar ]/[Ar ] and [S]/[S ](e.g. Giveon et al. 2002). Our model can be used to obtain in-formation on the age of the ionizing stellar population and onthe ionization parameter in single H regions or in starbursts ofshort duration. In other conditions, this method will only pro-vide the average values for these quantities. We will explorethese topics in a forthcoming paper.
6.2. Abundance determinations
It is straightforward to extend to the infrared the method usedfor abundance determinations for optical lines. This method isbased on the ratio between the sum of the intensities of themost abundant ions of an element, and that of a hydrogen re-combination line (typically the Brα line). It works as long asthe current density is lower than the critical density for colli-sional deexcitation.
In the near- and mid-infrared the elements to which wecan apply the above method are neon ([Ne]15.5µm and[Ne ]12.8µm), argon ([Ar]9µm and [Ar]7µm) and sulphur([S ]10.5µm, [S]18.7µm and [S]1.03µm). Suitable cali-brating relationships can be found in Giveon et al. (2002) andVerma et al. (2003).
In the far-infrared the method is applicable only to nitrogen([N ]122µm and [N]57µm). For these lines we have derived

P. Panuzzo et al.: Dust and Nebular Emission. I. Models for Normal Galaxies. 13
Fig. 8. The relationship between nitrogen abundance (relativeto hydrogen) andN23 (defined by eq. 18) for models with differ-ent densities and ionization parameters. The dashed line showsa linear fit to models withZ < 0.015.
the following calibrations with respect to the Brα line (for dif-ferent assumptions on the electronic temperatureTe):
NH=
1.907· 10−5 (
L[N ii]122 + 0.247L[N iii]57)
/LBrα
for Te = 10000 K
3.546· 10−5 (
L[N ii]122 + 0.231L[N iii]57)
/LBrα
for Te = 5000 K
(17)
where N/H is the nitrogen abundance respect to hydrogen. Therelevant transition data have been taken from Lennon & Burke(1994), Peng & Pradhan (1995) and Storey & Hummer (1995).
It is worth noticing that this method requires the measure-ment of the intrinsic intensity of a hydrogen recombinationline. Thus, it is not applicable when these lines are not acces-sible, either because of instrumental limitation or for very highextinction. In this case, we suggest to adopt another indicatortightly correlated with the intrinsic intensity of hydrogen re-combination lines or, equivalently, with the SFR. The best SFRindicator we have found is the radio luminosity (Table 3). Tothis purpose, we have run a set of models varying the metallic-ity of the gas (from Z=0.0008 to Z=0.05), the hydrogen den-sity, from 10 to 100 cm−3, and the ionization parameter. Thelatter is a function of the mass of ionizing clustersM∗, andof the filling factor ǫ through eq. 8. We stress that the emis-sion lines resulting from quiescent star forming galaxies arethe sum of the emission of H regions of different ages, so thatthere is not a single ionization parameterU at work. However,since all the ionization parameters scale linearly with thequan-tity m ≡ (M∗ǫ2)1/3, we have changedm from 0.7 to 70M1/3
⊙
to simulate a similar range of variation ofU. The fraction ofionizing photon absorbed by dust was assumed to befd = 0.3.
Fig. 8 shows the relationship in our models between thenitrogen abundance and the ratioN23 defined as
N23 =(
L[N ii]122 + 0.247L[N iii]57)
/L1.49GHz . (18)
We notice that the metallicity is well determined for valuesbe-low solar. For higher values the relation steepens considerablymaking the determination of the metal content quite uncertain.
A linear fit to models in which the metallicity is lower than0.015 is plotted in Fig. 8; its analytical expression is
log
(
NH
)
= −18.21+ 1.203 logN23 , (19)
whereN23 is given in hertz.We stress that this relation holds as long as the density is
below the critical density for collisional de-excitation of the[N ]122µm transition (ne ∼ 300 cm−3).
A similar calibration could be obtained by adopting the FIRluminosity instead of the radio luminosity. However, in thecaseof disk galaxies the relation between the FIR luminosity andtheSFR is not as tight as that between the radio luminosity and theSFR (see Table 2). This would introduce a significant scatterinthe calibration.
7. Discussion
The first application of the model presented in this work is theanalysis of attenuation in quiescent star-forming galaxies.
These galaxies exhibit a poor correlation between the atten-uation in the UV band and Hα (B02, see also Fig. 5), with theformer generally lower than what expected from the latter onthe basis of the simple lawAUV = 1.6AHα (eq. 9). Our modelexplains this poor correlation in the context of age selectiveextinction. As the extinction in the UV is very high, the contri-bution to the observed UV flux from stars outside the molecularclouds is important even for relatively small optical thicknesses(τMC). It is worth noticing that the fraction of young UV emit-ting stars outside MCs increases for decreasing escape time,while very young stars (which ionize the gas) spend most oftheir life inside MCs. Therefore, above a threshold value forτMC which depends on the escape time, an increase ofτMC pro-duces an attenuation in Hα larger than that in UV.
Thus, neither observations nor modeling support the as-sumption of a constant relationship between the attenuationsuffered by the continuum and the attenuation for the gas, atleast for a current SFR smaller than 10 M⊙/yr. As a conse-quence, the results of Calzetti (1997) (Astars
6563/AgasHα ∼ 0.44) can-
not be extrapolated from starbursts to disk star-forming galax-ies.
Moreover, the extrapolation of the Hα attenuation to theUV through the previous reported simple law yields UV cor-rected fluxes larger than those expected from Hα correctedfluxes, as found by Sullivan et al. (2000, 2001). These authorsexplain the result by introducing star formation historiesthatchange rapidly with time and/or a more complex model of ex-tinction. On the other hand, our model explains this result as anatural consequence of the age selective extinction.
An additional interesting issue is that the attenuation inHα derived from the Balmer decrement can be underestimated,since in disk galaxies the escape time and the lifetime of verymassive stars is often similar.
The comprehensive treatment of nebular and continuumemission allows to conclude that the assumption of a con-

14 P. Panuzzo et al.: Dust and Nebular Emission. I. Models forNormal Galaxies.
Table 5. Comparison of some calibrations of SFR with resultsfrom previous works. Calibrations are referred to a SalpeterIMF between 0.1 and 100 M⊙. Reference:a: Kennicutt (1998),b: Haarsma et al. (2000).
This work othersUV 1.20 1.4 · 10−21 M⊙yr−1W−1Hz aIR8−1000 4.63 4.5 · 10−37 M⊙yr−1W−1 aHα 7.05 7.9 · 10−35 M⊙yr−1W−1 a1.49 GHz 79.6 123.3 · 10−23 M⊙yr−1W−1Hz b
stant extinction for all stellar populations is not satisfactory.However, the detailed models presented in this work indi-cate thatAUV can be accurately estimated by using the ratioFFIR/FUV (cfr. eqs. 13 and 14). This conclusion holds providedthat the main contribution to FIR comes from the absorbed UVradiation of young stars, but it does not depend on the escapetimes and on the extinction properties of dust. The relation-ships we obtain are intermediate between those by Buat et al.(1999) and by Meurer et al. (1999), the latter derived for star-burst galaxies.
By using our set of simulated disk galaxies, we calibrateddifferent SFR estimators, collected in Tables 2, 3 and 4. Somecalibrations may be compared with values obtained in the lit-erature. In particular we compare the results with Kennicutt(1998) (UV, IR and Hα) and Haarsma et al. (2000) (radio);these comparisons are summarized in Table 5, after a small cor-rection factor (1.16), which accounts for the slightly differentIMF adopted, is applied to our estimates.
There is a good agreement for Hα, UV and IR calibrations(note that Kennicutt 1998 uses the notation FIR for the totaldust emission between 8 and 1000µm), while our calibrationfor the radio emission is a factor 1.5 smaller than that proposedby Condon (1992) and Haarsma et al. (2000), and a factor 1.3larger than the one quoted by Carilli (2002).
It is worth noticing that our calibrations give a ratio (eq. 16)between the radio and FIR emissions,q = 2.32, very close tothe observed value, and that we can explain in a natural waythe scatter around the observed relation. In disk galaxies,thisscatter is due to the variation of the fraction of stellar emissionabsorbed (and re-radiated) by dust.
In the case of normal star forming galaxies, the model evi-dences that Hα, UV and even IR estimators of SFR are affectedby important scatters. For what concerns Hα, this is due to theage selective extinction, that can produce an underestimate ofthe attenuation when it is derived by the Balmer decrement.Also IR emission by itself does not provide an accurate esti-mate of the SFR in disk galaxies, because the fraction of UVradiation not absorbed by the dust can be high. The combina-tion of UV and FIR luminosities provides a very good SFRestimator essentially because, even for a modest SFR, one re-covers in the FIR what is lost in the UV.
Finally we have also discussed the utility of IR nebularlines as diagnostic tools for deriving the average properties ofthe environment such as number density, hardness of ionizingspectrum and gas metallicity. In particular we have provided
a new calibration for the nitrogen abundance (N/H) as a func-tion of the intensities of the [N]122µm and [N]57µm, andBrα lines. When the latter line is missing or useless (e.g. whenaffected by strong extinction), we suggest the possible use ofthe radio luminosity as indicator of the ionizing fluxQH, thatenters implicitely the above calibration. We provide a new cali-bration of the metallicity with the ratioN23 defined by equation18. This new calibration will turn out to be particularly usefulfor the Herschel experiment.
8. Summary
Here we summarize the main points of this paper.
1. We have introduced the nebular emission calculations fromCLOUDY into our spectrophotometric code GRASIL. Themethod which interfaces nebular emission computationswith population synthesis is based on pre-computed li-braries of H region models. These libraries can be re-trieved from the GRASIL web site4 and easily used forother population synthesis codes.
2. As a result, we can model the spectra of star-forming galax-ies from far-UV to radio wavelengths, including stellar ab-sorption features, nebular emission, dust and PAH emis-sion.
3. We applied the model to study the attenuation in normalstar forming galaxies. The poor correlation between the ex-tinction at UV and Hα found by B02 is interpreted in ourmodel as a natural consequence of age selective extinction.
4. Conversely, we found thatAUV correlates quite tightly withthe ratioFFIR/FUV .
5. We present new calibrations for the SFR using lines andcontinuum from UV to radio wavelengths, and study thereliability of each estimator. In particular, NIR H recombi-nation lines and radio luminosities are very accurate SFRestimators.
6. Although UV–, Hα– (also corrected for extinction) and IR–derived SFR are plagued by significant uncertainties, theUV luminosity corrected by using the ratioFFIR/FUV is arobust SFR estimator.
7. We reproduce the observed value of theq ratio between ra-dio and FIR emission. Its scatter is ascribed to the variationof extinction between different objects.
8. Finally, we discuss several methods and provide new cal-ibrations for the determination of metal abundances bymeans of infrared emission lines.
Acknowledgements. We thank A. Boselli, V. Buat and M.Magliocchetti for enlightening discussions, and the referee (M.Fioc) for the very accurate scrutiny of the paper and useful sugges-tions. A. B. acknowledges warm hospitality by INAOE (MEX). Weare also grateful to G. J. Ferland for the public access to CLOUDY.This research was partially supported by the Italian Ministry forUniversity and Research (MIUR) and ASI.
4 http://web.pd.astro.it/granato/grasil/grasil.html
P. Panuzzo et al.: Dust and Nebular Emission. I. Models for Normal Galaxies. 15
Appendix A: Analytical spectra
Here we present the relationships used to describe the parame-ters of analytical spectra introduced in eq. 1 as functions of QH,QHe, andQO.
THe is implicitly given by:∫ ∞
νOFνdν/hν
∫ ∞
νHeFνdν/hν
=
∫ νHe+
νOBν(THe)dν/hν
∫ νHe+
νHeBν(THe)dν/hν
=QO
QHe, (A.1)
whereνHe+ is the photoionization threshold frequency for He.OnceTHe is known,AHe is obtained from
AHe
∫ νHe+
νHe
Bν(THe)hν
dν = QHe . (A.2)
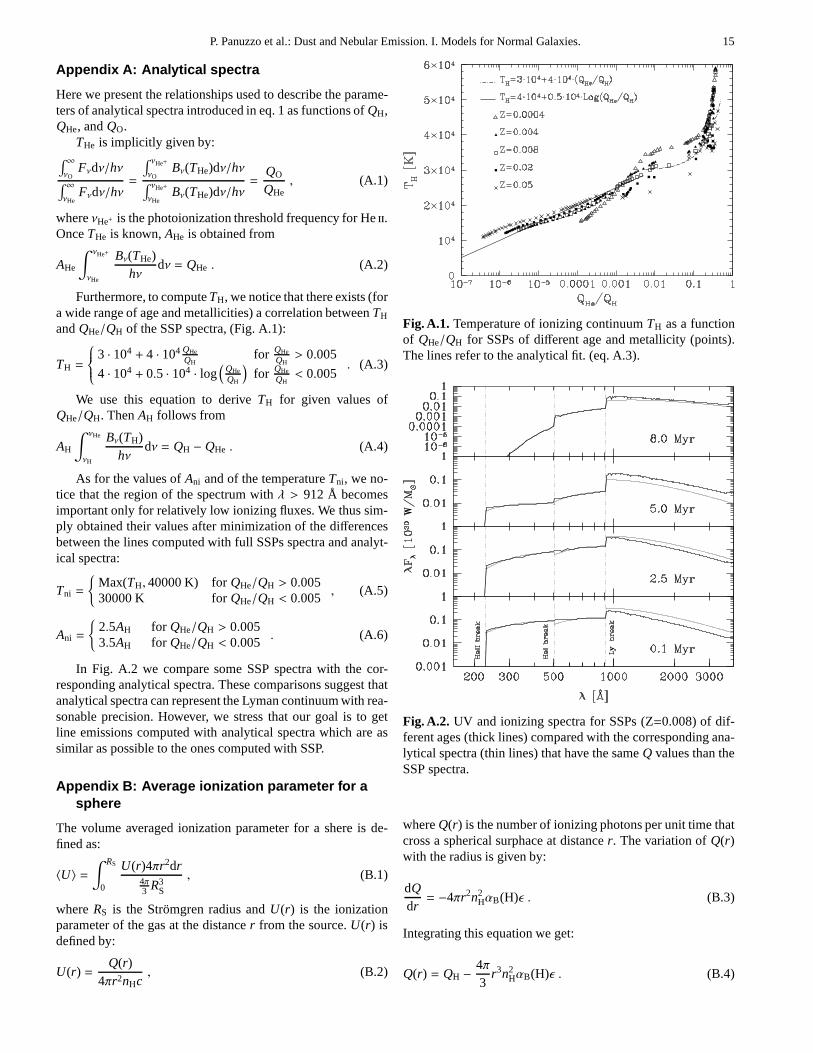
Furthermore, to computeTH, we notice that there exists (fora wide range of age and metallicities) a correlation betweenTH
andQHe/QH of the SSP spectra, (Fig. A.1):
TH =
3 · 104 + 4 · 104 QHe
QHfor QHe
QH> 0.005
4 · 104 + 0.5 · 104 · log(
QHe
QH
)
for QHe
QH< 0.005
. (A.3)
We use this equation to deriveTH for given values ofQHe/QH. ThenAH follows from
AH
∫ νHe
νH
Bν(TH)hν
dν = QH − QHe . (A.4)
As for the values ofAni and of the temperatureTni, we no-tice that the region of the spectrum withλ > 912 Å becomesimportant only for relatively low ionizing fluxes. We thus sim-ply obtained their values after minimization of the differencesbetween the lines computed with full SSPs spectra and analyt-ical spectra:
Tni =
{
Max(TH, 40000 K) forQHe/QH > 0.00530000 K forQHe/QH < 0.005
, (A.5)
Ani =
{
2.5AH for QHe/QH > 0.0053.5AH for QHe/QH < 0.005
. (A.6)
In Fig. A.2 we compare some SSP spectra with the cor-responding analytical spectra. These comparisons suggestthatanalytical spectra can represent the Lyman continuum with rea-sonable precision. However, we stress that our goal is to getline emissions computed with analytical spectra which are assimilar as possible to the ones computed with SSP.
Appendix B: Average ionization parameter for asphere
The volume averaged ionization parameter for a shere is de-fined as:
〈U〉 =∫ RS
0
U(r)4πr2dr4π3 R3
S
, (B.1)
whereRS is the Stromgren radius andU(r) is the ionizationparameter of the gas at the distancer from the source.U(r) isdefined by:
U(r) =Q(r)
4πr2nHc, (B.2)
Fig. A.1. Temperature of ionizing continuumTH as a functionof QHe/QH for SSPs of different age and metallicity (points).The lines refer to the analytical fit. (eq. A.3).
Fig. A.2. UV and ionizing spectra for SSPs (Z=0.008) of dif-ferent ages (thick lines) compared with the corresponding ana-lytical spectra (thin lines) that have the sameQ values than theSSP spectra.
whereQ(r) is the number of ionizing photons per unit time thatcross a spherical surphace at distancer. The variation ofQ(r)with the radius is given by:
dQdr= −4πr2n2
HαB(H)ǫ . (B.3)
Integrating this equation we get:
Q(r) = QH −4π3
r3n2HαB(H)ǫ . (B.4)

16 P. Panuzzo et al.: Dust and Nebular Emission. I. Models forNormal Galaxies.
The Stromgren radius is defined as:
RS =
3QH
4πn2HαB(H)ǫ
13
. (B.5)
By substituting eqs. B.4 and B.5 in eq. B.1, we get:
〈U〉 =∫ RS
0
(
QH
4πr2nHc−
rnHαB(H)ǫ3c
)
3r2dr
R3S
=
=3QH
4πnHc
4πn2HαB(H)ǫ
3QH
23
−
−nHαB(H)ǫ
4c
3QH
4πn2HαB(H)ǫ
13
=
=34c
3QHα2B(H)nHǫ
2
4π
13
. (B.6)
References
Aller, L. H. 1984,Physics of Thermal Gaseous Nebulae, Astrophysicsand Space Science Library, Reidel, Boston
Bell, E. F. 2002, ApJ, 577, 150Binette, L., Magris, C. G., Stasinska, G., & Bruzual, A. G. 1994,
A&A, 292, 13Boselli, A., Gavazzi, G., Donas, J., & Scodeggio, M. 2001, AJ, 121,
753Bressan, A., Chiosi, C., & Fagotto, F. 1994, ApJS, 94, 63Bressan, A., Silva, L. & Granato, G. L. 2002, A&A, 392, 377Buat, V., Donas, J., Millard, B., & Xu, C. 1999, A&A, 352, 371Buat, V., Boselli, A., Gavazzi, G., & Bonfanti, C. 2002, A&A,383,
801 (B02)Burgess, A., & Summers, H. P. 1976, MNRAS, 174, 345Calzetti, D. 1997, AJ, 113, 162Calzetti, D., Kinney, A. L., & Storchi-Bergmann, T. 1994, ApJ, 429,
582Calzetti, D., Kinney, A. L., & Storchi-Bergmann, T. 1996, ApJ, 458,
132Calzetti, D., Armus, L., Bohlin, R. C., et al. 2000, ApJ, 533,682Carilli, C. L., 2002, American Astronomical Society, 200, 5113
[astro-ph/0011199]Charlot, S., & Fall, S. M. 2000, ApJ, 539, 718Charlot, S., & Longhetti, M. 2001, MNRAS, 323, 887 (CL01)Condon, J. J. 1992, ARA&A, 30, 575Conti, P. S. 1991, ApJ, 377, 115DeGioia-Eastwood, K. 1992, ApJ, 397, 542Dessauges-Zavadsky, M., Pindao, M., Maeder, A., & Kunth, D.2000,
A&A, 355, 89Ferland, G. J. 1980, PASP, 92, 596Ferland, G. J. 2001,Hazy, a brief introduction to CLOUDY, University
of Kentucky, Department of Physics and Astronomy InternalReport
Fioc, M. & Rocca-Volmerange, B. 1997, A&A, 326, 950Franceschini, A., Silva, L., Fasano, G., et al. 1998, ApJ , 506, 600Fuente, A., Neri, R., Martın-Pintado, J., et al. 2001, A&A,366, 873Gavazzi, G., Bonfanti, C., Sanvito, G., Boselli, A., & Scodeggio, M.
2002, ApJ, 576, 135Giveon, U., Sternberg, A., Lutz, D., Feuchtgruber, H., & Pauldrach,
A. W. A. 2002, ApJ, 566, 880Granato, G. L., Lacey, C. G., Silva, L., et al. 2000, ApJ, 542,710Granato, G. L., Silva, L., Monaco, P., et al. 2001, MNRAS, 324, 757
Gordon, K. D., Clayton, G. C., Witt, A. N., & Misselt, K. A. 2000,ApJ, 533, 236
Haarsma, D. B., Partridge, R. B., Windhorst, R. A., & Richards, E. A.2000, ApJ, 544, 641
Heiles, C. 1994, ApJ, 436, 720Helou, G., Khan, I. R., Malek, L., & Boahmer, L. 1988, ApJS, 68, 151Hopkins, A. M., Connolly, A. J., Haarsma, D. B., & Cram, L. E. 2001,
AJ, 122, 288Jacoby, G. H., Hunter, D. A., & Christian, C. A. 1984, ApJS, 56, 257Jansen, R. A., Frax, M., & Fabricant, D. 2001, ApJ, 551, 825Kaufman, M. J., Wolfire, M. G., Hollenbach, D. J., & Luhman, M.L.
1999 ApJ, 527, 795Kennicutt, R. C. 1983, ApJ, 272, 54Kennicutt, R. C. 1984, ApJ, 287, 116Kennicutt, R. C. 1998, ARA&A, 36, 189Kewley, L. J., Dopita, M. A., Sutherland, R. S., Heisler, C. A., &
Trevena, J. 2001, ApJ, 556, 121Kurucz, R. 1993, ATLAS9 Stellar Atmosphere Programs and 2 km/s
grid. Kurucz CD-ROM No. 13. Cambridge, Mass.: SmithsonianAstrophysical Observatory, 1993., 13
Lejeune, T., Cuisinier, F., & Buser, R. 1998, A&AS, 130, 65Lennon, D. J., & Burke, V. M. 1994, A&AS, 103, 273Malhotra, S., Kaufman, M. J., Hollenbach, D., et al. 2001, ApJ, 561,
766McGaugh, S. S. 1991, ApJ, 380, 140Meurer, G. R., Heckman, T. M., & Calzetti, D. 1999, ApJ, 521, 64Moy, E., Rocca-Volmerange, B., & Fioc, M. 2001, A&A, 365, 347
(MRF01)Nussbaumer, H., & Schmutz, W. 1984, A&A, 138, 495Oey, M. S., & Shields, J. C. 2000, ApJ, 539, 687Osterbrock, D. E. 1989,Astrophysics of Gaseous Nebulae and Active
Galactic Nuclei. Univ. Science Books, Mill Valley, CAPeng, J. F., & Pradhan, A. K. 1995, A&AS, 112, 151Perez-Olea, D. E. & Colina, L. 1995, MNRAS, 277, 857Pickles, A. J. 1998, PASP, 110, 863Poggianti, B. M., Bressan, A., Franceschini, A. 2001, ApJ, 550, 195Rigopoulou, D., Spoon, H. W. W., Genzel, R., et al. 1999, AJ, 118,
2625Rodighiero, G., Granato, G. L., Franceschini, A., Fasano, G., & Silva,
L. 2000, A&A, 364, 517Rubin, R. H., Simpson, J. P., Lord, S. D., et al. 1994, ApJ, 420, 772Rubin, R. H., Dufour, R. J., Geballe, T. R., et al. 2001, in
Spectroscopic Challenges of Photoionized Plasmas, ed. G.Ferland, & D. W. Savin, ASP Conference Series, 247, 479
Sanders, D. B., & Mirabel, I. F. 1996, ARA&A, 34, 749Schaerer, D., Contini, T., & Kunth, D. 1999, A&A, 341, 399Schaerer, D., de Koter, A., Schmutz, W., & Maeder, A. 1996, A&A,
312, 475SSchmutz, W., Leitherer, C., & Gruenwald, R. 1992, PASP, 104,1164Silva, L., Granato, G. L., Bressan, A., & Danese, L. 1998, ApJ, 509,
103Soifer, B. T., Boehmer, L., Neugebaruer, G., & Sanders, D. B.1989,
AJ, 98, 766Soifer, B. T., Sanders, D. B., Neugebauer, G., et al. 1986, ApJ, 303,
L41Stasinska, G., Schaerer, D., & Leitherer, C. 2001, A&A, 370, 1Storey, P. J., & Hummer, D. G. 1995, MNRAS, 272, 41Sullivan, M., Treyer, M. A., Ellis, R. S., et al. 2000, MNRAS,312,
442Sullivan, M., Mobasher, B., Chan, B., et al. 2001, ApJ, 558, 72Terlevich, R., Melnick, J., Masegosa, M., Moles, M., & Copetti, M. V.
F. 1991, A&AS, 91, 285Veilleux, S., & Osterbrock, D. E. 1987, ApJS, 63, 295Verma, A., Lutz, D., Sturm, E., et al. 2003, A&A, 403, 829


![Scattered Nebular Lightin theExtended Orion Nebula · 2018-10-27 · arXiv:0909.0538v1 [astro-ph.GA] 2 Sep 2009 Scattered Nebular Lightin theExtended Orion Nebula 1 C. R. O’Dell](https://static.fdocuments.us/doc/165x107/5f92bc6e796fc824033aa576/scattered-nebular-lightin-theextended-orion-nebula-2018-10-27-arxiv09090538v1.jpg)