Duratex Presentation Day · Client PMR (days) Inventory PME (days) Supplier PMP (days) Cash Cycle...
26
1
Transcript of Duratex Presentation Day · Client PMR (days) Inventory PME (days) Supplier PMP (days) Cash Cycle...
1

1

1,277
1,308
3Q18 3Q19
210
238
3Q18 3Q19
6230
3Q18 3Q19
Rec EBITDANet Revenue Gross Margin Rec EBITDA Margin
27,9% 27,1%16,4%
18,2%
Growth in Net Revenuearising from consolidation
with Cecrisa
EBITDA Margin increased by 1.8 p.p due to greater commercial and
operational efficiency
Net Income impacted byexpenditure related to DWP project
and consolidation of Cecrisa debt
R$ Million
Net Revenue and RecurringGross Margin
Recurring EBITDA and EBITDA Margin
Recurring Net Income
2

238
37
(79)
(10) (23) (15)
148
83
231213
(51)
(109)
(11)
29
(12)
59
(4)
55
Rec EBITDAWorkingCapital CAPEX Taxes Others Financial
FlowFree Cash Flow
(w/o project)
Free Cash Flow
3Q19 3Q18
ProjectsTotal FreeCash Flow
3Q19
Significant groth in the Company’scash flow generation
Improvement in WorkingCapital
Controlled CAPEX, resultingfrom the optimization and
repurposing of assets
R$ Million
3Projects*: (+) Receipt from final parcel of land and forests to Suzano: R$395
(-) Acquisition Cecrisa: R$252.4 (-) Amadeus project: R$30.4 (-) Ceusa expansion: R$29.5
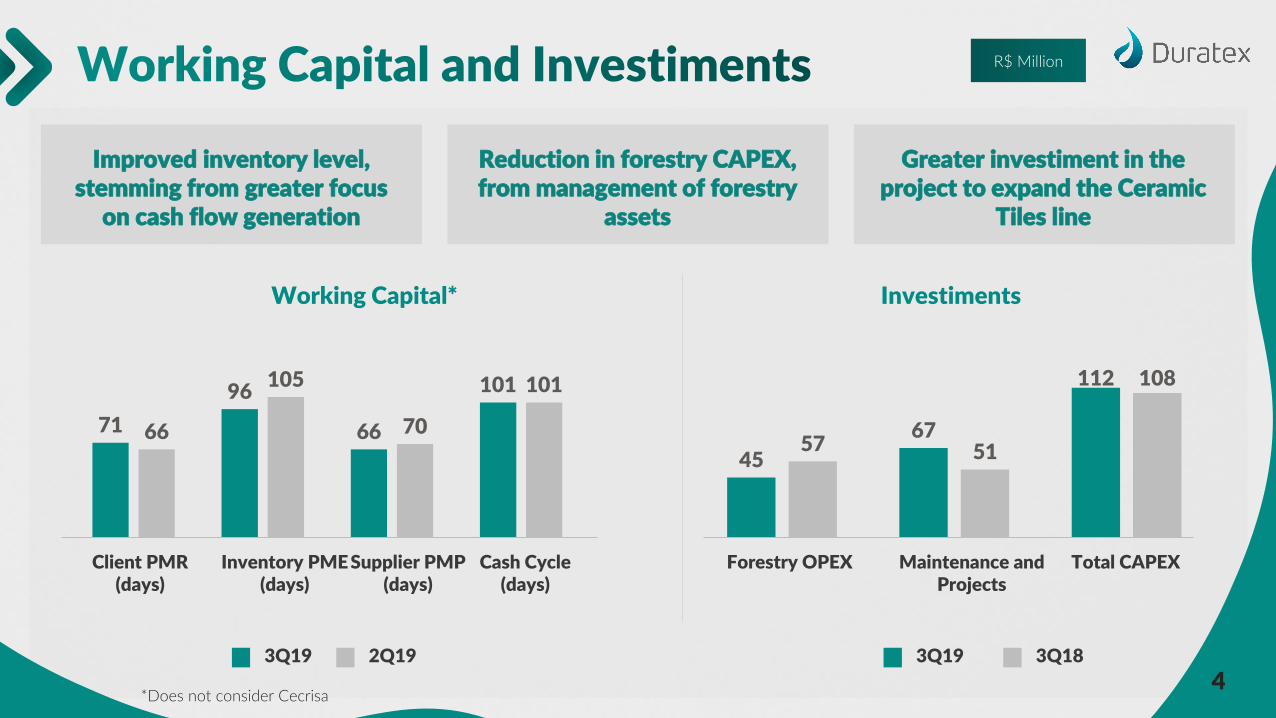
Improved inventory level,stemming from greater focus
on cash flow generation
Reduction in forestry CAPEX, from management of forestry
assets
Greater investiment in theproject to expand the Ceramic
Tiles line
71
96
66
101
66
105
70
101
Client PMR(days)
Inventory PME(days)
Supplier PMP(days)
Cash Cycle(days)
45
67
112
57 51
108
Forestry OPEX Maintenance andProjects
Total CAPEX
3Q19 2Q19
Working Capital* Investiments
3Q19 3Q18
*Does not consider Cecrisa
R$ Million
4
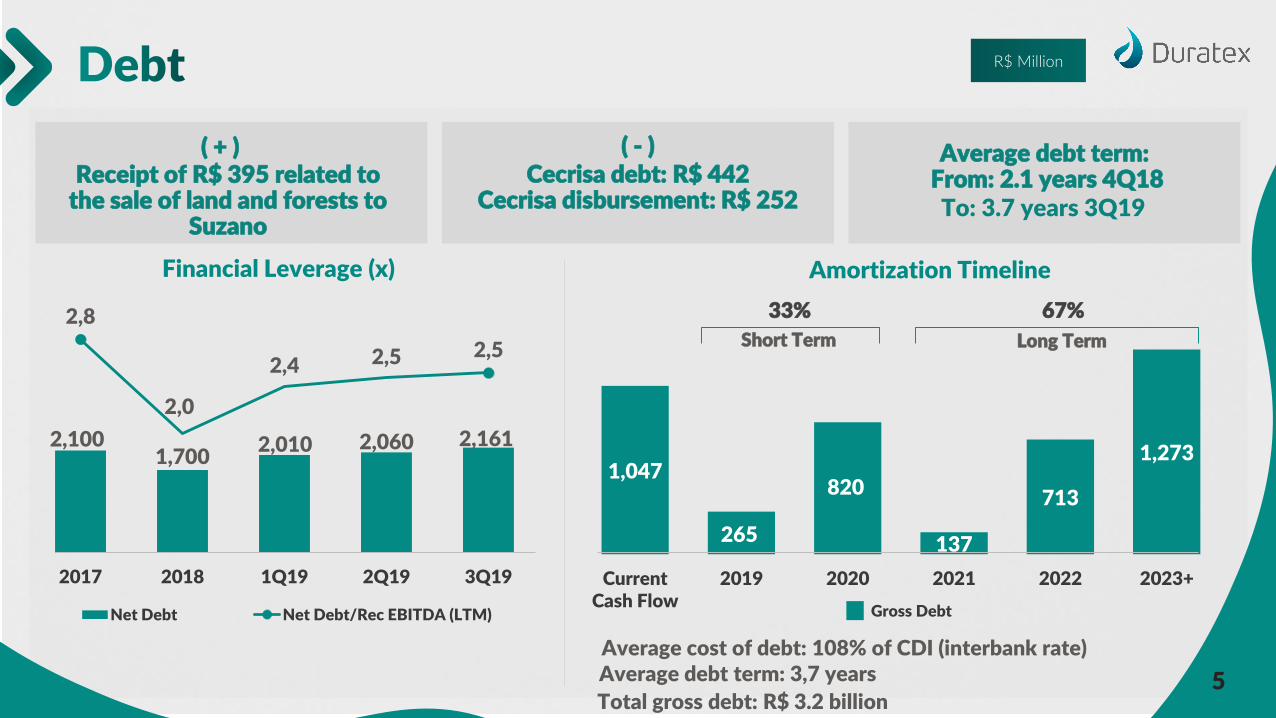
Financial Leverage (x) Amortization Timeline
1,047
265
820
137
713
1,273
CurrentCash Flow
2019 2020 2021 2022 2023+
Gross Debt
2,1001,700
2,010 2,060 2,161
2,8
2,0
2,4 2,5 2,5
2017 2018 1Q19 2Q19 3Q19
Net Debt Net Debt/Rec EBITDA (LTM)
Short Term
33%
Long Term
67%
Average debt term: 3,7 yearsAverage cost of debt: 108% of CDI (interbank rate)
Cecrisa debt: R$ 442 Cecrisa disbursement: R$ 252
Receipt of R$ 395 related tothe sale of land and forests to
Suzano
Average debt term: From: 2.1 years 4Q18
R$ Million
( - )( + )
To: 3.7 years 3Q19
Total gross debt: R$ 3.2 billion5

6

Growth of 6.2% in unit revenue, from improvements in mix and
trade policy
Fall in pro forma gross margin impacted by the reduction in
volumes and lower sales of free-standing wood
EBITDA margin increase of 3.4p.p, due to to rigid cost
control via the DuratexManagement System
R$ Million
3T18 3T19
139 145
Ebitda Ajustado Margem EbitdaAdjusted Ebitda Ebitda Margin
742,0 643,0
-
500,0
1000,0
1500,0
2000,0
3Q18 3Q19
Volume Variation
Volume* (‘000 m³)
- 13,3%
Net Revenue and Gross Margin(Pro forma)
815724
-320
180
680
1.180
1.680
2.180
3Q18 3Q19
26,8%
22,7%
Rec EBITDA and EBITDA Margin.
*Excluding volumes of hardboard shipped in 3Q18.
Capacity Utilization 3Q19
17,0%20,4%
MDP: 72%
MDF: 70%
Gross MarginNet Revenue
7
3Q18 3Q19

Sale of hardboard operation
Return of Itapetininga factory
Sale of 2nd tranche of land and forest to Suzano
Closure of Botucatu unit
Sale of land and forest to Bracell
Announcement of sale of 1st tranche of land and forests to Suzano
Announcement of soluble cellulose joint venture with Austrian firm Lenzing
Shutdown of Botucatu operations
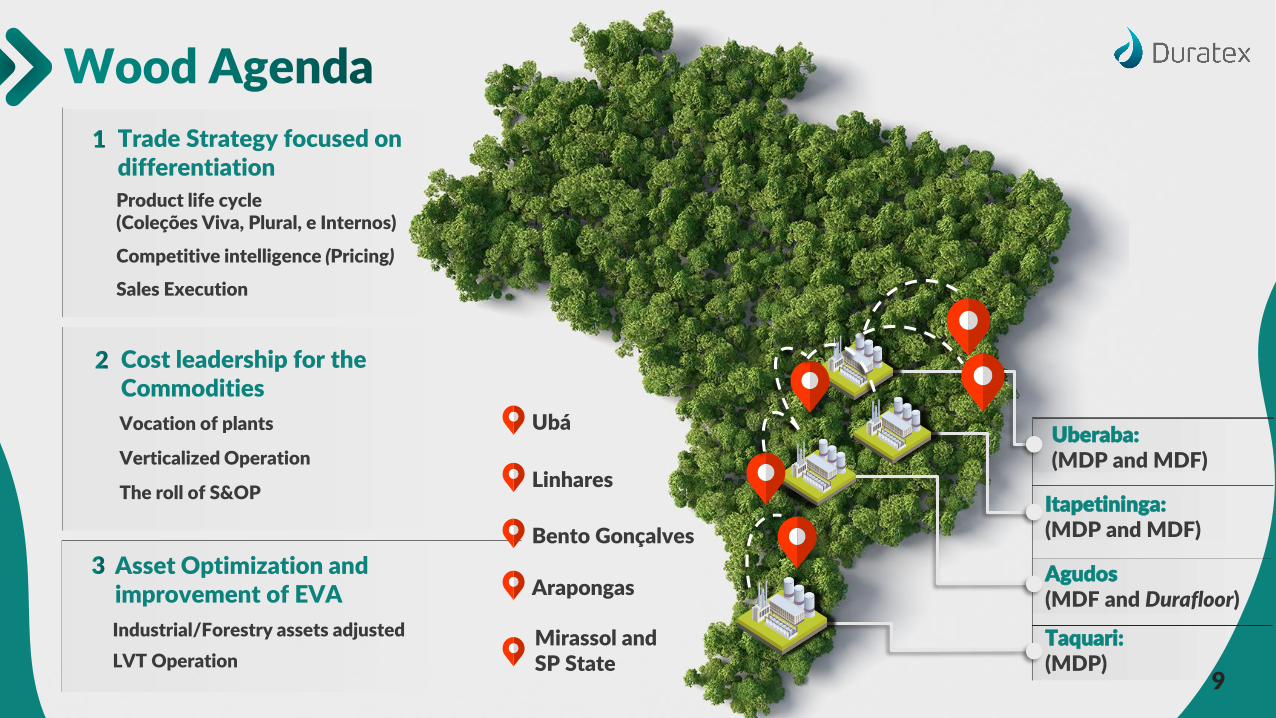
Trade Strategy focused ondifferentiation
Product life cycle(Coleções Viva, Plural, e Internos)
Competitive intelligence (Pricing)
Sales Execution
Cost leadership for theCommodities
Vocation of plants
Verticalized Operation
The roll of S&OP
Asset Optimization andimprovement of EVA
Industrial/Forestry assets adjusted
LVT Operation
Ubá
Linhares
Bento Gonçalves
Arapongas
Mirassol andSP State
Taquari: (MDP)
Itapetininga: (MDP and MDF)
Agudos (MDF and Durafloor)
Uberaba: (MDP and MDF)
9

10
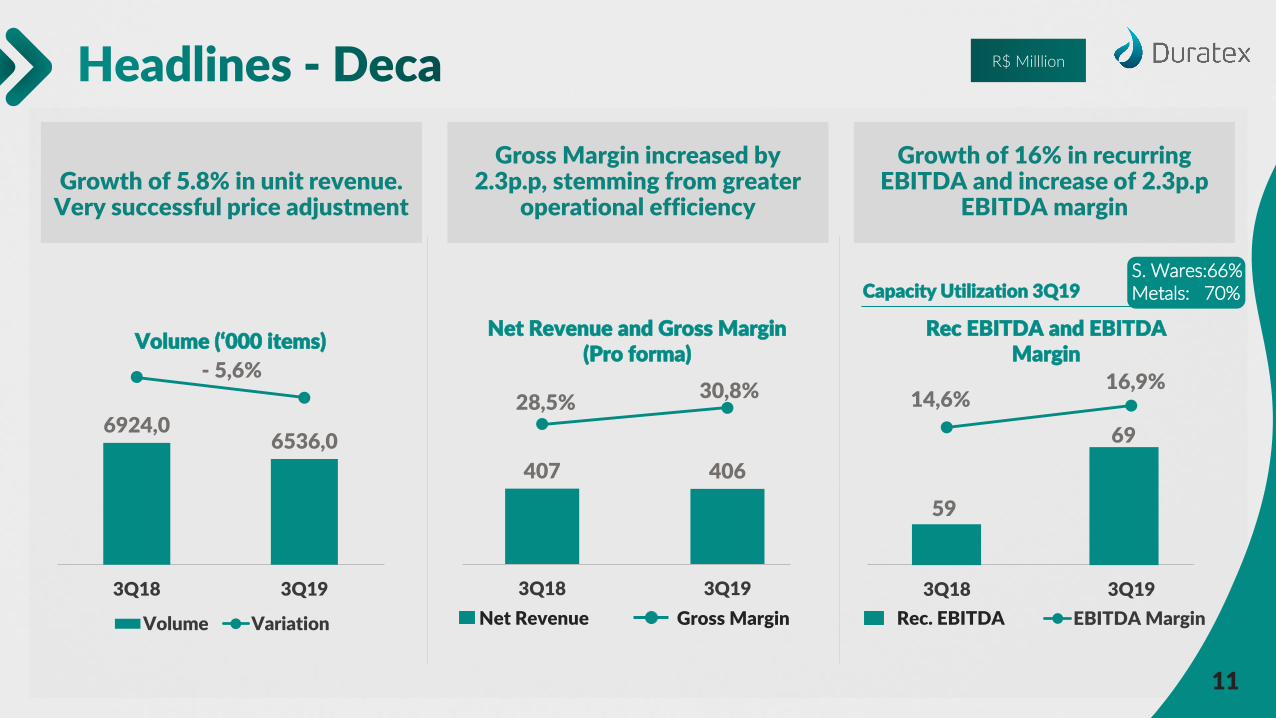
407 406
00%
05%
10%
15%
20%
25%
30%
35%
-320
-120
80
280
480
680
880
3Q18 3Q19
Net Revenue and Gross Margin(Pro forma)
28,5%30,8%
3Q18 3Q19
00%
05%
10%
15%
20%
25%
EBITDA Margin
59
696924,0 6536,0
4000,0
5000,0
6000,0
7000,0
8000,0
9000,0
10000,0
3Q18 3Q19
Volume Variation
Volume (‘000 items)
Growth of 5.8% in unit revenue. Very successful price adjustment
Gross Margin increased by 2.3p.p, stemming from greater
operational efficiency
Growth of 16% in recurring EBITDA and increase of 2.3p.p
EBITDA margin
Capacity Utilization 3Q19S. Wares:66%Metals: 70%
R$ Milllion
14,6%16,9%
Rec EBITDA and EBITDA Margin
- 5,6%
Gross MarginNet Revenue Rec. EBITDA
11
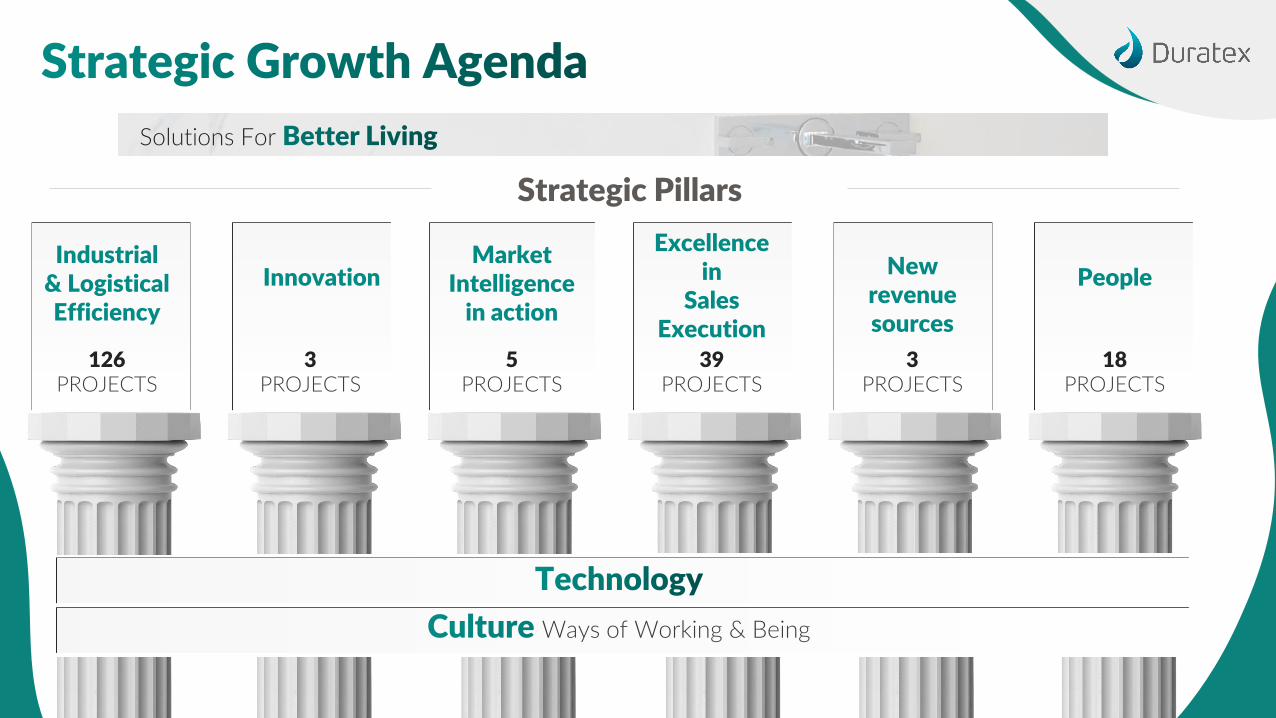
Solutions For
126 3 5 39 3 18PROJECTS PROJECTS PROJECTS PROJECTS PROJECTS PROJECTS
Ways of Working & Being
Industrial& LogisticalEfficiency
InnovationMarket
Intelligence in action
Excellence in
Sales Execution
New revenue sources
People
Strategic Pillars
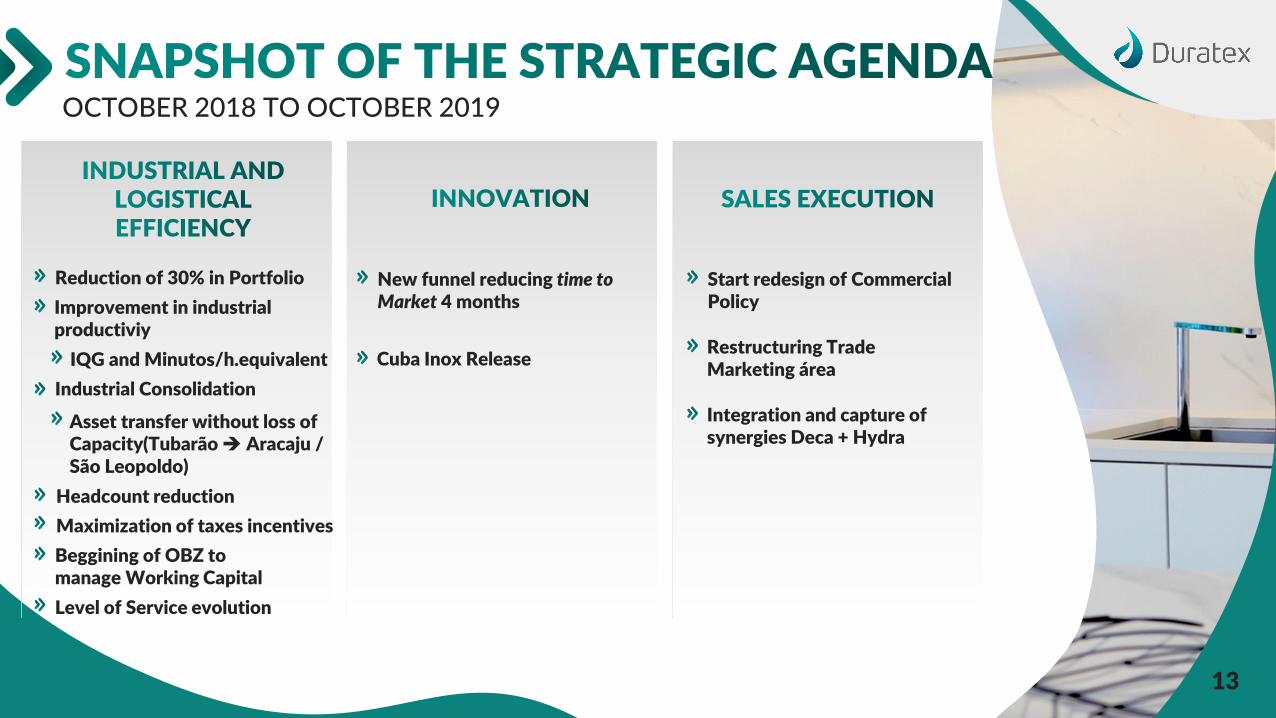
Reduction of 30% in Portfolio
Improvement in industrial productiviy
IQG and Minutos/h.equivalent
Industrial Consolidation
Asset transfer without loss ofCapacity(Tubarão Aracaju / São Leopoldo)
Headcount reduction
Maximization of taxes incentives
Beggining of OBZ tomanage Working Capital
Level of Service evolution
New funnel reducing time toMarket 4 months
Cuba Inox Release
Start redesign of CommercialPolicy
Restructuring Trade Marketing área
Integration and capture ofsynergies Deca + Hydra
OCTOBER 2018 TO OCTOBER 2019
13
14
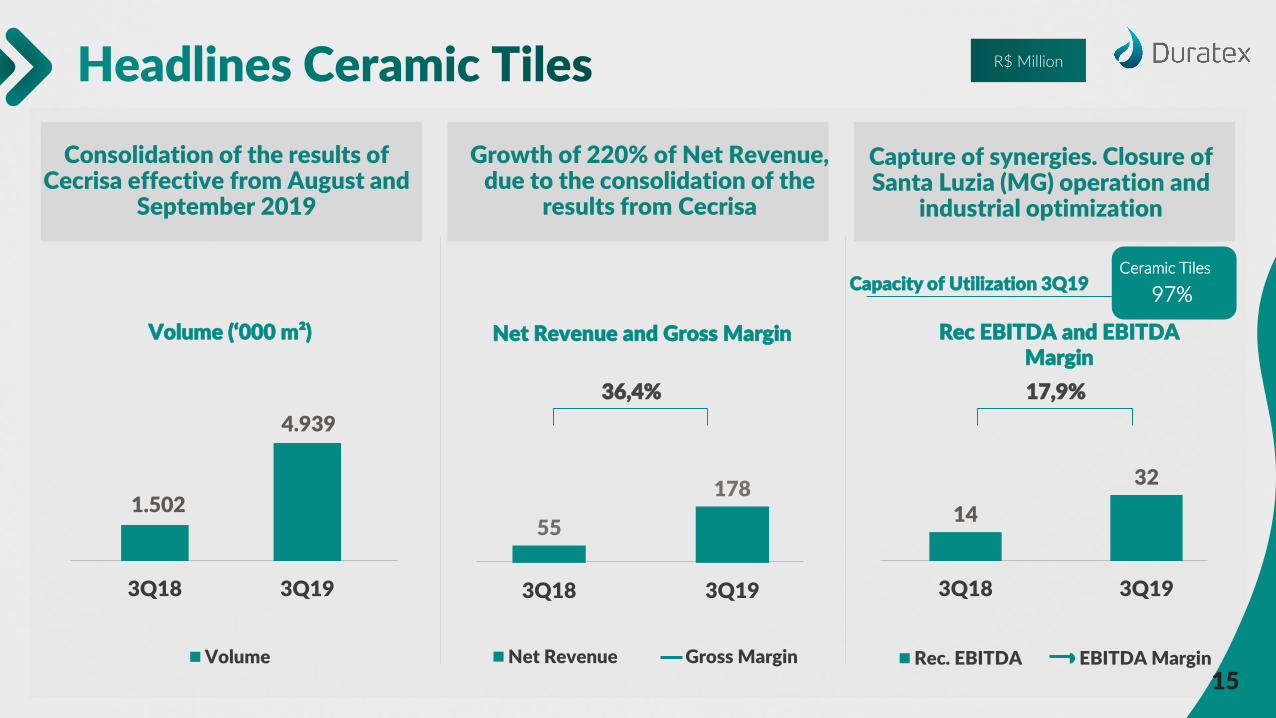
1.502
4.939
1,0
1001,0
2001,0
3001,0
4001,0
5001,0
6001,0
7001,0
8001,0
3Q18 3Q19
Volume
Volume (‘000 m²)
14
32
00%
05%
10%
15%
20%
25%
30%
0
10
20
30
40
50
60
70
80
90
100
3Q18 3Q19
Rec. EBITDA EBITDA Margin
55
178
00%
05%
10%
15%
20%
25%
30%
35%
40%
45%
50%
-320
-120
80
280
480
680
3Q18 3Q19
Net Revenue Gross Margin
Net Revenue and Gross Margin
Consolidation of the results of Cecrisa effective from August and
September 2019
Growth of 220% of Net Revenue, due to the consolidation of the
results from Cecrisa
Capture of synergies. Closure of Santa Luzia (MG) operation and
industrial optimization
Rec EBITDA and EBITDA Margin
R$ Million
36,4% 17,9%
Capacity of Utilization 3Q19Ceramic Tiles
97%
15

Maximalist Design
Fashion & Creativity
Exclusive differentials
Monotone, mono-caliber, dry joint
Focus on process
100% Extra up to 2022
Industry 4.0
ICEP system and GSM
Digital experience
EaD, SimuLAR (exclusive app)
CREATIVITY THAT SURPRISES
Minimalist Design Art & Architecture
Premium BrandHigh End
Concept Consolidated Channel of Specialist Stores
Digital Media Leadership 10x greater than 2º place in like
Digital Platform Agile Promoter
Innovation Color Connection
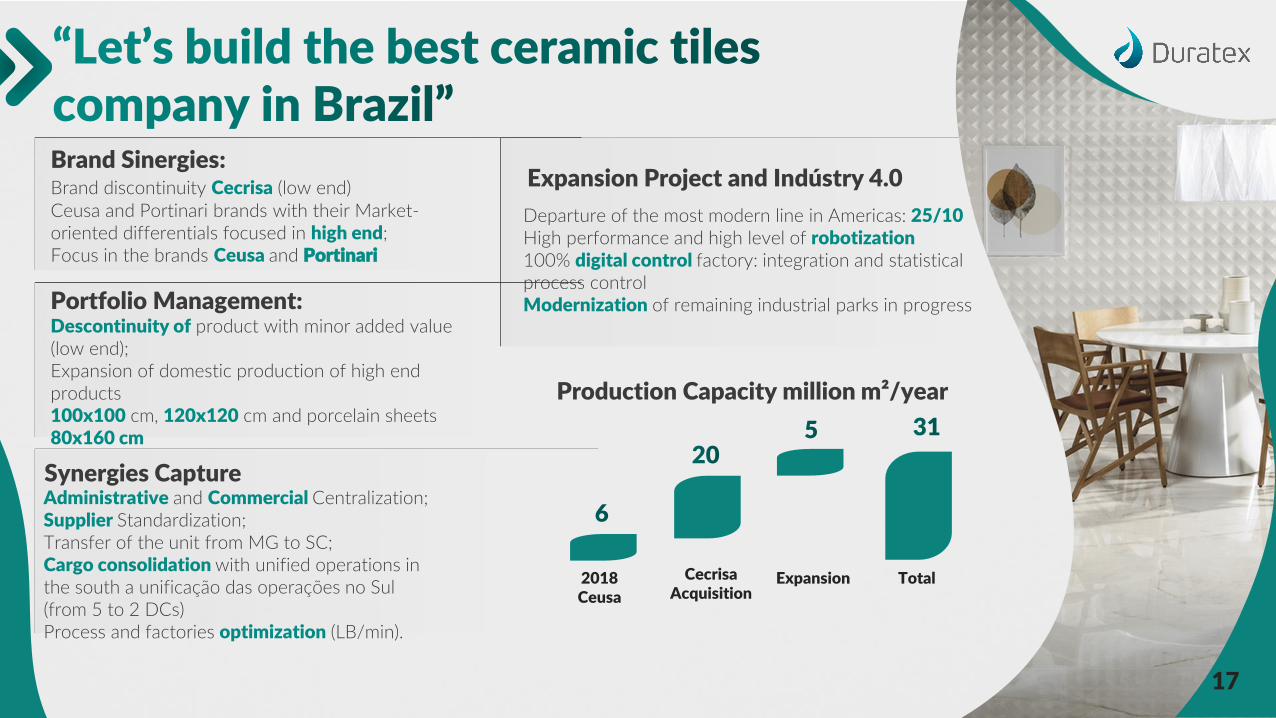
Synergies Capture
Portfolio Management:Descontinuity of product with minor added value(low end);Expansion of domestic production of high endproducts100x100 cm, 120x120 cm and porcelain sheets80x160 cm
Brand Sinergies:Brand discontinuity Cecrisa (low end)Ceusa and Portinari brands with their Market-oriented differentials focused in high end;Focus in the brands Ceusa and Portinari
Production Capacity million m²/year
2018 Ceusa
Cecrisa Acquisition
Expansion Total
Departure of the most modern line in Americas: 25/10High performance and high level of robotization100% digital control factory: integration and statisticalprocess controlModernization of remaining industrial parks in progress
Administrative and Commercial Centralization;Supplier Standardization;Transfer of the unit from MG to SC;Cargo consolidation with unified operations in the south a unificação das operações no Sul (from 5 to 2 DCs)Process and factories optimization (LB/min).
Expansion Project and Indústry 4.0
17

18

Duratex and the business
Capacity: 500k ton/year of DWP
Lowest cash cost in the sector worldwide
Integrated logistics
Shareholder structure: Lenzing 51% and Duratex 49%
Total industrial investment: approximately 1.2 billion dollars
Lenzing is the global leader in the production of cellulosic fibers
Product destined for Lenzing factories in Europe, Asia and North America for production of viscose and lyocell
Production 100% sold
Wood 100% certified by FSC (Forest Stewardship Council)
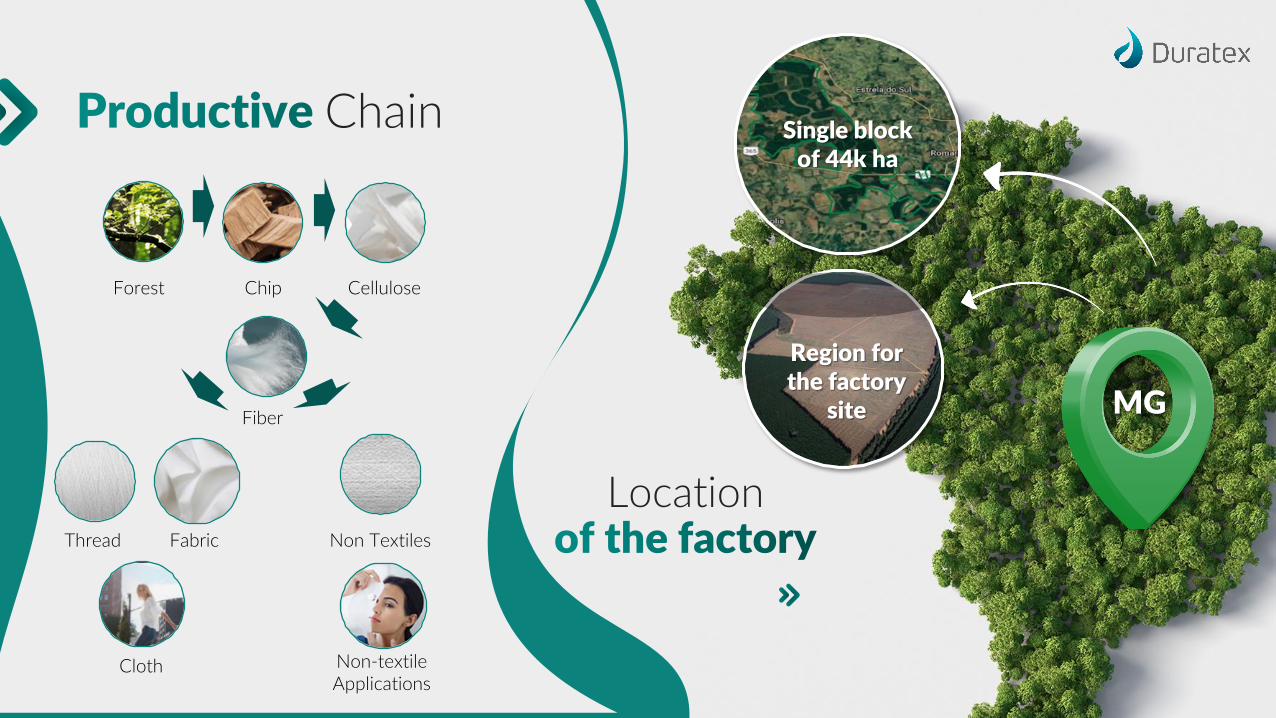
Location
Single block of 44k ha
Forest Chip Cellulose
Fiber
Thread Non Textiles
Non-textile Applications
Fabric
Cloth
MG
Region for the factory
site
Chain
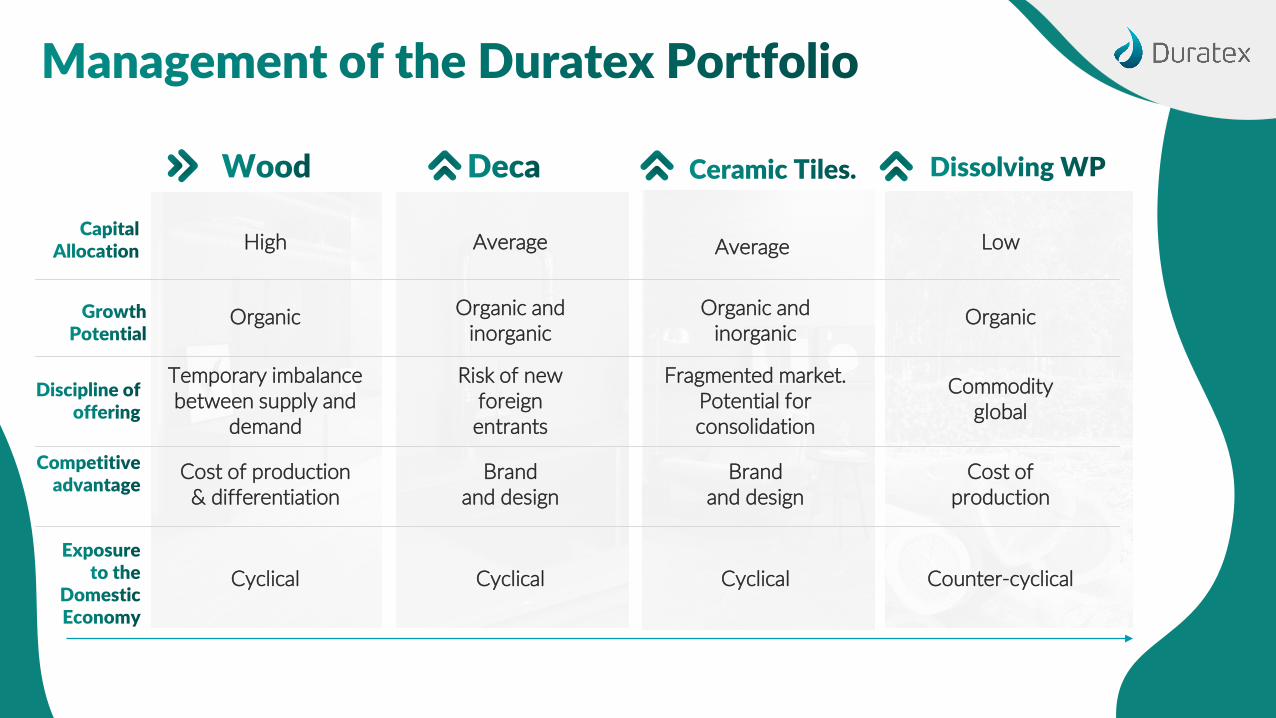
High
Cost of production & differentiation
Temporary imbalance between supply and
demand
Cyclical
Organic
Average
Brandand design
Risk of new foreign entrants
Cyclical
Organic and inorganic
Average
Brandand design
Fragmented market. Potential for consolidation
Cyclical
Organic and inorganic
Low
Cost of production
Commodity global
Counter-cyclical
Organic

Reduction in number of directors and
exchange of 84% of the executive team
2016 2017
Ceusa acquisition
Viva Decora acquisition
2018
Management of Consolidated Assets
DWP Project
Ceusa expansion project
2019
Continuity of the asset management process.
Cecrisa acquisition
Solutions for Better Living
Innovation
Ecosystem entrepreneur
approach
Zero based budgeting
Duratex Management System (SGD)

of renewable sources at our energy grid
of the energy grid comprised of biomass
re-use of water in our own production processes
• We develop people• We grow the positive socio-environmental impact• We innovate with sustainable solutions • We constantly seek new business models that generate value
have already undergone an educational program in
sustainability.

Processes
Carried out well, in a straightforward and safe manner
Results
Sustainable high performance
PeoplePeople are our strength
Client
We are the best choice
Strategic pillars
A Company focused on...
...Sustainable growthOrganic and inorganic growth within our way of working and being
...Innovation and digitalizationAs a way of simplifying our processesand leveraging our sales channels
...Strategic assetsOptimization of current assets and productive management with strategic partners
...Client solutions One-stop-shop, complete experiences within environments
...Cash flow generation, maximizing shareholder valueExecutive pay based on cash flow generation and EVA

25