Dunite Distribution in the Oman Ophiolite: Implications for
32
Dunite Distribution in the Oman Ophiolite: Implications for Melt Flux Through Porous Dunite Conduits M.G. Braun and P.B. Kelemen Department of Marine Geology and Geophysics Woods Hole Oceanographic Institution Woods Hole, MA 02543
Transcript of Dunite Distribution in the Oman Ophiolite: Implications for

Dunite Distribution in the Oman Ophiolite:Implications for Melt Flux Through Porous Dunite Conduits
M.G. Braun and P.B. Kelemen
Department of Marine Geology and GeophysicsWoods Hole Oceanographic Institution
Woods Hole, MA 02543

Introduction
Geophysical and geochemical observations suggest that melt transport beneath oceanic spreading centers is
strongly focused toward the ridge axis and rapidly extracted from the shallow mantle via chemically-isolating
dunite conduits. In this study we examine the abundance and distribution of dunite conduits preserved in the
Oman Ophiolite to assess proposed mechanisms of dunite formation and place constraints on the melt flux the
dunite network can accommodate.
Recent geophysical data indicate that the melting region beneath mid-ocean ridges is much larger than the
seismically-determined zone of crustal accretion at the ridge axis. Seismic data from the MELT experiment
(17˚S along the East Pacific Rise) indicate that melt is present for several hundred kilometers off-axis [Toomey
et al., 1998; Webb and Forsyth, 1998] and to depths of 120-150 km [Forsyth et al., 1998]. Similarly, modeling
studies suggest that the deep melting region is on the order of 200 km wide at the depth where the mantle
crosses the solidus, even where buoyancy driven flow focuses mantle upwelling at shallower levels (e.g. [Braun
et al., 2000]). However, shallow seismic refraction data indicate the igneous oceanic crust attains its complete
thickness within only 5-10 km of the ridge axis [Dunn et al., 2000; Vera et al., 1990]. Therefore melts must be
efficiently extracted from a broad melting region and transported to the ridge axis to be accreted within the
narrow ridge axis.
Since mid-ocean ridge basalt (MORB) is not in chemical equilibrium with residual shallow-mantle
harzburgite, melt extraction must occur in chemically-isolating conduits. Primitive MORBs are undersaturated
in orthopyroxene (opx) with respect to the equilibrium cotectic melt composition at pressures commensurate
with the base of the oceanic crust (1-2 kbar). Figure 1 shows the major element composition of ~10,000 liquids
from the global MORB database (blue dots), using the isomolar projections of Elthon [1983]. Liquids in
equilibrium with mantle olivines (i.e. molar Mg# (Mg/(Mg+Fe)) > 0.62, shown as red triangles) were last
saturated in opx at pressures in excess of 8-10 kbar, in agreement with experimental data. [Elthon, 1989; Elthon
and Scarfe, 1980; O'Hara, 1965; Stolper, 1980] In addition, the high dissolution rate of opx in undersaturated
basalts [Brearley and Scarfe, 1986; Kuo and Kirkpatrick, 1985a; Kuo and Kirkpatrick, 1985b] suggests that
these melts must be rapidly isolated from the surrounding harzburgite during migration to preserve
disequilibrium. MORBs also preserve higher light/heavy rare-earth element ratios than predicted by
equilibrium with residual peridotites dredged from mid-ocean ridges (‘abyssal peridotites’, e.g., [Johnson et al.,

1990]) and sampled in ophiolites (e.g., [Kelemen et al., 1995]). Thus, major and minor element data indicate
that melts migrate through, at a minimum, the shallowest 25-30 km of the mantle with limited chemical
interaction.
Some MORBs record melting and rapid extraction from even greater depths. Lu/Hf and Sm/Nd isotopic
systematics [Salters and Hart, 1989] and 230Th/238U excesses [Beattie, 1993; Lundstrom et al., 1995; McKenzie,
1985] indicate the generation of small melt fractions in the presence of garnet, which is only stable in the mantle
at depths greater than ~70 km [Hirschmann and Stolper, 1996; Koga et al., 1998]. To preserve the observed
excesses of the shortest lived isotopes (i.e., 230Th), melt must be rapidly isolated from the depths where
fractionation occurs and delivered to the surface without achieving secular equilibrium or reacting with the
majority of rock through which it passes (see Kelemen et al. [1997a] for a complete discussion of melt velocity
constraints).
Mantle dunites may be the chemically isolating conduits for melt transport. Although residual harzburgites
are not in equilibrium with MORB, both the major and trace element concentrations from clinopyroxenes (cpx)
in dunites from Oman are in equilibrium with the lavas (very similar to MORB) that formed the overlying crust
[Kelemen et al., 1995]. In addition, spinel compositions from dunites exhibit high Cr/(Cr+Al) and high TiO2
[Augé, 1987; Kelemen et al., 1995; Pallister and Knight, 1981] similar to those found in MORB [Dick and
Bullen, 1984] and distinct from residual harzburgites [Allan and Dick, 1996; Arai and Matsukage, 1996; Dick
and Bullen, 1984; Dick and Natland, 1996; Kelemen et al., 1997a]. Dunites as observed in the mantle section of
the Oman ophiolite—one of the largest, best exposed sections of oceanic crust and mantle —are generally
tabular bodies with sharp, replacive contacts and orientations subparallel to the foliation in the surrounding
harzburgite and the crust-mantle transition zone (paleo-Moho) (e.g., [Boudier and Coleman, 1981; Lippard et
al., 1986]). If the harzburgite foliation developed as the result of deformation associated with ‘corner-flow’
beneath a spreading ridge, then the dunites must have formed in the upwelling mantle beneath the ridge and can
therefore accommodate chemically isolated transport of melt to the surface.
The extent to which dunites are the sole conduits for melt transport is debatable. However, replacive
dunites are abundant in the shallow mantle and certainly represent regions of highly concentrated melt flux.
This study characterizes the abundance and distribution of dunites in the mantle section of the Oman ophiolite

to assess (1) viable mechanisms for dunite formation and (2) the ability of a network of dunites to accommodate
the observed melt flux to mid-ocean ridges.
Observations and Results
General Field Relations
The Oman ophiolite consists of ~13 large massifs which comprise a nearly continuous band of oceanic
lithosphere more than 500 km long and 50-100 km wide. In this study we examine the distribution of replacive
dunites exposed in the mantle sections of the Samail and Muscat massifs. Detailed mapping efforts indicate
relatively little internal deformation since the initiation of obduction [Boudier and Coleman, 1981; Coleman,
1981; Glennie et al., 1974]. The mantle section of the ophiolite preserves a stratigraphic thickness of 9-12 km
composed almost entirely of residual harzburgite and dunite [Boudier and Coleman, 1981]. The peridotite is
overlain by a 5-7 km thick gabbroic crustal section [Pallister and Hopson, 1981] with nearly continuous layers
of sheeted dikes underlying pillow lavas with compositions very similar to MORB [Pallister and Hopson, 1981;
Pallister and Knight, 1981].
Although the spreading rate during the formation of the Oman crust is unknown, the presence of the
continuous igneous crustal layer [Nicolas and Boudier, 1995; Nicolas et al., 2000] suggests a half-spreading
rate greater than ~50 mm/yr. Mid-ocean ridges with spreading rates less than ~50 mm/yr exhibit extensive
exposures of peridotite on the seafloor, especially near fracture zones [Cannat, 1996; Dick, 1989]. In addition,
there is little evidence for crystal plastic deformation in Oman gabbros [Nicolas and Ildefonse, 1996], as is
observed along the Mid-Atlantic Ridge [Cannat et al., 1997]. Therefore the Oman ophiolite represents the
igneous crust and residual peridotite generated at an intermediate- to fast-spreading oceanic spreading center.
The majority of dunites in the mantle section of the ophiolite occur as tabular veins, intersecting at small
angles, with sharp contacts against the surrounding harzburgite. The widths of these dunites range from less
than 1 cm to nearly 100 m, and lengths range from less than a meter to several kilometers. To avoid confusion
with the large, partially cumulate, dunites formed at the base of the crust, we consider only dunites which are
overlain by harzburgite, and in most cases lie more than 1 km below the crust-mantle transition zone.

Photomosaics and Image processing
We have measured dunite widths over 4 orders of magnitude (10-2 to 102 m). Data was collected using one
of several methods depending on scale: one-dimensional measured sections, outcrop mosaics for small dunites,
hillside/mountainside photomosaics for intermediate scales, and airphoto analysis and chain and compass
surveying for the largest dunites.
For the highest resolution, one-dimensional sections were collected in Wadi Lufti (Samail) along a chain
line perpendicular to the strike of the predominant dunite orientation/peridotite foliation (335˚/65˚SW). Seven
sample lines ranged in length from 7 to 66 m, for a composite section of 208 m with every facies contact along
the sample line was marked and measured to millimeter precision.
Dunite distributions over larger length scales are derived from two-dimensional image mosaics.
Photomosaics of individual outcrops (figure 3a & b) were constructed from images of 0.5 m by 0.5 m sections
along a grid superimposed on the outcrop. Lithologic contacts in each image were then retraced and
reassembled into the mosaic using Adobe® Photoshop®. This method is an improvement upon that used by
Kelemen et al. [2000], exploiting greater overlap, better camera positioning, and less image distortion. The
prepared outcrops ranged in size from 3x3.5m to 16x5m, with a final precision of ~3 mm (determined by the
width of the marker and the grain-size of the rock). Where possible, one-dimensional sections traversed
previously analyzed two-dimensional outcrops.
At length scales larger than individual outcrops (figures 4 & 5), images were gathered and processed in a
slightly different manner. For each location, a series of scaled photographs, taken from a fixed point at a known
distance from the hillside were digitized and mosaicked, again using Adobe® Photoshop®. The mosaics were
printed to large sheets, over which the facies contacts were hand traced, then redigitized. This same process
was used for airphoto analysis (figure 6) to fill in gaps in the ground survey. All mosaics are converted into
scaled bitmap (binary) images containing just dunite (or harzburgite) objects for image processing.
Statistical Analysis
To evaluate the proposed mechanisms of dunite formation and to estimate the total potential flux through
dunites, the abundance and distribution of dunites in the melt network must be determined. Kelemen et al,
[2000] show that the abundance of dunites exhibits a power-law dependence on dunite width in the Ingalls

ophiolite. In addition, Kelemen et al. extrapolate this dunite size/frequency relationship to predict the
abundance of large dunites in the Wadi Tayin massif in Oman. For the Oman ophiolite, the data from the
composite 1-D section in Wadi Lufti show that a robust power-law relationship between dunite width and
frequency does exist (figure 2).
In order test the extrapolation, we collected dunite width data from images over a wide range of scales
using an ‘intercept width’ technique, similar to that used by Kelemen et al [2000]. Dunite widths are measured
along parallel lines perpendicular to the dominant dunite trend for each image mosaic. All widths are then
corrected for apparent thickness based on field measurements of the true dunite orientation and camera position.
In addition, several large dunites were measured using standard chain and compass techniques to further
constrain the mosaics. The same width analysis is carried out for the harzburgite images, and therefore the
percentage of dunite at each location can be determined by combining the dunite and harzburgite images. To
eliminate the higher abundances inherent to larger areas, all frequency data are normalized by the total intercept
length used in each image. Using cumulative frequency per meter allows for direct comparison of
size/frequency data collected at different scales over different sized areas. (Using frequency per meter also
allows for extrapolation to larger length scales, as will be discussed below.)
For each data set, a cumulative distribution function and probability distribution function can be
established from histograms of the width data. The cumulative distribution function (CDF) is defined as the
number of objects per meter greater than a given width, w. For a power-law, the CDF has the form
(1) Fa
ww D= .
where D is the power-law exponent and a is related to the percentage of dunite in the image. The probability
distribution function (PDF) is an estimate of the number of dunites per meter of a given width. The PDF is the
derivative of the CDF and for the power-law above has the form
(2) fdF
dw
aD
ww D= − = +1 .
Ideally, the PDF could be determined directly from the width/frequency histogram. However, the values of
both D and a are sensitive to the bin sizes used in creating the histogram. Therefore, we exploit the
mathematical relationship between the distribution functions to calculate the PDF from the more robustly
determined CDF.

If the true distribution of dunite widths is indeed scale-invariant, then the abundances of sampled dunites
should fall along a common line. (Figure 7) However, any sampling of the true population is subject to
truncation and censorship errors. Even samples derived from ideal power-law distributions will exhibit
deviations from perfect power-law behavior. Truncation errors occur at the smallest scales since dunite width is
limited by the resolution of the image. At the larger scales, object width is limited by the size of the area of
interest. In addition, censorship can systematically diminish the sampling frequency. At the grain scale (0.5 -
3cm) it is very difficult to distinguish the matrix of olivine around pyroxenes in the harzburgite from a discrete
dunite. Even though all widths are subject to this precision limit, small scale features are most affected, since
the error is a larger fraction of the true width. At the largest scale, the widths of dunites with one boundary
outside the field of view are also underestimated. This type of censoring can occur for any object, but is more
likely for larger objects. For any of these reasons, the number of the largest and smallest dunites are
underestimated. Several corrections have been developed to account for these errors in cumulative frequency
plots (e.g. [Barton and Zoback, 1992; Laslett, 1982]). However, the effects of the corrections are minimal if the
relationship is measured from the central linear portion of the distribution [Pickering et al., 1995], which
comprises the majority of the data. We define the central linear portion of the distribution as data which lie
within the 80th percentile of the cumulative percentage of distance from the median. In addition, fitting dunite
widths over several different, yet overlapping, length scales, minimizes the effects of errors which result in
undersampling.
Values of D and a are obtained from the CDF data using a linear regression with data weighted by the
studentized residuals to eliminate outliers with high leverage. We fit the linearized system,
log log logF a D w= − , using a least squares method. Outliers are culled based on the value of their
studentized residuals, and the retained data are refit. For a more complete description, see ([Weisburg, 1985]
p109-117). Values of the fitted parameters for both individual locations and all data are shown in table 1. For
the data collected in Oman, the CDFs for each data set fall on a common distribution line (D=1.05, a=0.08)
spanning approximately four orders of magnitude. (Figure 8) In more general terms, the fit to all data sets
indicates the mantle is composed of ~10% dunite, consistent with previous field observations of 5-15%
[Boudier and Coleman, 1981; Lippard et al., 1986], and for a given dunite size, there exists 10D, or ~11 times as
many dunites an order of magnitude narrower.

Table 1: D a R2 % DataRetained
Lufti o/c #10 2.2 0.003 0.96 72Lufti o/c #18 1.8 0.4 0.96 90Lufti 1D composite 0.8 0.09 0.99 99Mosque 1.6 0.1 0.98 70Mountainside 1.5 0.3 0.96 82Muscat Airphoto 2.0 1.6 0.99 67All Data (simul-fit) 1.05 0.08 0.95 98
Discussion
Dunite melt conduits as observed in the shallow mantle section of the Oman ophiolite range in size from
less than 1 cm to nearly 100 meters. In addition, the abundance of these dunites exhibit a scale-invariant power-
law dependence on width as measured over four orders of magnitude. In the following section, we use the
size/frequency distribution of dunites as measured in Oman to assess the proposed mechanisms for the
formation of replacive dunites and subsequently estimate the total unequilibrated melt flux a dunite network can
accommodate beneath oceanic spreading centers.
Extrapolation to the melting region
We can now estimate the size and abundance of dunite melt conduits over much larger length scales (i.e.
the melting region beneath mid-ocean ridges) by extrapolating the power-law size frequency distribution
measured in this study. The CDF data are normalized per unit of observation length to enable comparison of
data from regions of different size. This normalization also allows for easy extrapolation, simply by
multiplying the distribution function by the desired length scale, L. Therefore, the number of dunites wider than
w predicted in L meters of observation is defined as
(3) Fa
wLw D
= .
Extrapolation in this manner adequately predicts the abundance of the largest dunites observed in
individual massifs in Oman (L=10 km) as measured by Kelemen et al. [2000]. (Figure 9) Estimating dunite
abundance over length scales commensurate with the melting region beneath mid-ocean ridges requires one
order of magnitude of additional extrapolation (L=100 km). Our results suggest there exists at least one dunite
as wide as ~5 km in the melting region beneath an oceanic spreading center (figure 9). Unfortunately, a dunite

of this width, even with a 3-5% steady state melt fraction, is as yet undetectable by seafloor broadband seismic
networks. [Hung et al., 2000]
Mechanisms of Dunite Formation
Dunites have been hypothesized to form by (1) diffusive reaction around melt-filled hydrofractures
[Nicolas, 1986; Nicolas, 1990; Suhr, 1999]; (2) random mergings of growing reaction zones around several
hydrofractures [Kelemen et al., 2000]; and (3) a reactive infiltration instability resulting in high porosity
conduits. [Aharonov et al., 1995; Kelemen and Dick, 1995; Kelemen et al., 1995; Spiegelman et al., 2001].
(Figure 10)
For all three hypotheses, replacive dunites are formed by reaction between ascending MORB melts and the
surrounding peridotite. As pressure decreases, the solubility of silica-rich phases (opx and cpx) in basalt
increases. Therefore, ascending melts dissolve pyroxene and precipitate olivine, increasing the liquid mass and
creating dunite in its wake. [Kelemen, 1990 #47; Daines, 1994 #48] Kinetic studies show that these reactions
can occur rapidly [Brearley and Scarfe, 1986; Kuo and Kirkpatrick, 1985a; Kuo and Kirkpatrick, 1985b; Zhang
et al., 1989]. The discriminating difference between hypotheses is the melt transport mechanism. In (1) and
(2), pyroxene-undersaturated melt within hydrofractures forms dunite along the margins as the melt reacts with
the wall rock. In (3), there is no crack, and high porosity dunite channels form as a result of a dissolution
instability. The increased porosity resulting from the dissolution reaction increases the local permeability,
which in turn increases the melt flux to the area. The increased flux draws in more undersaturated melt,
resulting in further dissolution.

Dunites as diffusive reaction zones
Dunite growth as reaction zones around melt filled hydrofractures is limited by silica diffusion in the melt.
Whether in hydrofractures or in the surrounding porous rock, buoyancy-driven melt transport is predominantly
vertical. However, dunite margins grow in the direction orthogonal to melt transport. As a result, advective
lateral material exchange between melts at the reaction front and undersaturated melts in the hydrofracture is
small. Since kinetics of pyroxene dissolution are fast, silica must be continually removed from the reaction
front keep dissolution going. Therefore, lateral material transport must occur by diffusion.
If dunites are diffusive reaction zones, then the time required for formation can be estimated using Fick’s
2nd law
(4)dC
dtD
d C
dweff= −2
2.
Assuming the melt composition in the hydrofracture, (i.e. degree of undersaturation) remains constant, the
dunite width, w, is proportional to the formation time, t, by
(5) w D teff≈
The effective diffusivity, Deff, of a particular species in the two phase system is defined as
(6) D D Deff melt rock= + −( )φ φ1 ,
where φ is the interconnected porosity and Dmelt and Drock are the diffusivities in the melt and solid phases,
respectively. Given a moderate porosity of 1-3% and Dmelt≈10-11 m2/s and Drock≈10-15 m2/s [Lesher et al., 1996],
the time required to form the largest observed dunites in Oman (~100m) is 250-750 Ma. However, the lifetime
of any solid material in the melting region beneath a spreading center is only 0.8-10 Ma for spreading rates of
120-10 mm/yr, respectively. Therefore, the widest dunites that can be formed by diffusion around melt-filled
hydrofractures is 3-20 m (depending on porosity and spreading rate). (Figure 11) If the spreading rate during
the formation of the igneous crust in Oman was at least 50 mm/yr, then dunites wider than 5-9 m could not be
formed as the result of diffusion alone.
Dunites as merging reaction zones
Large dunites (> 10 m wide) are present in the Oman ophiolite in the abundances predicted by the observed
power-law (~10/km). However, diffusion around individual melt-filled hydrofractures cannot explain their

formation. In modeling dunite formation as reaction zones around cracks, Kelemen et al. [2000] suggested that
wide dunites may be the result of random merging of reaction zones around individual hydrofractures.
To test this hypothesis, we examined a series of forward models in which reaction zones around dunites are
allowed to grow and merge and compared the results to the distribution of observed dunite widths in Oman.
These models start with an initial, spatially-random distribution of five parallel cracks. Reaction zones around
each crack grow with the square root of time. In addition, five new dunites nucleate at each time step. With
time, the merging of reaction zones gives the appearance of increasingly wider dunites, and a weak power-law
size/frequency distribution begins to emerge. However, the merging process fills space rapidly. After 200
timesteps, the largest dunites are only ~20 times wider than the initial width, but the dunites occupy
approximately 42% of the total area. (Figure 12a) By the time very wide dunites (>103 times the initial width)
form, more than 94% of the model space is filled with dunite and the power-law has degraded. (Figure 12b)
We examined a range of growth and nucleation rates, which affect the time required to reach dunite
saturation, but in all cases, the power-law never spanned more than 1.5 orders of magnitude before dunites fill
more than 50% of the available space, much greater than even the most dunite rich regions examined in this
study. Additional models parameters could be added to modify the fracture mechanics or diffusive growth as a
function of dunite width (i.e. new dunites may preferentially nucleate near larger dunites which could also grow
faster). However, there is as yet no evidence to suggest either of these are necessary. Preliminary
size/frequency data for harzburgites (the space between dunites) in the images presented here exhibit
exponential distributions, suggesting the random spatial distribution of dunites. In addition, the diffusion
equation (4) specifies that the growth rate for any given dunite should decrease with time.
Dunites as Porous Conduits
Dunites may represent high porosity melt channels formed as a result of the reactive migration of melt in a
solubility gradient. [Aharonov et al., 1995; Kelemen and Dick, 1995; Kelemen et al., 1995; Spiegelman et al.,
2001] As melt migrates upward, it becomes progressively undersaturated in pyroxene. The resulting reaction
between the melt and harzburgite dissolves pyroxene and precipitates olivine while increasing the liquid mass
[Daines and Kohlstedt, 1994; Kelemen, 1990]. The increased porosity increases the local permeability, which
in turn increases the melt flux to the area. The increased flux draws in more undersaturated melt, resulting in

further dissolution. Numerical models of this positive feedback, or reactive infiltration instability, indicate that
a self-organized network of high porosity dunite conduits can rapidly form within the melting region [Aharonov
et al., 1995; Spiegelman et al., 2001].
The primary requirement of the melt transport process is that it provide a sufficient flux of unequilibrated
melt to the ridge axis to form the oceanic crust. We can assess the ability of a high-porosity dunite network to
accommodate this flux using the dunite size/frequency relationship established from our field observations. The
total melt flux to the ridge can be estimated as the product of the crustal thickness, half-spreading rate, and ridge
length. Assuming a constant global crustal thickness of 6 km, the estimated melt flux to the ridge is 60-900
m3/yr per meter of ridge segment along axis for slow- and fast-spreading ridges (0.01 to 0.15 m/yr),
respectively.
The total flux through the dunite network can be estimated by integrating the predicted flux in a dunite of a
given size with the observed size/frequency data. The flux in an individual dunite, Jw, can be defined as
(7) J vww = φ ,
which is the product of the dunite width, w, and the Darcy flux
(8) φ ρη
vk g= ∆
,
where ∆ρg is the driving pressure gradient, η is the melt viscosity, and the permeability, k, is a function of
porosity, φ, grain size, d, and geometry, C:
(9) kd
C
n
= φ 2
.
The total flux of the system, Jtot, is the integral of the product of the flux function, Jw, and the dunite PDF, fw,
over the range of dunite sizes predicted for the given length scale, L, where
(10a) J J f dwtot w ww
w
= ∫min
max
(10b) J vwaD
wL wtot
w
w
D= ⋅ ⋅∫ +φ
min
max
1 d .
To estimate the total flux through all dunites, the minimum bound for the integral, wmin, is equivalent to the
width of the smallest observed dunite, (~1 cm). The upper integration bound, wmax, is determined from the

extrapolation of the power-law at the length scale of the melting region. However, as discussed above, only
dunites greater than the length scale of diffusive equilibration can preserve chemical disequilibrium. Therefore
the total flux of unequilibrated melt occurs only through dunites wider than 5-10 m.
In addition, flux must be conserved where porous conduits merge. In systems where flux is conserved at
binary intersections the number of channels is inversely proportional to the flux they carry, or fw ∝ J-1w [Hart,
1993]. In other words, at each intersection, two channels each carrying one unit of flux join to form one
channel carrying twice the flux. This consequence of flux conservation is observed in theoretical [Aharonov et
al., 1995] and numerical [Spiegelman et al., 2001] models of reactive porous flow. Our dunite size/frequency
observations from Oman indicate that fw ∝ w-(D+1). Equating these relationships for fw suggests that flux is non-
linearly proportional to dunite width, or Jw ∝ wD+1. Using this width-flux relation, we can define a porosity
scaling as a function of dunite width
(11) φ φ=
max
max
w
w
Dn
,
assuming grain size, melt viscosity, melt geometry, or the driving pressure gradient do not vary significantly.
By specifying the maximum porosity, φmax, in the largest dunite, wmax, the Darcy flux (8) can then be expressed
as
(12) φ φ ρη
vd g
C
w
w
n D
=
max
max
2∆.
Therefore after substitution of (12) into (10b), if flux is non-linearly proportional to dunite width, the total flux
can be expressed as
(13) Jd gaDL
C ww wtot
n
D= −( )φ ρ
ηmax
maxmax min
2∆.
Adopting the spreading rate constraint for Oman, we assume that all flux through dunites wider than 10 m
will preserve disequilibrium between migrating melt and the surrounding harzburgite. For length scales
commensurate with mid-ocean ridge spreading centers (L=100 km), the largest dunites in the network may be
as wide as 5000 m. Given a maximum porosity in the widest dunites of 1-3%, the total flux through the dunite
network is comparable to the observed ridge flux. (Figure 13a) More importantly, the flux of unequilibrated
melt accounts for greater than 99% of the total melt flux.

Flux conservation is a necessary constraint on the melt flux model. A linear melt flux model which
assumes a constant Darcy flux (e.g. integration of (10b) assuming porosity is independent of dunite width), does
not reproduce the observed fluxes of unequilibrated melt at mid-ocean ridges. The total ridge flux in the linear
model can be accommodated with all dunites with porosities less than 1%. However, the unequilibrated melt
flux accounts for only ~45% of the total flux, implying a composition for igneous oceanic crust very different
(andesite) than what is observed (gabbro). (Figure 13b) Even if we assume that dunite widths in the melting
region are limited to the widest dunites observed in Oman (wmax=100 m), the non-linear flux model (Figure 14a)
supplies a sufficient unequilibrated melt flux (~95% of the total flux) to satisfy the mid-ocean ridge constraints
at reasonable porosities (φmax<4%) and the linear flux model (figure 14b) still does not (~28% of the total flux).
These results indicate that melt transport through dunites wide enough to preserve disequilibrium with the
shallow mantle can be accommodated entirely by porous flow, and thus there is no requirement for transport
through melt-filled cracks.
Conclusions
Dunite widths as measured in the mantle section of the Oman ophiolite exhibit a scale-invariant power-law
size/frequency distribution over 4 orders of magnitude. The power law slope (D=1.05) predicts that there exists
~11 times more dunites for every order of magnitude decrease in dunite width. In addition, the percentage of
dunite predicted by the power-law (~10%) is consistent with field estimates of dunite in the mantle section of
the Oman ophiolite. Extrapolation to larger length scales is consistent with field observations at the massif
scales and suggests dunites as wide as 5 km may exist in the melting region beneath spreading centers.
Diffusive reaction zones around individual melt-filled hydrofractures cannot explain the formation of very
wide dunites, as the time required to form the largest observed dunites is far greater than the residence time of
solid material in the melting region. Although, for the assumed spreading rate of the spreading center that
formed the Oman ophiolite, dunites less than ~10 m may be formed by this process. Forward models for the
formation of wide dunites by the random merging of reaction zones rapidly fills space and does not generate the
robust, self-consistent power-law relationship observed in the field.
We use the dunite width size/frequency statistics and diffusive equilibration length constraints to estimate
the total flux of unequilibrated melt to the ridge axis. In a system conserving flux, porous flow in dunite

dissolution channels can accommodate the observed unequilibrated melt flux to the ridge over a wide range of
spreading rates and moderate porosities.

Aharonov, E., J.A. Whithead, P.B. Kelemen, and M. Speigelman, Channeling instability of upwelling melt inthe mantle, J. Geophys. Res., 100, 20433-20450, 1995.
Allan, J.F., and H.J.B. Dick, Cr-rich spinels as a tracer for melt migration and melt-wall rock interaction in themangle: Hess Deep, leg 147, Sci. Res. Ocean Drill. Prog., 147, 157-172, 1996.
Arai, S., and K. Matsukage, Petrology of gabbro-troctolite-peridotite complex from Hess Deep, EquatorialPacific: implications for mantle-melt interaction within the oceanic lithosphere, Sci. Res. Ocean Drill. Prog.,147, 135-155, 1996.
Augé, T., Chromite deposits in the northern Oman ophiolite: mineralogical constraints, Mineral. Deposita, 22,1-10, 1987.
Barton, C.A., and M.D. Zoback, Self-similar distribution and properties of macroscopic fractures at depth incrystalline rock in the Cajon Pass Scientific borehole., J. Geophys. Res., 97, 5181-5200, 1992.
Beattie, P., Uranium- thorium disequilibria and partitioning on melting of garnet peridotite, Nature, 363, 63-65,1993.
Boudier, F., and R.G. Coleman, Cross section through the peridotite in the Samail ophiolite, southeastern Omanmountains, J. Geophys. Res., 86, 2573-2592, 1981.
Braun, M.G., G. Hirth, and E.M. Parmentier, The effects of deep damp melting on mantle flow and meltgeneration beneath mid-ocean ridges, EPSL, 176, 339-356, 2000.
Brearley, M., and C.M. Scarfe, Dissolution rates of upper mantle minerals in an alkali basalts melt at highpressure: An experimental study and implications for ultramafic xenolith survival, J. Petrol., 27, 1157-1182,1986.
Cannat, M., How thick is the magmatic crust at slow spreading oceanic ridges?, J. Geophys. Res., 101, 2847-2857, 1996.
Cannat, M., G. Ceuleneer, and J. Fletcher, Localization of ductile strain and the magmatic evolution of gabbroicrocks drilled at the mid-Atlantic ridge (23˚N), in Proc. ODP, Sci. Results, edited by J.A. Karson, M. Cannat,D.J. Miller, and D. Elthon, pp. 77-98, 1997.
Coleman, R.G., Tectonic setting for ophiolite obduction in Oman, J. Geophys. Res., 86, 2497-2508, 1981.Daines, M.J., and D.L. Kohlstedt, Transition from porous to channelized flow due to melt/rock reaction during
melt migration, Geophys. Res. Lett., 21, 145-148, 1994.Dick, H.J.B., Abyssal peridotites, very slow spreading ridges, and ocean ridge magmatism, in Magmatism in the
ocean basins, edited by A.D. Saunders, and M.J. Norry, pp. 71-105, Geological Society of America, 1989.Dick, H.J.B., and T. Bullen, Chromian spinel as a petrogenetic indicator in abyssal and alpine-type peridotites
and spatially associated lavas, Contrib. Mineral. Petrol., 86, 54-76, 1984.Dick, H.J.B., and J.H. Natland, Late-stage melt evolution and transport in the shallow mantle beneath the East
Pacific Rise, in Proceedings of the Ocean Drilling Program, Scientific Results, edited by C. Mevel, K.M.Gillis, J.F. Allan, and P.S. Meyer, pp. 103-134, ODP, 1996.
Dunn, R.A., D.R. Toomey, and S.C. Solomon, Three dimensional seismic structure and physical properties ofthe crust and shallow mantle beneath the East Pacific Rise at 9°30' N, J. Geophys. Res., 105, 23,537-23,555,2000.
Elthon, D., Isolmolar and isostructural pseudo-liquidus phase diagrams for oceanic basalts, Amer. Mineral., 68,506-511, 1983.
Elthon, D., Pressure of origin of primary mid-ocean ridge basalts, in Magmatism in the Ocean Basins, edited byA.D. Saunders, and M.J. Norry, pp. 125-136, Geological Society, 1989.
Elthon, D., and C.M. Scarfe, High pressure phase equilibria of a high-magnesia basalt: implications for theorigin of mid-ocean ridge basalts, Carnegie Inst. Wa. Yrbk., 277-281, 1980.
Forsyth, D.W., S.C. Webb, L.M. Dorman, and Y. Shen, Phase velocity of Raleigh wave in the MELTexperiment of the east pacific rise, Science, 280, 1235-1238, 1998.
Glennie, K.W., M.G.A. Boeuf, M.W. Hughes Clarke, M. Moody-Stuart, W.F.H. Pilaar, and B.M. Reinhardt,Geology of the Oman mountains, 423 pp., 1974.
Hart, S.R., Equilibration during mantle melting: A fractal tree model, Proc. Natl. Acad. Sci. USA, 90, 11914-11918, 1993.
Hirschmann, M.M., and E.M. Stolper, A possible role for garner pyroxenite in the origin of the "garnetsignature" in MORB, Contributions to Mineralogy and Petrology, 124, 185-208, 1996.
Hung, S.-H., D.W. Forsyth, and D.R. Toomey, Can a narrow, melt-rich, low-velocity zone of mantle upwellingbe hidden beneath the East Pacific Rise? Limits from waveform modeling and the MELT experiment, J.Geophys. Res., 105 (4), 7945-7960, 2000.

Johnson, K.T., and H.J.B. Dick, Open system melting and temporal and spatial variation of peridotite and basaltat the Atlantis II fracture zone., J. Geophys. Res., 97, 9219-9241, 1992.
Johnson, K.T.M., H.J.B. Dick, and N. Shimizu, Melting in the oceanic upper mantle: an ion microprobe studyof diopsides in abyssal peridotites, J. Geophys. Res., 95, 2661-2678, 1990.
Kelemen, P.B., Reaction between ultramafic rock and fractionating basaltic magma. I. Phase relations, theorigin of calc-alkaline magma series, and the formation of discordant dunite, J. Petrol., 31, 51-98, 1990.
Kelemen, P.B., M.G. Braun, and G. Hirth, Spatial distribution of melt conduits in the mantle beneath oceanicspreading ridges: Observations from the Ingalls and Oman ophiolites, edited by G.G. Geosyst., 2000.
Kelemen, P.B., and H.J.B. Dick, Focused melt flow and localized deformation in the upper mantle:juxtaposition of replacive dunite and ductile shear zones, J. Geophys. Res., 100, 423-438, 1995.
Kelemen, P.B., G. Hirth, N. Shimizu, M. Spiegelman, and H.J.B. Dick, A review of melt migration processes inthe adiabatically upwelling mantle beneath spreading ridges, Phil. Trans. Roy. Soc., Lond. A, 355, 283-318,1997a.
Kelemen, P.B., K. Koga, and N. Shimizu, Geochemistry of gabbro sills in the crust-mantle transition zone ofthe Oman ophiolite: Implications for the origin of the oceanic crust, Earth Planet. Sci. Lett., 146, 485-488,1997b.
Kelemen, P.B., N. Shimizu, and V.J.M. Salters, Extraction of mid-ocean ridge basalt from the upwelling mantleby focused flow of melt in dunite channels, Nature, 375, 747-753, 1995.
Koga, K.T., N. Shimizu, and T.L. Grove, Disequilibrium trace element redistribution during garnet to spinelfacies transformation, in Proc. 7th Int. Kimberlite Conf., edited by J.L. Gurney, M.D. Pascoe, and S.H.Richardson, pp. 444-451, 1998.
Kuo, L.-C., and R.J. Kirkpatrick, Dissolution of mafic minerals and its implications for the ascent velocities ofperidotite-bearing basaltic magmas, J. Geol., 93, 691-700, 1985a.
Kuo, L.-C., and R.J. Kirkpatrick, Kinetics of crystal dissolution in the system diopside-forsterite-silica, Am. J.Sci., 285, 51-90, 1985b.
Laslett, G.M., Censoring and edge effects in areal and line transect sampling of rock joint traces, Math. Geol.,14, 125-140, 1982.
Lesher, C.E., R.L. Hervig, and D. Tinker, Self-diffusion of network formers (silicon and oxygen) in naturallyoccurring basaltic liquid, Geochim. Cosmochim. Acta, 60, 405-413, 1996.
Lippard, S.J., A.W. Shelton, and I.G. Gass, The ophiolite of northern Oman, 178 pp., Blackwell, Oxford, 1986.Lundstrom, C.C., J. Gill, Q. Williams, and M.R. Perfit, Mantle melting and basalt extraction by equilibrium
porous flow, Science, 270, 1958-1961, 1995.McKenzie, D., 230Th-238U disequilibrium and the melting processes beneath ridges axes, Earth Planet. Sci.
Lett., 72, 149-157, 1985.Nicolas, A., A melt extraction model based on structural studies in mantle peridotites, J. Petrol., 27, 999-1022,
1986.Nicolas, A., Melt extraction from mantle peridotites: Hydrofracturing and porous flow, with consequences fro
oceanic ridge activity, in Magma Transport and storage, edited by M.P. Ryan, pp. 1-26, Wiley, 1990.Nicolas, A., and F. Boudier, Mapping oceanic ridge segments in Oman ophiolite, Journal of Geophysical
Research, 100, 6179-6197, 1995.Nicolas, A., F. Boudier, B. Ildefonse, and E. Ball, Accretion of Oman and United Arab Emirates ophiolite -
Discussion of a new structural map, Marine Geophys. Res., 21, 147-179, 2000.Nicolas, A., and B. Ildefonse, Flow mechanism and viscosity in basaltic magma chambers, Geophysical
Research Letters, 16, 2013-2016, 1996.O'Hara, M.J., Primary magmas and the origin of basalts, Scot. J. Geol., 1, 19-40, 1965.Pallister, J.S., and C.A. Hopson, Samail ophiolite plutonic suite: field relations, phase variation, cryptic
variation and layering, and a model of a spreading ridge magma chamber, J. Geophys. Res, 86, 2593-2644,1981.
Pallister, J.S., and R.J. Knight, Rare-earth element geochemistry of the Samail ophiolite near Ibra, Oman, J.Geophys. Res., 86, 2673-2697, 1981.
Pickering, G., J.M. Bull, and D.L. Sanderson, Sampling power-law distributions, Tectonophysics, 248, 1-20,1995.
Salters, V.J.M., and S.R. Hart, the hafnium paradox and the role of garnet in the source of mid-ocean-ridgebasalts, Nature, 342, 420-422, 1989.
Spiegelman, M., P.B. Kelemen, and E. Aharonov, Causes and consequences of flow organization during melttransport: The reaction infiltration instability, J. Geophys. Res., 106, 2061-2078, 2001.
Stolper, E., A phase diagram for mid-ocean ridge basalts: preliminary results and implications for petrogenesis,Contrib. Mineral. Petrol., 74, 13-27, 1980.
Suhr, G., Melt migration under oceanic ridges: Inferences from reactive transport modeling of upper mantlehosted dunites, J. Petrol., 40, 575-599, 1999.
Toomey, D.R., W.S.D. Wilcock, S.C. Solomon, W.C. Hammond, and J.A. Orcutt, Mantle Seismic structurebeneath the MELT region of the east pacific ridge from P and S wave tomography, Science, 280, 1224-1227,1998.
Vera, E.E., J.C. Mutter, P. Buhl, A.A. Orcutt, A.J. Harding, M.E. Kappus, R.S. Detrick, and T.M. Brocher, Thestructure of 0- to .2-My-old crust at 9 N on the East Pacific Rise from expanded spread profiles, J. ofGeophysical Research, 95, 15529-15556, 1990.
Webb, S.C., and D.W. Forsyth, Structure of the upper mantle under the EPR from waveform inversion ofregional events, Science, 280, 1227-1229, 1998.
Weisburg, S., Applied Linear Regression, 324 pp., Wiley and Sons, New York, 1985.Zhang, Y., D. Walker, and C.E. Lesher, Diffusive crystal dissolution, Contrib. Mineral. Petrol., 102, 492-513,
1989.

Ol SiO2
Cpx
Ol SiO2
Cpx
Mg# > 66
Mg# < 66
1 atm
10 kb15
20
25
Ol SiO2
Plag
Ol SiO2
Plag
Mg# > 66
Mg# < 66
1 atm
10 kb15
2025
Figure 1. Pressures of equilibration of ~10,000 MORB glasses (l) as inferred from pseudo-ternary phase diagrams projected from a) plagioclase and b) clinopyroxene [after Elthon, 1983]. Primitive MORB liquids (p), defined by Mg# (Mg/Mg+Fe) in excess of 66, were last saturated in orthopyroxene at pressures of 8-10 kb, suggesting these liquids passed through the upper 25-30 km of the mantle without reacting with the surrounding harzburgite. Glass compositions for this global compilation are from the G3 MORB database. The positions of the cotectic lines at all pressures (1 bar - 25kb) are taken from Elthon [1983].

Dunite Width (m)
Cum
ulat
ive
Freq
uenc
y (#
>x)
(m
-1)
0.001
0.01
0.1
1
10
100
0.001 0.01 0.1 10 1001
Figure 2. Dunite size and abundance as measured along a 208 m long composite section of mantle peridotite from Wadi Lufti, Oman shows a robust power-law relationship between dunite width and frequency that extends over more than four orders of magnitude. Cumulative frequency is defined here as the number of dunites greater than a given width, w.

meters
0.0 0.5 1.0 1.5 2.0
Dunite
Harzburgite
Gravel
0.0 0.5 1.0meters
Figure 3. Outcrop mosaics from Wadi Lufti, Oman. The mosaics for a) Outcrop #10 and b) Outcrop #18 are composed of approximately 40 and 170 individual photographs, respectively, taken ~1.5 m above the outcrop surface. Contact information is determined at the outcrop and subsequently digitized from the scaled mosaic.
Dunite
Harzburgite
a.
b.

0 1 2 3 4 5meters
Figure 4. Photomosaic of dunites behind a mosque in Mutrah, part of the Muscat massif. Dunite locations were determined by image analysis and are seen here as the lighter regions in the image. Dunite orientations are measured in the field and used to correct the widths measured from each image
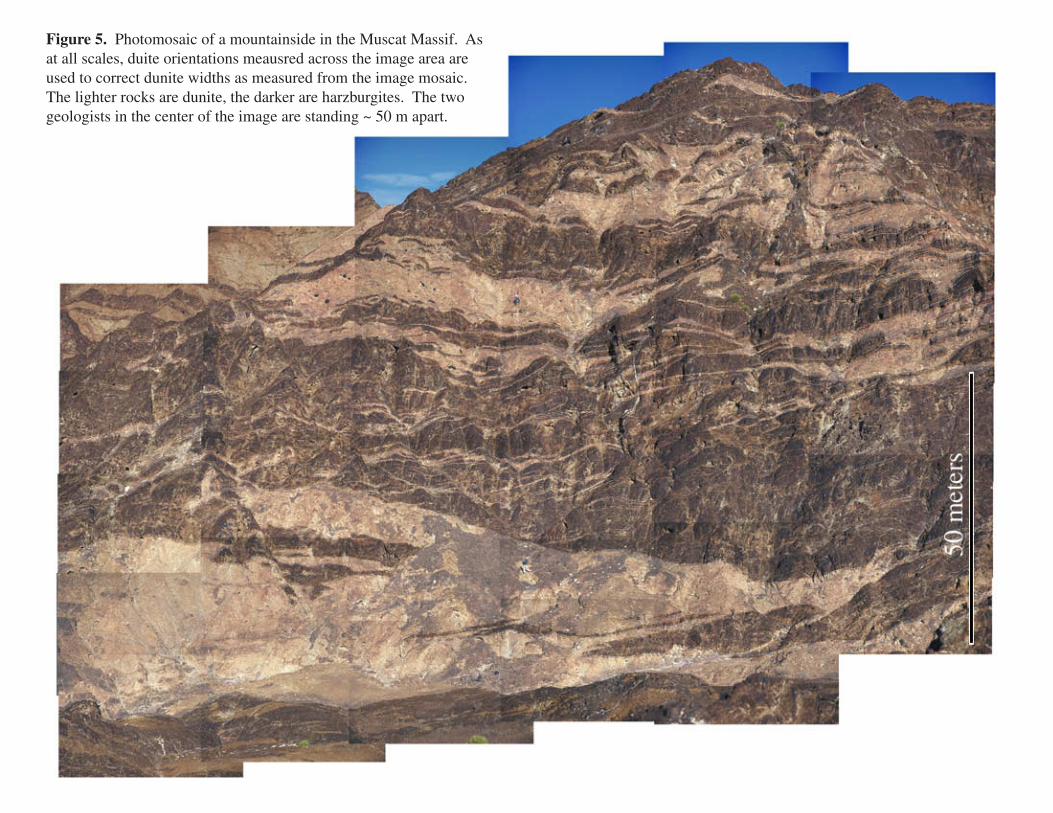
Figure 5. Photomosaic of a mountainside in the Muscat Massif. As at all scales, duite orientations meausred across the image area are used to correct dunite widths as measured from the image mosaic. The lighter rocks are dunite, the darker are harzburgites. The two geologists in the center of the image are standing ~ 50 m apart.

1 km
N
Figure 6. Aerial map of dunites from the Muscat - Mutrah region. Dunites locations were determined by both airphoto analysis and surface observations. Dunites are shown here as highlighted regions superimposed on the airphoto. The locations of figures 4 and 5 are shown by dashed regions.
N
4
5

Log
Cum
ulat
ive
Fre
quen
cy(#
dun
ites
> w
idth
)
Log Width
F(x)=a
xD
Single Outcrop
Figure 7. Idealized scale-invariant power-law distribution. This illustration demonstrates the how several data sets over a range of overlapping length scales can be used to determine the true power law distribution of the dunite population. Individual outcrops exhibit a characteristic linear relationship between log witdth and log frequency (inset). If the distribution of dunite widths is scale-invariant, then every outcrop will lie along a common line.

0.01 0.1 1 10 100-7
-6
-5
-4
-3
-2
-1
0
1
Dunite Width (m)
Log
Cum
ulat
ive
Fre
q (#
>x)
(m
-1 )
Oman Ophiolite Dunites
D = 1.05a = 0.08R2 = 0.90
2
3a
3b4
5
6
Figure 8. Width distribution data from dunites in the mantle section of the Oman ophiolite collected from lithologic sections and photomosaics with length scales spanning more than 4 orders of magnitude. The central portion of each data set falls along a common line suggesting scale-invariant power-law distribution of dunite widths. To reduce the effects of censorship and truncation erros, only data within 80% of the median value (l) for each data set are used in the fit (dashed line). The data sets shown here are labeled with the corresponding figure number.

10-2
100
102
104
10-5
100
105
1010
L=10 km
L=1 m
L=100 km
D =1.05a =0.08
Dunite width (m)
Cum
ulat
ive
Freq
uenc
y of
Dun
ites
(#>
w) Extrapolation to the Melting Region
Figure 9. Extrapolation for dunite abundance to larger length scales using the power-law size/frequency distribution determined from the dunite width data from Oman. For length scales on order of individual massifs in Oman, (10 km) the extrapolation predicts dunite abundances consistent with field oberservations. [Kelemen et al., 2000] Extrapolation to length scales commensurate with the melting region beneah mid-ocean ridges (100 km) predicts the existence of dunites as wide as several kilometers.

Hypotheses for Dunite Formation
Reaction Zones around Melt Filled Hydrofractures
Porous Flow Channels Formed by Dissolution Instability
Random Merging of Growing Reaction Zones
a
b
c
Figure 10. Three hypotheses for replacinve dunite formation in the shallow mantle based on reacton of silica undersaturated basalts with shallow mantle harzburgites. a.) Dunites may form as diffusive reaction zones around melt filled hydrofractures. b.) Random merging of growing reaction zones may give the appearance of large dunites. c.) Dunites may form by a reactive infiltration instability creating high porosity dunite melt conduits.

0 2 4 6 8 10 122
4
6
8
10
12
14
16
18
20
22
Spreading Rate (cm/yr)
Dun
ite W
idth
(m
)
Dunite Growth by Diffusion
Oman Ophiolite
φ = 5%
2%
1%
Figure 11. Width of dunite reaction zones around melt filled hydrofractures as a function of spreading rate. As spreading rate increases, the time available for diffusive transport of material in the melting region decreases. For moderate porosities and spreading rates greather than 5 cm/yr, dunites wider than ~12 m cannot form by diffusion around a melt filled hydrofracture within the residence time of solid material in the melting region. To maximize the time for diffusion, these calculations assume dunites begin forming at the base of the melting region and remain active until reaching the surface.
3%4%

100
101
102
103
104
10-7
10-6
10-5
10-4
10-3
10-2
10-1
Dunite Width
Cum
ulat
ive
Fre
quen
cy (
#>w
)
100
101
102
103
104
10-7
10-6
10-5
10-4
10-3
10-2
10-1
Dunite Width
Cum
ulat
ive
Fre
quen
cy (
#>w
)
Figure 12. Forward model of merging reaction zones around melt filled hydrofractures. An initially spatially random set of 5 cracks of width 1 are allowed to grow diffusively with the square root of time. At each timestep, 5 new cracks randomly nucleate and begin to grow. a.) At t=200, a weak power-law begins to form, but dunite widths span less than 2 orders of magnitude. At this point, dunites occupy ~42% of the total area. b.) By t=800, dunite widths show a power-law ranging ~3 orders of magnitude, but now 94% of the total area is occupied by dunites. Although merging of growing reaction zones as shown here can produce very wide dunites, the abundance statistics are not consistent with the field observations.
t=800t=200

0 0.02 0.04 0.06 0.08 0.110
-2
100
102
104
106
Estimated Ridge Flux
Porosity, φmax
Mag
ma
Flux
(m
3 /yr/
m) Non-Linear Flux Model
a
0 0.02 0.04 0.06 0.08 0.110
-2
100
102
104
106
Estimated Ridge Flux
Porosity, φ
Mag
ma
Flux
(m
3 /yr/
m) Linear Flux Model
b
Figure 13. Calculated melt flux through a porous dunite network as a function of porosity, given the abundance relationship determined by the power-law relationship derived from field observations. These calculations assume the largest dunites have widths predicted by the power-law for a length scale of 100 km, and that only dunites wider than 10 m can accomodate chemically unequilibrated melt flux. For the non-linear flux model (a), incorporating the flux conservation constraint, the unequilibrated flux (dashed line) is nearly 100% of the total flux (solid line) through the system and satisfies the observed ridge flux constraint (gray field) over a range of moderate porosities. In constrast, the unequilibrated flux estimated by the linear flux model accounts for only 45% of the total flux.

0 0.02 0.04 0.06 0.08 0.110
-2
100
102
104
106
Estimated Ridge Flux
Porosity, φmax
Mag
ma
Flux
(m
3 /yr/
m) Non-Linear Flux Model
a
0 0.02 0.04 0.06 0.08 0.110
-2
100
102
104
106
Estimated Ridge Flux
Porosity, φ
Mag
ma
Flux
(m
3 /yr/
m) Linear Flux Model
b
Figure 14. Calculated melt flux through a porous dunite network as a function of porosity, as in figure 13. These calculations assume the largest dunites are limited to 100 m wide, the widest observed in Oman. For the non-linear flux model (a), the unequilibrated flux (dashed line) accounts for 95% of the total flux (solid line) through the system and still satisfies the observed ridge flux (gray field) over a range of porosities. In constrast, the unequilibrated flux estimated by the linear flux model (b) accounts for only 28% of the total flux over a much smaller range in porosities.