Dummy eye measurements of microsaccades: Testing the...
17
Journal of Eye Movement Research, 8(1):1, 1-17 Dummy eye measurements of microsaccades: Testing the influence of system noise and head movements on microsaccade detection in a popular video-based eye tracker Frouke Hermens School of Psychology, University of Aberdeen, UK Whereas early studies of microsaccades have predominantly relied on custom-built eye trackers and manual tagging of microsaccades, more recent work tends to use video-based eye tracking and automated algorithms for microsaccade detection. While data from these newer studies suggest that microsaccades can be reliably detected with video-based systems, this has not been systematically evaluated. I here present a method and data examining microsaccade detection in an often used video-based system (the Eyelink II system) and a commonly used detection algorithm (Engbert & Kliegl, 2003; Engbert & Mergenthaler, 2006). Recordings from human participants and those obtained using a pair of dummy eyes, mounted on a pair of glasses either worn by a human participant (i.e., with head motion) or a dummy head (no head motion) were compared. Three experiments were conducted. The first experiment suggests that when microsaccade measurements make use of the pupil detection mode, microsaccade detections in the absence of eye movements are sparse in the absence of head movements, but frequent with head movements (despite the use of a chin rest). A second experiment demonstrates that by using measurements that rely on a combination of corneal reflection and pupil detection, false microsaccade detections can be largely avoided as long as a binocular criterion is used. A third experiment examines whether past results may have been affected by possible incorrect detections due to small head movements. It shows that despite the many detections due to head movements, the typical modulation of microsaccade rate after stimulus onset is found only when recording from the participants’ eyes. Keywords: Microsaccades, Fixational eye movements, Head motion, Eye tracking, Dummy eyes Introduction Microsaccades are small eye movements made dur- ing attempted visual fixation with properties similar to those of larger saccadic eye movements aimed to bring one’s gaze toward different regions of the visual field (for reviews, see Collewijn & Kowler, 2008; Martinez- Conde, Macknik, Troncoso, & Hubel, 2009; Rolfs, 2009). For example, microsaccades and larger amplitude sac- cades have both been found to follow the main se- quence, displaying a linear relationship between the amplitude of the saccade and the peak velocity (Zuber, This study was supported by funding from the Research Foundation-Flanders (FWO-Vlaanderen). The author wishes to thank Johan Wagemans, Cees van Leeuwen and Chie Nakatani for the use of equipment that enabled this work. Part of this work was carried out at the Laboratory of Exper- imental Psychology, University of Leuven, Belgium. Frouke Hermens is now at the School of Psychology, University of Lincoln, UK. E-mail: [email protected] Stark, & Cook, 1965). Further shared aspects are their binocular nature, the distribution of inter-saccadic in- tervals, the involvement of voluntary control, and their relation with spatial attention (for overviews, see Eng- bert, 2006; Rolfs, Kliegl, & Engbert, 2008). Because microsaccades are very small eye move- ments, the issue arises how to most reliably measure these movements. In contrast to past studies of mi- crosaccades, which often employed custom-built eye trackers (for an overview, see Collewijn & Kowler, 2008), more recent studies have mostly relied on video- based eye trackers. These eye trackers use an infrared camera to record images from the eyes, which are then analyzed for eye movements. Typically, two properties in the images are used (Morimoto & Mimica, 2005): the estimated position of the pupil and a reflection from the cornea (‘corneal reflection’ or the first Purkinje im- age). Studies of microsaccades, however, often rely on the estimate pupil position alone (all studies in Table 1 of Martinez-Conde et al., 2009, that use the Eyelink II system at 500Hz), possibly because pupil-only de- tection allows for a higher sampling rate in the eye 1
Transcript of Dummy eye measurements of microsaccades: Testing the...

Journal of Eye Movement Research, 8(1):1, 1-17
Dummy eye measurements of microsaccades:Testing the influence of system noise and head movements onmicrosaccade detection in a popular video-based eye tracker
Frouke HermensSchool of Psychology, University of Aberdeen, UK
Whereas early studies of microsaccades have predominantly relied on custom-builteye trackers and manual tagging of microsaccades, more recent work tends to usevideo-based eye tracking and automated algorithms for microsaccade detection.While data from these newer studies suggest that microsaccades can be reliablydetected with video-based systems, this has not been systematically evaluated. Ihere present a method and data examining microsaccade detection in an often usedvideo-based system (the Eyelink II system) and a commonly used detection algorithm(Engbert & Kliegl, 2003; Engbert & Mergenthaler, 2006). Recordings from humanparticipants and those obtained using a pair of dummy eyes, mounted on a pair ofglasses either worn by a human participant (i.e., with head motion) or a dummyhead (no head motion) were compared. Three experiments were conducted. Thefirst experiment suggests that when microsaccade measurements make use of thepupil detection mode, microsaccade detections in the absence of eye movementsare sparse in the absence of head movements, but frequent with head movements(despite the use of a chin rest). A second experiment demonstrates that by usingmeasurements that rely on a combination of corneal reflection and pupil detection,false microsaccade detections can be largely avoided as long as a binocular criterionis used. A third experiment examines whether past results may have been affectedby possible incorrect detections due to small head movements. It shows that despitethe many detections due to head movements, the typical modulation of microsaccaderate after stimulus onset is found only when recording from the participants’ eyes.
Keywords: Microsaccades, Fixational eye movements, Head motion, Eye tracking,Dummy eyes
Introduction
Microsaccades are small eye movements made dur-ing attempted visual fixation with properties similar tothose of larger saccadic eye movements aimed to bringone’s gaze toward different regions of the visual field(for reviews, see Collewijn & Kowler, 2008; Martinez-Conde, Macknik, Troncoso, & Hubel, 2009; Rolfs, 2009).For example, microsaccades and larger amplitude sac-cades have both been found to follow the main se-quence, displaying a linear relationship between theamplitude of the saccade and the peak velocity (Zuber,
This study was supported by funding from the ResearchFoundation-Flanders (FWO-Vlaanderen). The author wishesto thank Johan Wagemans, Cees van Leeuwen and ChieNakatani for the use of equipment that enabled this work.Part of this work was carried out at the Laboratory of Exper-imental Psychology, University of Leuven, Belgium. FroukeHermens is now at the School of Psychology, University ofLincoln, UK. E-mail: [email protected]
Stark, & Cook, 1965). Further shared aspects are theirbinocular nature, the distribution of inter-saccadic in-tervals, the involvement of voluntary control, and theirrelation with spatial attention (for overviews, see Eng-bert, 2006; Rolfs, Kliegl, & Engbert, 2008).
Because microsaccades are very small eye move-ments, the issue arises how to most reliably measurethese movements. In contrast to past studies of mi-crosaccades, which often employed custom-built eyetrackers (for an overview, see Collewijn & Kowler,2008), more recent studies have mostly relied on video-based eye trackers. These eye trackers use an infraredcamera to record images from the eyes, which are thenanalyzed for eye movements. Typically, two propertiesin the images are used (Morimoto & Mimica, 2005): theestimated position of the pupil and a reflection fromthe cornea (‘corneal reflection’ or the first Purkinje im-age). Studies of microsaccades, however, often rely onthe estimate pupil position alone (all studies in Table1 of Martinez-Conde et al., 2009, that use the EyelinkII system at 500Hz), possibly because pupil-only de-tection allows for a higher sampling rate in the eye
1

Journal of Eye Movement Research8(1):1, 1-17
Hermens, F. (2015)Dummy eye microsaccades
tracker used in these studies. The disadvantage, how-ever, of using pupil detection only is that recordingsare relatively noisy and sensitive to the movement ofthe participant’s head relative to the cameras (for exam-ple, due to movement of the head-band of the system).These are reflected in two possible sources of noise. Thefirst is caused by the uncertainty about which pixels inthe image belong to the pupil, dictated by factors suchas the detection threshold, the quality of the image,light-sources in the room, and properties of the eyesof the research participant. The second source involvessmall head movements which lead to the movement ofthe recorded image, which may be confused with eyemovements.
A recent comparison between a popular older sys-tem (a scleral search coil) and a video-based system(the Eyelink 1000) has suggested that for microsac-cade detection the two types of system may be com-parable (Kimmel, Mammo, & Newsome, 2012). Thiscomparison, however, was conducted in primates, al-lowing for more stringent head stabilization than typ-ically possible in human observers. In humans, video-based systems are often preferred, as they are less in-vasive than scleral coil systems. Video-based systemsallow for testing of a larger range of participants (e.g.,naive participants rather than the authors or associatedlab members) and longer measurement intervals, al-lowing for more complex research designs and morerepeated measurements per condition. Furthermore,video-based systems are commercially available, oftenrequiring little maintenance and easy to use. Studiesusing video-based systems often apply head stabiliza-tion by means of a chin rest, and the question there-for arises to which extent small head movements inthese chin rests, added to system noise, influences thedetection of microsaccades. I here present a methodand data aimed to answer this question. The meth-ods adds to a surrogate data technique used in earlierstudies (Engbert & Mergenthaler, 2006; Mergenthaler& Engbert, 2010; Rolfs et al., 2008; Otero-Millan, Cas-tro, Macknik, & Martinez-Conde, 2014) in which detec-tion is compared for actual data and surrogate data, forexample, to determine the optimal settings of the al-gorithm for detection. Surrogate data is obtained byshuffling the original data in such a way that impor-tant properties of the signal are maintained. Whilethis method allows for evaluating detection methods, itdoes not specifically address the influences of differentsources of noise.
The method presented here is based on a recentlyintroduced technique to examine the role of the sys-tem’s noise levels on the detection of microsaccades(Hermens & Walker, 2010). In this method, we usedtwo small black discs, serving as artificial pupils, at-tached to a glass dummy head on which the eye trackerrested. Before each recording, the eye tracker was cali-brated on a research participant, after which the head-band was transferred to the dummy head and record-
ings were made from the dummy eyes. Whereas thismethod provides information about the noise levelsof the recordings of the eye tracker, it does not esti-mate the influence of head movements of the researchparticipant. In the present work, I therefore modi-fied this setup by mounting the artificial pupils ontoa pair of glasses (Figure 1a) that can either be worn bythe dummy head (to estimate the amount of noise inthe recordings in the absence of head motion) or by ahuman participant (to estimate the influence of headmovements on the detection of microsaccades). A sec-ond change to the original setup involves the mount-ing of two metal clips, generating a signal that canbe interpreted by the system as a corneal reflection(details provided in Experiment 2). For practical rea-sons (availability of the eye tracker and computer codefor data analysis), I decided to focus on eye trackingwith the Eyelink II system (SR Research) and analy-sis with the algorithm proposed by Engbert and col-leagues (Engbert & Kliegl, 2003; Engbert & Mergen-thaler, 2006). Incidentally, this combination of meth-ods appears to be the most commonly used techniqueto study microsaccades in recent research. For exam-ple, in the overview by Martinez-Conde and collegues(2009) 25 of the 37 studies listed their Table 1 use thisparticular setup.
Three experiments were conducted, all applying acueing paradigm (Engbert & Kliegl, 2003; Hermens &Walker, 2010; Laubrock, Engbert, & Kliegl, 2005; Rolfset al., 2008). The first experiment focused on the in-fluence of system noise and head movements on theoverall properties of microsaccades. Participants wereasked to wear the pair of glasses with artificial pupilsas normal glasses, thereby blocking their view of thescreen. In this first experiment, in which only the pupilcenter was used to estimate gaze direction (in agree-ment with the typical setup of many past microsaccadestudies), high microsaccade rates were obtained in thehead movement condition, despite the use of the eyetracker’s motion correction setting. Experiment 2 in-vestigated whether this high detection rate can be re-duced by using the combined corneal reflection andpupil center setting of the system. Finally, Experiment3 investigated the extent to which the incorrect detec-tions due to head movements may have influenced animportant finding in the literature, sometimes referredto as the ’microsaccade signature’, reflecting the initialdecrease and subsequent increase of the microsaccaderate after the onset of a stimulus.
Experiment 1: Microsaccadeproperties
In Experiment 1, the influence of noise in the record-ings from the Eyelink II system on the detection of eyemovements is investigated by comparing dummy eyesmounted on a dummy head, dummy eyes mounted ona human head and human eyes.
2

Journal of Eye Movement Research8(1):1, 1-17
Hermens, F. (2015)Dummy eye microsaccades
Method
Participants. Test runs with the dummy eye setupwith the author as the participant showed that the rateof false microsaccade detections depended on the cali-bration of the system. To best mimic the setup of a typ-ical microsaccade study, data were therefore collectedacross several participants (each with their own cali-bration). Eleven students from the university of Leu-ven and author FH took part in the experiment. Thestudents all provided written consent for participationin the study, which was approved by the local ethicscommittee. They received 8.50 Euro for their participa-tion.
Apparatus. Eye movements were recorded using anEyelink II setup (SR research), consisting of two PCsand a head-mounted eye tracking device. One of thePCs recorded eye movements at a sampling rate of500Hz in the pupil-only mode, while the other PC wasused to present the stimuli to the participants. Thesestimuli were presented on a 21 inch Iiyama computermonitor at a 75Hz refresh rate placed at a distance of57cm from the participant. Dummy eye recordingswere obtained using a custom-built pair of glasses, con-structed from a pair of reading glasses, white stick-on paper and black insulation tape for the pupils, asshown in Figure 1a. Before deciding on the size ofdummy eye pupil to use, various size pupils weretested, suggesting that the results were only weaklyinfluenced by the size of the dummy pupils. Becauselarger pupils could be more easily cut into a circularshape, a slightly larger diameter (1.5cm) was used. Thissomewhat large size compared to human pupils was, inpart, compensated for by the larger distance from thedummy eyes where the cameras had to be placed dueto the space taken by the glasses. The dummy pupilswere placed in the center of a white background (ovalshape) measuring 5.5cm by 3.2cm. Head movementsof the participants were restricted with a chin rest thatcould be adjusted to the participant’s height.
Stimuli. As in earlier studies (e.g., Engbert & Kliegl,2003; Hermens & Walker, 2010), a cueing paradigmwas adopted. Participants maintained fixation on acentrally presented fixation symbol (1 by 1 degree in vi-sual angle; see Figure 1b), which turned into an arrow,after which a peripherally presented target (star shape,0.7 by 0.7 degrees in visual angle) was presented insideone of four laterally positioned place-holders (circles),presented at a distance of 9 degrees from visual fixa-tion. The stimuli were presented in all of the recordingconditions, including those in which recordings weremade from the dummy eyes.
Design and procedure. Participants performed sixblocks of 60 trials. Half of the blocks used the headmotion correction of the Eyelink II system, whereas inthe other half of the blocks this option was switched
off. This motion correction option makes use of a sen-sor on the head-band worn by the participant and fourmarkers on the corners of the screen, which providesinformation about the location of the head-band withrespect of the screen. Orthogonally to this manipula-tion, the type of input to the eye tracking system wasvaried. Before each block, participants performed thenine-point calibration procedure of the Eyelink II sys-tem, in which they fixated a series of sequentially pre-sented dots on the computer screen, until calibrationwas considered ‘good’ by the system (no obvious prob-lems) and the recorded eye positions were aligned witha three by three grid corresponding to the locations ofthe fixation targets. After calibration, there were threepossibilities. Either the head-band of the eye trackerwas moved to the dummy-head (Figure 1a) and theblock was completed while the system recorded fromthe dummy eyes. Alternatively, after calibration, par-ticipants put on the dummy eye glasses, after whichthe block continued while the system recorded fromthe dummy eyes. In these blocks, participants were in-structed to sit with their chin in the chin rest, close theireyes, and to try and sit as still as possible. In a thirdcondition calibration was followed by the standardcueing task while the system recorded from the partic-ipants’ eyes. Also in this task, participants were askedto sit in the chin rest and to avoid moving their head.The cueing task is illustrated in Figure 1b (see also,Hermens & Walker, 2010). Participants were asked tofixate a central fixation target that changed into an ar-row after 1000 to 1500ms. Participants remained fix-ated until the appearance of a peripheral target thatthey were asked to fixate as quickly as possible afterit appeared. Peripheral targets appeared equally oftenleft or right of fixation (never above or below fixation).They were paired with a valid arrow cue (pointing inthe same direction as the target) on 80% of the trials andwith an invalid cue (pointing in the opposite direction)on the remaining 20% of the trials. Note that while acueing paradigm was used, it is not believed that thisparadigm is critical for the present results. Instead, itprovides a means to collect fixation data across inter-vals of a typical duration in microsaccade research.
The order of the six blocks was randomized acrossparticipants, leading to a similar distribution of theconditions across participants without the need forkeeping a record of the order of presentation. Record-ing of eye movements during each trial continued untilthe detection of a large eye movement, based on a com-bined 80 deg/sec velocity and 3,000 deg/sec2 criterion(similar to Hermens & Walker, 2010). In all blocks, driftcorrection was performed before each tenth trial, whichinvolved participants fixating a centrally presented fix-ation target, confirmed by a key-press by the experi-menter (similar to Hermens & Walker, 2010). This cor-rection shifts all recorded eye positions according to therecorded position of gaze. While influencing the accu-rate localization of each recorded gaze position, it is not
3

Journal of Eye Movement Research8(1):1, 1-17
Hermens, F. (2015)Dummy eye microsaccades
expected to influence detections of shifts of gaze, as re-quired for microsaccade detection. In between blocks,participants were allowed a short break.
Data analysis. The recorded eye gaze positions dur-ing the fixation intervals (presentation of the fixationtarget and presentation of the cue; interval durationsbetween 2500ms and 3500ms) were analyzed for mi-crosaccades using the algorithm by Engbert and col-leagues (Engbert & Kliegl, 2003; Engbert & Mergen-thaler, 2006). In the algorithm, the two-dimensional ve-locity of each eye is compared to a threshold based onthe observed variance in the recorded eye position onthat trial (adopted to have blinks excluded to preventundefined thresholds). Sections of the eye trace witha velocity exceeding a 6 median-based SD threshold,temporally overlapping in both eyes for at least 1 sam-ple, and lasting for at least 6ms (3 data samples) wereclassified as microsaccades. For statistical comparisonsacross more than two levels univariate repeated mea-sures ANOVAs were used and a Greenhouse-Geissercorrection when appropriate. For t-tests, Hedges’s gis reported as a measure of effect size, computed us-ing the effect size toolbox for Matlab (Hentschke &Stuttgen, 2011).
Results
Figure 2a plots microsaccade rates (in Hz) across thedifferent conditions until target onset. In agreementwith Hermens and Walker (2010), low detection rateswere found when the dummy eyes were mounted ontothe dummy head. In contrast, high detection rateswere observed when the dummy eyes were mountedon a human head, suggesting that head movements ledto incorrect microsaccade detections. Rates for head-mounted dummy eyes were almost as high as wheneye movements were recorded from human eyes. Notethat these results do not automatically mean that allmicrosaccades in the human eyes condition were dueto head movements. The reason is that the thresholdfor detection depends on the overall variability in thesignal, which may be lower for head movement re-lated signals than for eye movement signals. The highfalse detection rates are important, because the head-mounted dummy eyes reflect trials without microsc-cades. Such trials are not uncommon considering thatmicrosaccade rates vary across participants betweenaround 0.2 Hz to 2.5 Hz (Engbert & Kliegl, 2003) andtypical trials last around 2 to 3 seconds. The data there-fore suggest that thresholds set on a trial by trial basisshould be avoided, and instead thresholds are better es-timated on the basis of the entire distribution of thresh-olds for each participant. I will return to this issue later.
To access the statistical significance of the differencesbetween conditions, a repeated measures ANOVA wasconducted, taking into account the different experi-mental factors. This analysis, however, showed severalsignificant interactions, which makes the main effects
difficult to interpret. Subsequent analyses were there-fore performed in the form of pairwise comparisons.These comparisons suggested that the effect of the mo-tion correction approached significance (given Bonfer-roni corrections) for the dummy eyes mounted on thehuman head for binocular and monocularly right eyemovements (t(11) = 2.57, p = 0.026, Hedges’s g = 0.88;and t(11) = 3.21, p = 0.008, Hedges’s g = 1.28). Theeffect of recording mode (dummy eye+dummy head,dummy eye+human head, human eye+human head)was significant for most comparisons (except in someof the monocular conditions). Significant differenceswere also found for the contrasts between binocularand monocular recordings (dummy eyes + dummyhead, uncorrected: F(1,11) = 8.31, p = 0.015, partial η2 =0.43; dummy eyes + dummy head, corrected: F(1,11) =8.63, p = 0.013, partial η2 = 0.44; dummy eyes + dummyhead, uncorrected: F(1,11) = 119.2, p < 0.001, partial η2
= 0.92; dummy eyes + dummy head, corrected: F(1,11)= 76.8, p < 0.001, partial η2 = 0.86; human eyes, un-corrected: F(1,11) = 131.5, p < 0.001, partial η2 = 0.92;human eyes, corrected: F(1,11) = 80.0, p < 0.001, partialη2 = 0.88). This indicates that incorrect detections aresignificantly higher when recording from only one eye,and that binocular recording and detection is effectivein reducing the number of false detections.
Figure 2b shows the distribution of the amplitudes ofdetected microsaccades across the different conditions.Most of these distributions peak at low amplitudes, ex-cept for binocular microsaccades from the dummy eyeson a human head and binocular detections from humaneyes. Part of the differences between the amplitudes ofdummy eyes and human eyes may be due to the proce-dure used to detect microsaccades in the dummy eyes.Because the dummy eyes were stationary, the calibra-tion procedure had to be performed on human eyes.After moving the head-band with the cameras from theparticipant to the dummy head or by changing the ori-entation of the cameras to focus on the dummy eyes onthe glasses, the cameras often had to be moved slightlyaway from the head due to the extra space taken bythe glasses onto which the dummy eyes were mounted.Because of this larger distance, the amplitude of thedummy eye movements may be underestimated. Themicrosaccade detection algorithm adjusts its thresholdsto the data, so detection rates are less likely to be lessinfluenced by the slightly larger distance of the cam-eras to the eyes. While the magnitude of amplitudesof dummy eye microsaccades may be less informative,the shape of the distribution suggests a difference be-tween dummy eye movements and human eye move-ments.
A method sometimes suggested to examine whetherdetected microsaccades are actual saccades, is to ex-amine the relationship between saccade amplitude andpeak velocity, known as the main sequence (Zuber etal., 1965), typically plotted on a log-log scale. Figure 2c
4

Journal of Eye Movement Research8(1):1, 1-17
Hermens, F. (2015)Dummy eye microsaccades
(b) Stimulus sequence
Time
1000-1500ms
1500-2000ms
1200ms
400ms
(a) Dummy eyes
RT=260.0
500ms
Figure 1. (a) Photo of the setup for blocks in which the recordings were taken from the dummy eyes, mounted on a glasshead. Dummy eyes were created using a pair of reading glasses, white sticky paper (serving as the white of the eyes) andblack insulation tape (serving as the pupils). (b) Stimulus sequence. Stimuli were presented in each block, but only elicitingeye movements in the blocks in which eye movements were recorded from the participants’ eyes. A central fixation symbolwas surrounded by four circles for 1000 to 1500ms, after which two lines of the fixation symbol were removed, turning it into aleftward or rightward pointing arrow for 1500 to 2000 ms. During this time, participants were instructed to maintain fixation tothe center of the display. A peripheral target appeared inside one of the place-holder circles after this delay, which remained onthe screen for 1200ms or until participants made an eye movement. Feedback was provided about the saccadic response timefor 400ms, followed by a blank screen for 500ms.
Table 1Slope, intercept, and proportion of variance explained (R2) of the best fitting regression lines of the logarithm of the saccadeamplitude and the logarithm of the peak velocity across the different conditions.
Condition Slope Intercept R2
Dummy eye + dummy head, without correction 0.89 4.81 0.88Dummy eye + dummy head, with correction 0.86 4.62 0.48
Dummy eye + human head, without correction 0.51 3.50 0.66Dummy eye + human head, with correction 0.57 3.77 0.58
Human eye + human head, without correction 0.68 4.31 0.83Human eye + human head, with correction 0.69 4.33 0.83
examines this relationship across the different condi-tions. Details about the best fitting regression lines forthese (log transformed) data are provided in Table 1.The data plots suggest that signals classified by the al-gorithm as (micro)saccades are likely to result in a lin-ear pattern linking saccade amplitude and peak veloc-ity, regardless of their source. One difference that maybe noticed are the intermediate values for the slopes forthe human eyes, so in order to use the main sequenceto determine whether detected signals are actual sac-cades, it may be necessary not just to examine the lin-ear relationship, but also to compare the slope with ear-
lier observations or to the slope for large amplitude sac-cades in the same participant.
As a further method to detect microsaccades againstnoise, constrained shuffling of the data to generate sur-rogate data has been proposed (Engbert & Mergen-thaler, 2006; Mergenthaler & Engbert, 2010). In par-ticular, the method shuffles the velocity samples suchthat the distribution of velocity values is maintainedand the autocorrelation function of the surrogate dataapproximates that of the original data (Engbert & Mer-genthaler, 2006). Figure 3 shows the results when thisprocedure is applied to the present dummy eye and
5

Journal of Eye Movement Research8(1):1, 1-17
Hermens, F. (2015)Dummy eye microsaccades
10−2
10−1
100
0
20
40
60
Amplitude (deg)
Dummy eyes + dummy head
% o
f o
bse
rva
tio
ns
10−2
10−1
100
0
10
20
30
40
Amplitude (deg)
Dummy eyes + human head
% o
f o
bse
rva
tio
ns
10−2
10−1
100
0
10
20
30
Amplitude (deg)
Human eyes + human head
% o
f o
bse
rva
tio
ns
Dummy eyes +
Dummy head
0
0.2
0.4
0.6
0.8
1
1.2
De
tect
ed
mic
rosa
cca
de
ra
te (
Hz)
Binocular
Human eyesDummy eyes +
Human head
0
0.5
1
1.5
2
2.5
3
De
tect
ed
mic
rosa
cca
de
ra
te (
Hz)
Monocular left
Dummy eyes +
Dummy head
Human eyesDummy eyes +
Human head
0
0.5
1
1.5
2
2.5
3
De
tect
ed
mic
rosa
cca
de
ra
te (
Hz)
Monocular right
Dummy eyes +
Dummy head
Human eyesDummy eyes +
Human head
a) Detection rates
Without motion corrction
With motion correction
Without motion correction
With motion correction
b) Amplitude distributions
Binocular
Monocular left
0.4 0.8 1.2
40
80120
Dummy eyes+head
Amplitude (deg)
Ve
loc
ity
(d
eg
/s) Without motion correction
With motion correction40
80120
Amplitude (deg)
Ve
loc
ity
(d
eg
/s)
Dummy eyes, human head
0.4 0.8 1.2
40
80
120Human eyes
Amplitude (deg)
Ve
loc
ity
(d
eg
/s)
0.4 0.8 1.2
c) Main sequence binocular detections
Monocular right. . . . .
Figure 2. (a) Rates of detected microsaccades across the different conditions for binocular and monocular (left eye and right)analysis, under conditions without and with motion correction. For detection, the algorithm by Engbert & Kliegl (2003); Engbert(2006) was used, with a 6 median-based SD threshold, and a duration threshold of at least 3 samples (6ms). (b) Saccade ampli-tude histograms, showing the percentage of observed microsaccades (vertical axis) as a function of the bin center (horizontalaxis, shown on a logarithmic scale). (c) Main sequence across the different binocular conditions, plotting the saccade’s peakvelocity as a function of saccade amplitude on a log-log scale.
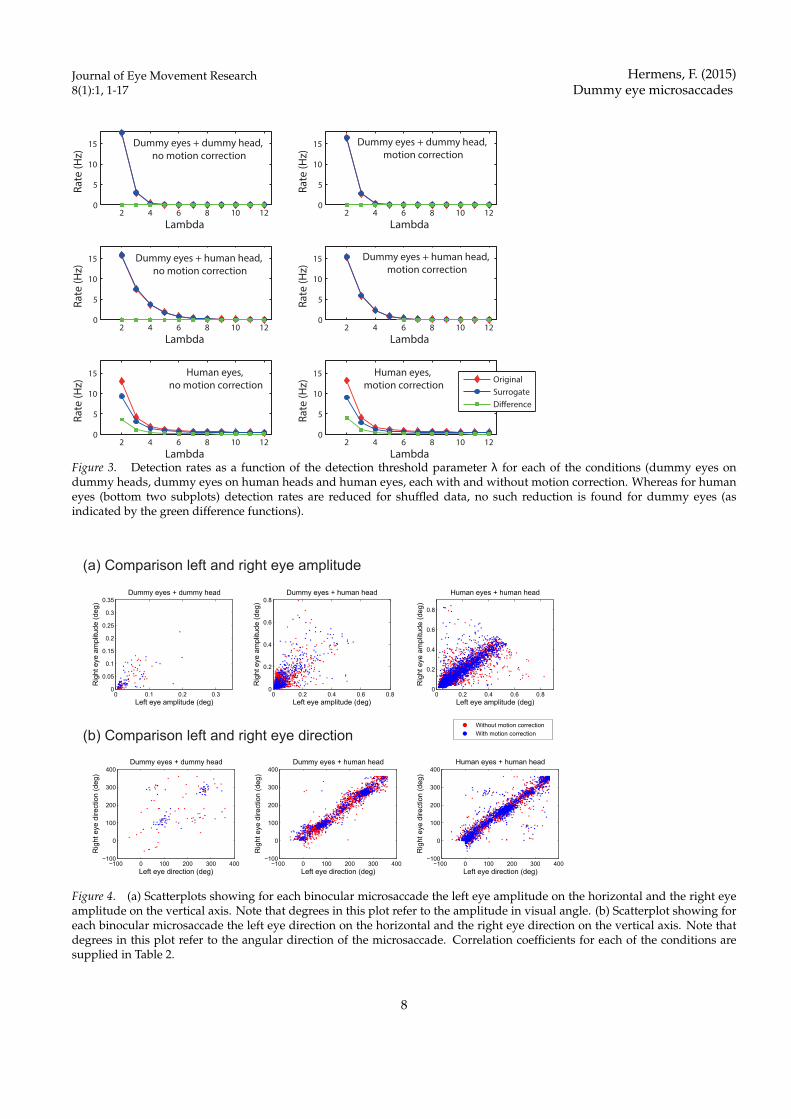
human data. For the human eyes, surrogate detectionrates are lower than for the original data, suggestingthat meaningful signals are being picked up from thedata that are no longer present when the order of thedata is disturbed. For dummy eyes (either on a dummyhead or on a human head), no such reduction in the ratefor surrogate data is found, suggesting that signals thatare detected are not specific to the order of the sam-ples, probably because they reflect random variationsrather than an actual signal. Interestingly, whereas theanalysis by Engbert and Mergenthaler (2006) revealeda maximum difference between the original and surro-gate detection rates (at λ = 5), the difference betweenrates for the present data monotonically decreases withλ. It is unclear at this point what causes this differencein the results. The results, however, do suggest thatsurrogate data can be used (on a distribution level) todistinguish between eye movement signals and noise.
An often made assumption is that microsaccades oc-cur simultaneously in both eyes. This assumption isused in the final step of the algorithm by Engbert andcolleagues (Engbert & Kliegl, 2003; Engbert & Mergen-thaler, 2006), requiring at least one sample overlap be-tween the eye movements in the two eyes. To improvedetection other overlaps may be considered, such assimilarities in amplitude and or saccade direction. Toexamine this overlap for microsaccades across the dif-ferent conditions, Figure 4 provides scatterplots of theamplitude (in degrees of visual angle) and direction(expressed as an angle between 0 and 360 degrees) ofthe two eyes, while Table 2 provides the correlation ofthe measures between the two eyes. For many of theconditions, the correlations between the two eyes arehigh (r ≥ 0.68), meaning that not only do the move-ments occur in the two eyes at the same time, they alsohave similar amplitudes and directions. The correla-
6

Journal of Eye Movement Research8(1):1, 1-17
Hermens, F. (2015)Dummy eye microsaccades
tion is somewhat lower for detections in the dummyeyes on the dummy head, but otherwise, the plots sug-gest that comparisons of movements between the twoeyes will not aid the distinction between actual andfalsely detected microsaccades. A likely reason is thatin all instances, the signals leading to the detected mi-crosaccades have a common source, which can eitherbe the brain signaling to both eyes that an eye move-ment has to be made, or the movement of the pupilswith respect to the cameras due to head movement.
As mentioned earlier, the high rate of detections forthe dummy eyes mounted on a human head is likely torelate to lower detection thresholds in these conditions,compared to the human eyes conditions. This pointis illustrated in Figure 5a, showing velocity traces forsix trials across the different conditions, together withthe threshold (dashed ellipses; note that the axes arescaled to best fit the velocities). These example tracesfrom one of the participants suggest that thresholds arelower for dummy eyes than for human eyes. To exam-ine this possible difference in thresholds further, Fig-ure 5b plots the average threshold across participantsfor each of the conditions. To determine whether thesethresholds differ across conditions, the thresholds forthe two eyes and the two directions (horizontal ver-sus vertical) were pooled into one mean for each con-dition and a repeated measures ANOVA was used totest the effects of the source of the recordings (dummyeyes + dummy head, dummy eyes + human head, hu-man eyes) and whether motion correction was used.A significant main effect of the source of the record-ings was found (F(1.38, 15.13) = 21.11, p<0.001, par-tial η2 = 0.66), without a main effect of the motion cor-rection (F(1,11) = 0.042, p = 0.96, partial η2
<0.01) andwithout an interaction between the two factors (F(2,22)= 0.23, p = 0.79, partial η2 = 0.021). Posthoc tests,involving pairwise comparisons between the differentrecording sources using a two by two repeated mea-sures ANOVA, testing the effects of recording sourceand motion correction, showed significant differencesin the thresholds across each of the conditions with-out an effect of motion correction and no interaction(dummy eyes + dummy head versus dummy eyes +human head: F(1,11) = 10.36, p = 0.008, partial η2 =0.49; dummy eyes + human head versus human eyes:F(1,11) = 16.23, p = 0.002, partial η2 = 0.60; dummy eyes+ dummy head versus human eyes: F(1,11) = 27.78,p<0.001, partial η2 = 0.72).
In the analyses so far, thresholds for microsaccadedetection were set on a trial by trial basis taking intoaccount the level of noise in the data for that trial. Thedata with the dummy eyes on the human head indi-cates that in the absence of microsccades, this methodmay result in thresholds that are too low to avoid in-correct detections of microsaccades due to head move-ments. An alternative method of setting thresholdswould be to take into account thresholds across all tri-
als, and to extract an estimate of the overall thresholdfor detection for that person. To evaluate this method,thresholds were set to the median of the human eyesconditions for each participant and then applied to thedummy eye conditions, resulting in the detection ratesshown in Figure 6. Binocular detections for the dummyeyes on a dummy head condition were already low pre-viously, and vanished completely when median thresh-olds were used. Binocular detections for dummy eyeson the human head (simulating head motion) are lowerwhen the median threshold method is used, but incor-rect detections still occur at a rate of about 0.1 to 0.2 Hz.Monocular detections are high for median thresholdsand are best avoided.
The recordings of the dummy eyes can also be usedto examine what amplitudes of saccades can be reli-ably detected in the presence of system noise and headmovements. Figures 7a and 7b show how this maybe done. The two plots show the recorded eye posi-tion over time (top) together with the horizontal andvertical velocity (bottom). Figure 7a shows a signalto which a 0.3 degrees amplitude saccade was addedin the form of a sigmoid function1 whose parameters(except for the amplitude) were fitted on response sac-cades of the corresponding participant (across all tri-als in the human eyes conditions). Figure 7b shows asimilar plot, but now for an added 1.0 degree saccade.The ellipses around the velocity trace indicate the de-tection threshold, and the black sections of the trace inthe 1.0 degree saccade plot (Figure 7b) indicate that the1.0 degree saccade is detected, but the 0.3 saccade isnot. To examine how the head movements influencethe detection of saccades of various amplitudes, sig-moid functions saccades were added to each trial ofthe dummy eyes + head movement condition for eachparticipant, and the number of detected microsaccadeswithin an interval around the inserted saccades wascounted. Figure 7c shows this number of detected mi-crosaccades as a function of the amplitude of the in-serted microsaccade, showing an increasing functionapproaching a level slightly above 1 (detection of sig-nals additional to the inserted saccade). Interestingly,the use of the head motion correction leads to slightlylower detection rates (t(39) = 5.54, p<0.001, Hedges’s g= 0.16; across the 40 samples shown in Figure 7c).
The large number of microsaccade detections in theabsence of eye movements due to head movements isworrisome, as is the lack of distinctive features betweenhead movement and eye movement detections amongthe features considered so far, such as the direction ofthe microsaccades in the two eyes. Using a medianthreshold across all trials helped to reduce the numberof false detections. Another possible method of reduc-
1 A sigmoid function was used to create a uniform shapefor the added saccade. Visual inspection suggested that thesigmoid functions provided an excellent fit of the profile ofthe saccades.
7
Journal of Eye Movement Research8(1):1, 1-17
Hermens, F. (2015)Dummy eye microsaccades
2 4 6 8 10 120
5
10
15
Lambda
Ra
te (
Hz)
2 4 6 8 10 120
5
10
15
Lambda
Ra
te (
Hz)
2 4 6 8 10 120
5
10
15
Lambda
Ra
te (
Hz)
2 4 6 8 10 120
5
10
15
Lambda
Ra
te (
Hz)
2 4 6 8 10 120
5
10
15
Lambda
Ra
te (
Hz)
2 4 6 8 10 120
5
10
15
Lambda
Ra
te (
Hz)
Original
Surrogate
Di!erence
Dummy eyes + dummy head,
no motion correction
Dummy eyes + dummy head,
motion correction
Dummy eyes + human head,
no motion correction
Dummy eyes + human head,
motion correction
Human eyes,
no motion correction
Human eyes,
motion correction
Figure 3. Detection rates as a function of the detection threshold parameter λ for each of the conditions (dummy eyes ondummy heads, dummy eyes on human heads and human eyes, each with and without motion correction. Whereas for humaneyes (bottom two subplots) detection rates are reduced for shuffled data, no such reduction is found for dummy eyes (asindicated by the green difference functions).
0 0.1 0.2 0.30
0.05
0.1
0.15
0.2
0.25
0.3
0.35
Left eye amplitude (deg)
Rig
ht eye a
mplit
ude (
deg)
Dummy eyes + dummy head
0 0.2 0.4 0.6 0.80
0.2
0.4
0.6
0.8
Left eye amplitude (deg)
Rig
ht eye a
mplit
ude (
deg)
Dummy eyes + human head
0 0.2 0.4 0.6 0.80
0.2
0.4
0.6
0.8
Left eye amplitude (deg)
Rig
ht eye a
mplit
ude (
deg)
Human eyes + human head
Without motion correction
With motion correction
(a) Comparison left and right eye amplitude
−100 0 100 200 300 400−100
0
100
200
300
400
Left eye direction (deg)
Rig
ht eye d
irection (
deg)
Dummy eyes + dummy head
−100 0 100 200 300 400−100
0
100
200
300
400
Left eye direction (deg)
Rig
ht eye d
irection (
deg)
Dummy eyes + human head
−100 0 100 200 300 400−100
0
100
200
300
400
Left eye direction (deg)
Rig
ht eye d
irection (
deg)
Human eyes + human head
(b) Comparison left and right eye direction
Figure 4. (a) Scatterplots showing for each binocular microsaccade the left eye amplitude on the horizontal and the right eyeamplitude on the vertical axis. Note that degrees in this plot refer to the amplitude in visual angle. (b) Scatterplot showing foreach binocular microsaccade the left eye direction on the horizontal and the right eye direction on the vertical axis. Note thatdegrees in this plot refer to the angular direction of the microsaccade. Correlation coefficients for each of the conditions aresupplied in Table 2.
8

Journal of Eye Movement Research8(1):1, 1-17
Hermens, F. (2015)Dummy eye microsaccades
Dum
my e
yes +
dum
my h
ead Left eye Left eyeRight eye Right eye
Without motion correction With motion correction
−2 0 2
−2
0
2
−2 0 2
−2
0
2
−2 0 2
−2
0
2
−2 0 2
−2
0
2
Ve
rt.
ve
l (d
eg
/s)
Horiz. vel (deg/s) Horiz. vel (deg/s)
Dum
my e
yes +
hum
an h
ead
−10 0 10−10
0
10
−10 0 10−10
0
10
−10 0 10−10
0
10
−10 0 10−10
0
10
Ve
rt.
ve
l (d
eg
/s)
Horiz. vel (deg/s) Horiz. vel (deg/s)
Hum
an e
yes +
hum
an h
ead
−20 0 20
−20
0
20
−20 0 20
−20
0
20
−20 0 20
−20
0
20
−20 0 20
−20
0
20
Ve
rt.
ve
l (d
eg
/s)
Horiz. vel (deg/s) Horiz. vel (deg/s)
0
5
10
15
20
25
30
Radiu
s (
deg/s
)
Left eye − horizontal
Left eye − vertical
Right eye − horizontal
Right eye − vertical
Dummy eyes+ dummy head
Without correction
(a) Examples of velocity traces and detection thresholds
Dummy eyes+ dummy headWith correction
Dummy eyes+ human head
Without correction
Dummy eyes+ human headWith correction
Human eyes+ human head
Without correctionHuman eyes
+ human headWith correction
(b) Detection thresholds
Figure 5. (a) Examples of velocity traces for the different conditions from one of the participants, showing the threshold fordetection (dashed ellipses) and the detected microsaccades (black sections of the traces). (b) Average horizontal and verticalthresholds for each of the conditions for each of the eyes.
9

Journal of Eye Movement Research8(1):1, 1-17
Hermens, F. (2015)Dummy eye microsaccades
Table 2Correlations of saccade amplitude and saccade direction between the two eyes for binocularly detected microsaccades.
Condition Correlation of amplitude Correlation of direction
Dummy eye + dummy head, without correction 0.82 0.40Dummy eye + dummy head, with correction 0.69 0.66
Dummy eye + human head, without correction 0.68 0.97Dummy eye + human head, with correction 0.78 0.97
Human eye + human head, without correction 0.77 0.96Human eye + human head, with correction 0.76 0.95
Dummy eyes +
dummy head
Dummy eyes +
real head
0
0.2
0.4
0.6
0.8
1
De
tect
ed
mic
rosa
cca
de
ra
te (
Hz)
Binocular
Without motion correction
With motion correction
0
0.5
1
1.5
2
2.5
3
3.5
De
tect
ed
mic
rosa
cca
de
ra
te (
Hz)
Monocular left
Dummy eyes +
dummy head
Dummy eyes +
real head
0
0.5
1
1.5
2
2.5
3
3.5
De
tect
ed
mic
rosa
cca
de
ra
te (
Hz)
Monocular right
Dummy eyes +
dummy head
Dummy eyes +
real head
Figure 6. Detection rates for signals from the dummy eyes conditions, with detection thresholds adopted from the human eyesconditions. The results suggest that when thresholds are based on the median thresholds across conditions, incorrect detectionson trials without microsaccades can be avoided to a large extent, as long as binocular microsaccades are considered.
0 50 100 150 20019.5
20
20.5
21
Time (ms)
Ho
r. P
os.
(de
g)
0 50 100 150 20010.5
11
11.5
Time (ms)
Ve
r. P
os.
(de
g)
−10 0 10 20−10
−5
0
5
10
Hor. Vel. (deg/s)
Ve
r. V
el. (
de
g/s
)
−20 0 20−20
−10
0
10
20
Hor. Vel. (deg/s)
Ve
r. V
el. (
de
g/s
)
Left Eye
Right eye
0 50 100 150 20019
19.5
20
20.5
Time (ms)
Ho
r. P
os.
(de
g)
0 50 100 150 20014.6
14.65
14.7
14.75
14.8
Time (ms)
Ve
r. P
os.
(de
g)
−50 0 50−10
0
10
20
Hor. Vel. (deg/s)
Ve
r. V
el. (
de
g/s
)
−50 0 50−10
0
10
20
Hor. Vel. (deg/s)
Ve
r. V
el. (
de
g/s
)
Left Eye
Right eye
Saccade
Thresh.
(a) Dummy eyes + human head + 0.3 deg saccade (b) Dummy eyes + human head + 1.0 deg saccade
(c) Detection rate by saccade amplitude
0 0.1 0.2 0.3 0.4 0.5 0.6 0.7 0.8 0.9 10
0.2
0.4
0.6
0.8
1
Amplitude added saccade (deg)
De
tectio
n r
ate
Without motion correction
With motion correction
Figure 7. (a) Horizontal and vertical position trace for an inserted 0.3 degrees horizontal saccade, together with velocity plotsfor the left and right eye. (b) Horizontal and vertical position trace for an inserted 1.0 degrees horizontal saccade, together withvelocity plots for the left and right eye. (c) The effect of inserting saccades of different amplitudes to the dummy eyes + humanhead signal, expressed as the rate of microsaccade detection for the interval around the inserted saccade.
10

Journal of Eye Movement Research8(1):1, 1-17
Hermens, F. (2015)Dummy eye microsaccades
ing the number of incorrect detections may be to relyon both the corneal reflection signal and the pupil cen-ter estimate (as used, for example, by Kimmel et al.,2012). Experiment 2 will examine whether microsac-cade detections in the absence of eye movements canbe avoided by including the corneal reflection signal.
Experiment 2: Cornealreflection
Experiment 1 showed large numbers of microsac-cade detections in conditions in which, in fact, noeye movements were present (recordings from dummyeyes, mounted on a human head). The experimentrelied on the pupil only mode of the Eyelink II sys-tem, as have many past studies (all studies applyingan Eyelink system at 500Hz in Table 1 of Martinez-Conde et al., 2009). A possible reason is that a stablecorneal reflection signal is sometimes difficult to obtainfor all gaze directions in the calibration procedure, andthat the pupil only mode allows for a higher samplingrate (500Hz rather than 250Hz) in the system. Withnewer systems, which often use the corneal reflectionsetting by default and allow for high sampling rateseven when using the corneal reflection (e.g., 1000Hz inthe Eyelink 1000 system), there should be fewer rea-sons to rely on pupil only measurements. In Experi-ment 2, it is investigated whether the addition of thecorneal reflection aids to reduce signals that may leadto incorrect microsaccade detections. The experimentis carried out in an Eyelink II system, meaning that ifan improvement is found, the addition of the cornealreflection signal trumps the reduction of the samplingfrequency.
Methods
To obtain a corneal reflection in the images, twometal clips were attached to the glasses, as shown inFigure 8a. After trying several size clips, one config-uration was found to yield a stable corneal reflectionin the system, as shown in the image in Figure 8b. Inthis image, the large cross-hair superimposed on oneof the blue sections indicates the estimated center ofthe pupil. The smaller yellow section with a superim-posed cross-hair indicates the detected corneal reflec-tion. Three conditions were tested, all applying themotion correction setting of the system. In the firstcondition, the dummy eyes were placed on a dummyhead (measuring the system noise). In the second con-dition, the dummy eyes were mounted on a partici-pant’s head (measuring the combined influence of sys-tem noise and head movements, despite the use of achin rest). In the third and final condition, recordingswere made from the participant’s eyes. One participant(the author) served as the source of the calibrations andthe actual eye movements. Six blocks of each 60 trialswere conducted for each of the three conditions (result-
ing in a total of 360 trials per condition). Calibrationwas repeated before each block to mimic the influenceof recalibrating the system. In the dummy eyes on theparticipants’ head and the actual eyes conditions, theparticipant performed the cueing task from Experiment1 (but now with the glasses on the tip of the nose in thedummy eye condition). As in Experiment 1, an EyelinkII system was used for the recordings. Because of theuse of the corneal reflection mode, the sampling ratewas reduced to 250Hz (from 500Hz for Experiment 1).For the two conditions with the participant’s head, achin rest was used to reduce head movements, placedat a distance of 57cm from a 19inch flat screen used forstimulus presentation. As in Experiment 1, microsac-cade detections were based on a 6 median-based SDthreshold, a minimum 6ms duration, and a one-sampleminimum overlap for binocular microsaccades. Forstatistical comparisons, the repeated calibrations weretreated as the participants in the analysis.
Results
Figure 8c shows the rate of microsaccade detectionacross the different conditions (using the same algo-rithm as in Experiment 1, based on the work by Eng-bert & Kliegl, 2003; Engbert & Mergenthaler, 2006) forthe interval until presentation of the target, and trialby trial estimation of the detection thresholds. The leftthree bars in this plot show detections on the basis ofsignals from both (dummy) eyes, for which a temporaloverlap between the two eyes was required for detec-tion. Detection rates in the two dummy eyes conditionswere significantly lower than for the participant’s eyes(dummy head: t(5) = 6.21, p = 0.0016, Hedges’ g = 3.32;participant’s head: t(5) = 6.27, p = 0.0015, Hedges’ g= 3.01). Detection rates between the two dummy eyesconditions did not differ significantly (t(5) = 2.20, p =0.079, Hedges’ g = 1.30). The results also show that themicrosaccade detecion rate in human eyes was around1Hz, in agreement with earlier observations (e.g., En-gbert & Kliegl, 2003). In the two dummy eye condi-tions, this rate was substantially reduced. Interestingly,the effect of the corneal reflection on incorrect detec-tions was restricted to binocular detection. When de-tection was based on measurements from one eye only(‘monocular left’ or ‘monocular right’ in Figure 8c),large numbers of microsaccades were detected acrossall three conditions.
Experiment 3: Microsaccadesignature
Experiment 1 showed that large numbers of mi-crosaccades are detected in the presence of head move-ments but in the absence of eye movements. Experi-ments 1 and 2 also showed that the incorrect detectionrates can be brought down by estimating the detectionthresholds across many trials and when the corneal re-flection signal is used. Past studies, however, have
11

Journal of Eye Movement Research8(1):1, 1-17
Hermens, F. (2015)Dummy eye microsaccades
a) Glasses & Clips b) Pupil and CR detection
c) Detection rate
Binocular0
0.5
1
1.5
2
2.5
3
3.5
4
Dummy eyes, dummy head
Dummy eyes, human head
Human eyes
Monocular Left Monocular Right
Rate
(H
z)
Figure 8. (a) Photograph showing the clips used to generate a corneal reflection in the recorded images. (b) Photograph ofthe system’s screen, showing pupil detection (large cross hair) and corneal reflection (smaller cross hair). (c) Microsaccadedetection rates across the three conditions (dummy eyes on a dummy head, dummy eyes on a human head, and human eyes)and for binocular, monocular-left eye and monocular-right eye detection. Error bars show the standard error of the mean acrossrepeated calibrations.
often relied on the pupil only mode of the Eyelink IIsystem, and the question arises to which extent incor-rect detections due to head movements may have in-fluenced the results. Experiment 3 is aimed to examinethis issue and focuses in particular on the modulationof microsaccade rate by stimulus onsets (the ‘microsac-cade signature’). Head movements may influence themicrosaccade signature, because studies have demon-strated effects of covert shifts of attention on other mo-tor (sub)systems, such as the neck muscles (Corneil,Munoz, Chapman, Admans, & Cushing, 2007) and thearm (Cohen & Rosenbaum, 2007). In contrast to Exper-
iment 1 but similar to Experiment 2, the dummy eyeswere placed on the tip of the nose, to allow for stimulusevents to influence the dummy eye measurements.
Method
Participants. Thirteen new participants and the au-thor took part in Experiment 3. Data of two partici-pants had to be excluded from the data set because ofa failure to record the eye position in the right eye insome of the blocks, leaving data of twelve participantsfor the data analysis. Participants other than the author
12

Journal of Eye Movement Research8(1):1, 1-17
Hermens, F. (2015)Dummy eye microsaccades
were students from the University of Leuven, takingpart in return for course credit.
Apparatus, stimuli, design, procedure and dataanalysis
An identical setup was used as in Experiment 1, witha few small modifications. Instead of six blocks, par-ticipants conducted four blocks of each sixty trials. Intwo blocks, participants placed the glasses on the tip oftheir nose, allowing for the tracking of the dummy eyeswhile participants performed the cueing task normally.In these blocks, the tracker recorded from the dummyeyes. In the remaining two blocks, participants did notwear the glasses and eye movements were recordedfrom their eyes. Motion correction was varied acrossparticipants, so that the two repeated blocks from eachparticipant together provided data of 120 trials to al-low for a better estimate of the microsaccade signature.To ensure that participants were performing the task inall blocks (although not believed to be critical for thepresent purpose of the study), the experimenter, on se-lected trials, briefly inspected the gaze behavior of par-ticipants to determine whether they were making aneye movement in the correct direction after the onsetof the target. As in Experiments 1 and 2, microsaccadedetections were based on a 6 median-based SD thresh-old, a minimum of 6ms duration, and a one-sampleminimum overlap for binocular microsaccades. For theplot of microsaccade frequency as a function of the timebefore or after cue onset, a moving average was used,computing the frequency within a 100ms window insteps of 1ms across the -1000ms (before cue onset) and1500ms (after cue onset) interval.
Results
Figure 9a plots the overall detection rates in Experi-ment 3 until presentation of the target. A mixed factorANOVA, testing the effects of the source of the record-ings (dummy eyes or human eyes, within-subjects), theeyes analyzed (binocular, monocular left, or monocularright, within-subjects) and motion correction (on ver-sus off, between-subjects) revealed a significant interac-tion between the source and the eyes analyzed (F(2,20)= 3.35, p = 0.006, partial η2 = 0.40). Posthoc analyseswere therefore performed examining the effects of thesource of the recording and motion correction for eachof the eyes analyzed. For binocular saccades, a sig-nificant difference between detection rates from headmovements and eye movements was found (F(1,10) =28.24, p<0.001, partial η2 = 0.74), without an effect ofthe motion correction (F(1,10) = 0.60, p = 0.46, partialη2 = 0.056) and no interaction between the two fac-tors (F(1,10) = 0.57, p = 0.47, partial η2 = 0.054). Formonocular left (p-values all above 0.16) and right mi-crosaccades (p-values all above 0.17) none of the ef-fects were significant. While binocular rates due to
head movements appear to be lower than in Experi-ment 1, t-tests comparing the rates across the two ex-periments do not reveal significant differences (t(16) =0.65, p = 0.52, Hedges’s g = 0.31 without motion cor-rection, t(16) = 0.24, p = 0.82, Hedges’s g = 0.11 withmotion correction), suggesting that visual input did notmodulate the detection rate. Detections from humaneyes were higher in Experiment 3 than in Experiment1, without motion correction correction (t(16) = 2.81,p=0.013, Hedges’s g = 1.34), but not with motion cor-rection (t(16) = 1.67, p = 0.12, Hedges’s g = 0.79).
Figure 9b shows the microsaccade rate across thestimulus interval for the different conditions. A clearmodulation of the microsaccade rate around the on-set of the cue was found for the human eye measure-ments, but not for the dummy eyes on a human head,meaning that the stimulus dependent modulation ofmicrosaccade rates (the ‘microsaccade signature’) is aproperty of eye movements, not of head movements.The difference between the eye movement and headmovement conditions is confirmed by comparing theestimated minimum and maximum rates across the in-terval. For both the motion corrected (t(5) = 2.62, p =0.047; Hedges’s g = 1.67) and uncorrected (t(5) = 3.029,p = 0.0.29; Hedges’s g = 1.30) groups, a significant dif-ference was found in the size of the rate modulationbetween the recordings from the dummy eyes on thehuman head and the human eyes.
Discussion
In three experiments, the influence of system noiseand participants’ head movements on the detection ofmicrosaccades was examined for arguably the mostpopular eye tracking system in recent microsaccade re-search (the Eyelink II system, used in 25 of the 37 stud-ies in Table 1 of Martinez-Conde et al., 2009). Noisein this system has two likely sources: Fluctuations ofpixels in the image that are assigned to the pupil area(falling below or above detection threshold, due tosmall variations in illumination), and shifts of the en-tire image due to movement of the cameras or the headband (due to small head movements made by partic-ipants despite the use of a chin rest). To measure theinfluence of these noise sources, dummy eyes were cre-ated from circular patches of insulation tape on a whitebackground mounted on a pair of glasses, worn eitherby a dummy head or a human participant. Recordingsfrom these dummy eyes and from human eyes wereanalyzed for microsaccades using one of the most pop-ular algorithms, namely that by Engbert and colleagues(Engbert & Kliegl, 2003; Engbert & Mergenthaler, 2006).Relatively few microsaccades were detected for thedummy eyes on a dummy head, suggesting that thesystem’s internal noise (due to fluctuations in the pix-els assigned to the pupil area) had little influence on thedetection of microsaccades. In contrast, when relyingon the pupil only mode, frequent microsaccade detec-
13

Journal of Eye Movement Research8(1):1, 1-17
Hermens, F. (2015)Dummy eye microsaccades
0
0.5
1
1.5
Ra
te (
Hz)
0
1
2
3
4
Ra
te (
Hz)
0
1
2
3
4
Ra
te (
Hz)
Without motion correction
With motion correction
Dummy eyes+ human head
Human eyes+ human head
Dummy eyes+ human head
Human eyes+ human head
Dummy eyes+ human head
Human eyes+ human head
(a) Detection rates
Human eyes + human head
Binocular Left eye Right eye
(b) Binocular microsaccade signatures
Time to / from stimulus onset (ms)
Rate
(H
z)
With motion correction
−1000 −500 0 500 1000 15000
0.2
0.4
0.6
0.8
1
1.2
1.4
1.6
Time to / from stimulus onset (ms)
Rate
(H
z)
Without motion correction
−1000 −500 0 500 1000 15000
0.5
1
1.5
2
2.5
3
Figure 9. (a) Overall detection rates in Experiment 3. (b) Microsaccade rates as a function of the time before or after cue onset(the ‘microsaccade signature’), showing a clear modulation for human eyes, but not for dummy eyes. In both plots error barsshow the standard error of the mean across participants. For the purpose of illustration a subsample of the errorbars are shownfor the microsaccade signatures.
tions were observed for the dummy eyes mounted ona human head. Further analysis demonstrated that de-tections for the dummy eyes were often of low ampli-tude and had similar amplitudes and directions in botheyes. They also displayed an approximately linear re-lationship between saccade amplitude and peak veloc-ity, known as the main sequence, normally found formicrosaccades and saccades (Zuber et al., 1965). Theincorrect detection rate could be reduced by estimat-ing thresholds across all trials (Experiment 1; assum-ing that participants do make microsaccades in a sig-nificant proportion of trials) and by using the cornealreflection signal (Experiment 2). Detection, however,should be based on binocular recordings, and is there-fore restricted to video-based systems that can recordfrom both eyes simultaneously (although good detec-tion in monkeys was reported for monocular record-ings; Kimmel et al., 2012). Experiment 3 showed thatpast results, and in particular the modulation of themicrosaccade rate after stimulus onsets, were not sys-tematically affected by the large number of incorrect
recordings due to head movements. In three experi-ments, the influence of system noise and participants’head movements on the detection of microsaccadeswas examined for arguably the most popular eye track-ing system in recent microsaccade research (the Eye-link II system, used in 25 of the 37 studies in Table 1of Martinez-Conde et al., 2009). Noise in this systemhas two likely sources: Fluctuations of pixels in the im-age that are assigned to the pupil area (falling belowor above detection threshold, due to small variationsin illumination), and shifts of the entire image due tomovement of the cameras or the head band (due tosmall head movements made by participants despitethe use of a chin rest). To measure the influence ofthese noise sources, dummy eyes were created fromcircular patches of insulation tape on a white back-ground mounted on a pair of glasses, worn either bya dummy head or a human participant. Recordingsfrom these dummy eyes and from human eyes wereanalyzed for microsaccades using one of the most pop-ular algorithms, namely that by Engbert and colleagues
14

Journal of Eye Movement Research8(1):1, 1-17
Hermens, F. (2015)Dummy eye microsaccades
(Engbert & Kliegl, 2003; Engbert & Mergenthaler, 2006).Relatively few microsaccades were detected for thedummy eyes on a dummy head, suggesting that thesystem’s internal noise (due to fluctuations in the pix-els assigned to the pupil area) had little influence on thedetection of microsaccades. In contrast, when relyingon the pupil only mode, frequent microsaccade detec-tions were observed for the dummy eyes mounted ona human head. Further analysis demonstrated that de-tections for the dummy eyes were often of low ampli-tude and had similar amplitudes and directions in botheyes. They also displayed an approximately linear re-lationship between saccade amplitude and peak veloc-ity, known as the main sequence, normally found formicrosaccades and saccades (Zuber et al., 1965). Theincorrect detection rate could be reduced by estimat-ing thresholds across all trials (Experiment 1; assum-ing that participants do make microsaccades in a sig-nificant proportion of trials) and by using the cornealreflection signal (Experiment 2). Detection, however,should be based on binocular recordings, and is there-fore restricted to video-based systems that can recordfrom both eyes simultaneously (although good detec-tion in monkeys was reported for monocular record-ings; Kimmel et al., 2012). Experiment 3 showed thatpast results, and in particular the modulation of themicrosaccade rate after stimulus onsets, were not sys-tematically affected by the large number of incorrectrecordings due to head movements.
In the present work, only one algorithm was con-sidered (Engbert & Kliegl, 2003; Engbert & Mergen-thaler, 2006), which raises the question whether otheralgorithms would fare better in deciding that no mi-crosaccades were present when recording in pupil onlymode. This would allow for the re-analysis of pastdata. One possible method was already introduced inwhich thresholds are estimated across trials, but thenpooled into an estimate for each participant, thereby re-ducing incorrect detections in trials without microsac-cades. Alternatively, thresholds could be set on thebasis of earlier findings or on the basis of theoreticalconsiderations. Studies that appear to have used suchfixed threshold methods are those by Martinez-Condeand colleagues (2000, 2002), using a combined velocityand change of direction of movement criterion, Hafedand Clark (2002), using a velocity criterion based onthe horizontal component of the position trace and us-ing the main sequence, by Zanker, Doyle and Walker(2003), using an acceleration criterion on the smoothedsignal, and by Møller and colleagues (2002; 2006), us-ing a combined velocity and acceleration criterion, anda requirement for the signal to show an overshoot. Acomparison between such a fixed threshold algorithmand the adaptive threshold algorithm by Engbert andcolleagues (Engbert & Kliegl, 2003; Engbert & Mergen-thaler, 2006) suggests similar performance across thetwo algorithms when applied to human data. Alter-natively, detection could rely on visual detection by ex-
pert human observers (Steinman, 1965; Steinman, Cu-nitz, Timberlake, & Herman, 1967; Otero-Millan et al.,2014). This method, however, is labor intensive, par-ticularly if multiple raters are used to avoid subjectivebiases in detection. A new automatic method was re-cently introduced that relies on a clustering algorithmand principal component decomposition to establishthe number of clusters, but this method relies on thepresence of microsaccades, and should therefore relyon sufficiently long sampling intervals to ensure thatmicrosaccades occur (Otero-Millan et al., 2014).
The present work focused on head stabilization bymeans of a chin rest, which appears to be the preferredmethod in human participants. Future research shoulddemonstrate whether alternative methods of head sta-bilization, such as a bite-bar, would reduce the influ-ence of head movements on microsaccade detections.Another domain for future research involves the re-liance on a human participant for calibration of thedummy eyes. While the fixed dummy eyes ensuredthat no motion was present, shifting the eye trackerfrom the human head to the dummy head, or adjustingthe cameras to focus on the dummy eyes after calibra-tion may have influenced the measurements. The cam-eras were often placed further away from the dummyeyes than the human eyes used for calibration, andtherefore the amplitude of the measured eye gaze shiftsare likely to be affected. It is unclear to which extentthis influence is linear in nature, given the non-linearproprietary algorithm used by the studied system (Eye-link II, SR Research). Using dummy eyes that can rotateand perform the calibration procedure would improvethe situation. The possible difference in the size of thepupil of the human eyes and the dummy eyes will bedifficult to compensate for, given the fluctuations inthe pupil diameter in human observers with changesin ambient luminance levels. Similar factors may alsoexplain why, for the present data, there were often dif-ferences between the two eyes in monocular detectionrates. The cameras may have been at slightly differentangles with respect to the dummy eyes, light sourcesin the room may have influenced the two dummy eyesdifferently (and more strongly than human eyes), anddifferences in the focus of the two cameras may be am-plified in dummy eyes compared to human eyes. Over-all, the data strongly suggest that accurate detectionshould rely on binocular recordings and a temporaloverlap of detection in both eyes.
With respect to the data collected to date, the presentresults are reassuring. While a broad range of stud-ies have used a combination of the Eyelink II sys-tem, pupil only detection, and the algorithm by Eng-bert and colleagues (Engbert & Kliegl, 2003; Engbert &Mergenthaler, 2006), the present Experiment 3 demon-strates that the modulation of microsaccade frequencyafter stimulus onset can only be found when record-ing from human eyes. However, it will need to bedemonstrated that this result extends to other recent
15

Journal of Eye Movement Research8(1):1, 1-17
Hermens, F. (2015)Dummy eye microsaccades
findings, such as those involving the direction of mi-crosaccades in relation to covert attention (Engbert &Kliegl, 2003; Horowitz, Fine, Fencsik, Yurgenson, &Wolfe, 2007; Horowitz, Fencsik, Fine, Yurgenson, &Wolfe, 2007; Laubrock, Engbert, Rolfs, & Kliegl, 2007;Laubrock, Kliegl, Rolfs, & Engbert, 2010; Pastukhov &Braun, 2010; Rolfs, Engbert, & Kliegl, 2004; Tse, Shein-berg, & Logothetis, 2002, 2004).
Conclusion
The present work presents and evaluates a dummyeye method to examine the influence of system noiseand head movements on the detection of microsac-cades. Application of this method for possibly the mostoften used method (the Eyelink II system in combi-nation with the algorithm by Engbert and colleagues,2003, 2006) in recent microsaccade work, suggests thatalthough detections due to head movements were fre-quent, they did not influence the often reported mod-ulation of microsaccade frequency following stimulusonset. Moreover, detections were strongly suppressedwhen the corneal reflection was used or when thresh-olds were estimated on the basis of many trials, as longas binocular detection was used. Future work shouldexamine the use of other detection algorithms, othermethods of head stabilization and rely more on com-bined pupil detection and corneal reflection measure-ments.
References
Cohen, R. G., & Rosenbaum, D. A. (2007). Directional biasof limb tremor prior to voluntary movement. PsychologicalScience, 18(1), 8–12.
Collewijn, H., & Kowler, E. (2008). The significance of mi-crosaccades for vision and oculomotor control. Journal ofVision, 8(14):20, 1–21.
Corneil, B. D., Munoz, D. P., Chapman, B. B., Admans, T., &Cushing, S. L. (2007). Neuromuscular consequences ofreflexive covert orienting. Nature Neuroscience, 11(1), 13–15.
Engbert, R. (2006). Microsaccades: A microcosm for researchon oculomotor control, attention, and visual perception.Progress in Brain Research, 154, 177–192.
Engbert, R., & Kliegl, R. (2003). Microsaccades uncover theorientation of covert attention. Vision Research, 43(9), 1035–1045.
Engbert, R., & Mergenthaler, K. (2006). Microsaccades aretriggered by low retinal image slip. Proceedings of the Na-tional Academy of Sciences, 103(18), 7192–7197.
Hafed, Z. M., & Clark, J. J. (2002). Microsaccades as an overtmeasure of covert attention shifts. Vision Research, 42(22),2533–2545.
Hentschke, H., & Stuttgen, M. C. (2011). Computation ofmeasures of effect size for neuroscience data sets. EuropeanJournal of Neuroscience, 34(12), 1887–1894.
Hermens, F., & Walker, R. (2010). What determines the direc-tion of microsaccades? Journal of Eye Movement Research,3(4):1, 1–20.
Horowitz, T. S., Fencsik, D. E., Fine, E. M., Yurgenson, S., &Wolfe, J. M. (2007). Microsaccades and attention: Doesa weak correlation make an index? reply to laubrock, en-gbert, rolfs, and kliegl (2007). Psychological Science, 18(4),367–368.
Horowitz, T. S., Fine, E. M., Fencsik, D. E., Yurgenson, S., &Wolfe, J. M. (2007). Fixational eye movements are not anindex of covert attention. Psychological Science, 18(4), 356–363.
Kimmel, D. L., Mammo, D., & Newsome, W. T. (2012). Track-ing the eye non-invasively: simultaneous comparison ofthe scleral search coil and optical tracking techniques inthe macaque monkey. Frontiers in Behavioral Neuroscience,6:49, 1–17.
Laubrock, J., Engbert, R., & Kliegl, R. (2005). Microsaccadedynamics during covert attention. Vision Research, 45(6),721–730.
Laubrock, J., Engbert, R., Rolfs, M., & Kliegl, R. (2007). Mi-crosaccades are an index of covert attention: commentaryon Horowitz, Fine, Fencsik, Yurgenson, and Wolfe (2007).Psychological Science, 18(4), 364–366.
Laubrock, J., Kliegl, R., Rolfs, M., & Engbert, R. (2010). Whendo microsaccades follow spatial attention? Attention Per-ception & Psychophysics, 72(3), 683–694.
Martinez-Conde, S., Macknik, S. L., & Hubel, D. H. (2000).Microsaccadic eye movements and firing of single cellsin the striate cortex of macaque monkeys. Nature Neuro-science, 3(3), 251–258.
Martinez-Conde, S., Macknik, S. L., & Hubel, D. H. (2002).The function of bursts of spikes during visual fixation inthe awake primate lateral geniculate nucleus and primaryvisual cortex. Proceedings of the National Academy of Sci-ences, 99(21), 13920–13925.
Martinez-Conde, S., Macknik, S. L., Troncoso, X. G., & Hubel,D. H. (2009). Microsaccades: A neurophysiological analy-sis. Trends in Neuroscience, 32(9), 463–475.
Mergenthaler, K., & Engbert, R. (2010). Microsaccades aredifferent from saccades in scene perception. ExperimentalBrain Research, 203(4), 753–757.
Møller, F., Laursen, M., Tygesen, J., & Sjølie, A. (2002). Binoc-ular quantification and characterization of microsaccades.Graefe’s archive for clinical and experimental ophthalmology,240(9), 765–770.
Møller, F., Laursen, M. L., & Sjølie, A. K. (2006). The contri-bution of microsaccades and drifts in the maintenance ofbinocular steady fixation. Graefe’s Archive for Clinical andExperimental Ophthalmology, 244(4), 465–471.
Morimoto, C. H., & Mimica, M. R. (2005). Eye gaze track-ing techniques for interactive applications. Computer Vi-sion and Image Understanding, 98(1), 4–24.
Otero-Millan, J., Castro, J. L. A., Macknik, S. L., & Martinez-Conde, S. (2014). Unsupervised clustering method to de-tect microsaccades. Journal of Vision, 14(2):18, 1–17.
Pastukhov, A., & Braun, J. (2010, Jun). Rare but precious: Mi-crosaccades are highly informative about attentional allo-cation. Vision Research, 50(12), 1173–1184.
Rolfs, M. (2009). Microsaccades: Small steps on a long way.Vision Research, 49(20), 2415–2441.
Rolfs, M., Engbert, R., & Kliegl, R. (2004). Microsaccadeorientation supports attentional enhancement opposite aperipheral cue: commentary on tse, sheinberg, and logo-thetis (2003). Psychological Science, 15(10), 705–707.
Rolfs, M., Kliegl, R., & Engbert, R. (2008). Toward a model of
16

Journal of Eye Movement Research8(1):1, 1-17
Hermens, F. (2015)Dummy eye microsaccades
microsaccade generation: The case of microsaccadic inhi-bition. Journal of Vision, 8(11):5, 1–23.
Steinman, R. M. (1965). Effect of target size, luminance, andcolor on monocular fixation. Journal of the Optical Society ofAmerica, 55(9), 1158–1164.
Steinman, R. M., Cunitz, R. J., Timberlake, G. T., & Herman,M. (1967). Voluntary control of microsaccades duringmaintained monocular fixation. Science, 155(3769), 1577–1579.
Tse, P. U., Sheinberg, D. L., & Logothetis, N. K. (2002). Fix-ational eye movements are not affected by abrupt onsetsthat capture attention. Vision Research, 42(13), 1663–1669.
Tse, P. U., Sheinberg, D. S., & Logothetis, N. K. (2004). Thedistribution of microsaccade directions need not reveal thelocation of attention: Reply to rolfs, engbert, and kliegl.Psychological Science, 15(10), 708–710.
Zanker, J. M., Doyle, M., & Walker, R. (2003). Gaze stabilityof observers watching op art pictures. Perception, 32(9),1037–1050.
Zuber, B. L., Stark, L., & Cook, G. (1965). Microsaccadesand the velocity-amplitude relationship for saccadic eyemovements. Science, 150(3702), 1459–1460.
17