Duke_Energy_2002_Stat_Supp
50
Contents P/1 CONTENTS 2 CONSOLIDATED DATA 2 Financial Highlights 3 Earnings Before Interest and Taxes by Business Segment 4 Consolidating Income Statement 5 Consolidated Income Statement 6 Consolidating Balance Sheet 8 Consolidated Balance Sheet 10 Consolidated Statement of Cash Flows 11 Capital and Investment Expenditures 12 Long-Term Debt 15 Preferred Securities 16 Capitalization 17 FRANCHISED ELECTRIC 18 Earnings Before Interest and Taxes 19 Balance Sheet 21 Operating Statistics 23 NATURAL GAS TRANSMISSION 24 Earnings Before Interest and Taxes 25 Balance Sheet 27 Operating Statistics 28 FIELD SERVICES 29 Earnings Before Interest and Taxes 30 Balance Sheet 32 Operating Statistics 33 DUKE ENERGY NORTH AMERICA 34 Earnings Before Interest and Taxes 35 Balance Sheet 37 INTERNATIONAL ENERGY 38 Earnings Before Interest and Taxes 39 Balance Sheet 41 OTHER ENERGY SERVICES 42 Earnings Before Interest and Taxes 43 Balance Sheet 45 DUKE VENTURES 46 Earnings Before Interest and Taxes 47 Balance Sheet
-
Upload
finance21 -
Category
Economy & Finance
-
view
94 -
download
0
Transcript of Duke_Energy_2002_Stat_Supp
Contents P/1
CONTENTS
2 CONSOLIDATED DATA
2 Financial Highlights
3 Earnings Before Interest and Taxes byBusiness Segment
4 Consolidating Income Statement
5 Consolidated Income Statement
6 Consolidating Balance Sheet
8 Consolidated Balance Sheet
10 Consolidated Statement of Cash Flows
11 Capital and Investment Expenditures
12 Long-Term Debt
15 Preferred Securities
16 Capitalization
17 FRANCHISED ELECTRIC
18 Earnings Before Interest and Taxes
19 Balance Sheet
21 Operating Statistics
23 NATURAL GAS TRANSMISSION
24 Earnings Before Interest and Taxes
25 Balance Sheet
27 Operating Statistics
28 FIELD SERVICES
29 Earnings Before Interest and Taxes
30 Balance Sheet
32 Operating Statistics
33 DUKE ENERGY NORTH AMERICA
34 Earnings Before Interest and Taxes
35 Balance Sheet
37 INTERNATIONAL ENERGY
38 Earnings Before Interest and Taxes
39 Balance Sheet
41 OTHER ENERGY SERVICES
42 Earnings Before Interest and Taxes
43 Balance Sheet
45 DUKE VENTURES
46 Earnings Before Interest and Taxes
47 Balance Sheet

. . Years ended December 31 . .
In millions, except per share amounts 2002 2001 2000 1999 1998 1997
COMMON STOCK DATA a,b
Earnings per share (before extraordinary items and
cumulative effect of change in accounting principle)
Basic . . . . . . . . . . . . . . . . . . . . . . . . . . . . . . . . . . . . . . . . . $ 1.22 $ 2.58 $ 2.39 $ 1.13 $ 1.72 $ 1.25
Dilutive . . . . . . . . . . . . . . . . . . . . . . . . . . . . . . . . . . . . . . . . $ 1.22 $ 2.56 $ 2.38 $ 1.13 $ 1.71 $ 1.25
Earnings per share
Basic . . . . . . . . . . . . . . . . . . . . . . . . . . . . . . . . . . . . . . . . . $ 1.22 $ 2.45 $ 2.39 $ 2.04 $ 1.70 $ 1.25
Dilutive . . . . . . . . . . . . . . . . . . . . . . . . . . . . . . . . . . . . . . . . $ 1.22 $ 2.44 $ 2.38 $ 2.03 $ 1.70 $ 1.25
Shares Outstanding at Year End . . . . . . . . . . . . . . . . . . . . . . . . 895 777 739 733 726 720
Weighted Average Shares Outstanding . . . . . . . . . . . . . . . . . . . . 836 767 736 729 722 720
Dividends Paid . . . . . . . . . . . . . . . . . . . . . . . . . . . . . . . . . . . . $ 938 $ 871 $ 828 $ 822 $ 794 $ 682
Dividends Paid (per share) . . . . . . . . . . . . . . . . . . . . . . . . . . . . $ 1.10 $ 1.10 $ 1.10 $ 1.10 $ 1.10 $ 0.95
Dividend Payout Ratio (%) . . . . . . . . . . . . . . . . . . . . . . . . . . . . 90 45 46 54 65 76
Book Value (per share) . . . . . . . . . . . . . . . . . . . . . . . . . . . . . . . $16.70 $16.33 $13.60 $12.23 $11.23 $10.48
HISTORICAL REFERENCE c
Market Price (per share)
High . . . . . . . . . . . . . . . . . . . . . . . . . . . . . . . . . . . . . . . . . . $40.00 $47.74 $44.97 $32.34 $35.34 $28.09
Low . . . . . . . . . . . . . . . . . . . . . . . . . . . . . . . . . . . . . . . . . . . $16.42 $32.22 $23.19 $23.53 $26.72 $21.06
Close . . . . . . . . . . . . . . . . . . . . . . . . . . . . . . . . . . . . . . . . . $19.54 $39.26 $42.63 $25.06 $32.03 $27.69
a Financial information reflects accounting for the merger with PanEnergy Corp as a pooling of interests. As a result, the financial information gives effect to the merger as if it had occurred
January 1, 1997.b Amounts prior to 2001 were restated to reflect the two-for-one common stock split effective January 26, 2001.c As of 2001, data reflects the intra-day high and low stock price.
Duke Energy Corporation
FINANCIAL HIGHLIGHTS
P/2 Consolidated Data

OtherFranchised Natural Gas Field Duke Energy International Energy Duke Other Minority Total
In millions Electric Transmission Services North America Energy Services Ventures Operations Interest Consolidated
2002 QUARTERS ENDEDMarch 31 . . . . . . . . . . . . . . . . . . . . . . . . . . . . $ 385 $ 268 $ 35 $ 54 $ 67 $ 11 $ 6 $ (79) $ 14 $ 761
June 30 . . . . . . . . . . . . . . . . . . . . . . . . . . . . . 389 312 41 196 67 72 56 (128) 42 1,047
Sept 30 . . . . . . . . . . . . . . . . . . . . . . . . . . . . . 585 287 23 (107 ) (25) 9 21 (118) (7 ) 668
Dec 31 . . . . . . . . . . . . . . . . . . . . . . . . . . . . . 249 307 27 22 (211) (29) 121 (81) (12 ) 393
Total . . . . . . . . . . . . . . . . . . . . . . . . . . . . . . . $1,608 $1,174 $126 $ 165 $(102) $ 63 $204 $(406) $ 37 $2,869
2001 QUARTERS ENDEDMarch 31 . . . . . . . . . . . . . . . . . . . . . . . . . . . . $ 460 $ 175 $123 $ 384 $ 76 $ (32) $ 7 $ (70) $131 $1,254
June 30 . . . . . . . . . . . . . . . . . . . . . . . . . . . . . 361 142 84 272 68 (12) 36 (73) 24 902
Sept 30 . . . . . . . . . . . . . . . . . . . . . . . . . . . . . 607 143 75 654 74 (58) 51 (54) 37 1,529
Dec 31 . . . . . . . . . . . . . . . . . . . . . . . . . . . . . 203 148 54 177 68 (47) 89 (160) 39 571
Total . . . . . . . . . . . . . . . . . . . . . . . . . . . . . . . $1,631 $ 608 $336 $1,487 $ 286 $(149) $183 $(357) $231 $4,256
2000 QUARTERS ENDEDMarch 31 . . . . . . . . . . . . . . . . . . . . . . . . . . . . $ 465 $ 158 $ 72 $ 82 $ 104 $ 7 $ 18 $ (53) $ 6 $ 859
June 30 . . . . . . . . . . . . . . . . . . . . . . . . . . . . . 395 128 72 70 87 50 15 (57) 77 837
Sept 30 . . . . . . . . . . . . . . . . . . . . . . . . . . . . . 616 132 85 219 83 (53) 445c (16) 45 1,556
Dec 31 . . . . . . . . . . . . . . . . . . . . . . . . . . . . . 344 144 82 11 67 (11) 90 (68) 103 762
Total . . . . . . . . . . . . . . . . . . . . . . . . . . . . . . . $1,820 $ 562 $311 $ 382 $ 341 $ (7) $568 $(194) $231 $4,014
1999 QUARTERS ENDEDMarch 31 . . . . . . . . . . . . . . . . . . . . . . . . . . . . $ 428 $ 218 $ 15 $ 47 $ (1) $ (3) $ 14 $ (56) $ 21 $ 683
June 30 . . . . . . . . . . . . . . . . . . . . . . . . . . . . . 341 152 38 30 6 (4) 24 (35) 16 568
Sept 30 . . . . . . . . . . . . . . . . . . . . . . . . . . . . . 637 134 52 86 20 (45) 29 (23) 18 908
Dec 31 . . . . . . . . . . . . . . . . . . . . . . . . . . . . . (464)d 152 51 56 19 (34) 98 (31) 37 (116)
Total . . . . . . . . . . . . . . . . . . . . . . . . . . . . . . . $ 942 $ 656 $156 $ 219 $ 44 $ (86) $165 $(145) $ 92 $2,043
a Beginning January 1, 2001, Duke Energy discontinued allocating corporate governance costs for its business segment analysis. Prior-year business segment EBIT amounts have been restated to
conform to the current-year presentation of corporate cost allocations.b Prior to April 1, 2002, the Duke Energy North America business segment was combined with Duke Energy Merchants (DEM) to form a segment called North American Wholesale Energy. During
2002, management combined DEM with the Other Energy Services segment. Previous periods have been restated to conform to current presentation.c Financial information reflects a pre-tax gain of $407 million on the sale of Duke Energy’s 20% interest in BellSouth Carolina PCS.d Financial information reflects a pre-tax $800 million charge for estimated injury and damages claims.e On a consolidated basis, EBIT represents a non-GAAP measure for Duke Energy as outlined in the SEC’s Regulation G. Included in Attachment A is a reconciliation of EBIT to net income for
both annual and quarterly periods.P/3
Duke Energy Corporation
EARNINGS BEFORE INTEREST AND TAXES BY BUSINESS SEGMENT a,b,e
Consolidated Data

Natural Other Year EndedFranchised Gas Field Duke Energy International Energy Duke Other Eliminations/ December 31,
In millions Electric Transmission Services North America Energy Services Ventures Operations Adjustments 2002
OPERATING REVENUESSales of natural gas and petroleum products . . . . . . . . $ — $ 750 $5,212 $ 2 $ 72 $ 31 $ — $ — $(1,197) $ 4,870 Generation, transmission and distribution
of electricity . . . . . . . . . . . . . . . . . . . . . . . . . . . . . . 4,689 — — 1,604 747 — — — — 7,040 Transportation and storage of natural gas . . . . . . . . . . — 1,600 126 — 31 — — — (197) 1,560 Trading and marketing net margin . . . . . . . . . . . . . . . — — 18 (54) (22) (24) — — 1,166 1,084 Other . . . . . . . . . . . . . . . . . . . . . . . . . . . . . . . . . . . . 199 114 110 — 44 291 514 (3) (160) 1,109
Total operating revenues b . . . . . . . . . . . . . . . . . . . . . 4,888 2,464 5,466 1,552 872 298 514 (3) (388) 15,663
OPERATING EXPENSESNatural gas and petroleum products purchased . . . . . . — 409 4,429 — 83 2 — 12 (195) 4,740 Fuel used in electric generation . . . . . . . . . . . . . . . . . 872 — — 634 100 — — — — 1,606 Net interchange and purchased power . . . . . . . . . . . . 347 — — — 261 — — — — 608 Operation and maintenance . . . . . . . . . . . . . . . . . . . . 1,227 533 591 642 350 329 318 258 (290) 3,958 Depreciation and amortization . . . . . . . . . . . . . . . . . . 614 324 299 190 86 26 20 12 — 1,571 Property and other taxes . . . . . . . . . . . . . . . . . . . . . . 269 154 46 41 7 3 8 7 — 535 Impairment of goodwill . . . . . . . . . . . . . . . . . . . . . . . — — — — 194 — — — — 194
Total operating expenses . . . . . . . . . . . . . . . . . . . . . . 3,329 1,420 5,365 1,507 1,081 360 346 289 (485) 13,212
GAINS ON SALES OF OTHER ASSETS, NET . . . . . . . — — — — — 16 33 — — 49
OPERATING INCOMEb . . . . . . . . . . . . . . . . . . . . . . 1,559 1,044 101 45 (209) (46) 201 (292) 97 2,500
OTHER INCOME AND EXPENSESDeferred returns and allowance for funds
used during construction . . . . . . . . . . . . . . . . . . . . . 63 16 — — — — — — — 79 Equity in earnings of unconsolidated affiliates . . . . . . . — 106 60 44 65 107 — (162) — 220 Gains on sale of equity investments . . . . . . . . . . . . . . — 32 — — — — — — — 32 Other income and expenses, net . . . . . . . . . . . . . . . . (14 ) 7 1 33 57 2 1 48 (97) 38
Total other income and expenses . . . . . . . . . . . . . . . . 49 161 61 77 122 109 1 (114) (97) 369
MINORITY INTEREST EXPENSE (BENEFIT) a . . . . . . — 31 36 (43) 15 — (2 ) — (37) —
EARNINGS BEFORE INTEREST AND TAXES (EBIT) . . $1,608 $1,174 $ 126 $165 $ (102) $ 63 $204 $(406) $ 37 $ 2,869
INTEREST EXPENSE . . . . . . . . . . . . . . . . . . . . . . . . 1,110 MINORITY INTEREST EXPENSE . . . . . . . . . . . . . . . 107
EARNINGS BEFORE INCOME TAXES . . . . . . . . . . . . 1,652 INCOME TAXES . . . . . . . . . . . . . . . . . . . . . . . . . . . . 618
NET INCOME . . . . . . . . . . . . . . . . . . . . . . . . . . . . . 1,034 PREFERRED AND PREFERENCE
STOCK DIVIDENDS . . . . . . . . . . . . . . . . . . . . . . . . 13
EARNINGS AVAILABLE FOR COMMON STOCKHOLDERS . . . . . . . . . . . . . . . . . . $ 1,021
a Includes minority interest expense related to EBIT and excludes minority interest expense related to interest and taxes.b Amounts presented for revenues and operating income differ from the corresponding amounts presented in the 2002 Annual Report due to the impact of certain reclassifications, as presented
in Attachment B. The amounts in this supplement reflect changes in segment presentation that were instituted in the first quarter of 2003.
Duke Energy Corporation
CONSOLIDATING INCOME STATEMENT
P/4 Consolidated Data

. . Years ended December 31 . .
In millions 2002 2001 2000 1999 1998 1997c
OPERATING REVENUESSales of natural gas and petroleum products . . . . . . . . . . . . . . . . . . . . . . . . . . . . . . $ 4,870 $ 6,194 $ 4,877 $ 2,018 $ 794 $ 740 Generation, transmission and distribution of electricity . . . . . . . . . . . . . . . . . . . . . . . 7,040 7,195 7,488 5,336 4,690 4,334 Transportation and storage of natural gas . . . . . . . . . . . . . . . . . . . . . . . . . . . . . . . . 1,560 994 1,045 1,139 1,450 1,504 Trading and marketing net margin . . . . . . . . . . . . . . . . . . . . . . . . . . . . . . . . . . . . . 1,084 2,462 1,068 725 845 695 Other . . . . . . . . . . . . . . . . . . . . . . . . . . . . . . . . . . . . . . . . . . . . . . . . . . . . . . . . . 1,109 1,352 864 917 857 655
Total operating revenues . . . . . . . . . . . . . . . . . . . . . . . . . . . . . . . . . . . . . . . . . . . . 15,663 18,197 15,342 10,135 8,636 7,928
OPERATING EXPENSESNatural gas and petroleum products purchased . . . . . . . . . . . . . . . . . . . . . . . . . . . . 4,740 6,559 4,850 2,271 1,242 982 Fuel used in electric generation . . . . . . . . . . . . . . . . . . . . . . . . . . . . . . . . . . . . . . . 1,606 1,583 1,943 1,008 863 743 Net interchange and purchased power . . . . . . . . . . . . . . . . . . . . . . . . . . . . . . . . . . 608 450 406 239 176 302 Operation and maintenance . . . . . . . . . . . . . . . . . . . . . . . . . . . . . . . . . . . . . . . . . 3,958 4,099 3,469 3,703b 2,738 2,721 Depreciation and amortization . . . . . . . . . . . . . . . . . . . . . . . . . . . . . . . . . . . . . . . . 1,571 1,336 1,167 968 909 841 Property and other taxes . . . . . . . . . . . . . . . . . . . . . . . . . . . . . . . . . . . . . . . . . . . . 535 431 418 371 350 369 Impairment of goodwill . . . . . . . . . . . . . . . . . . . . . . . . . . . . . . . . . . . . . . . . . . . . . 194 36 — — — —
Total operating expenses . . . . . . . . . . . . . . . . . . . . . . . . . . . . . . . . . . . . . . . . . . . . 13,212 14,494 12,253 8,560 6,278 5,958
GAINS ON SALES OF OTHER ASSETS, NET . . . . . . . . . . . . . . . . . . . . . . . . . . . . 49 238 214 132 48 —
OPERATING INCOME . . . . . . . . . . . . . . . . . . . . . . . . . . . . . . . . . . . . . . . . . . . . . 2,500 3,941 3,303 1,707 2,406 1,970
OTHER INCOME AND EXPENSESDeferred returns and allowance for funds used during construction . . . . . . . . . . . . . . 79 71 63 82 88 109 Equity in earnings of unconsolidated affiliates . . . . . . . . . . . . . . . . . . . . . . . . . . . . . 220 168 103 112 79 — Gains on sale of equity investments . . . . . . . . . . . . . . . . . . . . . . . . . . . . . . . . . . . . 32 — 407 — — — Other income and expenses, net . . . . . . . . . . . . . . . . . . . . . . . . . . . . . . . . . . . . . . 38 76 138 142 74 29
Total other income and expenses . . . . . . . . . . . . . . . . . . . . . . . . . . . . . . . . . . . . . . 369 315 711 336 241 138
EARNINGS BEFORE INTEREST AND TAXES (EBIT) . . . . . . . . . . . . . . . . . . . . . . . 2,869 4,256 4,014 2,043 2,647 2,108
INTEREST EXPENSE . . . . . . . . . . . . . . . . . . . . . . . . . . . . . . . . . . . . . . . . . . . . . . 1,110 785 911 601 514 472 MINORITY INTEREST EXPENSE a . . . . . . . . . . . . . . . . . . . . . . . . . . . . . . . . . . . . 107 327 307 142 96 23
EARNINGS BEFORE INCOME TAXES . . . . . . . . . . . . . . . . . . . . . . . . . . . . . . . . . 1,652 3,144 2,796 1,300 2,037 1,613 INCOME TAXES . . . . . . . . . . . . . . . . . . . . . . . . . . . . . . . . . . . . . . . . . . . . . . . . . 618 1,150 1,020 453 777 639
INCOME BEFORE EXTRAORDINARY ITEM AND CUMULATIVEEFFECT OF CHANGE IN ACCOUNTING PRINCIPLE . . . . . . . . . . . . . . . . . . . . . 1,034 1,994 1,776 847 1,260 974
EXTRAORDINARY GAIN (LOSS), NET OF TAX . . . . . . . . . . . . . . . . . . . . . . . . . . . — — — 660 (8) — CUMULATIVE EFFECT OF CHANGE IN ACCOUNTING
PRINCIPLE, NET OF TAX . . . . . . . . . . . . . . . . . . . . . . . . . . . . . . . . . . . . . . . . . — (96) — — — —
NET INCOME . . . . . . . . . . . . . . . . . . . . . . . . . . . . . . . . . . . . . . . . . . . . . . . . . . . 1,034 1,898 1,776 1,507 1,252 974 PREFERRED AND PREFERENCE STOCK DIVIDENDS . . . . . . . . . . . . . . . . . . . . . 13 14 19 20 21 72
EARNINGS AVAILABLE FOR COMMON STOCKHOLDERS . . . . . . . . . . . . . . . . . . . $ 1,021 $ 1,884 $ 1,757 $ 1,487 $1,231 $ 902
a Minority Interests include dividends of $108 million for 2002, $108 million for 2001, $108 million for 2000, $87 million for 1999, $44 million for 1998 and $15 million for 1997 related to trust preferred securities.b Financial information reflects a pre-tax $800 million charge for estimated injury and damages claims.c The Consolidated Income Statement for 1997 has not been restated to present gains on sale of other assets, net; gain on sale of equity investments; or equity in earnings of unconsolidated affiliates
separately from revenues as the information is not readily available.
P/5
Duke Energy Corporation
CONSOLIDATED INCOME STATEMENT
Consolidated Data

Natural Other Other Year EndedFranchised Gas Field Duke Energy International Energy Duke Operations & December 31,
In millions Electric Transmission Services North America Energy Services Ventures Eliminations 2002
CURRENT ASSETSCash and cash equivalents . . . . . . . . . . . . . . . . . . . . . . . . . $ 18 $ 63 $ 8 $ 51 $ 91 $ 21 $ 54 $ 551 $ 857
Receivables . . . . . . . . . . . . . . . . . . . . . . . . . . . . . . . . . . . . 898 556 845 3,360 980 497 95 (465) 6,766
Inventory . . . . . . . . . . . . . . . . . . . . . . . . . . . . . . . . . . . . . . 363 153 86 220 42 105 165 — 1,134
Unrealized gains on mark-to-market and
hedging transactions . . . . . . . . . . . . . . . . . . . . . . . . . . . . . — — 209 1,454 396 92 — (7) 2,144
Other . . . . . . . . . . . . . . . . . . . . . . . . . . . . . . . . . . . . . . . . 4 59 45 737 67 (11) — 51 952
Total current assets . . . . . . . . . . . . . . . . . . . . . . . . . . . . . . . 1,283 831 1,193 5,822 1,576 704 314 130 11,853
INVESTMENTS AND OTHER ASSETSInvestments in unconsolidated affiliates . . . . . . . . . . . . . . . . — 1,235 290 339 122 30 44 6 2,066
Investments and advances in subsidiaries . . . . . . . . . . . . . . . 10,714 2,778 (277) 2,038 (375) 2,347 128 (17,353) —
Nuclear decommissioning trust funds . . . . . . . . . . . . . . . . . . 708 — — — — — — — 708
Goodwill, net of accumulated amortization . . . . . . . . . . . . . . . — 2,760 481 100 246 — 6 154 3,747
Notes receivable . . . . . . . . . . . . . . . . . . . . . . . . . . . . . . . . . — 22 2 49 104 — 412 — 589
Unrealized gains on mark-to-market and
hedging transactions . . . . . . . . . . . . . . . . . . . . . . . . . . . . . 15 — 47 2,270 111 53 — (16) 2,480
Other . . . . . . . . . . . . . . . . . . . . . . . . . . . . . . . . . . . . . . . . 12 99 172 76 924 75 11 276 1,645
Total investments and other assets . . . . . . . . . . . . . . . . . . . . 11,449 6,894 715 4,872 1,132 2,505 601 (16,933) 11,235
PROPERTY, PLANT AND EQUIPMENTCost . . . . . . . . . . . . . . . . . . . . . . . . . . . . . . . . . . . . . . . . . 19,298 11,212 6,019 7,548 3,014 154 1,437 (5) 48,677
Accumulated depreciation and amortization . . . . . . . . . . . . . . (8,382) (1,829) (1,377) (430) (299) (55) (68) (18) (12,458)
Net property, plant and equipment . . . . . . . . . . . . . . . . . . . . 10,916 9,383 4,642 7,118 2,715 99 1,369 (23) 36,219
REGULATORY ASSETS AND DEFERRED DEBITSDeferred debt expense . . . . . . . . . . . . . . . . . . . . . . . . . . . . 195 64 — — — — — 4 263
Regulatory asset related to income taxes . . . . . . . . . . . . . . . . 383 553 — — — — — — 936
Other . . . . . . . . . . . . . . . . . . . . . . . . . . . . . . . . . . . . . . . . 285 221 — 6 6 — 1 (59) 460
Total regulatory assets and deferred debits . . . . . . . . . . . . . . 863 838 — 6 6 — 1 (55) 1,659
TOTAL ASSETS . . . . . . . . . . . . . . . . . . . . . . . . . . . . . . . . . $24,511 $17,946 $ 6,550 $17,818 $5,429 $3,308 $2,285 $(16,881) $ 60,966
Duke Energy Corporation
CONSOLIDATING BALANCE SHEET - ASSETS
P/6 Consolidated Data

P/7
Duke Energy Corporation
CONSOLIDATING BALANCE SHEET - LIABILITIES AND STOCKHOLDERS’ EQUITY
Natural Other Other Year EndedFranchised Gas Field Duke Energy International Energy Duke Operations & December 31,
In millions Electric Transmission Services North America Energy Services Ventures Eliminations 2002
CURRENT LIABILITIESAccounts payable . . . . . . . . . . . . . . . . . . . . . . . . . . . . . . . . $ 505 $ 159 $ 679 $ 3,930 $ 582 $ 96 $ 20 $ (381) $ 5,590Notes payable and commercial paper . . . . . . . . . . . . . . . . . . 238 181 232 35 182 — 1 46 915Taxes accrued . . . . . . . . . . . . . . . . . . . . . . . . . . . . . . . . . . 217 450 (188) 416 (60) (13) 208 (874) 156Interest accrued . . . . . . . . . . . . . . . . . . . . . . . . . . . . . . . . . 75 84 59 348 10 — 19 (285) 310Current maturities of long-term debt and preferred stock . . . . 6 238 — 17 116 2 13 939 1,331Unrealized losses on mark-to-market and hedging transactions — 13 348 988 413 147 — 9 1,918Other . . . . . . . . . . . . . . . . . . . . . . . . . . . . . . . . . . . . . . . . 168 324 121 426 140 190 108 293 1,770
Total current liabilities . . . . . . . . . . . . . . . . . . . . . . . . . . . . . 1,209 1,449 1,251 6,160 1,383 422 369 (253) 11,990
LONG-TERM DEBT . . . . . . . . . . . . . . . . . . . . . . . . . . . . . . 4,703 7,222 2,256 6,796 1,351 1,486 1,367 (4,960) 20,221
DEFERRED CREDITS AND OTHER LIABILITIESDeferred income taxes . . . . . . . . . . . . . . . . . . . . . . . . . . . . 1,581 1,474 764 646 291 (71) 101 48 4,834Investment tax credit . . . . . . . . . . . . . . . . . . . . . . . . . . . . . 175 1 — — — — — — 176Nuclear decommissioning costs externally funded . . . . . . . . . 708 — — — — — — — 708Unrealized losses on mark-to-market and
hedging transactions . . . . . . . . . . . . . . . . . . . . . . . . . . . . . 10 9 49 1,301 92 23 — 64 1,548Other . . . . . . . . . . . . . . . . . . . . . . . . . . . . . . . . . . . . . . . . 579 622 114 100 469 27 44 1,121 3,076
Total deferred credits and other liabilities . . . . . . . . . . . . . . . 3,053 2,106 927 2,047 852 (21) 145 1,233 10,342
GUARANTEED PREFERRED BENEFICIAL INTERESTS IN SUBORDINATED NOTES OF DUKE ENERGY CORPORATION OR SUBSIDIARIES . . . . . 602 — — — — — — 806 1,408
MINORITY INTERESTS . . . . . . . . . . . . . . . . . . . . . . . . . . . — 560 928 246 147 — 21 2 1,904
PREFERRED AND PREFERENCE STOCKPreferred and preference stock with
sinking fund requirements . . . . . . . . . . . . . . . . . . . . . . . . . — — — — — — — 23 23Preferred and preference stock without
sinking fund requirements . . . . . . . . . . . . . . . . . . . . . . . . . — — — — — — — 134 134
Total preferred and preference stock . . . . . . . . . . . . . . . . . . . — — — — — — — 157 157
COMMON STOCKHOLDERS’ EQUITYCommon stock . . . . . . . . . . . . . . . . . . . . . . . . . . . . . . . . . . 9,236 3 1 4 125 — — (133) 9,236Additional paid-in capital . . . . . . . . . . . . . . . . . . . . . . . . . . . — 4,904 293 908 2,319 1,391 (1,059) (8,756) —Retained earnings . . . . . . . . . . . . . . . . . . . . . . . . . . . . . . . . 5,708 1,696 959 1,111 (67) 36 1,444 (4,470) 6,417Accumulated other comprehensive income (loss) . . . . . . . . . . — 6 (65) 546 (681) (6 ) (2 ) (507) (709)
Total common stockholders’ equity . . . . . . . . . . . . . . . . . . . . 14,944 6,609 1,188 2,569 1,696 1,421 383 (13,866) 14,944
TOTAL LIABILITIES AND STOCKHOLDERS’ EQUITY . . . . . . $24,511 $17,946 $6,550 $17,818 $5,429 $3,308 $ 2,285 $(16,881) $60,966
Consolidated Data

. . Years ended December 31 . .
In millions 2002 2001 2000 1999 1998 1997
CURRENT ASSETSCash and cash equivalents . . . . . . . . . . . . . . . . . . . . . . . . . . . . . . . . . . . $ 857 $ 290 $ 622 $ 613 $ 80 $ 109
Receivables . . . . . . . . . . . . . . . . . . . . . . . . . . . . . . . . . . . . . . . . . . . . . . 6,766 5,301 8,648 3,248 2,318 2,281
Inventory . . . . . . . . . . . . . . . . . . . . . . . . . . . . . . . . . . . . . . . . . . . . . . . . 1,134 1,017 739 599 543 440
Unrealized gains on mark-to-market and hedging transactions . . . . . . . . . . . 2,144 2,326 11,038 1,131 1,457 551
Other . . . . . . . . . . . . . . . . . . . . . . . . . . . . . . . . . . . . . . . . . . . . . . . . . . 952 667 1,466 580 445 304
Total current assets . . . . . . . . . . . . . . . . . . . . . . . . . . . . . . . . . . . . . . . . . 11,853 9,601 22,513 6,171 4,843 3,685
INVESTMENTS AND OTHER ASSETSInvestments in unconsolidated affiliates . . . . . . . . . . . . . . . . . . . . . . . . . . 2,066 1,480 1,387 1,299 902 686
Nuclear decommissioning trust funds . . . . . . . . . . . . . . . . . . . . . . . . . . . . 708 716 717 703 580 471
Goodwill, net of accumulated amortization . . . . . . . . . . . . . . . . . . . . . . . . . 3,747 1,730 1,566 844 495 504
Notes receivable . . . . . . . . . . . . . . . . . . . . . . . . . . . . . . . . . . . . . . . . . . . 589 576 462 154 244 240
Unrealized gains on mark-to-market and hedging transactions . . . . . . . . . . . 2,480 3,117 4,218 690 396 66
Other . . . . . . . . . . . . . . . . . . . . . . . . . . . . . . . . . . . . . . . . . . . . . . . . . . 1,645 1,612 1,447 1,020 615 481
Total investments and other assets . . . . . . . . . . . . . . . . . . . . . . . . . . . . . . 11,235 9,231 9,797 4,710 3,232 2,448
PROPERTY, PLANT AND EQUIPMENTCost . . . . . . . . . . . . . . . . . . . . . . . . . . . . . . . . . . . . . . . . . . . . . . . . . . . 48,677 39,464 34,598 30,436 27,128 25,448
Less accumulated depreciation and amortization . . . . . . . . . . . . . . . . . . . . (12,458) (11,049) (10,146) (9,441) (10,253) (9,712)
Net property, plant and equipment . . . . . . . . . . . . . . . . . . . . . . . . . . . . . . 36,219 28,415 24,452 20,995 16,875 15,736
REGULATORY ASSETS AND DEFERRED DEBITSDeferred debt expense . . . . . . . . . . . . . . . . . . . . . . . . . . . . . . . . . . . . . . 263 203 208 223 253 253
Regulatory asset related to income taxes . . . . . . . . . . . . . . . . . . . . . . . . . . 936 510 506 500 506 511
Other . . . . . . . . . . . . . . . . . . . . . . . . . . . . . . . . . . . . . . . . . . . . . . . . . . 460 571 756 810 1,097 1,396
Total regulatory assets and deferred debits . . . . . . . . . . . . . . . . . . . . . . . . 1,659 1,284 1,470 1,533 1,856 2,160
TOTAL ASSETS . . . . . . . . . . . . . . . . . . . . . . . . . . . . . . . . . . . . . . . . . . . $ 60,966 $ 48,531 $ 58,232 $33,409 $ 26,806 $24,029
Duke Energy Corporation
CONSOLIDATED BALANCE SHEETS - ASSETS
P/8 Consolidated Data

P/9
Duke Energy Corporation
CONSOLIDATED BALANCE SHEETS - LIABILITIES AND STOCKHOLDERS’ EQUITY
. . Years ended December 31 . .
In millions 2002 2001 2000 1999 1998 1997
CURRENT LIABILITIESAccounts payable . . . . . . . . . . . . . . . . . . . . . . . . . . . . . . . . . . . . . . . . . . . . $ 5,590 $ 4,231 $ 7,733 $ 2,312 $ 1,754 $ 1,670Notes payable and commercial paper . . . . . . . . . . . . . . . . . . . . . . . . . . . . . . 915 1,603 1,826 267 209 170Taxes accrued . . . . . . . . . . . . . . . . . . . . . . . . . . . . . . . . . . . . . . . . . . . . . . . 156 443 261 685 119 125Interest accrued . . . . . . . . . . . . . . . . . . . . . . . . . . . . . . . . . . . . . . . . . . . . . 310 239 208 139 109 111Current maturities of long-term debt and preferred stock . . . . . . . . . . . . . . . . . 1,331 274 470 515 707 77Unrealized losses on mark-to-market and hedging transactions . . . . . . . . . . . . 1,918 1,519 11,070 1,241 1,387 538Other . . . . . . . . . . . . . . . . . . . . . . . . . . . . . . . . . . . . . . . . . . . . . . . . . . . . . 1,770 2,146 1,769 717 670 584
Total current liabilities . . . . . . . . . . . . . . . . . . . . . . . . . . . . . . . . . . . . . . . . . 11,990 10,455 23,337 5,876 4,955 3,275
LONG-TERM DEBT . . . . . . . . . . . . . . . . . . . . . . . . . . . . . . . . . . . . . . . . . . 20,221 12,321 10,717 8,683 6,272 6,530
DEFERRED CREDITS AND OTHER LIABILITIESDeferred income taxes . . . . . . . . . . . . . . . . . . . . . . . . . . . . . . . . . . . . . . . . . 4,834 4,307 3,851 3,402 3,705 3,707Investment tax credit . . . . . . . . . . . . . . . . . . . . . . . . . . . . . . . . . . . . . . . . . . 176 189 211 225 242 257Nuclear decommissioning costs externally funded . . . . . . . . . . . . . . . . . . . . . . 708 716 717 703 580 471Unrealized losses on mark-to-market and hedging transactions . . . . . . . . . . . . 1,548 2,212 3,581 438 362 50Other . . . . . . . . . . . . . . . . . . . . . . . . . . . . . . . . . . . . . . . . . . . . . . . . . . . . . 3,076 1,755 1,674 2,200 1,055 1,203
Total deferred credits and other liabilities . . . . . . . . . . . . . . . . . . . . . . . . . . . . 10,342 9,179 10,034 6,968 5,944 5,688
GUARANTEED PREFERRED BENEFICIAL INTERESTS IN SUBORDINATEDNOTES OF DUKE ENERGY CORPORATION OR SUBSIDIARIES . . . . . . . . . 1,408 1,407 1,406 1,404 919 339
MINORITY INTERESTS IN FINANCING SUBSIDIARY . . . . . . . . . . . . . . . . . — 1,025 1,025 — — —
MINORITY INTERESTS . . . . . . . . . . . . . . . . . . . . . . . . . . . . . . . . . . . . . . . 1,904 1,221 1,410 1,200 253 168
PREFERRED AND PREFERENCE STOCKPreferred and preference stock with sinking fund requirements . . . . . . . . . . . . 23 25 38 71 104 149Preferred and preference stock without sinking fund requirements . . . . . . . . . . 134 209 209 209 209 340
Total preferred and preference stock . . . . . . . . . . . . . . . . . . . . . . . . . . . . . . . 157 234 247 280 313 489
COMMON STOCKHOLDERS’ EQUITYCommon stock . . . . . . . . . . . . . . . . . . . . . . . . . . . . . . . . . . . . . . . . . . . . . . 9,236 6,217 4,797 4,603 4,449 4,284Retained earnings . . . . . . . . . . . . . . . . . . . . . . . . . . . . . . . . . . . . . . . . . . . . 6,417 6,292 5,379 4,397 3,701 3,256Accumulated other comprehensive (loss) income . . . . . . . . . . . . . . . . . . . . . . (709) 180 (120) (2 ) — —
Total common stockholders’ equity . . . . . . . . . . . . . . . . . . . . . . . . . . . . . . . . 14,944 12,689 10,056 8,998 8,150 7,540
TOTAL LIABILITIES AND STOCKHOLDERS’ EQUITY . . . . . . . . . . . . . . . . . . $60,966 $48,531 $58,232 $33,409 $26,806 $24,029
Consolidated Data

P/10
. . Years ended December 31 . .
In millions 2002 2001 2000 1999a 1998a 1997a
OPERATING ACTIVITIESNet Income . . . . . . . . . . . . . . . . . . . . . . . . . . . . . . . . . . . . . . . . . . . . . . . . . . . . . . . . . . . $ 1,034 $ 1,898 $ 1,776 $ 1,507 $ 1,252 $ 974Adjustments to reconcile net income to net cash provided by operating activities:
Depreciation and amortization . . . . . . . . . . . . . . . . . . . . . . . . . . . . . . . . . . . . . . . . . . . . . 1,692 1,450 1,348 1,151 1,055 983Cumulative effect of change in accounting principle . . . . . . . . . . . . . . . . . . . . . . . . . . . . . . — 96 — — — —Extraordinary (gain) loss, net of tax . . . . . . . . . . . . . . . . . . . . . . . . . . . . . . . . . . . . . . . . . — — — (660 ) 8 —Gains on sales of subsidiaries, equity investment and assets . . . . . . . . . . . . . . . . . . . . . . . . (81 ) (238 ) (621 ) — — —Provision on DENA’s California receivables . . . . . . . . . . . . . . . . . . . . . . . . . . . . . . . . . . . . — — 110 — — —Impairment charges . . . . . . . . . . . . . . . . . . . . . . . . . . . . . . . . . . . . . . . . . . . . . . . . . . . . 545 36 — — — —Injuries and damages accrual . . . . . . . . . . . . . . . . . . . . . . . . . . . . . . . . . . . . . . . . . . . . . — — — 800 — —Deferred income taxes . . . . . . . . . . . . . . . . . . . . . . . . . . . . . . . . . . . . . . . . . . . . . . . . . . 495 129 152 (210 ) (35 ) 99Purchased capacity levelization . . . . . . . . . . . . . . . . . . . . . . . . . . . . . . . . . . . . . . . . . . . . 175 156 138 104 88 56Transition cost recoveries (payments), net . . . . . . . . . . . . . . . . . . . . . . . . . . . . . . . . . . . . . — — 82 95 (28 ) (36 )
(Increase) decrease inNet realized and unrealized mark-to-market and hedging transactions . . . . . . . . . . . . . . . . . 596 91 (464 ) (24 ) (75 ) —Receivables . . . . . . . . . . . . . . . . . . . . . . . . . . . . . . . . . . . . . . . . . . . . . . . . . . . . . . . . . . 12 3,166 (5,167 ) (659 ) (18 ) (266 )Inventory . . . . . . . . . . . . . . . . . . . . . . . . . . . . . . . . . . . . . . . . . . . . . . . . . . . . . . . . . . . . 134 (192 ) (100 ) (89 ) (104 ) (7 )Other current assets . . . . . . . . . . . . . . . . . . . . . . . . . . . . . . . . . . . . . . . . . . . . . . . . . . . . (335 ) 694 (796 ) (138 ) (39 ) (18 )
Increase (decrease) inAccounts payable . . . . . . . . . . . . . . . . . . . . . . . . . . . . . . . . . . . . . . . . . . . . . . . . . . . . . . 798 (3,545 ) 4,867 477 72 239Taxes accrued . . . . . . . . . . . . . . . . . . . . . . . . . . . . . . . . . . . . . . . . . . . . . . . . . . . . . . . . (332 ) 183 (439 ) (57 ) (6 ) 50Interest accrued . . . . . . . . . . . . . . . . . . . . . . . . . . . . . . . . . . . . . . . . . . . . . . . . . . . . . . . 23 28 64 32 (2 ) (13 )Other current liabilities . . . . . . . . . . . . . . . . . . . . . . . . . . . . . . . . . . . . . . . . . . . . . . . . . . (217 ) 297 1,116 73 84 15
Other, net . . . . . . . . . . . . . . . . . . . . . . . . . . . . . . . . . . . . . . . . . . . . . . . . . . . . . . . . . . . . (9 ) 108 (55 ) 282 79 64
NET CASH PROVIDED BY OPERATING ACTIVITIES . . . . . . . . . . . . . . . . . . . . . . . . . . . . . . . 4,530 4,357 2,011 2,684 2,331 2,140
INVESTING ACTIVITIESCapital and investment expenditures, net of cash acquired . . . . . . . . . . . . . . . . . . . . . . . . . . (5,565 ) (7,023 ) (5,534 ) (5,887 ) (2,462 ) (2,028 )Acquisition of Westcoast Energy Inc., net of cash acquired . . . . . . . . . . . . . . . . . . . . . . . . . . (1,707 ) — — — — —Proceeds from sales of subsidiaries, equity investment and assets . . . . . . . . . . . . . . . . . . . . . 312 742 1,063 1,900 — —Notes receivable . . . . . . . . . . . . . . . . . . . . . . . . . . . . . . . . . . . . . . . . . . . . . . . . . . . . . . . 204 201 (158 ) — — —Other . . . . . . . . . . . . . . . . . . . . . . . . . . . . . . . . . . . . . . . . . . . . . . . . . . . . . . . . . . . . . . . (53 ) 37 (87 ) 236 24 34
NET CASH USED IN INVESTING ACTIVITIES . . . . . . . . . . . . . . . . . . . . . . . . . . . . . . . . . . . . (6,809 ) (6,043 ) (4,716 ) (3,751 ) (2,438 ) (1,994 )
FINANCING ACTIVITIESProceeds from the
Issuance of long-term debt . . . . . . . . . . . . . . . . . . . . . . . . . . . . . . . . . . . . . . . . . . . . . . . 5,114 2,673 3,206 3,221 1,357 1,618Issuance of guaranteed preferred beneficial interests in subordinated
notes of Duke Energy Corporation or subsidiaries . . . . . . . . . . . . . . . . . . . . . . . . . . . . . . . — — — 484 581 339Issuance of common stock and exercise of stock options . . . . . . . . . . . . . . . . . . . . . . . . . . 1,323 1,432 230 162 176 15
Payments for the redemption ofLong-term debt . . . . . . . . . . . . . . . . . . . . . . . . . . . . . . . . . . . . . . . . . . . . . . . . . . . . . . . (1,837 ) (1,298 ) (1,191 ) (1,505 ) (698 ) (869 )Common stock . . . . . . . . . . . . . . . . . . . . . . . . . . . . . . . . . . . . . . . . . . . . . . . . . . . . . . . . — — — — — (25 )Preferred and preference stock . . . . . . . . . . . . . . . . . . . . . . . . . . . . . . . . . . . . . . . . . . . . (88 ) (33 ) (33 ) (20 ) (180 ) (224 )
Net change in notes payable and commercial paper . . . . . . . . . . . . . . . . . . . . . . . . . . . . . . . (1,067 ) (246 ) 1,484 58 (350 ) (290 )Distributions to minority interests . . . . . . . . . . . . . . . . . . . . . . . . . . . . . . . . . . . . . . . . . . . . (2,260 ) (3,063 ) (4,769 ) — — —Contributions from minority interests . . . . . . . . . . . . . . . . . . . . . . . . . . . . . . . . . . . . . . . . . 2,535 2,733 4,674 — — —Dividends paid . . . . . . . . . . . . . . . . . . . . . . . . . . . . . . . . . . . . . . . . . . . . . . . . . . . . . . . . . (938 ) (871 ) (828 ) (822 ) (814 ) (726 )Other . . . . . . . . . . . . . . . . . . . . . . . . . . . . . . . . . . . . . . . . . . . . . . . . . . . . . . . . . . . . . . . 64 27 (59 ) 22 6 (41 )
NET CASH PROVIDED BY (USED IN) FINANCING ACTIVITIES . . . . . . . . . . . . . . . . . . . . . . . 2,846 1,354 2,714 1,600 78 (203 )
CHANGE IN CASH AND CASH EQUIVALENTSNet increase (decrease) in cash and cash equivalents . . . . . . . . . . . . . . . . . . . . . . . . . . . . . 567 (332 ) 9 533 (29 ) (57 )Cash and cash equivalents at beginning of period . . . . . . . . . . . . . . . . . . . . . . . . . . . . . . . . 290 622 613 80 109 166
CASH AND CASH EQUIVALENTS AT END OF PERIOD . . . . . . . . . . . . . . . . . . . . . . . . . . . . . $ 857 $ 290 $ 622 $ 613 $ 80 $ 109
a Consolidated Statements of Cash Flows for 1997 through 1999 have not been restated to separately present gains and proceeds on sales of subsidiaries, equity investment and assets, and distributions to/contributions from minority interestas this information is not readily available.
Duke Energy Corporation
CONSOLIDATED STATEMENT OF CASH FLOWS
Consolidated Data

P/11
Duke Energy Corporation
CAPITAL AND INVESTMENT EXPENDITURES
. . Years ended December 31 . .
In millions 2002 2001 2000 1999 1998 1997
Franchised Electric . . . . . . . . . . . . . . . . . . . . . . . . . . . . . . . . . . . . . . . $1,269 $1,115 $ 661 $ 759 $ 586 $ 743
Natural Gas Transmissiona . . . . . . . . . . . . . . . . . . . . . . . . . . . . . . . . . . 2,878 748 973 261 290 247
Field Services . . . . . . . . . . . . . . . . . . . . . . . . . . . . . . . . . . . . . . . . . . . 309 587 376 1,630 304 157
Duke Energy North America . . . . . . . . . . . . . . . . . . . . . . . . . . . . . . . . . . 2,013 3,213 1,735 1,028 796 366
International Energy . . . . . . . . . . . . . . . . . . . . . . . . . . . . . . . . . . . . . . . 412 442 980 1,779 239 —
Other Energy Services . . . . . . . . . . . . . . . . . . . . . . . . . . . . . . . . . . . . . 32 72 230 94 41 47
Duke Ventures . . . . . . . . . . . . . . . . . . . . . . . . . . . . . . . . . . . . . . . . . . . 459 773 643 382 232 235
Other Operationsb . . . . . . . . . . . . . . . . . . . . . . . . . . . . . . . . . . . . . . . . (23 ) 90 36 3 12 233
Cash acquired in acquisitions . . . . . . . . . . . . . . . . . . . . . . . . . . . . . . . . (77 ) (17) (100) (49) (38) —
TOTAL CAPITAL AND INVESTMENT EXPENDITURES . . . . . . . . . . . . . . . . $7,272 $7,023 $5,534 $5,887 $2,462 $2,028
a Amounts include the acquisition of Westcoast Energy Inc. (Westcoast) in 2002.b Amounts include deferral in the consolidation of 50% of the profit earned by Duke/Fluor Daniel for the construction of Duke Energy North America’s merchant generation plants, which is
associated with Duke Energy’s ownership, until the plant is sold as part of Duke Energy North America’s portfolio management strategy.
Consolidated Data

Redemption Date of Next NextPrice at Redemption Redemption 2008 and
In millions Year Due 12/31/02 (%) Price Change Price (%) 2003 2004 2005 2006 2007 Beyond Total
DUKE ENERGY CORPORATION UNCONSOLIDATEDFirst and Refunding Mortgage Bonds:
6.625% Series B . . . . . . . . . . . . . . . . . . . . . . . . . . . . . 2003 $ 100 $ — $ — $ — $ — $ — $ 1006.125% . . . . . . . . . . . . . . . . . . . . . . . . . . . . . . . . . . . . 2003 75 — — — — — 756.875% Series B . . . . . . . . . . . . . . . . . . . . . . . . . . . . . 2023 102.200 8/1/2003 102.000 — — — — — 200 2006.75% . . . . . . . . . . . . . . . . . . . . . . . . . . . . . . . . . . . . . 2025 101.963 8/1/2003 101.785 — — — — — 150 150a 8.95% . . . . . . . . . . . . . . . . . . . . . . . . . . . . . . . . . . . . . 2027 — — — — — 15 157.0% . . . . . . . . . . . . . . . . . . . . . . . . . . . . . . . . . . . . . 2033 7/1/2003 102.350 — — — — — 150 150
Subtotal, First and Refunding Mortgage Bonds . . . . . . . . 175 — — — — 515 690
Pollution Control Bonds:Series 1999 (Floating Rate) . . . . . . . . . . . . . . . . . . . . . . 2012 100.000 — — — — — 20 20Series 1990 (Floating Rate) . . . . . . . . . . . . . . . . . . . . . . 2014 100.000 — — — — — 40 405.80% Series 1993 . . . . . . . . . . . . . . . . . . . . . . . . . . . . 2014 4/1/2003 102.000 — — — — — 77 77Series 1999 (Floating Rate) . . . . . . . . . . . . . . . . . . . . . . 2017 100.000 — — — — — 25 25Series 1999 (Floating Rate) . . . . . . . . . . . . . . . . . . . . . . 2017 100.000 — — — — — 10 10
Subtotal, Pollution Control Bonds . . . . . . . . . . . . . . . . . . — — — — — 172 172
Notes:Floating Rate Notes . . . . . . . . . . . . . . . . . . . . . . . . . . . 2005 — — 250 — — — 2504.611% . . . . . . . . . . . . . . . . . . . . . . . . . . . . . . . . . . . . 2007 — — — — 110 — 1105.375% . . . . . . . . . . . . . . . . . . . . . . . . . . . . . . . . . . . . 2009 — — — — — 200 2007.375% . . . . . . . . . . . . . . . . . . . . . . . . . . . . . . . . . . . . 2010 — — — — — 300 3005.625% . . . . . . . . . . . . . . . . . . . . . . . . . . . . . . . . . . . . 2012 — — — — — 400 4006.25% . . . . . . . . . . . . . . . . . . . . . . . . . . . . . . . . . . . . . 2012 — — — — — 750 750a 6.90% - 9.210% . . . . . . . . . . . . . . . . . . . . . . . . . . . . . 2011-2016 5 5 5 5 5 29 546.60% Retail Notes . . . . . . . . . . . . . . . . . . . . . . . . . . . 2022 4/1/2006 100.000 — — — — — 250 2506.0% . . . . . . . . . . . . . . . . . . . . . . . . . . . . . . . . . . . . . 2028 — — — — — 300 3006.45% . . . . . . . . . . . . . . . . . . . . . . . . . . . . . . . . . . . . . 2032 — — — — — 350 3506.60% Retail Notes . . . . . . . . . . . . . . . . . . . . . . . . . . . 2038 3/11/2004 100.000 — — — — — 200 200
Subtotal, Notes . . . . . . . . . . . . . . . . . . . . . . . . . . . . . . 5 5 255 5 115 2,779 3,164
Commercial Paper . . . . . . . . . . . . . . . . . . . . . . . . . . . . . . — — — — — 650 650Other Duke Energy Corporation Unconsolidated Debt . . . . . Various 1 2 2 2 2 20 29Fair Value Hedge Carrying Value Adjustment . . . . . . . . . . . — 1 — — — 40 41Unamortized Debt Discount/Premium . . . . . . . . . . . . . . . . — (1 ) (1 ) — — (45 ) (47 )
Subtotal, Duke Energy Corporation Unconsolidated . . . . . 181 7 256 7 117 4,131 4,699
DUKE CAPITAL CORPORATION UNCONSOLIDATEDNotes:a Floating Rate Notes . . . . . . . . . . . . . . . . . . . . . . . . . . . 2003 500 — — — — — 500
4.732% . . . . . . . . . . . . . . . . . . . . . . . . . . . . . . . . . . . . 2003 150 — — — — — 150a Floating Rate Notes . . . . . . . . . . . . . . . . . . . . . . . . . . . 2004 4/16/2003 100.000 — 100 — — — — 1007.25% . . . . . . . . . . . . . . . . . . . . . . . . . . . . . . . . . . . . . 2004 — 500 — — — — 5006.25% Note A . . . . . . . . . . . . . . . . . . . . . . . . . . . . . . . 2005 — — 250 — — — 2504.32% (Component of Equity Units) . . . . . . . . . . . . . . . . 2006 — — — 750 — — 7505.87% (Component of Equity Units) . . . . . . . . . . . . . . . . 2006 — — — 875 — — 8757.50% . . . . . . . . . . . . . . . . . . . . . . . . . . . . . . . . . . . . . 2009 — — — — — 500 5006.25% . . . . . . . . . . . . . . . . . . . . . . . . . . . . . . . . . . . . . 2013 — — — — — 500 5006.75% Note B . . . . . . . . . . . . . . . . . . . . . . . . . . . . . . . 2018 — — — — — 150 1508.0% . . . . . . . . . . . . . . . . . . . . . . . . . . . . . . . . . . . . . 2019 — — — — — 500 5006.75% . . . . . . . . . . . . . . . . . . . . . . . . . . . . . . . . . . . . . 2032 — — — — — 250 250Fair Value Hedge Carrying Value Adjustment . . . . . . . . . . — — — — — 63 63Duke/Fluor Daniel Loan (Floating Rate) . . . . . . . . . . . . . . — — — — — 282 282
Subtotal, Notes . . . . . . . . . . . . . . . . . . . . . . . . . . . . . . 650 600 250 1,625 — 2,245 5,370
Commercial Paper . . . . . . . . . . . . . . . . . . . . . . . . . . . . . . — — — — — 500 500
Subtotal, Duke Capital Corporation Unconsolidated . . . . . 650 600 250 1,625 — 2,745 5,870
a Private Placement
Duke Energy Corporation
LONG-TERM DEBT
P/12 Consolidated Data

P/13
Duke Energy Corporation
LONG-TERM DEBT (CONTINUED)
Redemption Date of Next NextPrice at Redemption Redemption 2008 and
In millions Year Due 12/31/02 (%) Price Change Price (%) 2003 2004 2005 2006 2007 Beyond Total
PANENERGY CORPBonds:
7.750% . . . . . . . . . . . . . . . . . . . . . . . . . . . . . . . . . . . . 2022 103.000 8/15/2003 102.000 — — — — — 328 3288.625% . . . . . . . . . . . . . . . . . . . . . . . . . . . . . . . . . . . . 2025 4/15/2005 104.030 — — — — — 100 100
Notes:a 9.90% . . . . . . . . . . . . . . . . . . . . . . . . . . . . . . . . . . . . . 2003 11 — — — — — 117.375% . . . . . . . . . . . . . . . . . . . . . . . . . . . . . . . . . . . . 2003 100 — — — — — 1007.250% . . . . . . . . . . . . . . . . . . . . . . . . . . . . . . . . . . . . 2005 — — 100 — — — 1007.0% . . . . . . . . . . . . . . . . . . . . . . . . . . . . . . . . . . . . . 2006 — — — 150 — — 150Fair Value Hedge Carrying Value Adjustment . . . . . . . . . . — — — — — 5 5
Subtotal, PanEnergy Corp . . . . . . . . . . . . . . . . . . . . . . . 111 — 100 150 — 433 794
TEXAS EASTERN TRANSMISSIONNotes:
8.250% . . . . . . . . . . . . . . . . . . . . . . . . . . . . . . . . . . . . 2004 — 100 — — — — 1005.250% . . . . . . . . . . . . . . . . . . . . . . . . . . . . . . . . . . . . 2007 — — — — 300 — 3007.30% . . . . . . . . . . . . . . . . . . . . . . . . . . . . . . . . . . . . . 2010 — — — — — 300 300Medium-term, Series A, 7.920% - 9.070% . . . . . . . . . . . 2004-2012 — 15 — — — 20 357.0% . . . . . . . . . . . . . . . . . . . . . . . . . . . . . . . . . . . . . 2032 — — — — — 450 450
Subtotal, Texas Eastern Transmission . . . . . . . . . . . . . . . — 115 — — 300 770 1,185
DUKE ENERGY FIELD SERVICES7.50% . . . . . . . . . . . . . . . . . . . . . . . . . . . . . . . . . . . . . 2005 — — 600 — — — 6005.75% . . . . . . . . . . . . . . . . . . . . . . . . . . . . . . . . . . . . . 2006 — — — 300 — — 3007.875% . . . . . . . . . . . . . . . . . . . . . . . . . . . . . . . . . . . . 2010 — — — — — 800 8006.875% . . . . . . . . . . . . . . . . . . . . . . . . . . . . . . . . . . . . 2011 — — — — — 250 2508.125% . . . . . . . . . . . . . . . . . . . . . . . . . . . . . . . . . . . . 2030 — — — — — 300 300Capitalized Lease . . . . . . . . . . . . . . . . . . . . . . . . . . . . . — — — — — 3 3Fair Value Hedge Carrying Value Adjustment . . . . . . . . . . — — 14 — — — 14
Subtotal, Duke Energy Field Services . . . . . . . . . . . . . . . — — 614 300 — 1,353 2,267
WESTCOAST ENERGY 5.750% MTN Series 6 . . . . . . . . . . . . . . . . . . . . . . . . . 2003 143 — — — — — 1439.70% Series Q . . . . . . . . . . . . . . . . . . . . . . . . . . . . . . 2004 — 95 — — — — 956.450% Series V . . . . . . . . . . . . . . . . . . . . . . . . . . . . . 2006 — — — 79 — — 795.70% MTN Series 5 . . . . . . . . . . . . . . . . . . . . . . . . . . 2008 — — — — — 95 9512.55% Series L . . . . . . . . . . . . . . . . . . . . . . . . . . . . . 2010 — — — — — 63 637.20% MTN Series 7 . . . . . . . . . . . . . . . . . . . . . . . . . . 2010 — — — — — 95 958.30% Series P . . . . . . . . . . . . . . . . . . . . . . . . . . . . . . 2013 — — — — — 63 638.50% Series U . . . . . . . . . . . . . . . . . . . . . . . . . . . . . . 2015 — — — — — 79 798.50% Series O . . . . . . . . . . . . . . . . . . . . . . . . . . . . . . 2018 — — — — — 95 959.90% Series S . . . . . . . . . . . . . . . . . . . . . . . . . . . . . . 2020 — — — — — 63 638.85% Series T . . . . . . . . . . . . . . . . . . . . . . . . . . . . . . 2025 — — — — — 95 958.80% MTN Series 2 . . . . . . . . . . . . . . . . . . . . . . . . . . 2025 — — — — — 16 167.30% Series W . . . . . . . . . . . . . . . . . . . . . . . . . . . . . . 2026 — — — — — 79 796.75% MTN Series 4 . . . . . . . . . . . . . . . . . . . . . . . . . . 2027 — — — — — 95 957.15% MTN Series 8 . . . . . . . . . . . . . . . . . . . . . . . . . . 2031 — — — — — 127 127Capitalized Lease . . . . . . . . . . . . . . . . . . . . . . . . . . . . . 2006 — — — 130 — — 130Other Westcoast Energy Debt . . . . . . . . . . . . . . . . . . . . . — — — — — 25 25
Subtotal, Westcoast Energy . . . . . . . . . . . . . . . . . . . . . . 143 95 — 209 — 990 1,437
a Private Placement
Consolidated Data

P/14
Duke Energy Corporation
LONG-TERM DEBT (CONTINUED)
Redemption Date of Next NextPrice at Redemption Redemption 2008 and
In millions Year Due 12/31/02 (%) Price Change Price (%) 2003 2004 2005 2006 2007 Beyond Total
UNION GAS LIMITED9.75% Series 1994 . . . . . . . . . . . . . . . . . . . . . . . . . . . . 2004 — 79 — — — — 798.85% Series 1995 . . . . . . . . . . . . . . . . . . . . . . . . . . . . 2005 — — 63 — — — 637.80% Series 1996 . . . . . . . . . . . . . . . . . . . . . . . . . . . . 2006 — — — 48 — — 485.19% MTN Series 4 . . . . . . . . . . . . . . . . . . . . . . . . . . 2007 — — — — 127 — 1275.70% MTN Series 1 . . . . . . . . . . . . . . . . . . . . . . . . . . 2008 — — — — — 63 6313.50% Series 1983 . . . . . . . . . . . . . . . . . . . . . . . . . . . 2008 — 1 1 1 1 1 510.75% Series 1989 . . . . . . . . . . . . . . . . . . . . . . . . . . . 2009 2 2 2 2 2 17 277.20% MTN Series 2 . . . . . . . . . . . . . . . . . . . . . . . . . . 2010 — — — — — 117 11711.55% 1988 Series II . . . . . . . . . . . . . . . . . . . . . . . . . 2010 2 2 2 2 3 31 426.65% MTN Series 3 . . . . . . . . . . . . . . . . . . . . . . . . . . 2011 — — — — — 159 15910.625% Series 1989 . . . . . . . . . . . . . . . . . . . . . . . . . . 2011 — — — — — 79 797.90% Series 1994 . . . . . . . . . . . . . . . . . . . . . . . . . . . . 2014 — — — — — 95 9511.50% Series 1990 . . . . . . . . . . . . . . . . . . . . . . . . . . . 2015 — — — — — 95 959.70% 1992 Series II . . . . . . . . . . . . . . . . . . . . . . . . . . 2017 — — — — — 79 798.75% Series 1993 . . . . . . . . . . . . . . . . . . . . . . . . . . . . 2018 — — — — — 79 798.65% Series 1993 . . . . . . . . . . . . . . . . . . . . . . . . . . . . 2018 — — — — — 48 488.65% Series 1995 . . . . . . . . . . . . . . . . . . . . . . . . . . . . 2025 — — — — — 79 79
Subtotal, Union Gas Limited . . . . . . . . . . . . . . . . . . . . . 4 84 68 53 133 942 1,284
MARITIMES & NORTHEAST PIPELINETerm Bank Loans (Floating Rate) . . . . . . . . . . . . . . . . . . 2009 43 46 55 55 56 205 4607.7% . . . . . . . . . . . . . . . . . . . . . . . . . . . . . . . . . . . . . 2019 — — — — — 240 2406.9% . . . . . . . . . . . . . . . . . . . . . . . . . . . . . . . . . . . . . 2019 — — — — — 165 165Other Maritimes & Northeast Pipeline Debt . . . . . . . . . . . 4 2 2 2 1 — 11
Subtotal, Maritimes & Northeast Pipeline . . . . . . . . . . . . 47 48 57 57 57 610 876
DUKE ENERGY NORTH AMERICATerm Loan (Floating Rate) . . . . . . . . . . . . . . . . . . . . . . . 2005 — — 994 — — — 994Capitalized Leases . . . . . . . . . . . . . . . . . . . . . . . . . . . . 2009-2032 13 14 15 15 16 114 187Other Duke Energy North America Debt . . . . . . . . . . . . . 1 1 1 1 1 3 8
Subtotal, Duke Energy North America . . . . . . . . . . . . . . . 14 15 1,010 16 17 117 1,189
INTERNATIONAL ENERGY7.687% - 7.813% Debentures . . . . . . . . . . . . . . . . . . . . 2003 40 — — — — — 407.25% Medium-term Note . . . . . . . . . . . . . . . . . . . . . . . 2004 — 142 — — — — 1422.82% Cash Collateralized Loan . . . . . . . . . . . . . . . . . . . 2004 — 56 — — — — 56Term Bank Revolver (Floating Rate) . . . . . . . . . . . . . . . . 2005 — — 128 — — — 128Project Financing (Floating Rate) . . . . . . . . . . . . . . . . . . 2005 — — 135 — — — 135Senior Unsecured Notes (Floating Rate) . . . . . . . . . . . . . 2008 4 4 4 4 4 2 225.873% - 12.0% Term Loan . . . . . . . . . . . . . . . . . . . . . 2003-2008 1 — — 1 1 1 4Project Debt (Floating Rate) . . . . . . . . . . . . . . . . . . . . . . 2003-2009 46 48 52 37 28 70 281Project Financing (Floating Rate) . . . . . . . . . . . . . . . . . . 2004-2013 5 35 7 8 9 69 1336.0% - 10.0% Notes . . . . . . . . . . . . . . . . . . . . . . . . . . . 2005-2017 18 21 23 25 28 209 324Senior Unsecured Term Loan . . . . . . . . . . . . . . . . . . . . . 2010-2024 2 2 3 3 3 19 32
Subtotal, International Energy . . . . . . . . . . . . . . . . . . . . 116 308 352 78 73 370 1,297a Algonquin Gas Transmission Notes, 5.69% - 9.13% . . . . . 2003-2012 33 — — — — 300 333
Westcoast Power Holdings . . . . . . . . . . . . . . . . . . . . . . . 2006 3 3 3 4 — — 13Market Hub Partners, 8.25% Notes . . . . . . . . . . . . . . . . 2008 — — — — — 27 27Empire State Pipeline Term Loan (Floating Rate) . . . . . . . 2009 9 9 10 10 10 10 58CRI Construction and Mortgage Loans, 2.183% - 14.0% . . 2003-2010 13 28 1 1 13 2 58a East Tennessee Natural Gas, 5.71% Notes . . . . . . . . . . . 2012 — — — — — 150 150Pacific Northern Gas Debentures and Bank Loan . . . . . . . 2011-2027 3 3 3 3 3 45 60Other Debt . . . . . . . . . . . . . . . . . . . . . . . . . . . . . . . . . Various 2 2 2 1 1 1 9DukeNet Communications, Capitalized Lease . . . . . . . . . . — — — — — 1 1Unamortized Debt Discount/Premium . . . . . . . . . . . . . . . — (6 ) 2 (24 ) — (29 ) (57 )
Subtotal, Duke Capital Corporation Consolidated . . . . . . . 1,148 1,304 2,472 2,483 607 8,837 16,851
Consolidated Long-term Debt Scheduled Maturities . . . . . . . $1,329 $1,311 $2,728 $2,490 $724 $12,968 $21,550
a Private Placement
Consolidated Data

P/15
Redemption Date of Next Next .. Years ended December 31 ..
Price at Redemption Redemption 2008 andIn millions Year Due 12/31/02 (%) Price Change Price (%) 2003 2004 2005 2006 2007 Beyond Total
GUARANTEED PREFERRED BENEFICIAL INTERESTSIN SUBORDINATED NOTES OF DUKE ENERGYCORPORATION OR SUBSIDIARIES
Duke Energy Corporation
7.20% Cumulative Quarterly Income
Preferred Securities, Series A . . . . . . . . . . . . . . . . . . . 2037 100.00 $ — $ — $ — $ — $ — $ 350 $ 350
7.20% Cumulative Quarterly Income
Preferred Securities, Series B . . . . . . . . . . . . . . . . . . . 2039 6/30/2004 100.00 — — — — — 250 250
Duke Capital Corporation
7.375% Trust Originated Preferred Securities, Series A . . . 2038 6/30/2003 100.00 — — — — — 250 250
7.375% Cumulative Quarterly Income
Preferred Securities, Series B . . . . . . . . . . . . . . . . . . . 2038 9/30/2003 100.00 — — — — — 350 350
8.375% Cumulative Quarterly Income
Preferred Securities, Series C . . . . . . . . . . . . . . . . . . . 2029 8/31/2004 100.00 — — — — — 250 250
Unamortized issuance costs . . . . . . . . . . . . . . . . . . . . . — — — — — (42) (42)
Total . . . . . . . . . . . . . . . . . . . . . . . . . . . . . . . . . . . . . . — — — — — 1,408 1,408
PREFERRED AND PREFERENCE STOCKWith Sinking Fund Requirements
6.75% Series X, Maturing Serially . . . . . . . . . . . . . . . . . 2003-2015 6/16/2003 103.94 2 2 2 2 2 15 25
Total . . . . . . . . . . . . . . . . . . . . . . . . . . . . . . . . . . . . . . $ 2 $ 2 $ 2 $ 2 $ 2 $ 15 $ 25
Without Sinking Fund Requirements
4.50% Series C . . . . . . . . . . . . . . . . . . . . . . . . . . . . . . Perpetual 101.00 $ 18
7.85% Series S . . . . . . . . . . . . . . . . . . . . . . . . . . . . . . Perpetual 103.93 9/16/2003 103.53 30
7.00% Series W . . . . . . . . . . . . . . . . . . . . . . . . . . . . . . Perpetual 3/16/2003 103.50 25
7.04% Series Y . . . . . . . . . . . . . . . . . . . . . . . . . . . . . . Perpetual 6/16/2003 103.52 30
6.375% Preferred Stock A, 1993 . . . . . . . . . . . . . . . . . . Perpetual 12/16/2003 25.80 31
Total . . . . . . . . . . . . . . . . . . . . . . . . . . . . . . . . . . . . . . 134
Total Preferred and Preference Stock . . . . . . . . . . . . . . . . 159
TOTAL PREFERRED SECURITIES . . . . . . . . . . . . . . . . . $1,567
Duke Energy Corporation
PREFERRED SECURITIES
Consolidated Data

P/16
Duke Energy Corporation
CAPITALIZATION
. . Years ended December 31 . .
In millions 2002 2001 2000 1999 1998 1997
CAPITALIZATION AND CURRENT DEBTShort-Term Debt . . . . . . . . . . . . . . . . . . . . . . . . . . $ 915 2% $ 1,603 5% $ 1,826 6% $ 267 1% $ 209 1% $ 170 1%
Current Maturities and Sinking Funds . . . . . . . . . . . 1,331 3% 274 1% 470 2% 515 2% 707 4% 77 1%
Long-Term Debt . . . . . . . . . . . . . . . . . . . . . . . . . . 20,221 50% 12,321 40% 10,717 40% 8,683 41% 6,272 37% 6,530 43%
Guaranteed Preferred Beneficial Interests in Subordinated Notes of Duke Energy Corporation or Subsidiaries . . . . . . . . . . . . . . . . . . . . . . . . . . 1,408 3% 1,407 5% 1,406 5% 1,404 7% 919 6% 339 2%
Minority Interest . . . . . . . . . . . . . . . . . . . . . . . . . . 1,904 5% 2,246 7% 2,435 9% 1,200 6% 253 2% 168 1%
Preferred and Preference Stock:Preferred & preference stock with
sinking fund requirements . . . . . . . . . . . . . . . . . . 23 25 38 71 104 149Preferred & preference stock without
sinking fund requirements . . . . . . . . . . . . . . . . . . 134 209 209 209 209 340
Total preferred and preference stock . . . . . . . . . . . 157 1% 234 1% 247 1% 280 1% 313 2% 489 3%
Common Stock:Balance at the beginning of year . . . . . . . . . . . . . . 6,217 4,797 4,603 4,449 4,284 4,289Dividend reinvestment and employee benefits . . . . . 342 329 194 154 165 (9)Other capital stock transactions, net . . . . . . . . . . . . 2,677a 1,091a — — — 4
Balance at the end of the year . . . . . . . . . . . . . . . . 9,236 6,217 4,797 4,603 4,449 4,284
Retained Earnings:Balance at the beginning of year . . . . . . . . . . . . . . 6,292 5,379 4,397 3,701 3,256 3,052Net income . . . . . . . . . . . . . . . . . . . . . . . . . . . . . 1,034 1,898 1,776 1,507 1,252 974Common stock dividendsb . . . . . . . . . . . . . . . . . . (905) (973) (809) (802) (794) (682)Preferred and preference stock dividends and
premiums on redemptions . . . . . . . . . . . . . . . . . . (13) (14) (19) (20) (21) (72)Other capital stock transactions, net . . . . . . . . . . . . 9 2 34 11 8 (16)
Balance at the end of the year . . . . . . . . . . . . . . . . 6,417 6,292 5,379 4,397 3,701 3,256
Accumulated Other Comprehensive Income . . . . . . . (709) 180 (120) (2 ) — —
Total Common Stockholders’ Equity . . . . . . . . . . . . 14,944 36% 12,689 41% 10,056 37% 8,998 42% 8,150 48% 7,540 49%
TOTAL CAPITALIZATION . . . . . . . . . . . . . . . . . . . $40,880 100% $30,774 100% $27,157 100% $21,347 100% $16,823 100% $15,313 100%
COVERAGE RATIOSFixed charges - using SEC guidelines . . . . . . . . . . . 2.1 3.8 3.6 2.7 4.5 4.0
a Reflects equity offerings in 2002 and 2001 and the issuance of $1,702 million of stock related to the acquisition of Westcoast in 2002.b Common stock dividends include an equity units contract adjustment.
Consolidated Data

Franchised Electric P/17
FRANCHISED ELECTRIC
2002 AT A GLANCE
EBIT $1,608 million
SALES 83,783 GWh
TOTAL GENERATING CAPABILITY (NET)
Summer 18,438 MW
Winter 18,438 MW
PRINCIPAL OFFICERS
RUTH G. SHAWPresident, Duke Power
MICHAEL S. TUCKMANExecutive Vice President, Nuclear Operations
THEOPOLIS HOLEMANExecutive Vice President, Power Delivery
WILLIAM F. HALL, IIIExecutive Vice President, Fossil and Hydro Operations
SANDRA P. MEYERExecutive Vice President, Customer Service, Sales and Marketing
ELLEN T. RUFFSenior Vice President, Power Policy and Planning
NC
SC
VA
GA
100 Kilovolt
230 Kilovolt
500 Kilovolt
Nuclear
Fossil
Hydro
Combustion Turbine
NC
SC
Electric Lines
Generating Facilities

Franchised ElectricP/18
Franchised Electric
EARNINGS BEFORE INTEREST AND TAXES
. . Years ended December 31 . .
In millions 2002 2001 2000 1999 1998 1997
OPERATING REVENUESGeneration, transmission and distribution of electricity . . . . . . . . . . . . . . . . . . . $4,689 $4,571 $4,789 $4,606 $4,506 $4,334
Other . . . . . . . . . . . . . . . . . . . . . . . . . . . . . . . . . . . . . . . . . . . . . . . . . . . . . . 199 175 157 94 120 67
Total operating revenues . . . . . . . . . . . . . . . . . . . . . . . . . . . . . . . . . . . . . . . . 4,888 4,746 4,946 4,700 4,626 4,401
OPERATING EXPENSESFuel used in electric generation . . . . . . . . . . . . . . . . . . . . . . . . . . . . . . . . . . . 872 818 780 743 754 743
Net interchange and purchased power . . . . . . . . . . . . . . . . . . . . . . . . . . . . . . 347 388 445 359 327 302
Operation and maintenance . . . . . . . . . . . . . . . . . . . . . . . . . . . . . . . . . . . . . . 1,227 1,126 1,145 1,977b 1,288 1,405
Depreciation and amortization . . . . . . . . . . . . . . . . . . . . . . . . . . . . . . . . . . . . 614 588 565 542 522 498
Property and other taxes . . . . . . . . . . . . . . . . . . . . . . . . . . . . . . . . . . . . . . . . 269 265 265 259 259 273
Total operating expenses . . . . . . . . . . . . . . . . . . . . . . . . . . . . . . . . . . . . . . . . 3,329 3,185 3,200 3,880 3,150 3,221
OPERATING INCOME . . . . . . . . . . . . . . . . . . . . . . . . . . . . . . . . . . . . . . . . . 1,559 1,561 1,746 820 1,476 1,180
OTHER INCOME AND EXPENSESDeferred returns and allowance for funds used during construction a . . . . . . . . . 63 65 61 77 85 106
Other income and expenses, net . . . . . . . . . . . . . . . . . . . . . . . . . . . . . . . . . . (14) 5 13 45 30 (4)
Total other income and expenses . . . . . . . . . . . . . . . . . . . . . . . . . . . . . . . . . . 49 70 74 122 115 102
EBIT . . . . . . . . . . . . . . . . . . . . . . . . . . . . . . . . . . . . . . . . . . . . . . . . . . . . . . $1,608 $1,631 $1,820 $942 $1,591 $1,282
a Includes equity allowance for funds used during construction of $39 million for 2002, $22 million for 2001, $11 million for 2000, $11 million for 1999, $10 million for 1998 and $23 million for
1997. Excludes debt allowance for funds used during construction of $18 million for 2002, $10 million for 2001, $6 million for 2000, $6 million for 1999, $7 million for 1998 and $15 million for
1997 which is included in interest expense on the Consolidated Income Statement.b Financial information reflects a pre-tax $800 million charge for estimated injury and damages claims.

Franchised Electric P/19
. . Years ended December 31 . .
In millions 2002 2001 2000 1999 1998 1997
CURRENT ASSETSCash and cash equivalents . . . . . . . . . . . . . . . . . . . . . . . . . . . . . . . . . . . . . . $ 18 $ — $ 30 $ 28 $ 14 $ 13
Receivables . . . . . . . . . . . . . . . . . . . . . . . . . . . . . . . . . . . . . . . . . . . . . . . . 898 — 603 926 733 767
Inventory . . . . . . . . . . . . . . . . . . . . . . . . . . . . . . . . . . . . . . . . . . . . . . . . . . 363 406 318 332 330 258
Other . . . . . . . . . . . . . . . . . . . . . . . . . . . . . . . . . . . . . . . . . . . . . . . . . . . . . 4 226 11 8 108 96
Total current assets . . . . . . . . . . . . . . . . . . . . . . . . . . . . . . . . . . . . . . . . . . . 1,283 632 962 1,294 1,185 1,134
INVESTMENTS AND OTHER ASSETSInvestments and advances in subsidiaries . . . . . . . . . . . . . . . . . . . . . . . . . . . 10,714 10,042 6,450 5,473 4,119 3,403
Nuclear decommissioning trust funds . . . . . . . . . . . . . . . . . . . . . . . . . . . . . . 708 716 717 703 580 471
Unrealized gains on mark-to-market and hedging transactions . . . . . . . . . . . . . 15 9 — — — —
Other . . . . . . . . . . . . . . . . . . . . . . . . . . . . . . . . . . . . . . . . . . . . . . . . . . . . . 12 6 40 109 113 85
Total investments and other assets . . . . . . . . . . . . . . . . . . . . . . . . . . . . . . . . 11,449 10,773 7,207 6,285 4,812 3,959
PROPERTY, PLANT AND EQUIPMENTCost . . . . . . . . . . . . . . . . . . . . . . . . . . . . . . . . . . . . . . . . . . . . . . . . . . . . . . 19,298 18,174 17,357 16,722 16,030 15,665
Accumulated depreciation and amortization . . . . . . . . . . . . . . . . . . . . . . . . . . (8,382) (7,886) (7,516) (6,950) (6,373) (6,068)
Net property, plant and equipment . . . . . . . . . . . . . . . . . . . . . . . . . . . . . . . . 10,916 10,288 9,841 9,772 9,657 9,597
REGULATORY ASSETS AND DEFERRED DEBITSDeferred debt expense . . . . . . . . . . . . . . . . . . . . . . . . . . . . . . . . . . . . . . . . . 195 166 165 181 195 188
Regulatory asset related to income taxes . . . . . . . . . . . . . . . . . . . . . . . . . . . . 383 489 484 488 491 494
Other . . . . . . . . . . . . . . . . . . . . . . . . . . . . . . . . . . . . . . . . . . . . . . . . . . . . . 285 418 671 794 852 990
Total regulatory assets and deferred debits . . . . . . . . . . . . . . . . . . . . . . . . . . . 863 1,073 1,320 1,463 1,538 1,672
TOTAL ASSETS . . . . . . . . . . . . . . . . . . . . . . . . . . . . . . . . . . . . . . . . . . . . . $24,511 $22,766 $19,330 $18,814 $17,192 $16,362
Franchised Electric
BALANCE SHEET - ASSETS

Franchised ElectricP/20
Franchised Electric
BALANCE SHEET - LIABILITIES AND STOCKHOLDERS’ EQUITY
. . Years ended December 31 . .
In millions 2002 2001 2000 1999 1998 1997
CURRENT LIABILITIESAccounts payable . . . . . . . . . . . . . . . . . . . . . . . . . . . . . . . . . . . . . . . . . . . . . . . $ 505 $ 1,872 $ 502 $ 437 $ 490 $ 401
Notes payable and commercial paper . . . . . . . . . . . . . . . . . . . . . . . . . . . . . . . . . 238 143 280 489 185 32
Taxes accrued . . . . . . . . . . . . . . . . . . . . . . . . . . . . . . . . . . . . . . . . . . . . . . . . . . 217 353 (102) (54) (40) 5
Interest accrued . . . . . . . . . . . . . . . . . . . . . . . . . . . . . . . . . . . . . . . . . . . . . . . . 75 49 63 58 52 61
Current maturities of long-term debt and preferred stock . . . . . . . . . . . . . . . . . . . . 6 7 1 36 450 55
Other . . . . . . . . . . . . . . . . . . . . . . . . . . . . . . . . . . . . . . . . . . . . . . . . . . . . . . . . 168 297 170 156 177 200
Total current liabilities . . . . . . . . . . . . . . . . . . . . . . . . . . . . . . . . . . . . . . . . . . . . 1,209 2,721 914 1,122 1,314 754
LONG-TERM DEBT . . . . . . . . . . . . . . . . . . . . . . . . . . . . . . . . . . . . . . . . . . . . . 4,703 3,208 3,987 3,572 3,391 3,611
DEFERRED CREDITS AND OTHER LIABILITIESDeferred income taxes . . . . . . . . . . . . . . . . . . . . . . . . . . . . . . . . . . . . . . . . . . . . 1,581 2,079 2,117 1,928 2,268 2,337
Investment tax credit . . . . . . . . . . . . . . . . . . . . . . . . . . . . . . . . . . . . . . . . . . . . . 175 187 205 217 228 239
Nuclear decommissioning costs externally funded . . . . . . . . . . . . . . . . . . . . . . . . . 708 716 717 703 580 471
Unrealized losses on mark-to-market and hedging transactions . . . . . . . . . . . . . . . 10 14 — — — —
Other . . . . . . . . . . . . . . . . . . . . . . . . . . . . . . . . . . . . . . . . . . . . . . . . . . . . . . . . 579 551 733 1,413 609 582
Total deferred credits and other liabilities . . . . . . . . . . . . . . . . . . . . . . . . . . . . . . . 3,053 3,547 3,772 4,261 3,685 3,629
GUARANTEED PREFERRED BENEFICIAL INTERESTS IN SUBORDINATEDNOTES OF DUKE ENERGY CORPORATION OR SUBSIDIARIES . . . . . . . . . . . . . 602 601 601 581 339 339
PREFERRED AND PREFERENCE STOCKPreferred and preference stock with sinking fund requirements . . . . . . . . . . . . . . . — — — 71 104 149
Preferred and preference stock without sinking fund requirements . . . . . . . . . . . . . — — — 209 209 340
Total preferred and preference stock . . . . . . . . . . . . . . . . . . . . . . . . . . . . . . . . . . — — — 280 313 489
COMMON STOCKHOLDERS’ EQUITYCommon stock . . . . . . . . . . . . . . . . . . . . . . . . . . . . . . . . . . . . . . . . . . . . . . . . . 9,236 6,217 4,797 4,603 4,449 4,284
Retained earnings . . . . . . . . . . . . . . . . . . . . . . . . . . . . . . . . . . . . . . . . . . . . . . . 5,708 6,472 5,259 4,395 3,701 3,256
Total common stockholders’ equity . . . . . . . . . . . . . . . . . . . . . . . . . . . . . . . . . . . 14,944 12,689 10,056 8,998 8,150 7,540
TOTAL LIABILITIES AND STOCKHOLDERS’ EQUITY . . . . . . . . . . . . . . . . . . . . . $24,511 $22,766 $19,330 $18,814 $17,192 $16,362

P/21
. . Years ended December 31 . .
2002 2001 2000 1999 1998 1997a
SOURCES OF ELECTRIC ENERGY (GWH)Generated - net output:
Coal . . . . . . . . . . . . . . . . . . . . . . . . . . . . . . . . . . . . . . . . 43,561 41,796 43,526 41,306 42,164 45,234Nuclear . . . . . . . . . . . . . . . . . . . . . . . . . . . . . . . . . . . . . . 41,155 39,922 41,073 39,263 38,366 29,569Hydro . . . . . . . . . . . . . . . . . . . . . . . . . . . . . . . . . . . . . . . 317 224 394 638 1,714 1,633Oil & gas . . . . . . . . . . . . . . . . . . . . . . . . . . . . . . . . . . . . . 98 139 459 662 846 301
Total generation . . . . . . . . . . . . . . . . . . . . . . . . . . . . . . . . . 85,131 82,081 85,452 81,869 83,090 76,737Purchased power and net interchange . . . . . . . . . . . . . . . . . . 4,102 3,050 4,497 3,617 2,659 3,781
Total output . . . . . . . . . . . . . . . . . . . . . . . . . . . . . . . . . . . . 89,233 85,131 89,949 85,486 85,749 80,518Plus: Purchases from other Catawba joint owners . . . . . . . . . . — — 150 1,233 1,656 2,316
Total sources of energy . . . . . . . . . . . . . . . . . . . . . . . . . . . . 89,233 85,131 90,099 86,719 87,405 82,834Less: Line loss and company usage . . . . . . . . . . . . . . . . . . . . 5,450 5,446 5,333 5,171 5,394 4,899
TOTAL GWH SOURCES . . . . . . . . . . . . . . . . . . . . . . . . . . . 83,783 79,685 84,766 81,548 82,011 77,935
ELECTRIC ENERGY SALES (GWH)Residential . . . . . . . . . . . . . . . . . . . . . . . . . . . . . . . . . . . . . 24,466 23,272 22,884 21,897 22,002 20,483General service . . . . . . . . . . . . . . . . . . . . . . . . . . . . . . . . . . 24,242 23,666 22,845 21,807 21,093 19,687Industrial:
Textile . . . . . . . . . . . . . . . . . . . . . . . . . . . . . . . . . . . . . . . 8,443 8,829 10,819 11,201 11,981 11,955Other . . . . . . . . . . . . . . . . . . . . . . . . . . . . . . . . . . . . . . . . 17,816 18,074 18,952 18,704 18,668 18,376
Other energy and wholesale . . . . . . . . . . . . . . . . . . . . . . . . . 8,706 6,979 8,671 7,715 8,933 7,029
Total GWh sales billed . . . . . . . . . . . . . . . . . . . . . . . . . . . . . 83,673 80,820 84,171 81,324 82,677 77,530Unbilled GWh sales . . . . . . . . . . . . . . . . . . . . . . . . . . . . . . . 110 (1,135) 595 224 (666) 405
TOTAL GWH SALES . . . . . . . . . . . . . . . . . . . . . . . . . . . . . . 83,783 79,685 84,766 81,548 82,011 77,935
Total Capability - Net MW(time of peak)
Summer . . . . . . . . . . . . . . . . . . . . . . . . . . . . . . . . . . . . . . 18,438 17,912 18,246 17,487 17,134 17,199Winter . . . . . . . . . . . . . . . . . . . . . . . . . . . . . . . . . . . . . . . 18,438 17,912 18,246 17,487 17,134 17,233
Peak Load - MWb
Summer . . . . . . . . . . . . . . . . . . . . . . . . . . . . . . . . . . . . . . 16,724 16,165 16,786 16,372 15,812 15,346Winter . . . . . . . . . . . . . . . . . . . . . . . . . . . . . . . . . . . . . . . 13,666 12,863 14,655 14,354 13,022 13,754
Nuclear Capacity Factor (%)c . . . . . . . . . . . . . . . . . . . . . . . . 95 92 92 90 88 73
System Load Factor (%)b . . . . . . . . . . . . . . . . . . . . . . . . . . . 57 57 58 57 59 59
a Prior year amounts have been restated to include Nantahala Power and Light.b Excludes the portion of the demand of the other joint owners of the Catawba Nuclear Station met by their retained ownership.c Includes 100% of Catawba.
Franchised Electric
OPERATING STATISTICS
Franchised Electric

P/22 Franchised Electric
Franchised Electric
OPERATING STATISTICS
. . Years ended December 31 . .
2002 2001 2000 1999 1998 1997
REVENUES FROM GENERATION, TRANSMISSION AND DISTRIBUTION OF ELECTRICITY (IN MILLIONS)
Residential revenues . . . . . . . . . . . . . . . . . . . . . . . . . . . . . . . . . . . . . . . . . $1,794 $1,700 $1,663 $1,588 $1,596 $1,491
General service revenues . . . . . . . . . . . . . . . . . . . . . . . . . . . . . . . . . . . . . . 1,430 1,386 1,330 1,267 1,224 1,161
Industrial revenues:
Textile revenues . . . . . . . . . . . . . . . . . . . . . . . . . . . . . . . . . . . . . . . . . . . . 335 353 419 428 456 457
Other revenues . . . . . . . . . . . . . . . . . . . . . . . . . . . . . . . . . . . . . . . . . . . . 751 759 787 772 771 766
Other energy and wholesale revenues . . . . . . . . . . . . . . . . . . . . . . . . . . . . . . 343 367 445 474 451 348
Total revenues billed . . . . . . . . . . . . . . . . . . . . . . . . . . . . . . . . . . . . . . . . . 4,653 4,565 4,644 4,529 4,498 4,223
Unbilled revenues . . . . . . . . . . . . . . . . . . . . . . . . . . . . . . . . . . . . . . . . . . . 8 (66) 37 14 (38) 22
Other electric revenues . . . . . . . . . . . . . . . . . . . . . . . . . . . . . . . . . . . . . . . . 28 72 108 63 46 89
TOTAL REVENUES FROM GENERATION, TRANSMISSIONAND DISTRIBUTION OF ELECTRICITY . . . . . . . . . . . . . . . . . . . . . . . . . . . $4,689 $4,571 $4,789 $4,606 $4,506 $4,334
AVERAGE NUMBER OF CUSTOMERS (IN THOUSANDS)Residential . . . . . . . . . . . . . . . . . . . . . . . . . . . . . . . . . . . . . . . . . . . . . . . . 1,846 1,803 1,764 1,722 1,678 1,637
General service . . . . . . . . . . . . . . . . . . . . . . . . . . . . . . . . . . . . . . . . . . . . . 304 295 290 283 272 264
Industrial:
Textile . . . . . . . . . . . . . . . . . . . . . . . . . . . . . . . . . . . . . . . . . . . . . . . . . . . 1 1 1 1 1 1
Other . . . . . . . . . . . . . . . . . . . . . . . . . . . . . . . . . . . . . . . . . . . . . . . . . . . 7 7 7 7 8 8
Total industrial . . . . . . . . . . . . . . . . . . . . . . . . . . . . . . . . . . . . . . . . . . . . 8 8 8 8 9 9
Other energy . . . . . . . . . . . . . . . . . . . . . . . . . . . . . . . . . . . . . . . . . . . . . . . 11 11 10 10 9 9
TOTAL AVERAGE NUMBER OF CUSTOMERS . . . . . . . . . . . . . . . . . . . . . . 2,169 2,117 2,072 2,023 1,968 1,919

P/23Natural Gas Transmission
NATURAL GAS TRANSMISSION
2002 AT A GLANCE
EBIT $1,174 million
MARKET TRANSPORTS 2,891 TBtu
SUPPLY TRANSPORTS 269 TBtu
PRINCIPAL OFFICERS
THOMAS C. O’CONNORPresident, Duke Energy Gas Transmission
ALAN N. HARRISExecutive Vice President, Duke Energy Gas Transmission
GREGORY J. RIZZOExecutive Vice President, Duke Energy Gas Transmission
DOROTHY M. ABLESSenior Vice President and Chief Financial Officer
RICHARD J. KRUSESenior Vice PresidentIndustry Initiatives, Pricing and Regulatory Affairs
90˚W1
U. S. A.
Texas Eastern
Gulfstream
Charlotte
East Tennessee
Maritimes & NE
Algonquin
Patriot Ext.
PNG
Alliance
Foothills
BCPipeline
Union Gas
Union Gas Service Area
Vector
Aux Sable
Corporate HeadquartersStorageProposedMHPBC ProcessingUnion Gas Service Area
Empire
P/24 Natural Gas Transmission
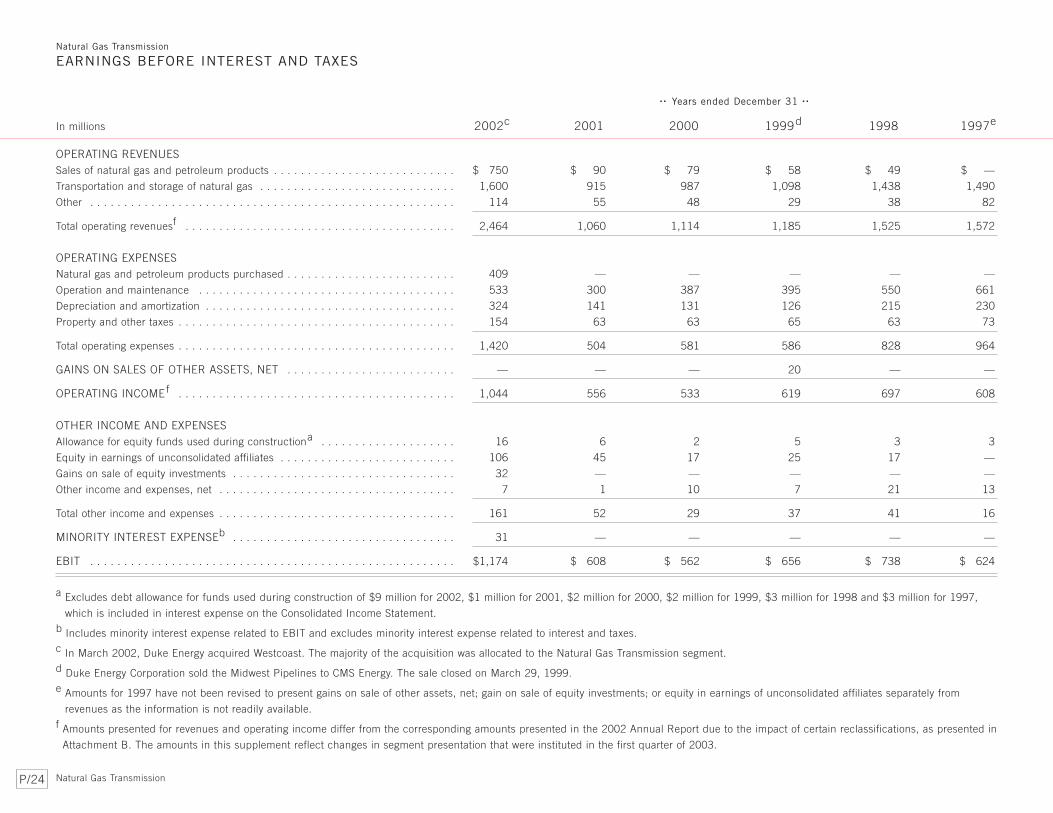
Natural Gas Transmission
EARNINGS BEFORE INTEREST AND TAXES
. . Years ended December 31 . .
In millions 2002c 2001 2000 1999d 1998 1997e
OPERATING REVENUESSales of natural gas and petroleum products . . . . . . . . . . . . . . . . . . . . . . . . . . . $ 750 $ 90 $ 79 $ 58 $ 49 $ —
Transportation and storage of natural gas . . . . . . . . . . . . . . . . . . . . . . . . . . . . . 1,600 915 987 1,098 1,438 1,490
Other . . . . . . . . . . . . . . . . . . . . . . . . . . . . . . . . . . . . . . . . . . . . . . . . . . . . . . 114 55 48 29 38 82
Total operating revenuesf . . . . . . . . . . . . . . . . . . . . . . . . . . . . . . . . . . . . . . . . 2,464 1,060 1,114 1,185 1,525 1,572
OPERATING EXPENSESNatural gas and petroleum products purchased . . . . . . . . . . . . . . . . . . . . . . . . . 409 — — — — —
Operation and maintenance . . . . . . . . . . . . . . . . . . . . . . . . . . . . . . . . . . . . . . 533 300 387 395 550 661
Depreciation and amortization . . . . . . . . . . . . . . . . . . . . . . . . . . . . . . . . . . . . . 324 141 131 126 215 230
Property and other taxes . . . . . . . . . . . . . . . . . . . . . . . . . . . . . . . . . . . . . . . . . 154 63 63 65 63 73
Total operating expenses . . . . . . . . . . . . . . . . . . . . . . . . . . . . . . . . . . . . . . . . . 1,420 504 581 586 828 964
GAINS ON SALES OF OTHER ASSETS, NET . . . . . . . . . . . . . . . . . . . . . . . . . — — — 20 — —
OPERATING INCOME f . . . . . . . . . . . . . . . . . . . . . . . . . . . . . . . . . . . . . . . . . 1,044 556 533 619 697 608
OTHER INCOME AND EXPENSESAllowance for equity funds used during constructiona . . . . . . . . . . . . . . . . . . . . 16 6 2 5 3 3
Equity in earnings of unconsolidated affiliates . . . . . . . . . . . . . . . . . . . . . . . . . . 106 45 17 25 17 —
Gains on sale of equity investments . . . . . . . . . . . . . . . . . . . . . . . . . . . . . . . . . 32 — — — — —
Other income and expenses, net . . . . . . . . . . . . . . . . . . . . . . . . . . . . . . . . . . . 7 1 10 7 21 13
Total other income and expenses . . . . . . . . . . . . . . . . . . . . . . . . . . . . . . . . . . . 161 52 29 37 41 16
MINORITY INTEREST EXPENSEb . . . . . . . . . . . . . . . . . . . . . . . . . . . . . . . . . 31 — — — — —
EBIT . . . . . . . . . . . . . . . . . . . . . . . . . . . . . . . . . . . . . . . . . . . . . . . . . . . . . . $1,174 $ 608 $ 562 $ 656 $ 738 $ 624
a Excludes debt allowance for funds used during construction of $9 million for 2002, $1 million for 2001, $2 million for 2000, $2 million for 1999, $3 million for 1998 and $3 million for 1997,
which is included in interest expense on the Consolidated Income Statement.b Includes minority interest expense related to EBIT and excludes minority interest expense related to interest and taxes.c In March 2002, Duke Energy acquired Westcoast. The majority of the acquisition was allocated to the Natural Gas Transmission segment.d Duke Energy Corporation sold the Midwest Pipelines to CMS Energy. The sale closed on March 29, 1999.e Amounts for 1997 have not been revised to present gains on sale of other assets, net; gain on sale of equity investments; or equity in earnings of unconsolidated affiliates separately from
revenues as the information is not readily available.f Amounts presented for revenues and operating income differ from the corresponding amounts presented in the 2002 Annual Report due to the impact of certain reclassifications, as presented in
Attachment B. The amounts in this supplement reflect changes in segment presentation that were instituted in the first quarter of 2003.
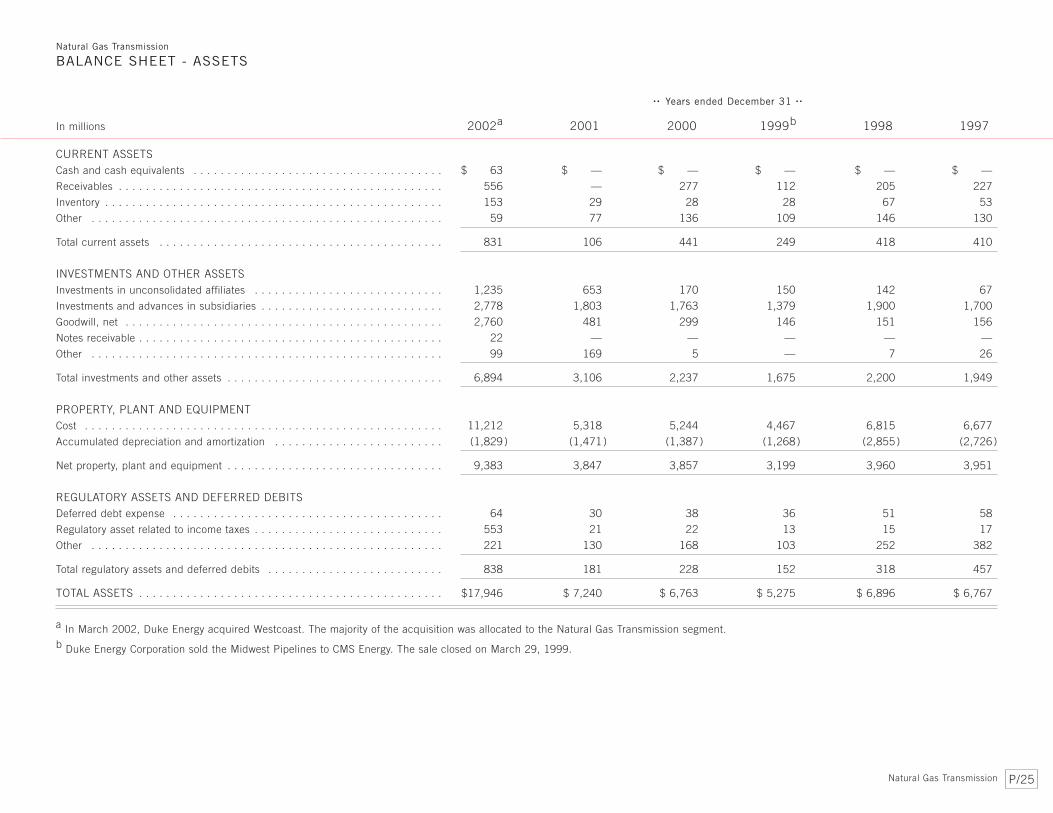
P/25Natural Gas Transmission
. . Years ended December 31 . .
In millions 2002a 2001 2000 1999b 1998 1997
CURRENT ASSETSCash and cash equivalents . . . . . . . . . . . . . . . . . . . . . . . . . . . . . . . . . . . . . $ 63 $ — $ — $ — $ — $ —
Receivables . . . . . . . . . . . . . . . . . . . . . . . . . . . . . . . . . . . . . . . . . . . . . . . . 556 — 277 112 205 227
Inventory . . . . . . . . . . . . . . . . . . . . . . . . . . . . . . . . . . . . . . . . . . . . . . . . . . 153 29 28 28 67 53
Other . . . . . . . . . . . . . . . . . . . . . . . . . . . . . . . . . . . . . . . . . . . . . . . . . . . . 59 77 136 109 146 130
Total current assets . . . . . . . . . . . . . . . . . . . . . . . . . . . . . . . . . . . . . . . . . . 831 106 441 249 418 410
INVESTMENTS AND OTHER ASSETSInvestments in unconsolidated affiliates . . . . . . . . . . . . . . . . . . . . . . . . . . . . 1,235 653 170 150 142 67
Investments and advances in subsidiaries . . . . . . . . . . . . . . . . . . . . . . . . . . . 2,778 1,803 1,763 1,379 1,900 1,700
Goodwill, net . . . . . . . . . . . . . . . . . . . . . . . . . . . . . . . . . . . . . . . . . . . . . . . 2,760 481 299 146 151 156
Notes receivable . . . . . . . . . . . . . . . . . . . . . . . . . . . . . . . . . . . . . . . . . . . . . 22 — — — — —
Other . . . . . . . . . . . . . . . . . . . . . . . . . . . . . . . . . . . . . . . . . . . . . . . . . . . . 99 169 5 — 7 26
Total investments and other assets . . . . . . . . . . . . . . . . . . . . . . . . . . . . . . . . 6,894 3,106 2,237 1,675 2,200 1,949
PROPERTY, PLANT AND EQUIPMENTCost . . . . . . . . . . . . . . . . . . . . . . . . . . . . . . . . . . . . . . . . . . . . . . . . . . . . . 11,212 5,318 5,244 4,467 6,815 6,677
Accumulated depreciation and amortization . . . . . . . . . . . . . . . . . . . . . . . . . (1,829) (1,471) (1,387) (1,268) (2,855) (2,726)
Net property, plant and equipment . . . . . . . . . . . . . . . . . . . . . . . . . . . . . . . . 9,383 3,847 3,857 3,199 3,960 3,951
REGULATORY ASSETS AND DEFERRED DEBITSDeferred debt expense . . . . . . . . . . . . . . . . . . . . . . . . . . . . . . . . . . . . . . . . 64 30 38 36 51 58
Regulatory asset related to income taxes . . . . . . . . . . . . . . . . . . . . . . . . . . . . 553 21 22 13 15 17
Other . . . . . . . . . . . . . . . . . . . . . . . . . . . . . . . . . . . . . . . . . . . . . . . . . . . . 221 130 168 103 252 382
Total regulatory assets and deferred debits . . . . . . . . . . . . . . . . . . . . . . . . . . 838 181 228 152 318 457
TOTAL ASSETS . . . . . . . . . . . . . . . . . . . . . . . . . . . . . . . . . . . . . . . . . . . . . $17,946 $ 7,240 $ 6,763 $ 5,275 $ 6,896 $ 6,767
a In March 2002, Duke Energy acquired Westcoast. The majority of the acquisition was allocated to the Natural Gas Transmission segment.b Duke Energy Corporation sold the Midwest Pipelines to CMS Energy. The sale closed on March 29, 1999.
Natural Gas Transmission
BALANCE SHEET - ASSETS

P/26
Natural Gas Transmission
BALANCE SHEET - LIABILITIES AND STOCKHOLDERS’ EQUITY
. . Years ended December 31 . .
In millions 2002a 2001 2000 1999b 1998 1997
CURRENT LIABILITIESAccounts payable . . . . . . . . . . . . . . . . . . . . . . . . . . . . . . . . . . . . . . . . . . . . . $ 159 $ 270 $ 16 $ 12 $ 21 $ 56
Notes payable and commercial paper . . . . . . . . . . . . . . . . . . . . . . . . . . . . . . . 181 — — — 675 675
Taxes accrued . . . . . . . . . . . . . . . . . . . . . . . . . . . . . . . . . . . . . . . . . . . . . . . 450 325 218 197 210 197
Interest accrued . . . . . . . . . . . . . . . . . . . . . . . . . . . . . . . . . . . . . . . . . . . . . . 84 13 18 18 27 27
Current maturities of long-term debt . . . . . . . . . . . . . . . . . . . . . . . . . . . . . . . . 238 134 185 200 49 —
Unrealized losses on mark-to-market and hedging transactions . . . . . . . . . . . . . 13 — — — — —
Other . . . . . . . . . . . . . . . . . . . . . . . . . . . . . . . . . . . . . . . . . . . . . . . . . . . . . 324 129 258 76 201 265
Total current liabilities . . . . . . . . . . . . . . . . . . . . . . . . . . . . . . . . . . . . . . . . . . 1,449 871 695 503 1,183 1,220
LONG-TERM DEBT . . . . . . . . . . . . . . . . . . . . . . . . . . . . . . . . . . . . . . . . . . . 7,222 2,321 2,447 1,109 1,570 1,619
DEFERRED CREDITS AND OTHER LIABILITIESDeferred income taxes . . . . . . . . . . . . . . . . . . . . . . . . . . . . . . . . . . . . . . . . . 1,474 829 759 732 803 769
Investment tax credit . . . . . . . . . . . . . . . . . . . . . . . . . . . . . . . . . . . . . . . . . . 1 2 5 9 14 18
Unrealized losses on mark-to-market and hedging transactions . . . . . . . . . . . . . 9 — — — — —
Other . . . . . . . . . . . . . . . . . . . . . . . . . . . . . . . . . . . . . . . . . . . . . . . . . . . . . 622 213 206 210 333 425
Total deferred credits and other liabilities . . . . . . . . . . . . . . . . . . . . . . . . . . . . 2,106 1,044 970 951 1,150 1,212
MINORITY INTERESTS . . . . . . . . . . . . . . . . . . . . . . . . . . . . . . . . . . . . . . . . 560 — — — — —
COMMON STOCKHOLDERS’ EQUITYCommon stock . . . . . . . . . . . . . . . . . . . . . . . . . . . . . . . . . . . . . . . . . . . . . . . 3 — — — 16 16
Additional paid-in capital . . . . . . . . . . . . . . . . . . . . . . . . . . . . . . . . . . . . . . . . 4,904 1,835 1,681 1,394 2,089 2,089
Retained earnings . . . . . . . . . . . . . . . . . . . . . . . . . . . . . . . . . . . . . . . . . . . . 1,696 1,169 970 1,318 888 611
Accumulated other comprehensive income . . . . . . . . . . . . . . . . . . . . . . . . . . . 6 — — — — —
Total common stockholders’ equity . . . . . . . . . . . . . . . . . . . . . . . . . . . . . . . . . 6,609 3,004 2,651 2,712 2,993 2,716
TOTAL LIABILITIES AND STOCKHOLDERS’ EQUITY . . . . . . . . . . . . . . . . . . . $17,946 $7,240 $6,763 $5,275 $6,896 $6,767
a In March 2002, Duke Energy acquired Westcoast. The majority of the acquisition was allocated to the Natural Gas Transmission segment.b Duke Energy Corporation sold the Midwest Pipelines to CMS Energy. The sale closed on March 29, 1999.
Natural Gas Transmission

P/27
. . Years ended December 31 . .
Trillion British thermal units (TBtu) 2002 2001 2000 1999 1998 1997
Market-Area Transports a . . . . . . . . . . . . . . . . . . . . . . . . . . . . . . . . . . . . . . . . 2,891 1,509 1,492 1,623 2,203 2,511
Supply-Area Transports b . . . . . . . . . . . . . . . . . . . . . . . . . . . . . . . . . . . . . . . . 269 272 279 270 390 351
Total Deliveries . . . . . . . . . . . . . . . . . . . . . . . . . . . . . . . . . . . . . . . . . . . . . . . 3,160 1,781 1,771 1,893 2,593 2,862
a Natural gas deliveries include the Midwest Pipelines, which were sold to CMS Energy on March 29, 1999.Market-area transports for the Midwest Pipelines were 295 TBtu for 1999, 962 TBtu for
1998 and 1,119 TBtu for1997. Intercompany eliminations for market-area transports were 7 TBtu for 1998 and 58 TBtu for 1997.
b Supply-area transports for the Midwest Pipelines were 33 TBtu for 1999, 179 TBtu for 1998 and 160 TBtu for 1997.
Natural Gas Transmission
OPERATING STATISTICS
Natural Gas Transmission

P/28 Field Services
FIELD SERVICES
2-8"2-8"2-6"2-6"8",6"8",6"3"3"
6",10"6",10"
3"3"
4"4"4"4"
8"8"
4"4"
4"4"
2-8"2-8"2-6"2-6"8",6"8",6"3"3"
6",10"6",10"
3"3"
4"4"4"4"
8"8" TX
AR
KS
NE
MSAL
NM
WYSD
NDMT
ID
ALBERTABRITISH
COLUMBIA
SASKATCHEWAN
UT
CO Denver
Calgary
Houston
Midland
KS
LA
Tulsa
Offices
NGL Terminals
Operating Areas
Duke EnergyField Services
2002 AT A GLANCE
EBIT $126 million
NATURAL GAS GATHERED/PROCESSED 8.3 TBtu/d
NATURAL GAS MARKETED 1.6 TBtu/d
NGL PRODUCTION 391.9 MBbl/d
PRINCIPAL OFFICERS
JIMMY W. MOGGChairman, President and Chief Executive Officer, Duke Energy Field Services
WILLIAM W. SLAUGHTERExecutive Vice President
MARK A. BORERExecutive Vice President, Marketing and Corporate Development
MICHAEL J. BRADLEYExecutive Vice President, Gathering and Processing
ROBERT F. MARTINOVICHSenior Vice President, Northern Division
BARRY R. PEARLPresident and Chief Operating Officer, TEPPCO

P/29Field Services
. . Years ended December 31 . .
In millions 2002 2001 2000b 1999 1998 1997c
OPERATING REVENUESSales of natural gas and petroleum products . . . . . . . . . . . . . . . . . . . . . . . . . . $5,212 $7,702 $5,984 $2,232 $1,200 $1,320
Transportation and storage of natural gas . . . . . . . . . . . . . . . . . . . . . . . . . . . . 126 92 78 77 58 54
Trading and marketing net margin . . . . . . . . . . . . . . . . . . . . . . . . . . . . . . . . . 18 48 15 15 8 5
Other . . . . . . . . . . . . . . . . . . . . . . . . . . . . . . . . . . . . . . . . . . . . . . . . . . . . . . 110 191 49 33 83 80
Total operating revenuesd . . . . . . . . . . . . . . . . . . . . . . . . . . . . . . . . . . . . . . . 5,466 8,033 6,126 2,357 1,349 1,459
OPERATING EXPENSESNatural gas and petroleum products purchased . . . . . . . . . . . . . . . . . . . . . . . . 4,429 6,787 4,980 1,868 1,058 1,074
Operation and maintenance . . . . . . . . . . . . . . . . . . . . . . . . . . . . . . . . . . . . . . 591 464 467 227 154 144
Depreciation and amortization . . . . . . . . . . . . . . . . . . . . . . . . . . . . . . . . . . . . 299 285 240 131 80 71
Property and other taxes . . . . . . . . . . . . . . . . . . . . . . . . . . . . . . . . . . . . . . . . 46 45 38 17 15 13
Total operating expenses . . . . . . . . . . . . . . . . . . . . . . . . . . . . . . . . . . . . . . . . 5,365 7,581 5,725 2,243 1,307 1,302
GAINS ON SALES OF OTHER ASSETS . . . . . . . . . . . . . . . . . . . . . . . . . . . . . — — — — 34 —
OPERATING INCOME d . . . . . . . . . . . . . . . . . . . . . . . . . . . . . . . . . . . . . . . . 101 452 401 114 76 157
OTHER INCOME AND EXPENSESEquity in earnings of unconsolidated affiliates . . . . . . . . . . . . . . . . . . . . . . . . . 60 45 39 44 9 —
Other income and expenses, net . . . . . . . . . . . . . . . . . . . . . . . . . . . . . . . . . . 1 1 6 (2) (3 ) —
Total other income and expenses . . . . . . . . . . . . . . . . . . . . . . . . . . . . . . . . . . 61 46 45 42 6 —
MINORITY INTEREST EXPENSE a . . . . . . . . . . . . . . . . . . . . . . . . . . . . . . . . 36 162 135 — — —
EBIT . . . . . . . . . . . . . . . . . . . . . . . . . . . . . . . . . . . . . . . . . . . . . . . . . . . . . . $ 126 $ 336 $ 311 $ 156 $ 82 $ 157
a Includes minority interest expense related to EBIT and excludes minority interest expense related to interest and taxes.b In March 2000, Duke Energy completed the combination of Field Services’ natural gas gathering, processing and marketing business with Phillips Petroleum’s gas gathering, processing and
marketing unit’s midstream natural gas business.c Amounts for 1997 have not been revised to present gains on sale of other assets, net, or equity in earnings of unconsolidated affiliates separately from revenues as the information is not
readily available.d Amounts presented for revenues and operating income differ from the corresponding amounts presented in the 2002 Annual Report due to the impact of certain reclassifications, as presented
in Attachment B. The amounts in this supplement reflect changes in segment presentation that were instituted in the first quarter of 2003.
Field Services
EARNINGS BEFORE INTEREST AND TAXES

P/30
Field Services
BALANCE SHEET - ASSETS
. . Years ended December 31 . .
In millions 2002 2001 2000 1999 1998 1997
CURRENT ASSETSCash and cash equivalents . . . . . . . . . . . . . . . . . . . . . . . . . . . . . . . . . . . . . $ 8 $ — $ 8 $ 1 $ 1 $ —
Receivables . . . . . . . . . . . . . . . . . . . . . . . . . . . . . . . . . . . . . . . . . . . . . . . . 845 911 893 544 756 515
Inventory . . . . . . . . . . . . . . . . . . . . . . . . . . . . . . . . . . . . . . . . . . . . . . . . . . 86 83 99 40 24 32
Unrealized gains on mark-to-market and hedging transactions . . . . . . . . . . . . 209 244 — — — —
Other . . . . . . . . . . . . . . . . . . . . . . . . . . . . . . . . . . . . . . . . . . . . . . . . . . . . 45 113 41 30 20 19
Total current assets . . . . . . . . . . . . . . . . . . . . . . . . . . . . . . . . . . . . . . . . . . 1,193 1,351 1,041 615 801 566
INVESTMENTS AND OTHER ASSETSInvestments in unconsolidated affiliates . . . . . . . . . . . . . . . . . . . . . . . . . . . . 290 252 373 440 303 160
Investments and advances in subsidiaries . . . . . . . . . . . . . . . . . . . . . . . . . . . (277 ) (573) 344 370 334 231
Goodwill, net . . . . . . . . . . . . . . . . . . . . . . . . . . . . . . . . . . . . . . . . . . . . . . . 481 571 507 85 15 17
Notes receivable . . . . . . . . . . . . . . . . . . . . . . . . . . . . . . . . . . . . . . . . . . . . 2 64 22 9 10 6
Unrealized gains on mark-to-market and hedging transactions . . . . . . . . . . . . 47 64 — — — —
Other . . . . . . . . . . . . . . . . . . . . . . . . . . . . . . . . . . . . . . . . . . . . . . . . . . . . 172 177 164 107 5 (12)
Total investments and other assets . . . . . . . . . . . . . . . . . . . . . . . . . . . . . . . . 715 555 1,410 1,011 667 402
PROPERTY, PLANT AND EQUIPMENTCost . . . . . . . . . . . . . . . . . . . . . . . . . . . . . . . . . . . . . . . . . . . . . . . . . . . . . 6,019 5,788 4,969 3,030 1,764 1,656
Accumulated depreciation and amortization . . . . . . . . . . . . . . . . . . . . . . . . . (1,377 ) (1,096) (809) (596) (480) (422)
Net property, plant and equipment . . . . . . . . . . . . . . . . . . . . . . . . . . . . . . . . 4,642 4,692 4,160 2,434 1,284 1,234
REGULATORY ASSETS AND DEFERRED DEBITSOther . . . . . . . . . . . . . . . . . . . . . . . . . . . . . . . . . . . . . . . . . . . . . . . . . . . . — 2 — — — 8
Total regulatory assets and deferred debits . . . . . . . . . . . . . . . . . . . . . . . . . . — 2 — — — 8
TOTAL ASSETS . . . . . . . . . . . . . . . . . . . . . . . . . . . . . . . . . . . . . . . . . . . . . $ 6,550 $ 6,600 $6,611 $4,060 $2,752 $2,210
Field Services

P/31
. . Years ended December 31 . .
In millions 2002 2001 2000 1999 1998 1997
CURRENT LIABILITIESAccounts payable . . . . . . . . . . . . . . . . . . . . . . . . . . . . . . . . . . . . . . . . . . . . $ 679 $ 676 $ 986 $ 435 $ 210 $ 357
Notes payable and commercial paper . . . . . . . . . . . . . . . . . . . . . . . . . . . . . . 232 213 346 — — —
Taxes accrued . . . . . . . . . . . . . . . . . . . . . . . . . . . . . . . . . . . . . . . . . . . . . . (188) (122) (50) (20) — 50
Interest accrued . . . . . . . . . . . . . . . . . . . . . . . . . . . . . . . . . . . . . . . . . . . . . 59 57 50 — — —
Unrealized losses on mark-to-market and hedging transactions . . . . . . . . . . . . 348 79 — — — —
Other . . . . . . . . . . . . . . . . . . . . . . . . . . . . . . . . . . . . . . . . . . . . . . . . . . . . 121 243 180 119 15 22
Total current liabilities . . . . . . . . . . . . . . . . . . . . . . . . . . . . . . . . . . . . . . . . . 1,251 1,146 1,512 534 225 429
LONG-TERM DEBT . . . . . . . . . . . . . . . . . . . . . . . . . . . . . . . . . . . . . . . . . . 2,256 2,252 2,540 2,223 105 102
DEFERRED CREDITS AND OTHER LIABILITIESDeferred income taxes . . . . . . . . . . . . . . . . . . . . . . . . . . . . . . . . . . . . . . . . 764 833 623 349 262 207
Unrealized losses on mark-to-market and hedging transactions . . . . . . . . . . . . 49 16 — — — —
Other . . . . . . . . . . . . . . . . . . . . . . . . . . . . . . . . . . . . . . . . . . . . . . . . . . . . 114 47 40 24 7 6
Total deferred credits and other liabilities . . . . . . . . . . . . . . . . . . . . . . . . . . . 927 896 663 373 269 213
MINORITY INTERESTS . . . . . . . . . . . . . . . . . . . . . . . . . . . . . . . . . . . . . . . 928 1,039 829 — — —
COMMON STOCKHOLDERS’ EQUITYCommon stock . . . . . . . . . . . . . . . . . . . . . . . . . . . . . . . . . . . . . . . . . . . . . . 1 1 1 1 — —
Additional paid-in capital . . . . . . . . . . . . . . . . . . . . . . . . . . . . . . . . . . . . . . . 293 235 379 308 1,754 1,146
Retained earnings . . . . . . . . . . . . . . . . . . . . . . . . . . . . . . . . . . . . . . . . . . . 959 896 687 621 399 320
Accumulated other comprehensive (loss) income . . . . . . . . . . . . . . . . . . . . . . (65) 135 — — — —
Total common stockholders’ equity . . . . . . . . . . . . . . . . . . . . . . . . . . . . . . . . 1,188 1,267 1,067 930 2,153 1,466
TOTAL LIABILITIES AND STOCKHOLDERS’ EQUITY . . . . . . . . . . . . . . . . . . $6,550 $6,600 $6,611 $4,060 $2,752 $2,210
Field Services
BALANCE SHEET - LIABILITIES AND STOCKHOLDERS’ EQUITY
Field Services

P/32
Field Services
OPERATING STATISTICS
. . Years ended December 31 . .
2002 2001 2000 1999 1998 1997
Natural gas gathered and processed/
transported, TBtu/d . . . . . . . . . . . . . . . . . . . . . . . . . . . . . . . . . . . . . . . . 8.3 8.6 7.6 5.1 3.6 3.4
Natural gas marketed, TBtu/d . . . . . . . . . . . . . . . . . . . . . . . . . . . . . . . . . . 1.6 1.6 0.7 0.5 0.4 0.4
NGL production, MBbl/d . . . . . . . . . . . . . . . . . . . . . . . . . . . . . . . . . . . . . . 391.9 397.2 358.5 192.4 110.2 108.2
Average natural gas price per MMBtua . . . . . . . . . . . . . . . . . . . . . . . . . . . $ 3.22 $ 4.27 $ 3.89 $ 2.27 $ 2.11 $ 2.59
Average NGL price per gallon a . . . . . . . . . . . . . . . . . . . . . . . . . . . . . . . . . $ 0.38 $ 0.45 $ 0.53 $ 0.34 $ 0.26 $ 0.35
a Prices before hedging impact.
Field Services

P/33Duke Energy North America
DUKE ENERGY NORTH AMERICA
2002 AT A GLANCE
EBIT $165 million
NATURAL GAS MARKETED 17.7 TBtu/d
ELECTRICITY MARKETED 546,245 GWh
PRINCIPAL OFFICERS
ROBERT T. LADDPresident, Duke Energy North America
MICHAEL F. McGOWANExecutive Vice President, Refined Products Trading
F. MITCHELL DAVIDSONSenior Vice President, Origination, Energy Management
CURTIS H. DAVISSenior Vice President, Energy Generation
C. GREGORY HARPERSenior Vice President, Energy Marketing
LON C. MITCHELL, JR.Senior Vice President and Chief Financial Officer
WILLIAM B. WIENERSenior Vice President and Chief Investment Officer,Strategic Business Development
BridgeportHempstead
Del. Valley
Niagara
Bayside
EssexSe Conn
SEMASS
MaineIndependence
Oakland
McMahon
Fort Frances
South Bay
Hanging Rock
Vermillion
Griffith St. Francis Marshall
Arlington Valley
Moapa
Grays Harbor
DemingEnterprise
Hinds
Southaven
Moss LandingMorro Bay
Murray
SandersvilleNew AlbanyHot Spring
WashingtonFayette
Lee
Head OfficeRegional Offices
Steam Generation FacilityOperating Facilities
2003 ConstructionConstruction Deferred American Ref-Fuel
Formica
Calgary
Salt LakeCity
Houston

P/34 Duke Energy North America
Duke Energy North America
EARNINGS BEFORE INTEREST AND TAXES
. . Years ended December 31 . .
In millions 2002 2001 2000 1999 1998 1997b
OPERATING REVENUESSales of natural gas and petroleum products . . . . . . . . . . . . . . . . . . . . . . . . $ 2 $ 1 $ (161) $ (1) $ — $ —
Generation, transmission and distribution of electricity . . . . . . . . . . . . . . . . . 1,604 1,994 2,308 535 210 —
Transportation and storage of natural gas . . . . . . . . . . . . . . . . . . . . . . . . . . — — — — — —
Trading and marketing net margin . . . . . . . . . . . . . . . . . . . . . . . . . . . . . . . (54) 989 (164) 115 253 133
Other . . . . . . . . . . . . . . . . . . . . . . . . . . . . . . . . . . . . . . . . . . . . . . . . . . . — 49 45 22 15 51
Total operating revenuesc . . . . . . . . . . . . . . . . . . . . . . . . . . . . . . . . . . . . . 1,552 3,033 2,028 671 478 184
OPERATING EXPENSESNatural gas and petroleum products purchased . . . . . . . . . . . . . . . . . . . . . — 1 (1) — — —
Fuel used in electric generation . . . . . . . . . . . . . . . . . . . . . . . . . . . . . . . . . 634 722 1,160 276 102 —
Operation and maintenance . . . . . . . . . . . . . . . . . . . . . . . . . . . . . . . . . . . 642 918 526 263 221 136
Depreciation and amortization . . . . . . . . . . . . . . . . . . . . . . . . . . . . . . . . . . 190 103 70 57 27 16
Property and other taxes . . . . . . . . . . . . . . . . . . . . . . . . . . . . . . . . . . . . . . 41 24 23 14 5 3
Total operating expenses . . . . . . . . . . . . . . . . . . . . . . . . . . . . . . . . . . . . . 1,507 1,768 1,778 610 355 155
GAINS ON SALES OF OTHER ASSETS, NET . . . . . . . . . . . . . . . . . . . . . . — 229 160 112 — —
OPERATING INCOME c . . . . . . . . . . . . . . . . . . . . . . . . . . . . . . . . . . . . . . 45 1,494 410 173 123 29
OTHER INCOME AND EXPENSESEquity in earnings of unconsolidated affiliates . . . . . . . . . . . . . . . . . . . . . . . 44 35 45 47 50 8
Other income and expenses, net . . . . . . . . . . . . . . . . . . . . . . . . . . . . . . . . 33 2 — 60 20 12
Total other income and expenses . . . . . . . . . . . . . . . . . . . . . . . . . . . . . . . . 77 37 45 107 70 20
MINORITY INTEREST (BENEFIT) EXPENSE a . . . . . . . . . . . . . . . . . . . . . (43) 44 73 61 51 22
EBIT . . . . . . . . . . . . . . . . . . . . . . . . . . . . . . . . . . . . . . . . . . . . . . . . . . . $ 165 $1,487 $ 382 $219 $142 $ 27
a Includes minority interest expense related to EBIT and excludes minority interest expense related to interest and taxes.b Amounts for 1997 have not been revised to present gains on sale of other assets, net; gain on sale of equity investments; or equity in earnings of unconsolidated affiliates separately from
revenues as the information is not readily available.c Amounts presented for revenues and operating income differ from the corresponding amounts presented in the 2002 Annual Report due to the impact of certain reclassifications, as presented
in Attachment B. The amounts in this supplement reflect changes in segment presentation that were instituted in the first quarter of 2003.

P/35Duke Energy North America
. . Years ended December 31 . .
In millions 2002 2001 2000 1999 1998 1997
CURRENT ASSETSCash and cash equivalents . . . . . . . . . . . . . . . . . . . . . . . . . . . . . . . $ 51 $ 75 $ 408 $ 41 $ 5 $ 39
Receivables . . . . . . . . . . . . . . . . . . . . . . . . . . . . . . . . . . . . . . . . . 3,360 2,818 7,532 2,024 1,281 1,095
Inventory . . . . . . . . . . . . . . . . . . . . . . . . . . . . . . . . . . . . . . . . . . . 220 203 115 119 56 60
Unrealized gains on mark-to-market and hedging transactions . . . . . . 1,454 1,770 10,405 1,131 1,457 551
Other . . . . . . . . . . . . . . . . . . . . . . . . . . . . . . . . . . . . . . . . . . . . . . 737 119 899 137 60 53
Total current assets . . . . . . . . . . . . . . . . . . . . . . . . . . . . . . . . . . . . 5,822 4,985 19,359 3,452 2,859 1,798
INVESTMENTS AND OTHER ASSETSInvestments in unconsolidated affiliates . . . . . . . . . . . . . . . . . . . . . . 339 315 610 425 170 382
Investments and advances in subsidiaries . . . . . . . . . . . . . . . . . . . . 2,038 937 470 (163) 138 6
Goodwill, net . . . . . . . . . . . . . . . . . . . . . . . . . . . . . . . . . . . . . . . . . 100 91 73 81 14 14
Notes receivable . . . . . . . . . . . . . . . . . . . . . . . . . . . . . . . . . . . . . . 49 44 70 72 156 167
Unrealized gains on mark-to-market and hedging transactions . . . . . . 2,270 2,579 3,939 689 396 66
Other . . . . . . . . . . . . . . . . . . . . . . . . . . . . . . . . . . . . . . . . . . . . . . 76 (362) (48) 258 84 13
Total investments and other assets . . . . . . . . . . . . . . . . . . . . . . . . . 4,872 3,604 5,114 1,362 958 648
PROPERTY, PLANT AND EQUIPMENTCost . . . . . . . . . . . . . . . . . . . . . . . . . . . . . . . . . . . . . . . . . . . . . . . 7,548 5,512 2,516 1,369 1,065 838
Accumulated depreciation and amortization . . . . . . . . . . . . . . . . . . . (430 ) (245) (157) (79) (347) (451)
Net property, plant and equipment . . . . . . . . . . . . . . . . . . . . . . . . . 7,118 5,267 2,359 1,290 718 387
REGULATORY ASSETS AND DEFERRED DEBITSOther . . . . . . . . . . . . . . . . . . . . . . . . . . . . . . . . . . . . . . . . . . . . . . 6 2 — — 2 17
Total regulatory assets and deferred debits . . . . . . . . . . . . . . . . . . . . 6 2 — — 2 17
TOTAL ASSETS . . . . . . . . . . . . . . . . . . . . . . . . . . . . . . . . . . . . . . $17,818 $13,858 $26,832 $6,104 $4,537 $2,850
Duke Energy North America
BALANCE SHEET - ASSETS
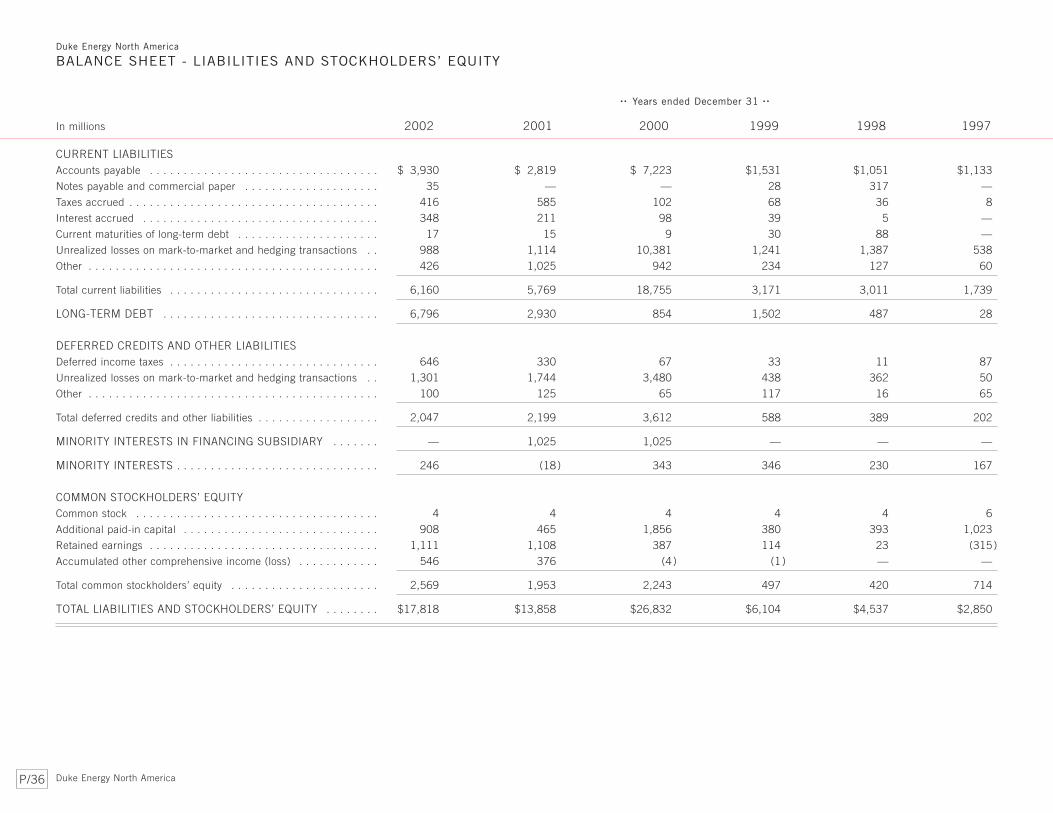
P/36 Duke Energy North America
Duke Energy North America
BALANCE SHEET - LIABILITIES AND STOCKHOLDERS’ EQUITY
. . Years ended December 31 . .
In millions 2002 2001 2000 1999 1998 1997
CURRENT LIABILITIESAccounts payable . . . . . . . . . . . . . . . . . . . . . . . . . . . . . . . . . . $ 3,930 $ 2,819 $ 7,223 $1,531 $1,051 $1,133
Notes payable and commercial paper . . . . . . . . . . . . . . . . . . . . 35 — — 28 317 —
Taxes accrued . . . . . . . . . . . . . . . . . . . . . . . . . . . . . . . . . . . . . 416 585 102 68 36 8
Interest accrued . . . . . . . . . . . . . . . . . . . . . . . . . . . . . . . . . . . 348 211 98 39 5 —
Current maturities of long-term debt . . . . . . . . . . . . . . . . . . . . . 17 15 9 30 88 —
Unrealized losses on mark-to-market and hedging transactions . . 988 1,114 10,381 1,241 1,387 538
Other . . . . . . . . . . . . . . . . . . . . . . . . . . . . . . . . . . . . . . . . . . . 426 1,025 942 234 127 60
Total current liabilities . . . . . . . . . . . . . . . . . . . . . . . . . . . . . . . 6,160 5,769 18,755 3,171 3,011 1,739
LONG-TERM DEBT . . . . . . . . . . . . . . . . . . . . . . . . . . . . . . . . 6,796 2,930 854 1,502 487 28
DEFERRED CREDITS AND OTHER LIABILITIESDeferred income taxes . . . . . . . . . . . . . . . . . . . . . . . . . . . . . . . 646 330 67 33 11 87
Unrealized losses on mark-to-market and hedging transactions . . 1,301 1,744 3,480 438 362 50
Other . . . . . . . . . . . . . . . . . . . . . . . . . . . . . . . . . . . . . . . . . . . 100 125 65 117 16 65
Total deferred credits and other liabilities . . . . . . . . . . . . . . . . . . 2,047 2,199 3,612 588 389 202
MINORITY INTERESTS IN FINANCING SUBSIDIARY . . . . . . . — 1,025 1,025 — — —
MINORITY INTERESTS . . . . . . . . . . . . . . . . . . . . . . . . . . . . . . 246 (18) 343 346 230 167
COMMON STOCKHOLDERS’ EQUITYCommon stock . . . . . . . . . . . . . . . . . . . . . . . . . . . . . . . . . . . . 4 4 4 4 4 6
Additional paid-in capital . . . . . . . . . . . . . . . . . . . . . . . . . . . . . 908 465 1,856 380 393 1,023
Retained earnings . . . . . . . . . . . . . . . . . . . . . . . . . . . . . . . . . . 1,111 1,108 387 114 23 (315)
Accumulated other comprehensive income (loss) . . . . . . . . . . . . 546 376 (4) (1 ) — —
Total common stockholders’ equity . . . . . . . . . . . . . . . . . . . . . . 2,569 1,953 2,243 497 420 714
TOTAL LIABILITIES AND STOCKHOLDERS’ EQUITY . . . . . . . . $17,818 $13,858 $26,832 $6,104 $4,537 $2,850

P/37
INTERNATIONAL ENERGY
2002 AT A GLANCE
EBIT $(102) million
PRINCIPAL OFFICERS
RICHARD K. McGEEPresident, Duke Energy International
JULIE DILLExecutive Vice President, DEI Asia
PETER J. WILTExecutive Vice President, DEI Europe
JOHN P. ENLOESenior Vice President, DEI Northern Latin America Region
BRADLEY K. ALFORDSenior Vice President and Chief Financial Officer
AcajutlaEl Salvador
Guatemala
293 MW
168 MW165 MW
Under construction
ElectroquilEcuador180 MWEgenor
Peru529 MW
Lima
Guatemala City
Sao Paulo
BuenosAiresAguaytia
Peru160 MW
190 miles(306 km)
Houston
Mexico City
Charlotte
Corani, Bolivia126 MW
CTR, France103 MW
ParanapanemaBrazil2,307 MW
HidroelectricaCerros ColoradosArgentina576 MW
London
Puncakjaya PowerIndonesia385 MW
Queensland GasPipelineAustralia389 miles (626 km)
Sydney
Glenbrook New Zealand112 MW
Port Hedland Australia160 MW
NewmanAustralia
90 MW
Goldfields Gas PipelineAustralia
855 miles (1,376 km)
Tasmanian Gas PipelineAustralia
457 miles (745 km)
BairnsdaleAustralia86 MW
Eastern Gas PipelineAustralia494 miles (795 km)
The Hague
Melbourne
Business OfficesOperations
International Energy

P/38 International Energy
. . Years ended December 31 . .
In millions 2002 2001 2000 1999 1998
OPERATING REVENUESSales of natural gas and petroleum products . . . . . . . . . . . . . . . . . . . . . . . . . . . . . . . $ 72 $114 $129 $112 $113
Generation, transmission and distribution of electricity . . . . . . . . . . . . . . . . . . . . . . . . . 747 630 564 223 28
Transportation and storage of natural gas . . . . . . . . . . . . . . . . . . . . . . . . . . . . . . . . . . 31 (2) — — —
Trading and marketing net margin . . . . . . . . . . . . . . . . . . . . . . . . . . . . . . . . . . . . . . . (22) 37 13 — —
Other . . . . . . . . . . . . . . . . . . . . . . . . . . . . . . . . . . . . . . . . . . . . . . . . . . . . . . . . . . . 44 12 2 12 —
Total operating revenuesb . . . . . . . . . . . . . . . . . . . . . . . . . . . . . . . . . . . . . . . . . . . . . 872 791 708 347 141
OPERATING EXPENSESNatural gas and petroleum products purchased . . . . . . . . . . . . . . . . . . . . . . . . . . . . . 83 60 80 69 90
Fuel used in electric generation . . . . . . . . . . . . . . . . . . . . . . . . . . . . . . . . . . . . . . . . 100 44 3 — —
Net interchange and purchased power . . . . . . . . . . . . . . . . . . . . . . . . . . . . . . . . . . . . 261 104 — — —
Operation and maintenance . . . . . . . . . . . . . . . . . . . . . . . . . . . . . . . . . . . . . . . . . . . 350 233 282 157 40
Depreciation and amortization . . . . . . . . . . . . . . . . . . . . . . . . . . . . . . . . . . . . . . . . . . 86 97 97 58 15
Property and other taxes . . . . . . . . . . . . . . . . . . . . . . . . . . . . . . . . . . . . . . . . . . . . . 7 19 21 6 —
Impairment of goodwill . . . . . . . . . . . . . . . . . . . . . . . . . . . . . . . . . . . . . . . . . . . . . . . 194 — — — —
Total operating expenses . . . . . . . . . . . . . . . . . . . . . . . . . . . . . . . . . . . . . . . . . . . . . 1,081 557 483 290 145
GAINS ON SALES OF OTHER ASSETS, NET . . . . . . . . . . . . . . . . . . . . . . . . . . . . . . — 9 54 — —
OPERATING INCOMEb . . . . . . . . . . . . . . . . . . . . . . . . . . . . . . . . . . . . . . . . . . . . . . (209) 243 279 57 (4)
OTHER INCOME AND EXPENSESEquity in earnings of unconsolidated affiliates . . . . . . . . . . . . . . . . . . . . . . . . . . . . . . . 65 39 43 10 18
Other income and expenses, net . . . . . . . . . . . . . . . . . . . . . . . . . . . . . . . . . . . . . . . . 57 27 42 8 4
Total other income and expenses . . . . . . . . . . . . . . . . . . . . . . . . . . . . . . . . . . . . . . . . 122 66 85 18 22
MINORITY INTEREST EXPENSE a . . . . . . . . . . . . . . . . . . . . . . . . . . . . . . . . . . . . . . 15 23 23 31 6
EBIT . . . . . . . . . . . . . . . . . . . . . . . . . . . . . . . . . . . . . . . . . . . . . . . . . . . . . . . . . . . $(102) $286 $341 $ 44 $ 12
a Includes minority interest expense related to EBIT and excludes minority interest expense related to interest and taxes.b Amounts presented for revenues and operating income differ from the corresponding amounts presented in the 2002 Annual Report due to the impact of certain reclassifications, as presented
in Attachment B. The amounts in this supplement reflect changes in segment presentation that were instituted in the first quarter of 2003.
International Energy
EARNINGS BEFORE INTEREST AND TAXES
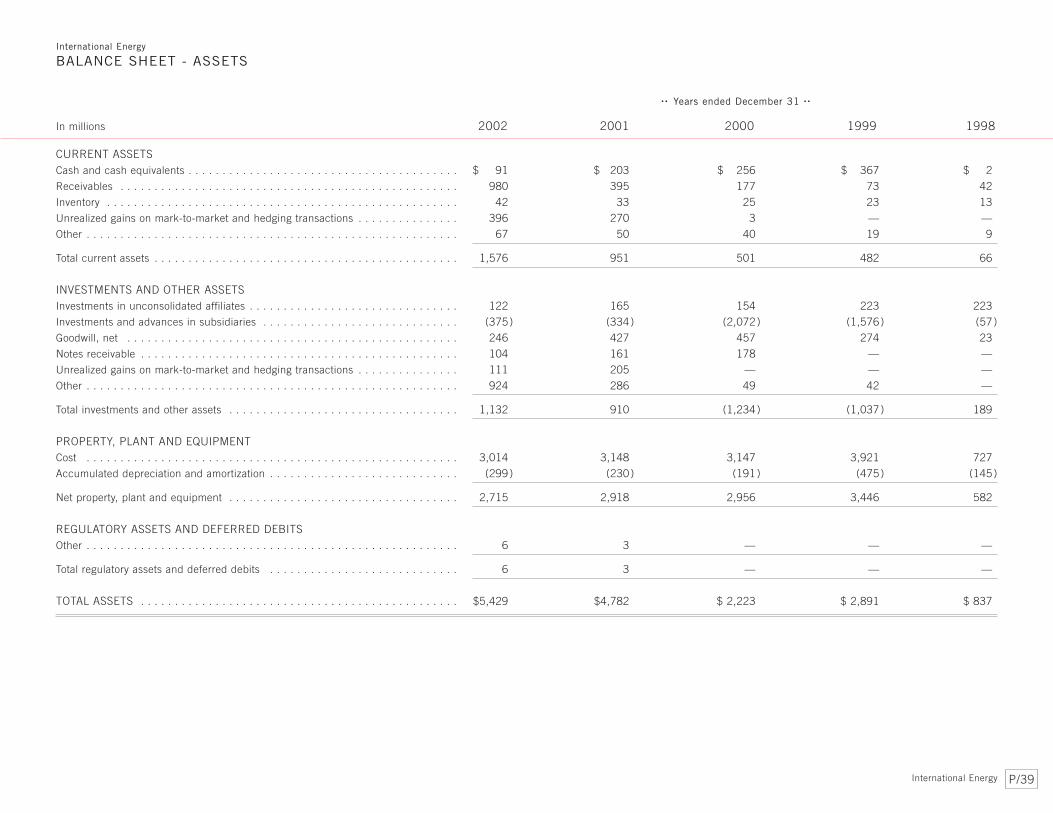
P/39
International Energy
BALANCE SHEET - ASSETS
. . Years ended December 31 . .
In millions 2002 2001 2000 1999 1998
CURRENT ASSETSCash and cash equivalents . . . . . . . . . . . . . . . . . . . . . . . . . . . . . . . . . . . . . . . . $ 91 $ 203 $ 256 $ 367 $ 2
Receivables . . . . . . . . . . . . . . . . . . . . . . . . . . . . . . . . . . . . . . . . . . . . . . . . . . 980 395 177 73 42
Inventory . . . . . . . . . . . . . . . . . . . . . . . . . . . . . . . . . . . . . . . . . . . . . . . . . . . . 42 33 25 23 13
Unrealized gains on mark-to-market and hedging transactions . . . . . . . . . . . . . . . 396 270 3 — —
Other . . . . . . . . . . . . . . . . . . . . . . . . . . . . . . . . . . . . . . . . . . . . . . . . . . . . . . . 67 50 40 19 9
Total current assets . . . . . . . . . . . . . . . . . . . . . . . . . . . . . . . . . . . . . . . . . . . . . 1,576 951 501 482 66
INVESTMENTS AND OTHER ASSETSInvestments in unconsolidated affiliates . . . . . . . . . . . . . . . . . . . . . . . . . . . . . . . 122 165 154 223 223
Investments and advances in subsidiaries . . . . . . . . . . . . . . . . . . . . . . . . . . . . . (375) (334) (2,072) (1,576) (57)
Goodwill, net . . . . . . . . . . . . . . . . . . . . . . . . . . . . . . . . . . . . . . . . . . . . . . . . . 246 427 457 274 23
Notes receivable . . . . . . . . . . . . . . . . . . . . . . . . . . . . . . . . . . . . . . . . . . . . . . . 104 161 178 — —
Unrealized gains on mark-to-market and hedging transactions . . . . . . . . . . . . . . . 111 205 — — —
Other . . . . . . . . . . . . . . . . . . . . . . . . . . . . . . . . . . . . . . . . . . . . . . . . . . . . . . . 924 286 49 42 —
Total investments and other assets . . . . . . . . . . . . . . . . . . . . . . . . . . . . . . . . . . 1,132 910 (1,234) (1,037) 189
PROPERTY, PLANT AND EQUIPMENTCost . . . . . . . . . . . . . . . . . . . . . . . . . . . . . . . . . . . . . . . . . . . . . . . . . . . . . . . 3,014 3,148 3,147 3,921 727
Accumulated depreciation and amortization . . . . . . . . . . . . . . . . . . . . . . . . . . . . (299) (230) (191) (475) (145)
Net property, plant and equipment . . . . . . . . . . . . . . . . . . . . . . . . . . . . . . . . . . 2,715 2,918 2,956 3,446 582
REGULATORY ASSETS AND DEFERRED DEBITSOther . . . . . . . . . . . . . . . . . . . . . . . . . . . . . . . . . . . . . . . . . . . . . . . . . . . . . . . 6 3 — — —
Total regulatory assets and deferred debits . . . . . . . . . . . . . . . . . . . . . . . . . . . . 6 3 — — —
TOTAL ASSETS . . . . . . . . . . . . . . . . . . . . . . . . . . . . . . . . . . . . . . . . . . . . . . . $5,429 $4,782 $ 2,223 $ 2,891 $ 837
International Energy
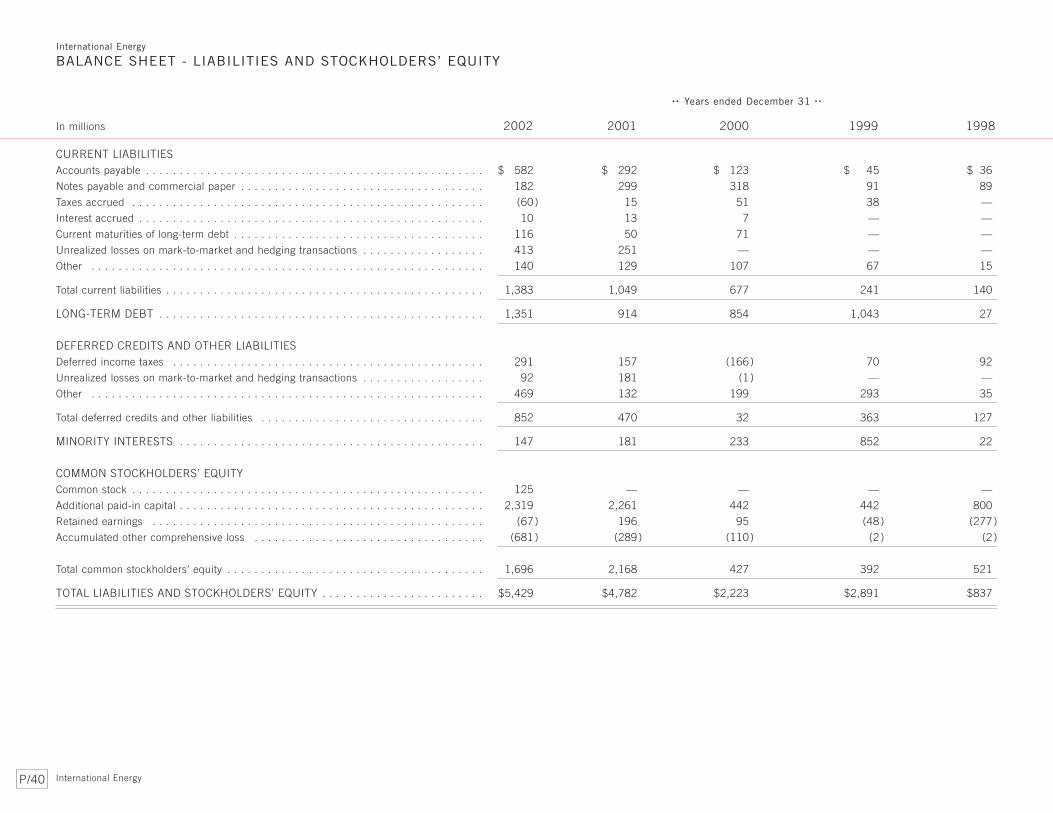
P/40 International Energy
. . Years ended December 31 . .
In millions 2002 2001 2000 1999 1998
CURRENT LIABILITIESAccounts payable . . . . . . . . . . . . . . . . . . . . . . . . . . . . . . . . . . . . . . . . . . . . . . . . . . $ 582 $ 292 $ 123 $ 45 $ 36
Notes payable and commercial paper . . . . . . . . . . . . . . . . . . . . . . . . . . . . . . . . . . . . 182 299 318 91 89
Taxes accrued . . . . . . . . . . . . . . . . . . . . . . . . . . . . . . . . . . . . . . . . . . . . . . . . . . . . (60) 15 51 38 —
Interest accrued . . . . . . . . . . . . . . . . . . . . . . . . . . . . . . . . . . . . . . . . . . . . . . . . . . . 10 13 7 — —
Current maturities of long-term debt . . . . . . . . . . . . . . . . . . . . . . . . . . . . . . . . . . . . . 116 50 71 — —
Unrealized losses on mark-to-market and hedging transactions . . . . . . . . . . . . . . . . . . 413 251 — — —
Other . . . . . . . . . . . . . . . . . . . . . . . . . . . . . . . . . . . . . . . . . . . . . . . . . . . . . . . . . . 140 129 107 67 15
Total current liabilities . . . . . . . . . . . . . . . . . . . . . . . . . . . . . . . . . . . . . . . . . . . . . . . 1,383 1,049 677 241 140
LONG-TERM DEBT . . . . . . . . . . . . . . . . . . . . . . . . . . . . . . . . . . . . . . . . . . . . . . . . 1,351 914 854 1,043 27
DEFERRED CREDITS AND OTHER LIABILITIESDeferred income taxes . . . . . . . . . . . . . . . . . . . . . . . . . . . . . . . . . . . . . . . . . . . . . . 291 157 (166) 70 92
Unrealized losses on mark-to-market and hedging transactions . . . . . . . . . . . . . . . . . . 92 181 (1) — —
Other . . . . . . . . . . . . . . . . . . . . . . . . . . . . . . . . . . . . . . . . . . . . . . . . . . . . . . . . . . 469 132 199 293 35
Total deferred credits and other liabilities . . . . . . . . . . . . . . . . . . . . . . . . . . . . . . . . . 852 470 32 363 127
MINORITY INTERESTS . . . . . . . . . . . . . . . . . . . . . . . . . . . . . . . . . . . . . . . . . . . . . 147 181 233 852 22
COMMON STOCKHOLDERS’ EQUITYCommon stock . . . . . . . . . . . . . . . . . . . . . . . . . . . . . . . . . . . . . . . . . . . . . . . . . . . . 125 — — — —
Additional paid-in capital . . . . . . . . . . . . . . . . . . . . . . . . . . . . . . . . . . . . . . . . . . . . . 2,319 2,261 442 442 800
Retained earnings . . . . . . . . . . . . . . . . . . . . . . . . . . . . . . . . . . . . . . . . . . . . . . . . . (67) 196 95 (48) (277)
Accumulated other comprehensive loss . . . . . . . . . . . . . . . . . . . . . . . . . . . . . . . . . . (681) (289) (110) (2 ) (2 )
Total common stockholders’ equity . . . . . . . . . . . . . . . . . . . . . . . . . . . . . . . . . . . . . . 1,696 2,168 427 392 521
TOTAL LIABILITIES AND STOCKHOLDERS’ EQUITY . . . . . . . . . . . . . . . . . . . . . . . . $5,429 $4,782 $2,223 $2,891 $837
International Energy
BALANCE SHEET - LIABILITIES AND STOCKHOLDERS’ EQUITY

P/41
OTHER ENERGY SERVICES
2002 AT A GLANCE
EBIT $63 million
PRINCIPAL OFFICERS
JEFF L. FAULKPresident, Duke/Fluor Daniel
MICHAEL J. KIMNERPresident, Duke Energy Merchants
JOHNNY M. PRIESTPresident, Energy Delivery Services
Cokenergy/Inland Steel
95 MW O&M
MecklenburgCogeneration
132 MW O&M
Gibbons Creek462MW O&M
BridgeportHarbor520 MW
AESPuerto Rico450 MW
Batu HijauIndonesia160 MW O&M
Irian JayaIndonesia190 MW O&M
Dover175 MW O&M
DUKE FLUOR/DANIEL
Other Energy Services

P/42 Other Energy Services
. . Years ended December 31 . .
In millions 2002 2001 2000 1999 1998 1997a
OPERATING REVENUESSales of natural gas and petroleum products . . . . . . . . . . . . . . . . . . . . . . . . . . . . $ 31 $ 60 $271 $ 383 $ — $ 28
Trading and marketing net margin . . . . . . . . . . . . . . . . . . . . . . . . . . . . . . . . . . . . (24 ) (73) 138 — — —
Other . . . . . . . . . . . . . . . . . . . . . . . . . . . . . . . . . . . . . . . . . . . . . . . . . . . . . . . . 291 498 463 593 507 348
Total operating revenuesb . . . . . . . . . . . . . . . . . . . . . . . . . . . . . . . . . . . . . . . . . 298 485 872 976 507 376
OPERATING EXPENSESNatural gas and petroleum products purchased . . . . . . . . . . . . . . . . . . . . . . . . . . 2 3 286 381 — 17
Operation and maintenance . . . . . . . . . . . . . . . . . . . . . . . . . . . . . . . . . . . . . . . . 329 612 556 680 499 330
Depreciation and amortization . . . . . . . . . . . . . . . . . . . . . . . . . . . . . . . . . . . . . . 26 71 18 14 12 6
Property and other taxes . . . . . . . . . . . . . . . . . . . . . . . . . . . . . . . . . . . . . . . . . . 3 2 — — — —
Total operating expenses . . . . . . . . . . . . . . . . . . . . . . . . . . . . . . . . . . . . . . . . . . 360 688 860 1,075 511 353
GAINS ON SALES OF OTHER ASSETS, NET . . . . . . . . . . . . . . . . . . . . . . . . . . . 16 — — — — —
OPERATING INCOME b . . . . . . . . . . . . . . . . . . . . . . . . . . . . . . . . . . . . . . . . . . (46 ) (203) 12 (99) (4 ) 23
OTHER INCOME AND EXPENSESEquity in earnings of unconsolidated affiliates . . . . . . . . . . . . . . . . . . . . . . . . . . . . 107 49 (22) 13 14 —
Other income and expenses, net . . . . . . . . . . . . . . . . . . . . . . . . . . . . . . . . . . . . . 2 5 3 — — (5)
Total other income and expenses . . . . . . . . . . . . . . . . . . . . . . . . . . . . . . . . . . . . 109 54 (19) 13 14 (5)
EBIT . . . . . . . . . . . . . . . . . . . . . . . . . . . . . . . . . . . . . . . . . . . . . . . . . . . . . . . . $ 63 $(149) $ (7) $ (86) $ 10 $ 18
a Amounts for 1997 have not been revised to present gains on sale of other assets, net, or equity in earnings of unconsolidated affiliates separately from revenues as the information is not
readily available.b Amounts presented for revenues and operating income differ from the corresponding amounts presented in the 2002 Annual Report due to the impact of certain reclassifications, as presented
in Attachment B. The amounts in this supplement reflect changes in segment presentation that were instituted in the first quarter of 2003.
Other Energy Services
EARNINGS BEFORE INTEREST AND TAXES

P/43
Other Energy Services
BALANCE SHEET - ASSETS
. . Years ended December 31 . .
In millions 2002 2001 2000 1999 1998 1997
CURRENT ASSETSCash and cash equivalents . . . . . . . . . . . . . . . . . . . . . . . . . . . . . . . . . . . . . . . $ 21 $ 3 $ 6 $ 5 $ 1 $ 8
Receivables . . . . . . . . . . . . . . . . . . . . . . . . . . . . . . . . . . . . . . . . . . . . . . . . . . 497 379 646 272 143 80
Inventory . . . . . . . . . . . . . . . . . . . . . . . . . . . . . . . . . . . . . . . . . . . . . . . . . . . . 105 109 70 2 4 1
Unrealized gains on mark-to-market and hedging transactions . . . . . . . . . . . . . . 92 43 630 — — —
Other . . . . . . . . . . . . . . . . . . . . . . . . . . . . . . . . . . . . . . . . . . . . . . . . . . . . . . (11) 57 167 104 67 21
Total current assets . . . . . . . . . . . . . . . . . . . . . . . . . . . . . . . . . . . . . . . . . . . . 704 591 1,519 383 215 110
INVESTMENTS AND OTHER ASSETSInvestments in unconsolidated affiliates . . . . . . . . . . . . . . . . . . . . . . . . . . . . . . 30 60 52 58 42 26
Investments and advances in subsidiaries . . . . . . . . . . . . . . . . . . . . . . . . . . . . . 2,347 (205) (425) (3 ) (3 ) (9 )
Goodwill, net . . . . . . . . . . . . . . . . . . . . . . . . . . . . . . . . . . . . . . . . . . . . . . . . . — 6 47 47 53 49
Unrealized gains on mark-to-market and hedging transactions . . . . . . . . . . . . . . 53 224 279 — — —
Other . . . . . . . . . . . . . . . . . . . . . . . . . . . . . . . . . . . . . . . . . . . . . . . . . . . . . . 75 81 83 91 40 22
Total investments and other assets . . . . . . . . . . . . . . . . . . . . . . . . . . . . . . . . . . 2,505 166 36 193 132 88
PROPERTY, PLANT AND EQUIPMENTCost . . . . . . . . . . . . . . . . . . . . . . . . . . . . . . . . . . . . . . . . . . . . . . . . . . . . . . . 154 171 149 52 38 19
Accumulated depreciation and amortization . . . . . . . . . . . . . . . . . . . . . . . . . . . (55) (61) (32) (19) (12) (5 )
Net property, plant and equipment . . . . . . . . . . . . . . . . . . . . . . . . . . . . . . . . . . 99 110 117 33 26 14
REGULATORY ASSETS AND DEFERRED DEBITSTotal regulatory assets and deferred debits . . . . . . . . . . . . . . . . . . . . . . . . . . . . — (2) — — — 2
TOTAL ASSETS . . . . . . . . . . . . . . . . . . . . . . . . . . . . . . . . . . . . . . . . . . . . . . . $3,308 $ 865 $1,672 $609 $373 $214
Other Energy Services

P/44 Other Energy Services
. . Years ended December 31 . .
In millions 2002 2001 2000 1999 1998 1997
CURRENT LIABILITIESAccounts payable . . . . . . . . . . . . . . . . . . . . . . . . . . . . . . . . . . . . . . . . . . . . . . . $ 96 $288 $ 556 $314 $121 $ 10
Taxes accrued . . . . . . . . . . . . . . . . . . . . . . . . . . . . . . . . . . . . . . . . . . . . . . . . . (13) (8 ) (42) (55) (4 ) 5
Current maturities of long-term debt . . . . . . . . . . . . . . . . . . . . . . . . . . . . . . . . . . 2 4 4 3 1 —
Unrealized losses on mark-to-market and hedging transactions . . . . . . . . . . . . . . . 147 134 689 — — —
Other . . . . . . . . . . . . . . . . . . . . . . . . . . . . . . . . . . . . . . . . . . . . . . . . . . . . . . . 190 134 30 35 43 43
Total current liabilities . . . . . . . . . . . . . . . . . . . . . . . . . . . . . . . . . . . . . . . . . . . . 422 552 1,237 297 161 58
LONG-TERM DEBT . . . . . . . . . . . . . . . . . . . . . . . . . . . . . . . . . . . . . . . . . . . . . 1,486 36 47 38 20 —
DEFERRED CREDITS AND OTHER LIABILITIESDeferred income taxes . . . . . . . . . . . . . . . . . . . . . . . . . . . . . . . . . . . . . . . . . . . (71) (70) 14 10 1 —
Unrealized losses on mark-to-market and hedging transactions . . . . . . . . . . . . . . . 23 153 100 — — —
Other . . . . . . . . . . . . . . . . . . . . . . . . . . . . . . . . . . . . . . . . . . . . . . . . . . . . . . . 27 9 12 10 — 2
Total deferred credits and other liabilities . . . . . . . . . . . . . . . . . . . . . . . . . . . . . . (21) 92 126 20 1 2
COMMON STOCKHOLDERS’ EQUITYAdditional paid-in capital . . . . . . . . . . . . . . . . . . . . . . . . . . . . . . . . . . . . . . . . . . 1,391 302 300 290 168 119
Retained earnings . . . . . . . . . . . . . . . . . . . . . . . . . . . . . . . . . . . . . . . . . . . . . . . 36 (116) (38) (36) 23 35
Accumulated other comprehensive loss . . . . . . . . . . . . . . . . . . . . . . . . . . . . . . . . (6 ) (1 ) — — — —
Total common stockholders’ equity . . . . . . . . . . . . . . . . . . . . . . . . . . . . . . . . . . . 1,421 185 262 254 191 154
TOTAL LIABILITIES AND STOCKHOLDERS’ EQUITY . . . . . . . . . . . . . . . . . . . . . $3,308 $865 $1,672 $609 $373 $214
Other Energy Services
BALANCE SHEET - LIABILITIES AND STOCKHOLDERS’ EQUITY
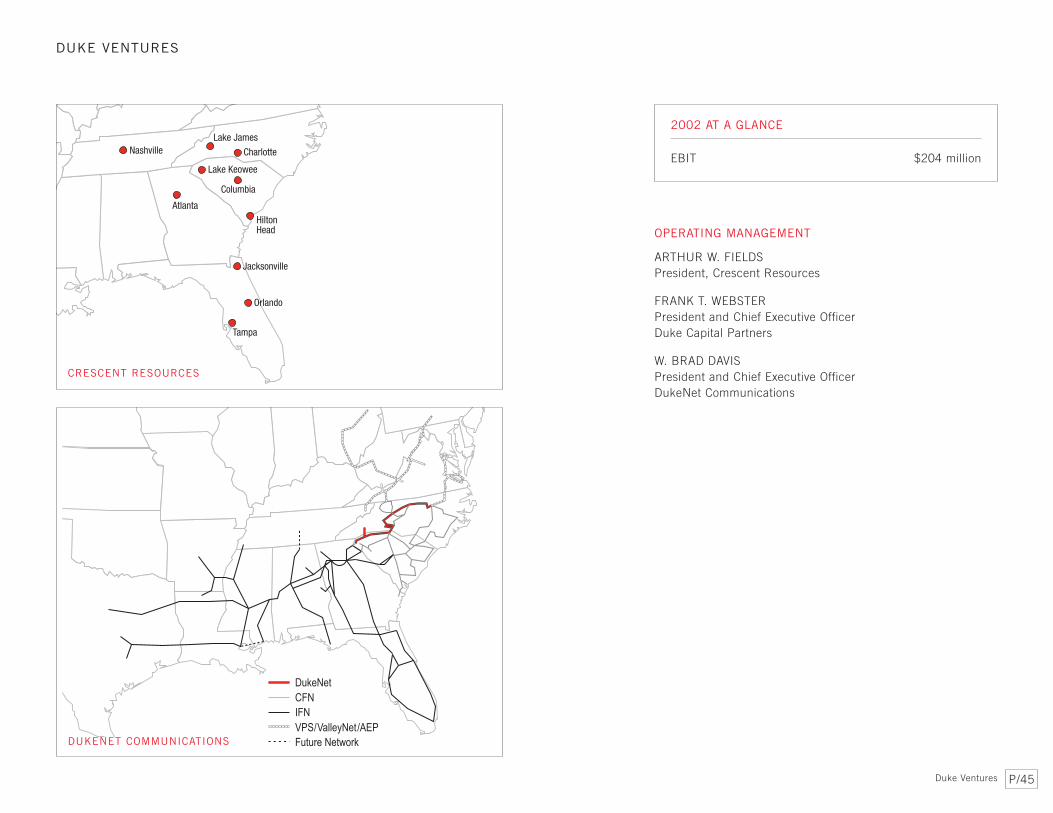
P/45
DUKE VENTURES
2002 AT A GLANCE
EBIT $204 million
OPERATING MANAGEMENT
ARTHUR W. FIELDSPresident, Crescent Resources
FRANK T. WEBSTERPresident and Chief Executive OfficerDuke Capital Partners
W. BRAD DAVISPresident and Chief Executive OfficerDukeNet Communications
NashvilleLake James
Charlotte
Lake Keowee
Columbia
Atlanta
Jacksonville
Tampa
Orlando
HiltonHead
CRESCENT RESOURCES
DUKENET COMMUNICATIONS
Duke Ventures

P/46 Duke Ventures
. . Years ended December 31 . .
In millions 2002 2001 2000b 1999 1998 1997c
OPERATING REVENUES . . . . . . . . . . . . . . . . . . . . . . . . . . . . . . . . . . . . . . . . $514 $644 $399 $430 $323 $184
OPERATING EXPENSESOperation and maintenance . . . . . . . . . . . . . . . . . . . . . . . . . . . . . . . . . . . . . . . 318 433 205 249 186 102
Depreciation and amortization . . . . . . . . . . . . . . . . . . . . . . . . . . . . . . . . . . . . . . 20 20 17 13 9 6
Property and other taxes . . . . . . . . . . . . . . . . . . . . . . . . . . . . . . . . . . . . . . . . . 8 8 7 6 5 4
Total operating expenses . . . . . . . . . . . . . . . . . . . . . . . . . . . . . . . . . . . . . . . . . 346 461 229 268 200 112
GAINS ON SALES OF OTHER ASSETS, NET . . . . . . . . . . . . . . . . . . . . . . . . . . 33 — — — — —
OPERATING INCOME d . . . . . . . . . . . . . . . . . . . . . . . . . . . . . . . . . . . . . . . . . . 201 183 170 162 123 72
OTHER INCOME AND EXPENSESEquity in earnings of unconsolidated affiliates . . . . . . . . . . . . . . . . . . . . . . . . . . . — 2 (9) 3 — —
Gain on sale of equity investments . . . . . . . . . . . . . . . . . . . . . . . . . . . . . . . . . . — — 407 — — —
Other income and expenses, net . . . . . . . . . . . . . . . . . . . . . . . . . . . . . . . . . . . . 1 — — — — —
Total other income and expenses . . . . . . . . . . . . . . . . . . . . . . . . . . . . . . . . . . . 1 2 398 3 — —
MINORITY INTEREST (BENEFIT) EXPENSE a . . . . . . . . . . . . . . . . . . . . . . . . . (2 ) 2 — — — —
EBIT . . . . . . . . . . . . . . . . . . . . . . . . . . . . . . . . . . . . . . . . . . . . . . . . . . . . . . . $204 $183 $568 $165 $123 $ 72
a Includes minority interest expense related to EBIT and excludes minority interest expense related to interest and taxes.b Includes DukeNet’s sale of its 20% interest in BellSouth Carolina PCS to BellSouth Corporation for a pre-tax gain of $407 million.c Amounts for 1997 have not been revised to present gains on sale of other assets, net; gain on sale of equity investments or equity in earnings of unconsolidated affiliates separately from
revenues as the information is not readily available.d Amounts presented for revenues and operating income differ from the corresponding amounts presented in the 2002 Annual Report due to the impact of certain reclassifications, as presented
in Attachment B. The amounts in this supplement reflect changes in segment presentation that were instituted in the first quarter of 2003.
Duke Ventures
EARNINGS BEFORE INTEREST AND TAXES

P/47
Duke Ventures
BALANCE SHEET - ASSETS
. . Years ended December 31 . .
In millions 2002 2001 2000 1999 1998 1997
CURRENT ASSETSCash and cash equivalents . . . . . . . . . . . . . . . . . . . . . . . . . . . . . . . . . . . . . . . . . . $ 54 $ 31 $ 6 $ — $ — $ 8
Receivables . . . . . . . . . . . . . . . . . . . . . . . . . . . . . . . . . . . . . . . . . . . . . . . . . . . . 95 133 567 118 42 21
Inventory . . . . . . . . . . . . . . . . . . . . . . . . . . . . . . . . . . . . . . . . . . . . . . . . . . . . . . 165 155 80 54 49 37
Total current assets . . . . . . . . . . . . . . . . . . . . . . . . . . . . . . . . . . . . . . . . . . . . . . . 314 319 653 172 91 66
INVESTMENTS AND OTHER ASSETSInvestments in unconsolidated affiliates . . . . . . . . . . . . . . . . . . . . . . . . . . . . . . . . . 44 30 23 10 24 43
Investments and advances in subsidiaries . . . . . . . . . . . . . . . . . . . . . . . . . . . . . . . 128 235 — — — —
Goodwill, net . . . . . . . . . . . . . . . . . . . . . . . . . . . . . . . . . . . . . . . . . . . . . . . . . . . . 6 — — — — —
Notes receivable . . . . . . . . . . . . . . . . . . . . . . . . . . . . . . . . . . . . . . . . . . . . . . . . . 412 354 129 74 77 66
Other . . . . . . . . . . . . . . . . . . . . . . . . . . . . . . . . . . . . . . . . . . . . . . . . . . . . . . . . . 11 6 10 5 2 2
Total investments and other assets . . . . . . . . . . . . . . . . . . . . . . . . . . . . . . . . . . . . 601 625 162 89 103 111
PROPERTY, PLANT AND EQUIPMENTCost . . . . . . . . . . . . . . . . . . . . . . . . . . . . . . . . . . . . . . . . . . . . . . . . . . . . . . . . . . 1,437 1,272 1,204 817 663 553
Accumulated depreciation and amortization . . . . . . . . . . . . . . . . . . . . . . . . . . . . . . (68 ) (54) (52) (46) (39) (34)
Net property, plant and equipment . . . . . . . . . . . . . . . . . . . . . . . . . . . . . . . . . . . . 1,369 1,218 1,152 771 624 519
REGULATORY ASSETS AND DEFERRED DEBITSOther . . . . . . . . . . . . . . . . . . . . . . . . . . . . . . . . . . . . . . . . . . . . . . . . . . . . . . . . . 1 — — — — —
Total regulatory assets and deferred debits . . . . . . . . . . . . . . . . . . . . . . . . . . . . . . . 1 — — — — —
TOTAL ASSETS . . . . . . . . . . . . . . . . . . . . . . . . . . . . . . . . . . . . . . . . . . . . . . . . . $2,285 $2,162 $1,967 $1,032 $818 $696
Duke Ventures

P/48 Duke Ventures
. . Years ended December 31 . .
In millions 2002 2001 2000 1999 1998 1997
CURRENT LIABILITIESAccounts payable . . . . . . . . . . . . . . . . . . . . . . . . . . . . . . . . . . . . . . . . . . . $ 20 $ 50 $ 178 $ 103 $ 43 $ 23
Notes payable and commercial paper . . . . . . . . . . . . . . . . . . . . . . . . . . . . . 1 1 — — — —
Taxes accrued . . . . . . . . . . . . . . . . . . . . . . . . . . . . . . . . . . . . . . . . . . . . . 208 219 198 31 6 9
Interest accrued . . . . . . . . . . . . . . . . . . . . . . . . . . . . . . . . . . . . . . . . . . . . 19 11 — — — —
Current maturities of long-term debt . . . . . . . . . . . . . . . . . . . . . . . . . . . . . . 13 41 3 2 5 9
Other . . . . . . . . . . . . . . . . . . . . . . . . . . . . . . . . . . . . . . . . . . . . . . . . . . . 108 27 16 13 12 3
Total current liabilities . . . . . . . . . . . . . . . . . . . . . . . . . . . . . . . . . . . . . . . . 369 349 395 149 66 44
LONG-TERM DEBT . . . . . . . . . . . . . . . . . . . . . . . . . . . . . . . . . . . . . . . . . 1,367 1,331 112 213 175 185
DEFERRED CREDITS AND OTHER LIABILITIESDeferred income taxes . . . . . . . . . . . . . . . . . . . . . . . . . . . . . . . . . . . . . . . 101 72 69 81 74 52
Other . . . . . . . . . . . . . . . . . . . . . . . . . . . . . . . . . . . . . . . . . . . . . . . . . . . 44 40 29 20 24 25
Total deferred credits and other liabilities . . . . . . . . . . . . . . . . . . . . . . . . . . 145 112 98 101 98 77
MINORITY INTERESTS . . . . . . . . . . . . . . . . . . . . . . . . . . . . . . . . . . . . . . 21 19 4 2 1 1
COMMON STOCKHOLDERS’ EQUITYCommon stock . . . . . . . . . . . . . . . . . . . . . . . . . . . . . . . . . . . . . . . . . . . . . — — — 1 1 1
Additional paid-in capital . . . . . . . . . . . . . . . . . . . . . . . . . . . . . . . . . . . . . (1,059) (1,027) — 161 151 128
Retained earnings . . . . . . . . . . . . . . . . . . . . . . . . . . . . . . . . . . . . . . . . . . 1,444 1,378 1,358 405 326 260
Accumulated other comprehensive loss . . . . . . . . . . . . . . . . . . . . . . . . . . . (2 ) — — — — —
Total common stockholders’ equity . . . . . . . . . . . . . . . . . . . . . . . . . . . . . . . 383 351 1,358 567 478 389
TOTAL LIABILITIES AND STOCKHOLDERS’ EQUITY . . . . . . . . . . . . . . . . . $ 2,285 $ 2,162 $1,967 $1,032 $818 $696
Duke Energy is an Equal Opportunity Employer.This report is published solely to inform shareholders and is not to be considered an offer, or the solicitation of an offer, to buy or sell securities.
This report was printed in the USA on recycled paper.
Published June 8, 2003.
©2003 Duke Energy Corporation. All Rights Reserved.
Duke Ventures
BALANCE SHEET - LIABILITIES AND STOCKHOLDERS’ EQUITY

DUKE ENERGY CORPORATION Attachment A
RECONCILIATION OF EBIT TO NET INCOME
2002 2001(in millions) Q1 Q2 Q3 Q4 Total Q1 Q2 Q3 Q4 Total
Earnings Before Interest and Taxes (EBIT) 761$ 1,047$ 668$ 393$ 2,869$ 1,254$ 902$ 1,529$ 571$ 4,256$
Interest Expense 189 264 316 341 1,110 213 202 191 179 785 Minority Interest Expense (Benefit) 32 62 14 (1) 107 160 45 62 60 327
Earnings Before Income Taxes 540 721 338 53 1,652 881 655 1,276 332 3,144 Income Taxes 158 247 108 105 618 327 236 480 107 1,150
Income (Loss) before Cumulative Effect of Change in Accounting Principle 382 474 230 (52) 1,034 554 419 796 225 1,994
Cumulative Effect of Change in Accounting Principle, net of tax - - - - - (96) - - - (96) Net Income (Loss) 382$ 474$ 230$ (52)$ 1,034$ 458$ 419$ 796$ 225$ 1,898$
2000 1999Q1 Q2 Q3 Q4 Total Q1 Q2 Q3 Q4 Total
Earnings Before Interest and Taxes (EBIT) 859$ 837$ 1,556$ 762$ 4,014$ 683$ 568$ 908$ (116)$ 2,043$
Interest Expense 185 228 257 241 911 132 120 153 196 601 Minority Interest Expense 31 89 31 156 307 35 33 31 43 142
Earnings (Loss) Before Income Taxes 643 520 1,268 365 2,796 516 415 724 (355) 1,300 Income Taxes 250 191 498 81 1,020 209 127 283 (166) 453
Income (Loss) before Extraordinary Item 393 329 770 284 1,776 307 288 441 (189) 847 Extraordinary Gain, net of tax - - - - - 660 - - - 660
Net Income (Loss) 393$ 329$ 770$ 284$ 1,776$ 967$ 288$ 441$ (189)$ 1,507$

DUKE ENERGY CORPORATION Attachment B
CONSOLIDATING INCOME STATEMENT
Natural Duke Energy Other Year EndedReconciliation of Operating Revenues Franchised Gas Field North International Energy Duke Other Eliminations/ December 31,(In millions) Electric Transmission Services America Energy Services Ventures Operations Adjustments 20022002
Total operating revenues as presented in 10-K 4,888$ 2,602$ 5,526$ 1,596$ 937$ 405$ 547$ (113)$ (725)$ 15,663$ Equity in earnings of unconsolidated affiliates - (106) (60) (44) (65) (107) - 162 220 - Gains on sale of assets and equity investments - (32) - - - - (33) (52) 117 -
Total operating revenues as presented in Stat Supplement 4,888$ 2,464$ 5,466$ 1,552$ 872$ 298$ 514$ (3)$ (388)$ 15,663$
2001
Operating revenues as presented in 10-K 4,746$ 1,105$ 8,078$ 3,297$ 830$ 534$ 646$ Equity in earnings of unconsolidated affiliates - (45) (45) (35) (39) (49) (2) Gains on sale of assets and equity investments - - - (229) - - -
Operating revenues as presented in Stat Supplement 4,746$ 1,060$ 8,033$ 3,033$ 791$ 485$ 644$
2000
Operating revenues as presented in 10-K 4,946$ 1,131$ 6,165$ 2,233$ 805$ 850$ 797$ Equity in earnings of unconsolidated affiliates - (17) (39) (45) (43) 22 9 Gains on sale of assets and equity investments - - - (160) (54) - (407)
Operating revenues as presented in Stat Supplement 4,946$ 1,114$ 6,126$ 2,028$ 708$ 872$ 399$
Reconciliation of Operating Income(In millions)2002Operating income as presented in 10-K 1,559$ 1,182$ 161$ 89$ (144)$ 46$ 201$ Equity in earnings of unconsolidated affiliates - (106) (60) (44) (65) (107) - (Gains) losses on sale of assets and equity investments - (32) - - - 15 -
Operating income as presented in Stat Supplement 1,559$ 1,044$ 101$ 45$ (209)$ (46)$ 201$
2001Operating income as presented in 10-K 1,561$ 601$ 497$ 1,529$ 273$ (154)$ 185$ Equity in earnings of unconsolidated affiliates - (45) (45) (35) (39) (49) (2) Losses on sale of assets - - - - 9 - -
Operating income as presented in Stat Supplement 1,561$ 556$ 452$ 1,494$ 243$ (203)$ 183$
2000Operating income as presented in 10-K 1,746$ 550$ 440$ 455$ 322$ (10)$ 568$ Equity in earnings of unconsolidated affiliates - (17) (39) (45) (43) 22 9 Gains on sale of equity investments - - - - - - (407)
Operating income as presented in Stat Supplement 1,746$ 533$ 401$ 410$ 279$ 12$ 170$