Duke-Energy 2005_Stat
48
2005 Statistical Supplement
-
Upload
finance21 -
Category
Economy & Finance
-
view
409 -
download
0
Transcript of Duke-Energy 2005_Stat

2005 Statistical Supplement

1Contents
CONTENTS
2 CONSOLIDATED DATA
2 Financial Highlights
3 Earnings Before Interest and Taxes byBusiness Segment
4 Consolidating Statement of Operations
5 Consolidated Statements of Operations
6 Consolidating Balance Sheet
8 Consolidated Balance Sheets
10 Consolidated Statement of Cash Flows
12 Capital and Investment Expenditures
13 Long-Term Debt
16 Capitalization
17 FRANCHISED ELECTRIC
18 Segment Earnings Before Interest and Taxes
19 Segment Balance Sheets
21 Operating Statistics
23 NATURAL GAS TRANSMISSION
24 Segment Earnings Before Interest and Taxes
25 Segment Balance Sheets
27 Operating Statistics
28 FIELD SERVICES
29 Segment Earnings Before Interest and Taxes
30 Segment Balance Sheets
32 Operating Statistics
33 DUKE ENERGY NORTH AMERICA
34 Segment Earnings Before Interest and Taxes
35 Balance Sheet
37 Operating Statistics
38 INTERNATIONAL ENERGY
39 Segment Earnings Before Interest and Taxes
40 Segment Balance Sheets
42 Operating Statistics
43 CRESCENT RESOURCES
44 Segment Earnings Before Interest and Taxes
45 Segment Balance Sheets
47 Operating Statistics

2Consolidated Data
Years ended December 31
(In millions, except per share amounts) 2005 2004 2003 2002 2001
COMMON STOCK DATAa
Earnings per share (from continuing operations)Basic . . . . . . . . . . . . . . . . . . . . . . . . . . . . . . . . . . . . . . . . . . . . . . . $ 2.69 $ 1.33 $ 0.06 $ 1.35 $ 1.58Diluted . . . . . . . . . . . . . . . . . . . . . . . . . . . . . . . . . . . . . . . . . . . . . . $ 2.61 $ 1.29 $ 0.06 $ 1.35 $ 1.57
(Loss) earnings per share (from discontinued operations)Basic . . . . . . . . . . . . . . . . . . . . . . . . . . . . . . . . . . . . . . . . . . . . . . . $ (0.75) $ 0.26 $ (1.36) $ (0.13) $ 1.00Diluted . . . . . . . . . . . . . . . . . . . . . . . . . . . . . . . . . . . . . . . . . . . . . . $ (0.73) $ 0.25 $ (1.36) $ (0.13) $ 0.99
Earnings (loss) per share (before cumulative effect of change in accounting principle)Basic . . . . . . . . . . . . . . . . . . . . . . . . . . . . . . . . . . . . . . . . . . . . . . . $ 1.94 $ 1.59 $ (1.30) $ 1.22 $ 2.58Diluted . . . . . . . . . . . . . . . . . . . . . . . . . . . . . . . . . . . . . . . . . . . . . . $ 1.88 $ 1.54 $ (1.30) $ 1.22 $ 2.56
Earnings (loss) per shareBasic . . . . . . . . . . . . . . . . . . . . . . . . . . . . . . . . . . . . . . . . . . . . . . . $ 1.94 $ 1.59 $ (1.48) $ 1.22 $ 2.45Diluted . . . . . . . . . . . . . . . . . . . . . . . . . . . . . . . . . . . . . . . . . . . . . . $ 1.88 $ 1.54 $ (1.48) $ 1.22 $ 2.44
Shares outstanding at year end . . . . . . . . . . . . . . . . . . . . . . . . . . . . . . 928 957 911 895 777Weighted average shares outstanding - basic . . . . . . . . . . . . . . . . . . . . 934 931 903 836 767Weighted average shares outstanding - diluted . . . . . . . . . . . . . . . . . . . 970 966 904 838 773
Dividends paid . . . . . . . . . . . . . . . . . . . . . . . . . . . . . . . . . . . . . . . . . $1,105 $1,065 $1,051 $ 938 $ 871Dividends paid (per share) . . . . . . . . . . . . . . . . . . . . . . . . . . . . . . . . . $ 1.17 $ 1.10 $ 1.10 $ 1.10 $ 1.10Book value (per share) . . . . . . . . . . . . . . . . . . . . . . . . . . . . . . . . . . . . $17.72 $17.18 $15.09 $16.70 $16.33
HISTORICAL REFERENCEa
Market price (per share)High . . . . . . . . . . . . . . . . . . . . . . . . . . . . . . . . . . . . . . . . . . . . . . . $30.55 $26.16 $21.57 $40.00 $47.74Low . . . . . . . . . . . . . . . . . . . . . . . . . . . . . . . . . . . . . . . . . . . . . . . . $24.37 $18.85 $12.21 $16.42 $32.22Close . . . . . . . . . . . . . . . . . . . . . . . . . . . . . . . . . . . . . . . . . . . . . . . $27.45 $25.33 $20.45 $19.54 $39.26
a Data reflects the intra-day high and low stock price.
Duke Energy Corporation
FINANCIAL HIGHLIGHTS

3Consolidated Data
ConsolidatedEarnings (Loss)
Interest Expense, from ContinuingFranchised Natural Gas Field Duke Energy International Minority Interest Operations before
(In millions) Electric Transmission Servicesa North Americab Energy Crescent Expense & Otherb Income Taxes
2005 QUARTERS ENDEDMarch 31 . . . . . . . . . . . . . . . $ 336 $ 411 $ 918 $ — $ 68 $ 52 $ (474) $ 1,311June 30 . . . . . . . . . . . . . . . . 274 304 165 — 86 38 (382) 485Sept 30 . . . . . . . . . . . . . . . . 606 329 701 — 63 120 (408) 1,411Dec 31 . . . . . . . . . . . . . . . . 279 344 162 — 97 104 (377) 609
Total . . . . . . . . . . . . . . . . . . $1,495 $1,388 $1,946 $ — $314 $314 $(1,641) $ 3,816
2004 QUARTERS ENDEDMarch 31 . . . . . . . . . . . . . . . $424 $ 402 $ 88 $ (430) $ 29 $ 60 $ (335) $238June 30 . . . . . . . . . . . . . . . . 338 315 92 (57) 68 87 (295) 548Sept 30 . . . . . . . . . . . . . . . . 453 269 63 (27) 64 43 (337) 528Dec 31 . . . . . . . . . . . . . . . . . 252 343 124 (71) 61 50 (288) 471
Total . . . . . . . . . . . . . . . . . . $1,467 $1,329 $ 367 $ (585) $222 $240 $(1,255) $ 1,785
2003 QUARTERS ENDEDMarch 31 . . . . . . . . . . . . . . . $454 $ 426 $ 28 $(16) $40 $ 1 $ (367) $566June 30 . . . . . . . . . . . . . . . . 316 309 52 154 91 21 (392) 551Sept 30 . . . . . . . . . . . . . . . . 436 284 49 (456) 44 40 (452) (55)Dec 31 . . . . . . . . . . . . . . . . . 197 314 47 (1,358) 40 72 (397) $(1,085)
Total . . . . . . . . . . . . . . . . . . $1,403 $1,333 $ 176 $(1,676) $215 $134 $(1,608) $ (23)
a In July 2005, Duke Energy completed the previously announced agreement with ConocoPhillips to reduce Duke Energy’s ownership interest in DEFS from 69.7% to 50%. Field Services segment dataincludes DEFS as a consolidated entity for periods prior to July 1, 2005 and an equity method investment for periods after June 30, 2005.
b Other includes DENA’s continuing operations for 2005. DENA segment data includes continuing operations for DENA prior to 2005.
Duke Energy Corporation
EARNINGS BEFORE INTEREST AND TAXES FROMCONTINUING OPERATIONS BY BUSINESS SEGMENT

4Consolidated Data
Year EndedFranchised Natural Gas Field International Eliminations/ December 31,
(In millions) Electric Transmission Servicesa Energy Crescent Other Adjustments 2005
OPERATING REVENUESNon-regulated electric, natural gas, natural gas liquids, and other. . . . . . . . . . . . . . . . . . . $ — $ — $5,530 $745 $495 $ 700 $ 191 $ 7,661Regulated electric . . . . . . . . . . . . . . . . . . . . . . . . . . . . . . . . . . . . . . . . . . . . . . . . . . . . 5,432 — — — — — (26) 5,406Regulated natural gas and natural gas liquids . . . . . . . . . . . . . . . . . . . . . . . . . . . . . . . . . — 4,055 — — — — (376) 3,679
Total operating revenues . . . . . . . . . . . . . . . . . . . . . . . . . . . . . . . . . . . . . . . . . . . . . . . . 5,432 4,055 5,530 745 495 700 (211) 16,746
OPERATING EXPENSESNatural gas and petroleum products purchased. . . . . . . . . . . . . . . . . . . . . . . . . . . . . . . . — 1,238 4,641 9 — 466 (75) 6,279Operation, maintenance and other . . . . . . . . . . . . . . . . . . . . . . . . . . . . . . . . . . . . . . . . . 1,442 822 278 181 376 556 (102) 3,553Fuel used in electric generation and purchased power . . . . . . . . . . . . . . . . . . . . . . . . . . . 1,249 — — 257 — 104 (26) 1,584Depreciation and amortization. . . . . . . . . . . . . . . . . . . . . . . . . . . . . . . . . . . . . . . . . . . . 962 458 143 64 1 100 — 1,728Property and other taxes. . . . . . . . . . . . . . . . . . . . . . . . . . . . . . . . . . . . . . . . . . . . . . . . 306 197 28 25 7 9 (1) 571Impairment and other charges. . . . . . . . . . . . . . . . . . . . . . . . . . . . . . . . . . . . . . . . . . . . — — 125 — 15 — — 140
Total operating expenses. . . . . . . . . . . . . . . . . . . . . . . . . . . . . . . . . . . . . . . . . . . . . . . . 3,959 2,715 5,215 536 399 1,235 (204) 13,855
GAINS ON SALES OF INVESTMENTS IN COMMERCIAL AND MULTI-FAMILY REAL ESTATE. . . . . . . . . . . . . . . . . . . . . . . . . . . . . . . . . . . . . . . . . . . — — — — 191 — — 191
GAINS (LOSSES) ON SALES OF OTHER ASSETS, NET . . . . . . . . . . . . . . . . . . . . . . . . . . 7 13 577 — — (62 ) (1 ) 534
OPERATING INCOME (LOSS) . . . . . . . . . . . . . . . . . . . . . . . . . . . . . . . . . . . . . . . . . . . . 1,480 1,353 892 209 287 (597 ) (8 ) 3,616
OTHER INCOME AND EXPENSESEquity in earnings of unconsolidated affiliates . . . . . . . . . . . . . . . . . . . . . . . . . . . . . . . . . — 47 292 114 (1) 11 16 479Gains (losses) on sales and impairments of equity investments . . . . . . . . . . . . . . . . . . . . . — 3 1,258 (20) — — (16) 1,225Other income and expenses, net . . . . . . . . . . . . . . . . . . . . . . . . . . . . . . . . . . . . . . . . . . 15 15 1 23 45 (56 ) 53 96
Total other income and expenses . . . . . . . . . . . . . . . . . . . . . . . . . . . . . . . . . . . . . . . . . . 15 65 1,551 117 44 (45 ) 53 1,800
MINORITY INTEREST EXPENSE b . . . . . . . . . . . . . . . . . . . . . . . . . . . . . . . . . . . . . . . . . — 30 497 12 17 3
EARNINGS BEFORE INTEREST AND TAXES FROM CONTINUING OPERATIONS (EBIT). . . . . . . . . . . . . . . . . . . . . . . . . . . . . . . . . . . . . . . $1,495 $1,388 $1,946 $314 $314 $(645 )
INTEREST EXPENSE . . . . . . . . . . . . . . . . . . . . . . . . . . . . . . . . . . . . . . . . . . . . . . . . . . 1,062MINORITY INTEREST EXPENSE . . . . . . . . . . . . . . . . . . . . . . . . . . . . . . . . . . . . . . . . . . 538
EARNINGS FROM CONTINUING OPERATIONS BEFORE INCOME TAXES . . . . . . . . . . . . 3,816INCOME TAX EXPENSE FROM CONTINUING OPERATIONS . . . . . . . . . . . . . . . . . . . . . . 1,283
INCOME FROM CONTINUING OPERATIONS . . . . . . . . . . . . . . . . . . . . . . . . . . . . . . . . . 2,533
LOSS FROM DISCONTINUED OPERATIONS, NET OF TAX . . . . . . . . . . . . . . . . . . . . . . . (705)
INCOME BEFORE CUMULATIVE EFFECT OF CHANGE IN ACCOUNTING POLICY. . . . . . . 1,828CUMULATIVE EFFECT OF CHANGE IN ACCOUNTING PRINCIPLE, NET OF TAX AND MINORITY INTEREST . . . . . . . . . . . . . . . . . . . . . . . . . . . . . . . . . . . (4 )
NET INCOME . . . . . . . . . . . . . . . . . . . . . . . . . . . . . . . . . . . . . . . . . . . . . . . . . . . . . . . 1,824DIVIDENDS AND PREMIUMS ON REDEMPTION OF PREFERRED AND PREFERENCE STOCK . . . . . . . . . . . . . . . . . . . . . . . . . . . . . . . . . . . . . . . . . . . . 12
EARNINGS AVAILABLE FOR COMMON STOCKHOLDERS . . . . . . . . . . . . . . . . . . . . . . . . $ 1,812
a In July 2005, Duke Energy completed the previously announced agreement with ConocoPhillips to reduce Duke Energy’s ownership interest in DEFS from 69.7% to 50%. Field Services segment dataincludes DEFS as a consolidated entity for periods prior to July 1, 2005 and an equity method investment for periods after June 30, 2005.
b Includes minority interest expense related to EBIT and excludes minority interest expense related to interest and taxes.
Duke Energy Corporation
CONSOLIDATING STATEMENT OF OPERATIONS
5Consolidated Data
Years ended December 31
(In millions) 2005 2004 2003 2002
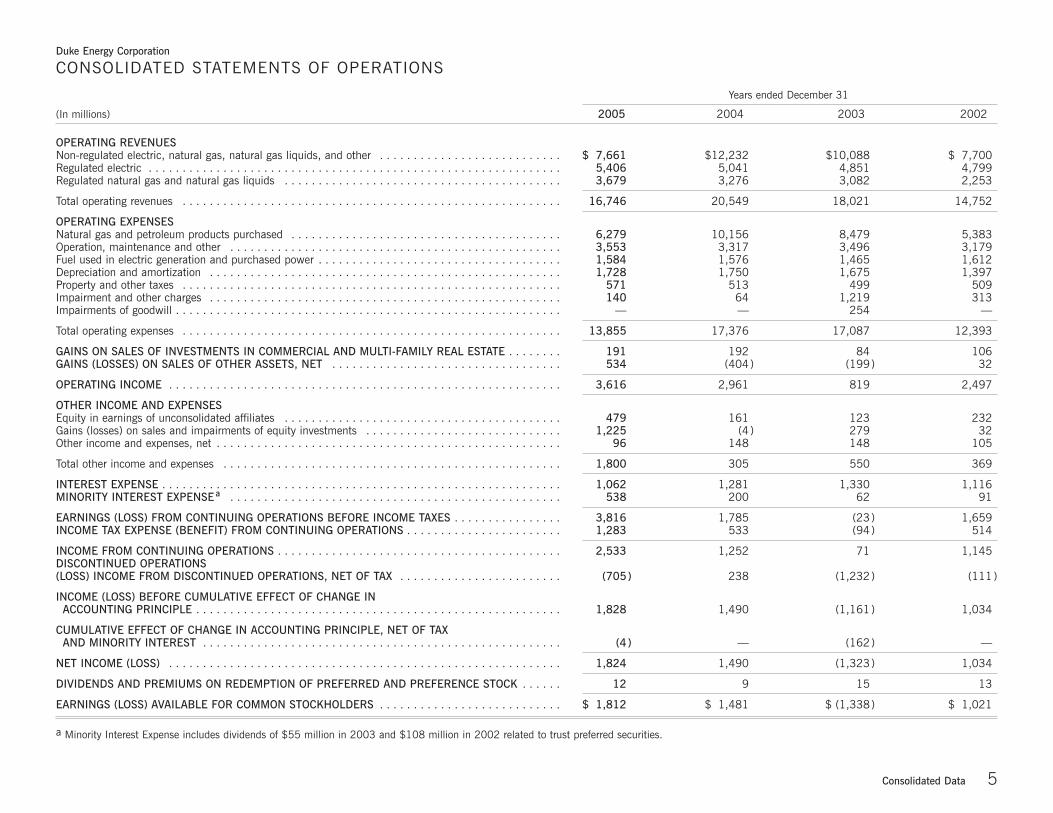
OPERATING REVENUESNon-regulated electric, natural gas, natural gas liquids, and other . . . . . . . . . . . . . . . . . . . . . . . . . . . $ 7,661 $12,232 $10,088 $ 7,700Regulated electric . . . . . . . . . . . . . . . . . . . . . . . . . . . . . . . . . . . . . . . . . . . . . . . . . . . . . . . . . . . . . 5,406 5,041 4,851 4,799Regulated natural gas and natural gas liquids . . . . . . . . . . . . . . . . . . . . . . . . . . . . . . . . . . . . . . . . . 3,679 3,276 3,082 2,253
Total operating revenues . . . . . . . . . . . . . . . . . . . . . . . . . . . . . . . . . . . . . . . . . . . . . . . . . . . . . . . . 16,746 20,549 18,021 14,752
OPERATING EXPENSESNatural gas and petroleum products purchased . . . . . . . . . . . . . . . . . . . . . . . . . . . . . . . . . . . . . . . . 6,279 10,156 8,479 5,383Operation, maintenance and other . . . . . . . . . . . . . . . . . . . . . . . . . . . . . . . . . . . . . . . . . . . . . . . . . 3,553 3,317 3,496 3,179Fuel used in electric generation and purchased power . . . . . . . . . . . . . . . . . . . . . . . . . . . . . . . . . . . . 1,584 1,576 1,465 1,612Depreciation and amortization . . . . . . . . . . . . . . . . . . . . . . . . . . . . . . . . . . . . . . . . . . . . . . . . . . . . 1,728 1,750 1,675 1,397Property and other taxes . . . . . . . . . . . . . . . . . . . . . . . . . . . . . . . . . . . . . . . . . . . . . . . . . . . . . . . . 571 513 499 509Impairment and other charges . . . . . . . . . . . . . . . . . . . . . . . . . . . . . . . . . . . . . . . . . . . . . . . . . . . . 140 64 1,219 313Impairments of goodwill . . . . . . . . . . . . . . . . . . . . . . . . . . . . . . . . . . . . . . . . . . . . . . . . . . . . . . . . . — — 254 —
Total operating expenses . . . . . . . . . . . . . . . . . . . . . . . . . . . . . . . . . . . . . . . . . . . . . . . . . . . . . . . . 13,855 17,376 17,087 12,393
GAINS ON SALES OF INVESTMENTS IN COMMERCIAL AND MULTI-FAMILY REAL ESTATE . . . . . . . . 191 192 84 106GAINS (LOSSES) ON SALES OF OTHER ASSETS, NET . . . . . . . . . . . . . . . . . . . . . . . . . . . . . . . . . . 534 (404) (199) 32
OPERATING INCOME . . . . . . . . . . . . . . . . . . . . . . . . . . . . . . . . . . . . . . . . . . . . . . . . . . . . . . . . . . 3,616 2,961 819 2,497
OTHER INCOME AND EXPENSESEquity in earnings of unconsolidated affiliates . . . . . . . . . . . . . . . . . . . . . . . . . . . . . . . . . . . . . . . . . 479 161 123 232Gains (losses) on sales and impairments of equity investments . . . . . . . . . . . . . . . . . . . . . . . . . . . . . 1,225 (4) 279 32Other income and expenses, net . . . . . . . . . . . . . . . . . . . . . . . . . . . . . . . . . . . . . . . . . . . . . . . . . . . 96 148 148 105
Total other income and expenses . . . . . . . . . . . . . . . . . . . . . . . . . . . . . . . . . . . . . . . . . . . . . . . . . . 1,800 305 550 369
INTEREST EXPENSE . . . . . . . . . . . . . . . . . . . . . . . . . . . . . . . . . . . . . . . . . . . . . . . . . . . . . . . . . . . 1,062 1,281 1,330 1,116MINORITY INTEREST EXPENSEa . . . . . . . . . . . . . . . . . . . . . . . . . . . . . . . . . . . . . . . . . . . . . . . . . 538 200 62 91
EARNINGS (LOSS) FROM CONTINUING OPERATIONS BEFORE INCOME TAXES . . . . . . . . . . . . . . . . 3,816 1,785 (23) 1,659INCOME TAX EXPENSE (BENEFIT) FROM CONTINUING OPERATIONS . . . . . . . . . . . . . . . . . . . . . . . 1,283 533 (94) 514
INCOME FROM CONTINUING OPERATIONS . . . . . . . . . . . . . . . . . . . . . . . . . . . . . . . . . . . . . . . . . . 2,533 1,252 71 1,145DISCONTINUED OPERATIONS(LOSS) INCOME FROM DISCONTINUED OPERATIONS, NET OF TAX . . . . . . . . . . . . . . . . . . . . . . . . (705) 238 (1,232) (111)
INCOME (LOSS) BEFORE CUMULATIVE EFFECT OF CHANGE IN ACCOUNTING PRINCIPLE . . . . . . . . . . . . . . . . . . . . . . . . . . . . . . . . . . . . . . . . . . . . . . . . . . . . . . 1,828 1,490 (1,161) 1,034
CUMULATIVE EFFECT OF CHANGE IN ACCOUNTING PRINCIPLE, NET OF TAX AND MINORITY INTEREST . . . . . . . . . . . . . . . . . . . . . . . . . . . . . . . . . . . . . . . . . . . . . . . . . . . . . (4) — (162) —
NET INCOME (LOSS) . . . . . . . . . . . . . . . . . . . . . . . . . . . . . . . . . . . . . . . . . . . . . . . . . . . . . . . . . . 1,824 1,490 (1,323) 1,034
DIVIDENDS AND PREMIUMS ON REDEMPTION OF PREFERRED AND PREFERENCE STOCK . . . . . . 12 9 15 13
EARNINGS (LOSS) AVAILABLE FOR COMMON STOCKHOLDERS . . . . . . . . . . . . . . . . . . . . . . . . . . . $ 1,812 $ 1,481 $ (1,338) $ 1,021
a Minority Interest Expense includes dividends of $55 million in 2003 and $108 million in 2002 related to trust preferred securities.
Duke Energy Corporation
CONSOLIDATED STATEMENTS OF OPERATIONS
6Consolidated Data
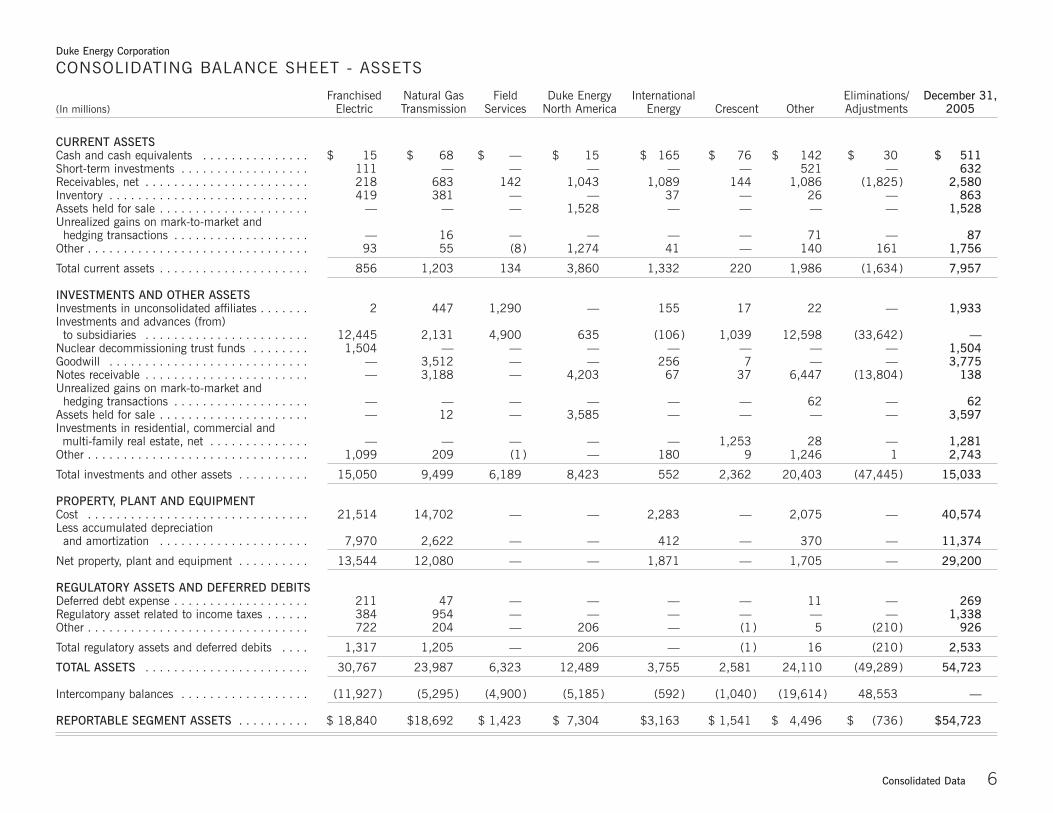
Franchised Natural Gas Field Duke Energy International Eliminations/ December 31,(In millions) Electric Transmission Services North America Energy Crescent Other Adjustments 2005
CURRENT ASSETSCash and cash equivalents . . . . . . . . . . . . . . . $ 15 $ 68 $ — $ 15 $ 165 $ 76 $ 142 $ 30 $ 511Short-term investments . . . . . . . . . . . . . . . . . . 111 — — — — — 521 — 632Receivables, net . . . . . . . . . . . . . . . . . . . . . . . 218 683 142 1,043 1,089 144 1,086 (1,825) 2,580Inventory . . . . . . . . . . . . . . . . . . . . . . . . . . . . 419 381 — — 37 — 26 — 863Assets held for sale . . . . . . . . . . . . . . . . . . . . . — — — 1,528 — — — — 1,528Unrealized gains on mark-to-market and hedging transactions . . . . . . . . . . . . . . . . . . . — 16 — — — — 71 — 87
Other . . . . . . . . . . . . . . . . . . . . . . . . . . . . . . . 93 55 (8) 1,274 41 — 140 161 1,756
Total current assets . . . . . . . . . . . . . . . . . . . . . 856 1,203 134 3,860 1,332 220 1,986 (1,634) 7,957
INVESTMENTS AND OTHER ASSETSInvestments in unconsolidated affiliates . . . . . . . 2 447 1,290 — 155 17 22 — 1,933Investments and advances (from) to subsidiaries . . . . . . . . . . . . . . . . . . . . . . . 12,445 2,131 4,900 635 (106) 1,039 12,598 (33,642) —
Nuclear decommissioning trust funds . . . . . . . . 1,504 — — — — — — — 1,504Goodwill . . . . . . . . . . . . . . . . . . . . . . . . . . . . — 3,512 — — 256 7 — — 3,775Notes receivable . . . . . . . . . . . . . . . . . . . . . . . — 3,188 — 4,203 67 37 6,447 (13,804) 138Unrealized gains on mark-to-market and hedging transactions . . . . . . . . . . . . . . . . . . . — — — — — — 62 — 62
Assets held for sale . . . . . . . . . . . . . . . . . . . . . — 12 — 3,585 — — — — 3,597Investments in residential, commercial andmulti-family real estate, net . . . . . . . . . . . . . . — — — — — 1,253 28 — 1,281
Other . . . . . . . . . . . . . . . . . . . . . . . . . . . . . . . 1,099 209 (1) — 180 9 1,246 1 2,743
Total investments and other assets . . . . . . . . . . 15,050 9,499 6,189 8,423 552 2,362 20,403 (47,445) 15,033
PROPERTY, PLANT AND EQUIPMENTCost . . . . . . . . . . . . . . . . . . . . . . . . . . . . . . . 21,514 14,702 — — 2,283 — 2,075 — 40,574Less accumulated depreciation and amortization . . . . . . . . . . . . . . . . . . . . . 7,970 2,622 — — 412 — 370 — 11,374
Net property, plant and equipment . . . . . . . . . . 13,544 12,080 — — 1,871 — 1,705 — 29,200
REGULATORY ASSETS AND DEFERRED DEBITSDeferred debt expense . . . . . . . . . . . . . . . . . . . 211 47 — — — — 11 — 269Regulatory asset related to income taxes . . . . . . 384 954 — — — — — — 1,338Other . . . . . . . . . . . . . . . . . . . . . . . . . . . . . . . 722 204 — 206 — (1) 5 (210) 926
Total regulatory assets and deferred debits . . . . 1,317 1,205 — 206 — (1) 16 (210) 2,533
TOTAL ASSETS . . . . . . . . . . . . . . . . . . . . . . . 30,767 23,987 6,323 12,489 3,755 2,581 24,110 (49,289) 54,723
Intercompany balances . . . . . . . . . . . . . . . . . . (11,927) (5,295) (4,900) (5,185) (592) (1,040) (19,614) 48,553 —
REPORTABLE SEGMENT ASSETS . . . . . . . . . . $ 18,840 $18,692 $ 1,423 $ 7,304 $3,163 $ 1,541 $ 4,496 $ (736) $54,723
Duke Energy Corporation
CONSOLIDATING BALANCE SHEET - ASSETS
7Consolidated Data
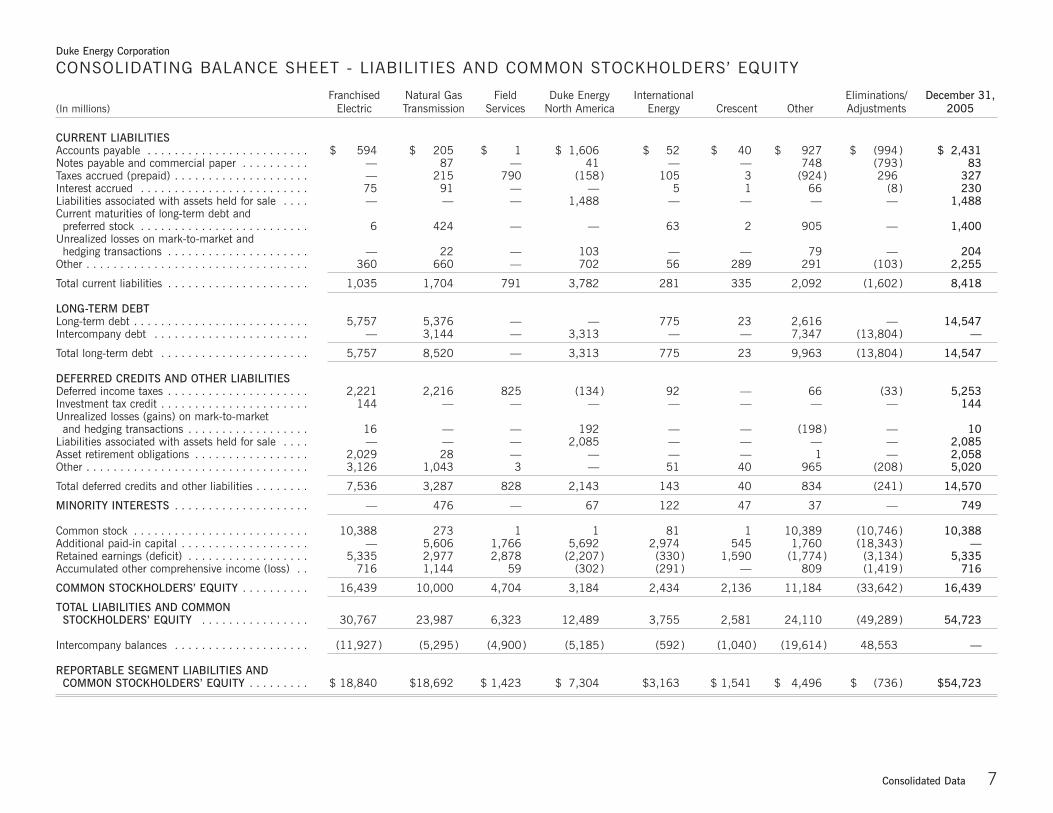
Franchised Natural Gas Field Duke Energy International Eliminations/ December 31,(In millions) Electric Transmission Services North America Energy Crescent Other Adjustments 2005
CURRENT LIABILITIESAccounts payable . . . . . . . . . . . . . . . . . . . . . . . . $ 594 $ 205 $ 1 $ 1,606 $ 52 $ 40 $ 927 $ (994) $ 2,431Notes payable and commercial paper . . . . . . . . . . — 87 — 41 — — 748 (793) 83Taxes accrued (prepaid) . . . . . . . . . . . . . . . . . . . . — 215 790 (158) 105 3 (924) 296 327Interest accrued . . . . . . . . . . . . . . . . . . . . . . . . . 75 91 — — 5 1 66 (8) 230Liabilities associated with assets held for sale . . . . — — — 1,488 — — — — 1,488Current maturities of long-term debt and preferred stock . . . . . . . . . . . . . . . . . . . . . . . . . 6 424 — — 63 2 905 — 1,400
Unrealized losses on mark-to-market and hedging transactions . . . . . . . . . . . . . . . . . . . . . — 22 — 103 — — 79 — 204
Other . . . . . . . . . . . . . . . . . . . . . . . . . . . . . . . . . 360 660 — 702 56 289 291 (103) 2,255
Total current liabilities . . . . . . . . . . . . . . . . . . . . . 1,035 1,704 791 3,782 281 335 2,092 (1,602) 8,418
LONG-TERM DEBTLong-term debt . . . . . . . . . . . . . . . . . . . . . . . . . . 5,757 5,376 — — 775 23 2,616 — 14,547Intercompany debt . . . . . . . . . . . . . . . . . . . . . . . — 3,144 — 3,313 — — 7,347 (13,804) —
Total long-term debt . . . . . . . . . . . . . . . . . . . . . . 5,757 8,520 — 3,313 775 23 9,963 (13,804) 14,547
DEFERRED CREDITS AND OTHER LIABILITIESDeferred income taxes . . . . . . . . . . . . . . . . . . . . . 2,221 2,216 825 (134) 92 — 66 (33) 5,253Investment tax credit . . . . . . . . . . . . . . . . . . . . . . 144 — — — — — — — 144Unrealized losses (gains) on mark-to-market and hedging transactions . . . . . . . . . . . . . . . . . . 16 — — 192 — — (198) — 10
Liabilities associated with assets held for sale . . . . — — — 2,085 — — — — 2,085Asset retirement obligations . . . . . . . . . . . . . . . . . 2,029 28 — — — — 1 — 2,058Other . . . . . . . . . . . . . . . . . . . . . . . . . . . . . . . . . 3,126 1,043 3 — 51 40 965 (208) 5,020
Total deferred credits and other liabilities . . . . . . . . 7,536 3,287 828 2,143 143 40 834 (241) 14,570
MINORITY INTERESTS . . . . . . . . . . . . . . . . . . . . — 476 — 67 122 47 37 — 749
Common stock . . . . . . . . . . . . . . . . . . . . . . . . . . 10,388 273 1 1 81 1 10,389 (10,746) 10,388Additional paid-in capital . . . . . . . . . . . . . . . . . . . — 5,606 1,766 5,692 2,974 545 1,760 (18,343) —Retained earnings (deficit) . . . . . . . . . . . . . . . . . . 5,335 2,977 2,878 (2,207) (330) 1,590 (1,774) (3,134) 5,335Accumulated other comprehensive income (loss) . . 716 1,144 59 (302) (291) — 809 (1,419) 716
COMMON STOCKHOLDERS’ EQUITY . . . . . . . . . . 16,439 10,000 4,704 3,184 2,434 2,136 11,184 (33,642) 16,439
TOTAL LIABILITIES AND COMMON STOCKHOLDERS’ EQUITY . . . . . . . . . . . . . . . . 30,767 23,987 6,323 12,489 3,755 2,581 24,110 (49,289) 54,723
Intercompany balances . . . . . . . . . . . . . . . . . . . . (11,927) (5,295) (4,900) (5,185) (592) (1,040) (19,614) 48,553 —
REPORTABLE SEGMENT LIABILITIES AND COMMON STOCKHOLDERS’ EQUITY . . . . . . . . . $ 18,840 $18,692 $ 1,423 $ 7,304 $3,163 $ 1,541 $ 4,496 $ (736) $54,723
Duke Energy Corporation
CONSOLIDATING BALANCE SHEET - LIABILITIES AND COMMON STOCKHOLDERS’ EQUITY

8Consolidated Data
December 31
(In millions) 2005 2004 2003 2002 2001
CURRENT ASSETSCash and cash equivalents . . . . . . . . . . . . . . . . . . . . . . . . . . . . . . . . . . . . . . . . $ 511 $ 533 $ 397 $ 382 $ 290Short-term investments . . . . . . . . . . . . . . . . . . . . . . . . . . . . . . . . . . . . . . . . . . 632 1,319 763 492 —Receivables, net . . . . . . . . . . . . . . . . . . . . . . . . . . . . . . . . . . . . . . . . . . . . . . . 2,580 3,184 2,953 4,861 5,301Inventory . . . . . . . . . . . . . . . . . . . . . . . . . . . . . . . . . . . . . . . . . . . . . . . . . . . . 863 942 941 971 863Assets held for sale . . . . . . . . . . . . . . . . . . . . . . . . . . . . . . . . . . . . . . . . . . . . . 1,528 40 361 — —Unrealized gains on mark-to-market and hedging transactions . . . . . . . . . . . . . . . 87 962 1,566 2,144 2,326Other . . . . . . . . . . . . . . . . . . . . . . . . . . . . . . . . . . . . . . . . . . . . . . . . . . . . . . . 1,756 938 694 887 667
Total current assets . . . . . . . . . . . . . . . . . . . . . . . . . . . . . . . . . . . . . . . . . . . . . 7,957 7,918 7,675 9,737 9,447
INVESTMENTS AND OTHER ASSETSInvestments in unconsolidated affiliates . . . . . . . . . . . . . . . . . . . . . . . . . . . . . . . 1,933 1,292 1,398 2,015 1,480Nuclear decommissioning trust funds . . . . . . . . . . . . . . . . . . . . . . . . . . . . . . . . 1,504 1,374 925 708 716Goodwill . . . . . . . . . . . . . . . . . . . . . . . . . . . . . . . . . . . . . . . . . . . . . . . . . . . . 3,775 4,148 3,962 3,747 1,730Notes receivable . . . . . . . . . . . . . . . . . . . . . . . . . . . . . . . . . . . . . . . . . . . . . . . 138 232 260 589 576Unrealized gains on mark-to-market and hedging transactions . . . . . . . . . . . . . . . 62 1,379 1,857 2,480 3,117Assets held for sale . . . . . . . . . . . . . . . . . . . . . . . . . . . . . . . . . . . . . . . . . . . . . 3,597 84 1,444 — —Investments in residential, commercial and multi-family real estate, net . . . . . . . . 1,281 1,128 1,353 1,440 1,253Other . . . . . . . . . . . . . . . . . . . . . . . . . . . . . . . . . . . . . . . . . . . . . . . . . . . . . . . 2,743 1,949 2,137 1,645 1,612
Total investments and other assets . . . . . . . . . . . . . . . . . . . . . . . . . . . . . . . . . . 15,033 11,586 13,336 12,624 10,484
PROPERTY, PLANT AND EQUIPMENTCost . . . . . . . . . . . . . . . . . . . . . . . . . . . . . . . . . . . . . . . . . . . . . . . . . . . . . . . . 40,574 46,806 45,987 47,368 38,345Less accumulated depreciation and amortization . . . . . . . . . . . . . . . . . . . . . . . . 11,374 13,000 11,879 11,266 9,936
Net property, plant and equipment . . . . . . . . . . . . . . . . . . . . . . . . . . . . . . . . . . 29,200 33,806 34,108 36,102 28,409
REGULATORY ASSETS AND DEFERRED DEBITSDeferred debt expense . . . . . . . . . . . . . . . . . . . . . . . . . . . . . . . . . . . . . . . . . . . 269 297 275 263 203Regulatory assets related to income taxes . . . . . . . . . . . . . . . . . . . . . . . . . . . . . 1,338 1,269 1,152 936 510Other . . . . . . . . . . . . . . . . . . . . . . . . . . . . . . . . . . . . . . . . . . . . . . . . . . . . . . . 926 894 939 460 571
Total regulatory assets and deferred debits . . . . . . . . . . . . . . . . . . . . . . . . . . . . . 2,533 2,460 2,366 1,659 1,284
TOTAL ASSETS . . . . . . . . . . . . . . . . . . . . . . . . . . . . . . . . . . . . . . . . . . . . . . . . $54,723 $55,770 $57,485 $60,122 $49,624
Duke Energy Corporation
CONSOLIDATED BALANCE SHEETS - ASSETS
9Consolidated Data
Duke Energy Corporation
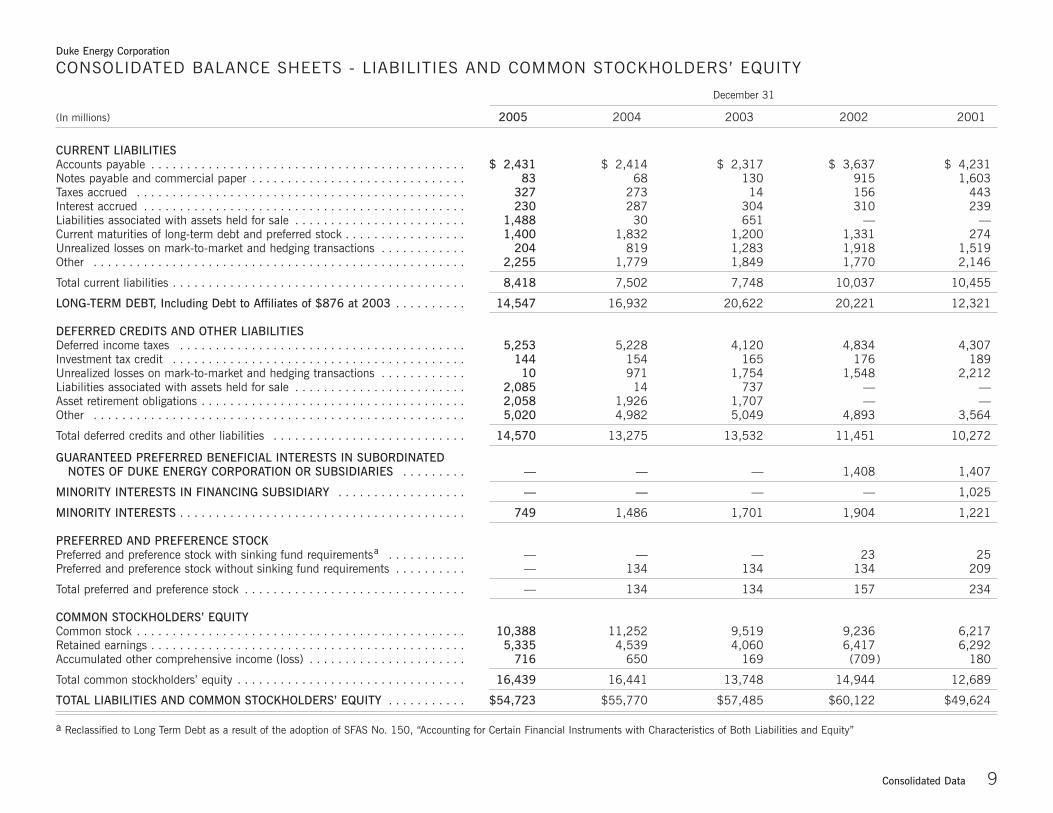
CONSOLIDATED BALANCE SHEETS - LIABILITIES AND COMMON STOCKHOLDERS’ EQUITY
December 31
(In millions) 2005 2004 2003 2002 2001
CURRENT LIABILITIESAccounts payable . . . . . . . . . . . . . . . . . . . . . . . . . . . . . . . . . . . . . . . . . . . . $ 2,431 $ 2,414 $ 2,317 $ 3,637 $ 4,231Notes payable and commercial paper . . . . . . . . . . . . . . . . . . . . . . . . . . . . . . 83 68 130 915 1,603Taxes accrued . . . . . . . . . . . . . . . . . . . . . . . . . . . . . . . . . . . . . . . . . . . . . . 327 273 14 156 443Interest accrued . . . . . . . . . . . . . . . . . . . . . . . . . . . . . . . . . . . . . . . . . . . . . 230 287 304 310 239Liabilities associated with assets held for sale . . . . . . . . . . . . . . . . . . . . . . . . 1,488 30 651 — —Current maturities of long-term debt and preferred stock . . . . . . . . . . . . . . . . . 1,400 1,832 1,200 1,331 274Unrealized losses on mark-to-market and hedging transactions . . . . . . . . . . . . 204 819 1,283 1,918 1,519Other . . . . . . . . . . . . . . . . . . . . . . . . . . . . . . . . . . . . . . . . . . . . . . . . . . . . 2,255 1,779 1,849 1,770 2,146
Total current liabilities . . . . . . . . . . . . . . . . . . . . . . . . . . . . . . . . . . . . . . . . . 8,418 7,502 7,748 10,037 10,455
LONG-TERM DEBT, Including Debt to Affiliates of $876 at 2003 . . . . . . . . . . 14,547 16,932 20,622 20,221 12,321
DEFERRED CREDITS AND OTHER LIABILITIESDeferred income taxes . . . . . . . . . . . . . . . . . . . . . . . . . . . . . . . . . . . . . . . . 5,253 5,228 4,120 4,834 4,307Investment tax credit . . . . . . . . . . . . . . . . . . . . . . . . . . . . . . . . . . . . . . . . . 144 154 165 176 189Unrealized losses on mark-to-market and hedging transactions . . . . . . . . . . . . 10 971 1,754 1,548 2,212Liabilities associated with assets held for sale . . . . . . . . . . . . . . . . . . . . . . . . 2,085 14 737 — —Asset retirement obligations . . . . . . . . . . . . . . . . . . . . . . . . . . . . . . . . . . . . . 2,058 1,926 1,707 — —Other . . . . . . . . . . . . . . . . . . . . . . . . . . . . . . . . . . . . . . . . . . . . . . . . . . . . 5,020 4,982 5,049 4,893 3,564
Total deferred credits and other liabilities . . . . . . . . . . . . . . . . . . . . . . . . . . . 14,570 13,275 13,532 11,451 10,272
GUARANTEED PREFERRED BENEFICIAL INTERESTS IN SUBORDINATEDNOTES OF DUKE ENERGY CORPORATION OR SUBSIDIARIES . . . . . . . . . — — — 1,408 1,407
MINORITY INTERESTS IN FINANCING SUBSIDIARY . . . . . . . . . . . . . . . . . . — — — — 1,025
MINORITY INTERESTS . . . . . . . . . . . . . . . . . . . . . . . . . . . . . . . . . . . . . . . . 749 1,486 1,701 1,904 1,221
PREFERRED AND PREFERENCE STOCKPreferred and preference stock with sinking fund requirementsa . . . . . . . . . . . — — — 23 25Preferred and preference stock without sinking fund requirements . . . . . . . . . . — 134 134 134 209
Total preferred and preference stock . . . . . . . . . . . . . . . . . . . . . . . . . . . . . . . — 134 134 157 234
COMMON STOCKHOLDERS’ EQUITYCommon stock . . . . . . . . . . . . . . . . . . . . . . . . . . . . . . . . . . . . . . . . . . . . . . 10,388 11,252 9,519 9,236 6,217Retained earnings . . . . . . . . . . . . . . . . . . . . . . . . . . . . . . . . . . . . . . . . . . . . 5,335 4,539 4,060 6,417 6,292Accumulated other comprehensive income (loss) . . . . . . . . . . . . . . . . . . . . . . 716 650 169 (709) 180
Total common stockholders’ equity . . . . . . . . . . . . . . . . . . . . . . . . . . . . . . . . 16,439 16,441 13,748 14,944 12,689
TOTAL LIABILITIES AND COMMON STOCKHOLDERS’ EQUITY . . . . . . . . . . . $54,723 $55,770 $57,485 $60,122 $49,624
a Reclassified to Long Term Debt as a result of the adoption of SFAS No. 150, “Accounting for Certain Financial Instruments with Characteristics of Both Liabilities and Equity”

10Consolidated Data
Years ended December 31
(In millions) 2005 2004 2003 2002
CASH FLOWS FROM OPERATING ACTIVITIESNet income (loss) . . . . . . . . . . . . . . . . . . . . . . . . . . . . . . . . . . . . . . . . . . . . . . . . . . . . . . . . . . . . . . $ 1,824 $ 1,490 $ (1,323) $ 1,034Adjustments to reconcile net income (loss) to net cash provided by operating activities:
Depreciation and amortization (including amortization of nuclear fuel) . . . . . . . . . . . . . . . . . . . . . . . . 1,884 2,037 1,987 1,692Cumulative effect of change in accounting principle . . . . . . . . . . . . . . . . . . . . . . . . . . . . . . . . . . . . . 4 — 162 —Gains on sales of investments in commercial and multi-family real estate . . . . . . . . . . . . . . . . . . . . . . (191) (201) (103) (106)Gains on sales of equity investments and other assets . . . . . . . . . . . . . . . . . . . . . . . . . . . . . . . . . . . (1,646) (193) (86) (81)Impairment charges . . . . . . . . . . . . . . . . . . . . . . . . . . . . . . . . . . . . . . . . . . . . . . . . . . . . . . . . . . . 36 194 3,495 545Deferred income taxes . . . . . . . . . . . . . . . . . . . . . . . . . . . . . . . . . . . . . . . . . . . . . . . . . . . . . . . . . . 282 867 (534) 495Minority Interest . . . . . . . . . . . . . . . . . . . . . . . . . . . . . . . . . . . . . . . . . . . . . . . . . . . . . . . . . . . . . . 538 195 61 116Equity in earnings of unconsolidated affiliates . . . . . . . . . . . . . . . . . . . . . . . . . . . . . . . . . . . . . . . . . (479) (161) (123) (218)Purchased capacity levelization . . . . . . . . . . . . . . . . . . . . . . . . . . . . . . . . . . . . . . . . . . . . . . . . . . . (14) 92 194 175Contribution to company-sponsored pension plans . . . . . . . . . . . . . . . . . . . . . . . . . . . . . . . . . . . . . . (45) (279) (194) (9)
(Increase) decrease inNet realized and unrealized mark-to-market and hedging transactions . . . . . . . . . . . . . . . . . . . . . . . . 468 216 (15) 596Receivables . . . . . . . . . . . . . . . . . . . . . . . . . . . . . . . . . . . . . . . . . . . . . . . . . . . . . . . . . . . . . . . . . (255) (231) 1,188 8Inventory . . . . . . . . . . . . . . . . . . . . . . . . . . . . . . . . . . . . . . . . . . . . . . . . . . . . . . . . . . . . . . . . . . . (80) (48) (30) 134Other current assets . . . . . . . . . . . . . . . . . . . . . . . . . . . . . . . . . . . . . . . . . . . . . . . . . . . . . . . . . . . (944) (33) (104) (335)
Increase (decrease) inAccounts payable . . . . . . . . . . . . . . . . . . . . . . . . . . . . . . . . . . . . . . . . . . . . . . . . . . . . . . . . . . . . . 81 (5) (1,047) 798Taxes accrued . . . . . . . . . . . . . . . . . . . . . . . . . . . . . . . . . . . . . . . . . . . . . . . . . . . . . . . . . . . . . . . . 53 188 (168) (332)Other current liabilities . . . . . . . . . . . . . . . . . . . . . . . . . . . . . . . . . . . . . . . . . . . . . . . . . . . . . . . . . 622 91 70 (194)
Capital expenditures for residential real estate . . . . . . . . . . . . . . . . . . . . . . . . . . . . . . . . . . . . . . . . . . (355) (322) (196) (179)Cost of residential real estate sold . . . . . . . . . . . . . . . . . . . . . . . . . . . . . . . . . . . . . . . . . . . . . . . . . . . 294 268 167 117Other, assets . . . . . . . . . . . . . . . . . . . . . . . . . . . . . . . . . . . . . . . . . . . . . . . . . . . . . . . . . . . . . . . . . . 191 (155) (162) 417Other, liabilities . . . . . . . . . . . . . . . . . . . . . . . . . . . . . . . . . . . . . . . . . . . . . . . . . . . . . . . . . . . . . . . . 533 158 165 (484)
NET CASH PROVIDED BY OPERATING ACTIVITIES . . . . . . . . . . . . . . . . . . . . . . . . . . . . . . . . . . . . . 2,801 4,168 3,404 4,189
CASH FLOWS FROM INVESTING ACTIVITIESCapital expenditures . . . . . . . . . . . . . . . . . . . . . . . . . . . . . . . . . . . . . . . . . . . . . . . . . . . . . . . . . . . . (2,309) (2,161) (2,260) (4,745)Investment expenditures, net of refund . . . . . . . . . . . . . . . . . . . . . . . . . . . . . . . . . . . . . . . . . . . . . . . (43) (46) (153) (584)Acquisitions, net of cash acquired . . . . . . . . . . . . . . . . . . . . . . . . . . . . . . . . . . . . . . . . . . . . . . . . . . . (294) — — (1,707)Purchases of available-for-sale securities . . . . . . . . . . . . . . . . . . . . . . . . . . . . . . . . . . . . . . . . . . . . . . (41,073) (65,929) (40,451) (12,812)Proceeds from sales and maturities of available-for-sale securities . . . . . . . . . . . . . . . . . . . . . . . . . . . . 40,887 65,098 40,004 12,222Net proceeds from the sales of and distributions from equity investments and other assets, and sales of and collections on notes receivable . . . . . . . . . . . . . . . . . . . . . . . . . . . . . . 2,375 1,619 1,976 526
Proceeds from the sales of commercial and multi-family real estate . . . . . . . . . . . . . . . . . . . . . . . . . . . 372 606 314 169Settlement of net investment hedges and other investing derivatives . . . . . . . . . . . . . . . . . . . . . . . . . . . (321) — — —Distributions from equity investments . . . . . . . . . . . . . . . . . . . . . . . . . . . . . . . . . . . . . . . . . . . . . . . . 383 — — —Other . . . . . . . . . . . . . . . . . . . . . . . . . . . . . . . . . . . . . . . . . . . . . . . . . . . . . . . . . . . . . . . . . . . . . . . (86) 20 (106) (13)
NET CASH USED IN INVESTING ACTIVITIES . . . . . . . . . . . . . . . . . . . . . . . . . . . . . . . . . . . . . . . . . . (109) (793) (676) (6,944)
Duke Energy Corporation
CONSOLIDATED STATEMENT OF CASH FLOWS
11Consolidated Data
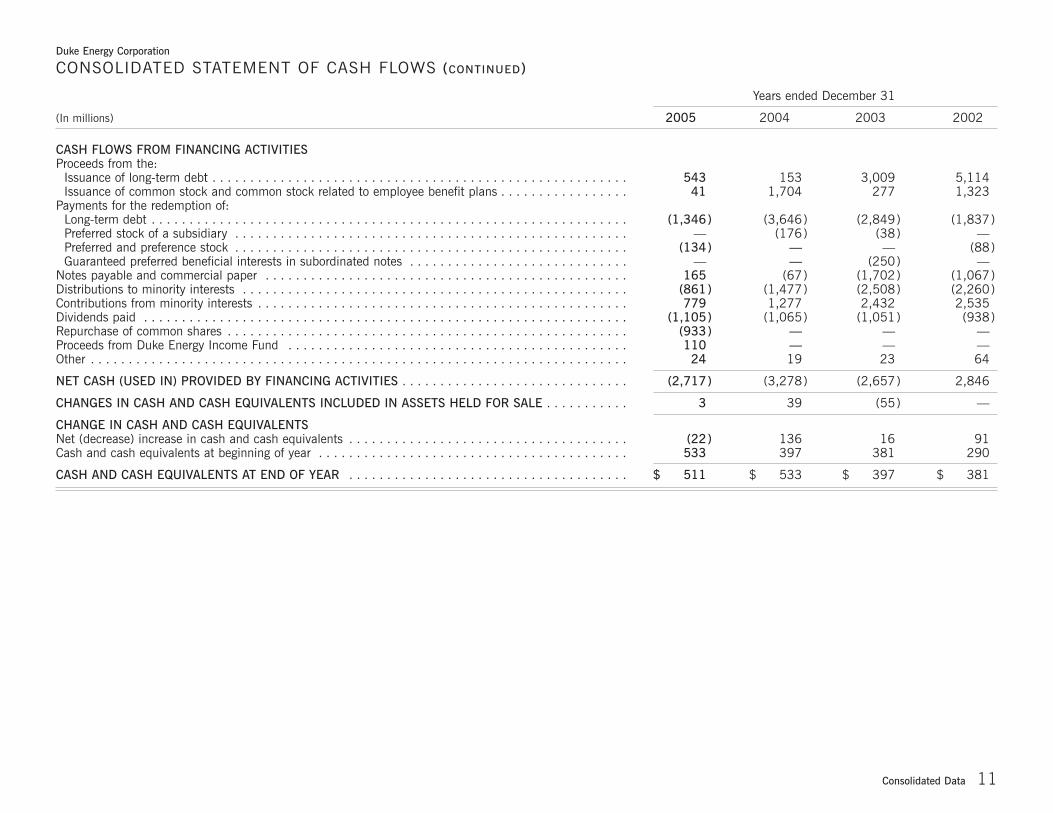
Years ended December 31
(In millions) 2005 2004 2003 2002
CASH FLOWS FROM FINANCING ACTIVITIESProceeds from the:
Issuance of long-term debt . . . . . . . . . . . . . . . . . . . . . . . . . . . . . . . . . . . . . . . . . . . . . . . . . . . . . . . 543 153 3,009 5,114Issuance of common stock and common stock related to employee benefit plans . . . . . . . . . . . . . . . . . 41 1,704 277 1,323
Payments for the redemption of:Long-term debt . . . . . . . . . . . . . . . . . . . . . . . . . . . . . . . . . . . . . . . . . . . . . . . . . . . . . . . . . . . . . . . (1,346) (3,646) (2,849) (1,837)Preferred stock of a subsidiary . . . . . . . . . . . . . . . . . . . . . . . . . . . . . . . . . . . . . . . . . . . . . . . . . . . . — (176) (38) —Preferred and preference stock . . . . . . . . . . . . . . . . . . . . . . . . . . . . . . . . . . . . . . . . . . . . . . . . . . . . (134) — — (88)Guaranteed preferred beneficial interests in subordinated notes . . . . . . . . . . . . . . . . . . . . . . . . . . . . . — — (250) —
Notes payable and commercial paper . . . . . . . . . . . . . . . . . . . . . . . . . . . . . . . . . . . . . . . . . . . . . . . . 165 (67) (1,702) (1,067)Distributions to minority interests . . . . . . . . . . . . . . . . . . . . . . . . . . . . . . . . . . . . . . . . . . . . . . . . . . . (861) (1,477) (2,508) (2,260)Contributions from minority interests . . . . . . . . . . . . . . . . . . . . . . . . . . . . . . . . . . . . . . . . . . . . . . . . . 779 1,277 2,432 2,535Dividends paid . . . . . . . . . . . . . . . . . . . . . . . . . . . . . . . . . . . . . . . . . . . . . . . . . . . . . . . . . . . . . . . . (1,105) (1,065) (1,051) (938)Repurchase of common shares . . . . . . . . . . . . . . . . . . . . . . . . . . . . . . . . . . . . . . . . . . . . . . . . . . . . . (933) — — —Proceeds from Duke Energy Income Fund . . . . . . . . . . . . . . . . . . . . . . . . . . . . . . . . . . . . . . . . . . . . . 110 — — —Other . . . . . . . . . . . . . . . . . . . . . . . . . . . . . . . . . . . . . . . . . . . . . . . . . . . . . . . . . . . . . . . . . . . . . . . 24 19 23 64
NET CASH (USED IN) PROVIDED BY FINANCING ACTIVITIES . . . . . . . . . . . . . . . . . . . . . . . . . . . . . . (2,717) (3,278) (2,657) 2,846
CHANGES IN CASH AND CASH EQUIVALENTS INCLUDED IN ASSETS HELD FOR SALE . . . . . . . . . . . 3 39 (55) —
CHANGE IN CASH AND CASH EQUIVALENTSNet (decrease) increase in cash and cash equivalents . . . . . . . . . . . . . . . . . . . . . . . . . . . . . . . . . . . . . (22) 136 16 91Cash and cash equivalents at beginning of year . . . . . . . . . . . . . . . . . . . . . . . . . . . . . . . . . . . . . . . . . 533 397 381 290
CASH AND CASH EQUIVALENTS AT END OF YEAR . . . . . . . . . . . . . . . . . . . . . . . . . . . . . . . . . . . . . $ 511 $ 533 $ 397 $ 381
Duke Energy Corporation
CONSOLIDATED STATEMENT OF CASH FLOWS (CONTINUED)

12Consolidated Data
Duke Energy Corporation
CAPITAL AND INVESTMENT EXPENDITURES
Years ended December 31
(In millions) 2005 2004 2003 2002 2001
Franchised Electric a . . . . . . . . . . . . . . . . . . . . . . . . . . . . . . . . . . . . . . . $1,332 $1,126 $1,015 $1,269 $1,115
Natural Gas Transmissionc . . . . . . . . . . . . . . . . . . . . . . . . . . . . . . . . . . . 930 544 773 2,902b 938
Field Servicesc,d . . . . . . . . . . . . . . . . . . . . . . . . . . . . . . . . . . . . . . . . . . 86 202 204 285 397
Duke Energy North America . . . . . . . . . . . . . . . . . . . . . . . . . . . . . . . . . . 4 22 277 2,013 3,213
International Energy . . . . . . . . . . . . . . . . . . . . . . . . . . . . . . . . . . . . . . . . 23 28 71 412 442
Crescent e . . . . . . . . . . . . . . . . . . . . . . . . . . . . . . . . . . . . . . . . . . . . . . . 599 568 290 275 452
Other f . . . . . . . . . . . . . . . . . . . . . . . . . . . . . . . . . . . . . . . . . . . . . . . . . 27 39 (21) 136 461
Cash acquired in acquisitions . . . . . . . . . . . . . . . . . . . . . . . . . . . . . . . . . — — — (77) (17)
TOTAL CAPITAL AND INVESTMENT EXPENDITURES . . . . . . . . . . . . . . . $3,001 $2,529 $2,609 $7,215 $7,001
a Amounts include capital and investment expenditures associated with North Carolina clean-air legislation of $301 million in 2005, $106 million in 2004 and $18 million in 2003, which are included inCapital Expenditures within Cash Flows from Investing Activities on the accompanying Statements of Cash Flows
b Includes approximately $1,707 million associated with the acquisition of Westcoast Energy Inc. (Westcoast).
c In connection with the DEFS disposition transaction effective July 1, 2005, DEFS transferred its Canadian natural gas gathering and processing facilities to the Natural Gas Transmission segment. Priorperiod amounts have been retrospectively adjusted to reflect expenditures in the proper segments.
d As a result of the deconsolidation of DEFS, effective July 1, 2005, Field Services amounts for 2005 only include DEFS capital and investment expenditures for periods prior to July 1, 2005.
e Amounts include capital expenditures for residential real estate included in operating cash flows of $355 million in 2005, $322 million in 2004, $196 million in 2003, $179 million in 2002 and $230 million in 2001.
f Amounts for 2001 - 2003 include deferral of the consolidation of 50% of the profit earned by Duke/Fluor Daniel for the construction of Duke Energy North America’s merchant generation plants, which isassociated with Duke Energy’s share of ownership.

13Consolidated Data
Redemption Date of Next NextPrice at Redemption Redemption 2011 and
(In millions) Year Due 12/31/05 (%) Price Change Price (%) 2006 2007 2008 2009 2010 Beyond Total
DUKE ENERGY CORPORATION UNCONSOLIDATEDFirst and Refunding Mortgage Bonds:
3.75% . . . . . . . . . . . . . . . . . . . . . . . . . . . . . . . . . . . . . . . . . . . . . 2008 $ — $ — $ 500 $ — $ — $ — $ 5004.50% . . . . . . . . . . . . . . . . . . . . . . . . . . . . . . . . . . . . . . . . . . . . . 2010 — — — — 200 — 2005.30% . . . . . . . . . . . . . . . . . . . . . . . . . . . . . . . . . . . . . . . . . . . . . 2015 — — — — — 500 500
a 8.95% . . . . . . . . . . . . . . . . . . . . . . . . . . . . . . . . . . . . . . . . . . . . . 2027 — — — — — 14 14
Subtotal, First and Refunding Mortgage Bonds . . . . . . . . . . . . . . . . . . — — 500 — 200 514 1,214
Pollution Control Bonds:Series 1999 (Floating Rate) . . . . . . . . . . . . . . . . . . . . . . . . . . . . . . . 2012 100.000 — — — — — 20 20Series 1990 (Floating Rate) . . . . . . . . . . . . . . . . . . . . . . . . . . . . . . . 2014 100.000 — — — — — 40 40Series 1993 (Floating Rate) . . . . . . . . . . . . . . . . . . . . . . . . . . . . . . . 2017 100.000 — — — — — 77 77Series 1999 (Floating Rate) . . . . . . . . . . . . . . . . . . . . . . . . . . . . . . . 2017 100.000 — — — — — 35 35
Subtotal, Pollution Control Bonds . . . . . . . . . . . . . . . . . . . . . . . . . . . — — — — — 172 172
Notes:4.611% . . . . . . . . . . . . . . . . . . . . . . . . . . . . . . . . . . . . . . . . . . . . 2007 — 110 — — — — 1104.20% . . . . . . . . . . . . . . . . . . . . . . . . . . . . . . . . . . . . . . . . . . . . . 2008 — — 300 — — — 3005.375% . . . . . . . . . . . . . . . . . . . . . . . . . . . . . . . . . . . . . . . . . . . . 2009 — — — 200 — — 2007.375% . . . . . . . . . . . . . . . . . . . . . . . . . . . . . . . . . . . . . . . . . . . . 2010 — — — — 300 — 3005.625% . . . . . . . . . . . . . . . . . . . . . . . . . . . . . . . . . . . . . . . . . . . . 2012 — — — — — 400 4006.25% . . . . . . . . . . . . . . . . . . . . . . . . . . . . . . . . . . . . . . . . . . . . . 2012 — — — — — 750 750
a 6.90% - 9.210% . . . . . . . . . . . . . . . . . . . . . . . . . . . . . . . . . . . . . . 2011-2016 5 5 5 5 5 16 416.60% Retail Notes . . . . . . . . . . . . . . . . . . . . . . . . . . . . . . . . . . . . 2022 4/1/2006 100.000 — — — — — 250 2501.75% Convertible Senior Notes . . . . . . . . . . . . . . . . . . . . . . . . . . . 2023 — — — — — 742 7426.0% . . . . . . . . . . . . . . . . . . . . . . . . . . . . . . . . . . . . . . . . . . . . . . 2028 — — — — — 300 3006.45% . . . . . . . . . . . . . . . . . . . . . . . . . . . . . . . . . . . . . . . . . . . . . 2032 — — — — — 350 350
Subtotal, Notes . . . . . . . . . . . . . . . . . . . . . . . . . . . . . . . . . . . . . . . 5 115 305 205 305 2,808 3,743
Accounts Receivable Securitization . . . . . . . . . . . . . . . . . . . . . . . . . . . 2007 — 300 — — — — 300Other . . . . . . . . . . . . . . . . . . . . . . . . . . . . . . . . . . . . . . . . . . . . . . . . 2010 1 1 2 2 2 — 8Commercial Paper . . . . . . . . . . . . . . . . . . . . . . . . . . . . . . . . . . . . . . . — — — — — 300 300Fair Value Hedge Carrying Value Adjustment . . . . . . . . . . . . . . . . . . . . 2006-2032 — 6 5 5 3 17 36Unamortized Debt Discount/Premium . . . . . . . . . . . . . . . . . . . . . . . . . — (1 ) (1 ) (1 ) (1 ) (6 ) (10 )
Subtotal, Duke Energy Corporation Unconsolidated . . . . . . . . . . . . . . 6 421 811 211 509 3,805 5,763
DUKE CAPITAL LLC UNCONSOLIDATEDNotes:
4.302% . . . . . . . . . . . . . . . . . . . . . . . . . . . . . . . . . . . . . . . . . . . . 2006 400 — — — — — 4004.331% . . . . . . . . . . . . . . . . . . . . . . . . . . . . . . . . . . . . . . . . . . . . 2006 350 — — — — — 3507.50% . . . . . . . . . . . . . . . . . . . . . . . . . . . . . . . . . . . . . . . . . . . . . 2009 — — — 500 — — 5004.37% . . . . . . . . . . . . . . . . . . . . . . . . . . . . . . . . . . . . . . . . . . . . . 2009 — — — 148 — — 1486.25% . . . . . . . . . . . . . . . . . . . . . . . . . . . . . . . . . . . . . . . . . . . . . 2013 — — — — — 500 5005.50% . . . . . . . . . . . . . . . . . . . . . . . . . . . . . . . . . . . . . . . . . . . . . 2014 — — — — — 149 1495.668% . . . . . . . . . . . . . . . . . . . . . . . . . . . . . . . . . . . . . . . . . . . . 2014 — — — — — 408 4086.75% Note B . . . . . . . . . . . . . . . . . . . . . . . . . . . . . . . . . . . . . . . . 2018 — — — — — 150 1508.0% . . . . . . . . . . . . . . . . . . . . . . . . . . . . . . . . . . . . . . . . . . . . . . 2019 — — — — — 500 5006.75% . . . . . . . . . . . . . . . . . . . . . . . . . . . . . . . . . . . . . . . . . . . . . 2032 — — — — — 240 240
Subtotal, Notes . . . . . . . . . . . . . . . . . . . . . . . . . . . . . . . . . . . . . . . 750 — — 648 — 1,947 3,345
Duke/Fluor Daniel Loan (Floating Rate) . . . . . . . . . . . . . . . . . . . . . . . . 2006 4 — — — — — 4Fair Value Hedge Carrying Value Adjustment . . . . . . . . . . . . . . . . . . . . 2009-2025 — 7 7 7 — — 21Unamortized Debt Discount/Premium . . . . . . . . . . . . . . . . . . . . . . . . . — — — — — (3) (3 )
Subtotal, Duke Capital LLC Unconsolidated . . . . . . . . . . . . . . . . . . . . 754 7 7 655 — 1,944 3,367
a Private Placement
Duke Energy Corporation
LONG-TERM DEBT AS OF 12/31/2005
14Consolidated Data
Redemption Date of Next NextPrice at Redemption Redemption 2011 and
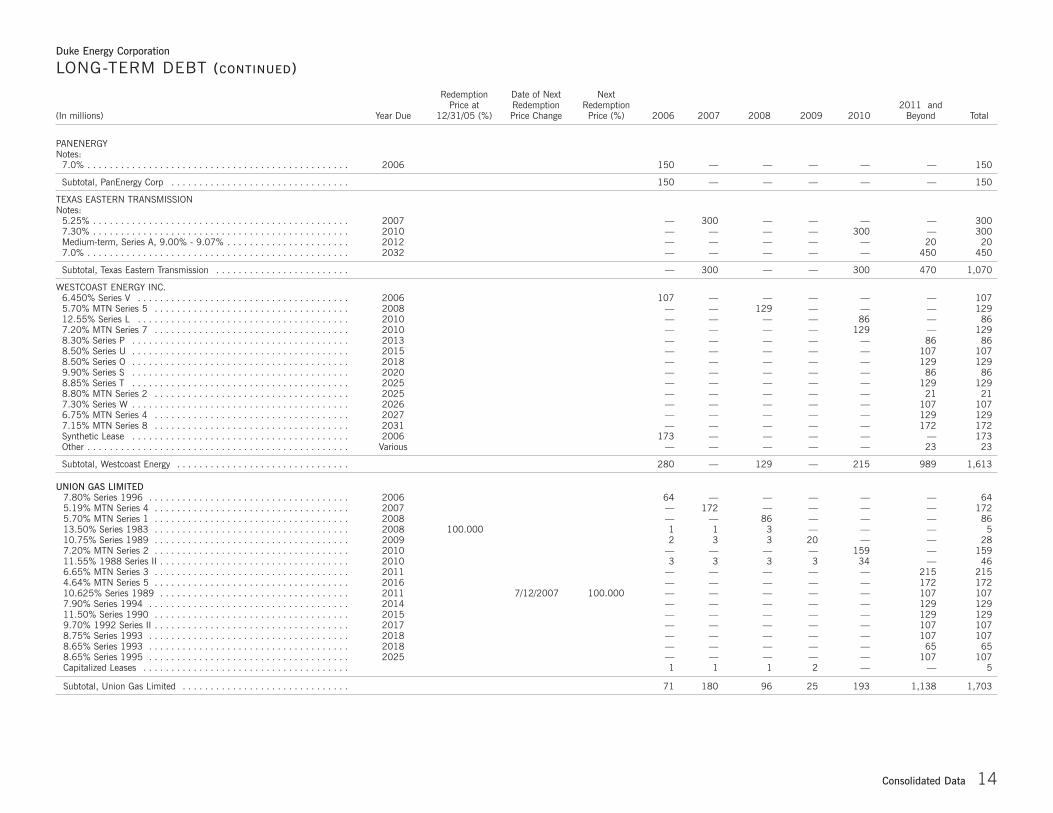
(In millions) Year Due 12/31/05 (%) Price Change Price (%) 2006 2007 2008 2009 2010 Beyond Total
PANENERGY Notes:
7.0% . . . . . . . . . . . . . . . . . . . . . . . . . . . . . . . . . . . . . . . . . . . . . . . 2006 150 — — — — — 150
Subtotal, PanEnergy Corp . . . . . . . . . . . . . . . . . . . . . . . . . . . . . . . . 150 — — — — — 150
TEXAS EASTERN TRANSMISSIONNotes:
5.25% . . . . . . . . . . . . . . . . . . . . . . . . . . . . . . . . . . . . . . . . . . . . . . 2007 — 300 — — — — 3007.30% . . . . . . . . . . . . . . . . . . . . . . . . . . . . . . . . . . . . . . . . . . . . . . 2010 — — — — 300 — 300Medium-term, Series A, 9.00% - 9.07% . . . . . . . . . . . . . . . . . . . . . . 2012 — — — — — 20 207.0% . . . . . . . . . . . . . . . . . . . . . . . . . . . . . . . . . . . . . . . . . . . . . . . 2032 — — — — — 450 450
Subtotal, Texas Eastern Transmission . . . . . . . . . . . . . . . . . . . . . . . . — 300 — — 300 470 1,070
WESTCOAST ENERGY INC.6.450% Series V . . . . . . . . . . . . . . . . . . . . . . . . . . . . . . . . . . . . . . 2006 107 — — — — — 1075.70% MTN Series 5 . . . . . . . . . . . . . . . . . . . . . . . . . . . . . . . . . . . 2008 — — 129 — — — 12912.55% Series L . . . . . . . . . . . . . . . . . . . . . . . . . . . . . . . . . . . . . . 2010 — — — — 86 — 867.20% MTN Series 7 . . . . . . . . . . . . . . . . . . . . . . . . . . . . . . . . . . . 2010 — — — — 129 — 1298.30% Series P . . . . . . . . . . . . . . . . . . . . . . . . . . . . . . . . . . . . . . . 2013 — — — — — 86 868.50% Series U . . . . . . . . . . . . . . . . . . . . . . . . . . . . . . . . . . . . . . . 2015 — — — — — 107 1078.50% Series O . . . . . . . . . . . . . . . . . . . . . . . . . . . . . . . . . . . . . . . 2018 — — — — — 129 1299.90% Series S . . . . . . . . . . . . . . . . . . . . . . . . . . . . . . . . . . . . . . . 2020 — — — — — 86 868.85% Series T . . . . . . . . . . . . . . . . . . . . . . . . . . . . . . . . . . . . . . . 2025 — — — — — 129 1298.80% MTN Series 2 . . . . . . . . . . . . . . . . . . . . . . . . . . . . . . . . . . . 2025 — — — — — 21 217.30% Series W . . . . . . . . . . . . . . . . . . . . . . . . . . . . . . . . . . . . . . . 2026 — — — — — 107 1076.75% MTN Series 4 . . . . . . . . . . . . . . . . . . . . . . . . . . . . . . . . . . . 2027 — — — — — 129 1297.15% MTN Series 8 . . . . . . . . . . . . . . . . . . . . . . . . . . . . . . . . . . . 2031 — — — — — 172 172Synthetic Lease . . . . . . . . . . . . . . . . . . . . . . . . . . . . . . . . . . . . . . . 2006 173 — — — — — 173Other . . . . . . . . . . . . . . . . . . . . . . . . . . . . . . . . . . . . . . . . . . . . . . . Various — — — — — 23 23
Subtotal, Westcoast Energy . . . . . . . . . . . . . . . . . . . . . . . . . . . . . . . 280 — 129 — 215 989 1,613
UNION GAS LIMITED7.80% Series 1996 . . . . . . . . . . . . . . . . . . . . . . . . . . . . . . . . . . . . 2006 64 — — — — — 645.19% MTN Series 4 . . . . . . . . . . . . . . . . . . . . . . . . . . . . . . . . . . . 2007 — 172 — — — — 1725.70% MTN Series 1 . . . . . . . . . . . . . . . . . . . . . . . . . . . . . . . . . . . 2008 — — 86 — — — 8613.50% Series 1983 . . . . . . . . . . . . . . . . . . . . . . . . . . . . . . . . . . . 2008 100.000 1 1 3 — — — 510.75% Series 1989 . . . . . . . . . . . . . . . . . . . . . . . . . . . . . . . . . . . 2009 2 3 3 20 — — 287.20% MTN Series 2 . . . . . . . . . . . . . . . . . . . . . . . . . . . . . . . . . . . 2010 — — — — 159 — 15911.55% 1988 Series II . . . . . . . . . . . . . . . . . . . . . . . . . . . . . . . . . . 2010 3 3 3 3 34 — 466.65% MTN Series 3 . . . . . . . . . . . . . . . . . . . . . . . . . . . . . . . . . . . 2011 — — — — — 215 2154.64% MTN Series 5 . . . . . . . . . . . . . . . . . . . . . . . . . . . . . . . . . . . 2016 — — — — — 172 17210.625% Series 1989 . . . . . . . . . . . . . . . . . . . . . . . . . . . . . . . . . . 2011 7/12/2007 100.000 — — — — — 107 1077.90% Series 1994 . . . . . . . . . . . . . . . . . . . . . . . . . . . . . . . . . . . . 2014 — — — — — 129 12911.50% Series 1990 . . . . . . . . . . . . . . . . . . . . . . . . . . . . . . . . . . . 2015 — — — — — 129 1299.70% 1992 Series II . . . . . . . . . . . . . . . . . . . . . . . . . . . . . . . . . . . 2017 — — — — — 107 1078.75% Series 1993 . . . . . . . . . . . . . . . . . . . . . . . . . . . . . . . . . . . . 2018 — — — — — 107 1078.65% Series 1993 . . . . . . . . . . . . . . . . . . . . . . . . . . . . . . . . . . . . 2018 — — — — — 65 658.65% Series 1995 . . . . . . . . . . . . . . . . . . . . . . . . . . . . . . . . . . . . 2025 — — — — — 107 107Capitalized Leases . . . . . . . . . . . . . . . . . . . . . . . . . . . . . . . . . . . . . 1 1 1 2 — — 5
Subtotal, Union Gas Limited . . . . . . . . . . . . . . . . . . . . . . . . . . . . . . 71 180 96 25 193 1,138 1,703
Duke Energy Corporation
LONG-TERM DEBT (CONTINUED)
15Consolidated Data
Redemption Date of Next NextPrice at Redemption Redemption 2011 and
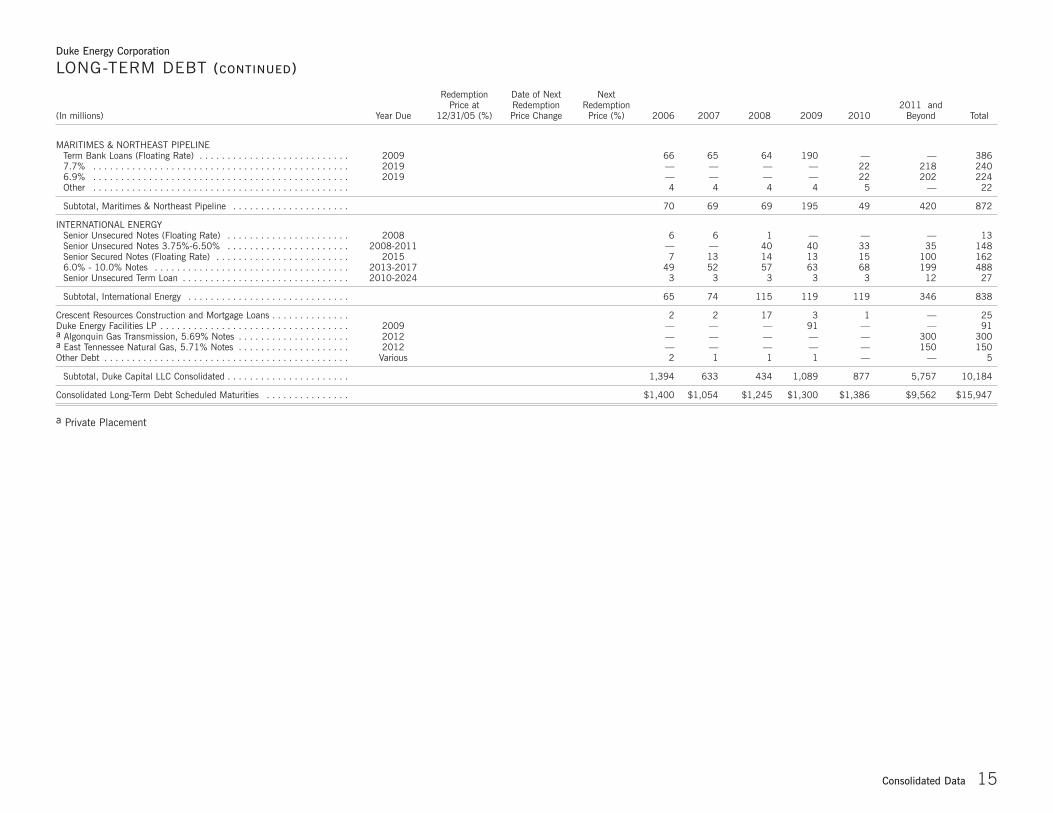
(In millions) Year Due 12/31/05 (%) Price Change Price (%) 2006 2007 2008 2009 2010 Beyond Total
MARITIMES & NORTHEAST PIPELINETerm Bank Loans (Floating Rate) . . . . . . . . . . . . . . . . . . . . . . . . . . . 2009 66 65 64 190 — — 3867.7% . . . . . . . . . . . . . . . . . . . . . . . . . . . . . . . . . . . . . . . . . . . . . . 2019 — — — — 22 218 2406.9% . . . . . . . . . . . . . . . . . . . . . . . . . . . . . . . . . . . . . . . . . . . . . . 2019 — — — — 22 202 224Other . . . . . . . . . . . . . . . . . . . . . . . . . . . . . . . . . . . . . . . . . . . . . . 4 4 4 4 5 — 22
Subtotal, Maritimes & Northeast Pipeline . . . . . . . . . . . . . . . . . . . . . 70 69 69 195 49 420 872
INTERNATIONAL ENERGYSenior Unsecured Notes (Floating Rate) . . . . . . . . . . . . . . . . . . . . . . 2008 6 6 1 — — — 13Senior Unsecured Notes 3.75%-6.50% . . . . . . . . . . . . . . . . . . . . . . 2008-2011 — — 40 40 33 35 148Senior Secured Notes (Floating Rate) . . . . . . . . . . . . . . . . . . . . . . . . 2015 7 13 14 13 15 100 1626.0% - 10.0% Notes . . . . . . . . . . . . . . . . . . . . . . . . . . . . . . . . . . . 2013-2017 49 52 57 63 68 199 488Senior Unsecured Term Loan . . . . . . . . . . . . . . . . . . . . . . . . . . . . . . 2010-2024 3 3 3 3 3 12 27
Subtotal, International Energy . . . . . . . . . . . . . . . . . . . . . . . . . . . . . 65 74 115 119 119 346 838
Crescent Resources Construction and Mortgage Loans . . . . . . . . . . . . . . 2 2 17 3 1 — 25Duke Energy Facilities LP . . . . . . . . . . . . . . . . . . . . . . . . . . . . . . . . . . 2009 — — — 91 — — 91a Algonquin Gas Transmission, 5.69% Notes . . . . . . . . . . . . . . . . . . . . 2012 — — — — — 300 300a East Tennessee Natural Gas, 5.71% Notes . . . . . . . . . . . . . . . . . . . . 2012 — — — — — 150 150Other Debt . . . . . . . . . . . . . . . . . . . . . . . . . . . . . . . . . . . . . . . . . . . . Various 2 1 1 1 — — 5
Subtotal, Duke Capital LLC Consolidated . . . . . . . . . . . . . . . . . . . . . . 1,394 633 434 1,089 877 5,757 10,184
Consolidated Long-Term Debt Scheduled Maturities . . . . . . . . . . . . . . . $1,400 $1,054 $1,245 $1,300 $1,386 $9,562 $15,947
a Private Placement
Duke Energy Corporation
LONG-TERM DEBT (CONTINUED)

16Consolidated Data
Duke Energy Corporation
CAPITALIZATION
December 31
(In millions) 2005 2004 2003 2002 2001
CAPITALIZATION AND CURRENT DEBTShort-Term Debt . . . . . . . . . . . . . . . . . . . . . . . . . . . . . . . . . . . . . . . . . $ 83 — $ 68 — $ 130 — $ 915 2% $ 1,603 5%
Current Maturities and Sinking Funds . . . . . . . . . . . . . . . . . . . . . . . . . . 1,400 4% 1,832 5% 1,200 3% 1,331 3% 274 1%
Long-Term Debta . . . . . . . . . . . . . . . . . . . . . . . . . . . . . . . . . . . . . . . . . 14,547 44% 16,932 46% 20,622 55% 20,221 50% 12,321 40%
Guaranteed Preferred Beneficial Interests in SubordinatedNotes of Duke Energy Corporation or Subsidiaries . . . . . . . . . . . . . . . . — — — — — — 1,408 3% 1,407 5%
Minority Interest . . . . . . . . . . . . . . . . . . . . . . . . . . . . . . . . . . . . . . . . . 749 2% 1,486 4% 1,701 5% 1,904 5% 2,246 7%
Preferred and Preference Stock:Preferred and preference stock with sinking fund requirements . . . . . . . . . — — — 23 25Preferred and preference stock without sinking fund requirements . . . . . . — 134 134 134 209
Total preferred and preference stock . . . . . . . . . . . . . . . . . . . . . . . . . . . — — 134 — 134 — 157 1% 234 1%
Common Stock:Balance at the beginning of year . . . . . . . . . . . . . . . . . . . . . . . . . . . . . 11,252 9,519 9,236 6,217 4,797Dividend reinvestment and employee benefits . . . . . . . . . . . . . . . . . . . 41 108 283 342 329Share repurchases . . . . . . . . . . . . . . . . . . . . . . . . . . . . . . . . . . . . . . . (933) — — — —Other capital stock transactions, net . . . . . . . . . . . . . . . . . . . . . . . . . . 28b 1,625b — 2,677b 1,091b
Balance at the end of the year . . . . . . . . . . . . . . . . . . . . . . . . . . . . . . 10,388 11,252 9,519 9,236 6,217
Retained Earnings:Balance at the beginning of year . . . . . . . . . . . . . . . . . . . . . . . . . . . . . 4,539 4,060 6,417 6,292 5,379Net (loss) income . . . . . . . . . . . . . . . . . . . . . . . . . . . . . . . . . . . . . . . 1,824 1,490 (1,323) 1,034 1,898Dividend reinvestment and employee benefits . . . . . . . . . . . . . . . . . . . 44 20 (6) — —Common stock dividends . . . . . . . . . . . . . . . . . . . . . . . . . . . . . . . . . . (1,093) (1,018) (993) (905) (973)Preferred and preference stock dividends andpremiums on redemptions . . . . . . . . . . . . . . . . . . . . . . . . . . . . . . . . . (12) (9) (15) (13) (14)Other capital stock transactions, net . . . . . . . . . . . . . . . . . . . . . . . . . . 33 (4) (20) 9 2
Balance at the end of the year . . . . . . . . . . . . . . . . . . . . . . . . . . . . . . 5,335 4,539 4,060 6,417 6,292
Accumulated Other Comprehensive Income (Loss) . . . . . . . . . . . . . . . . . 716 650 169 (709) 180
Total Common Stockholders’ Equity . . . . . . . . . . . . . . . . . . . . . . . . . . . 16,439 50% 16,441 45% 13,748 37% 14,944 36% 12,689 41%
TOTAL CAPITALIZATION . . . . . . . . . . . . . . . . . . . . . . . . . . . . . . . . . . . $33,218 100% $36,893 100% $37,535 100% $40,880 100% $30,774 100%
COVERAGE RATIOSFixed charges - using SEC guidelines . . . . . . . . . . . . . . . . . . . . . . . . . . . 4.7d 2.4 —c 2.1 2.8
a Includes debt to affiliates of $876 million at 2003.b Reflects equity offerings in 2004, 2002 and 2001 and the issuance of $1,702 million of stock related to the acquisition of Westcoast in 2002.c Earnings were inadequate to cover fixed charges by $19 million for the year ended December 31, 2003.d Includes pre-tax gains on the sale of TEPPCO GP and LP of approximately $0.9 billion, net of minority interest.

17Franchised Electric
FRANCHISED ELECTRIC
2005 AT A GLANCE
EBIT $1,495 million
TOTAL GENERATING CAPABILITY (NET MW)
Summer 18,828
Winter 18,469
COMBUSTION TURBINEHYDRO
RIVERSCOUNTIESCITIESSERVICE AREASTATE LINEHIGHWAY
NUCLEAR
FOSSIL
DUKE POWER SERVICE AREA
Winston-SalemGreensboro
Burlington
Chapel Hill
Charlotte
High PointStatesville
Mooresville
Salisbury
Spartanburg
Gastonia
Durham
Rock HillGreenville
Anderson
Asheville
Hickory
South Carolina
North Carolina
40
74
26
85
385
26
77
74
85
40
7785
40
South Carolina
Georgia
Virginia
Tennessee
Georgia
North Carolina
18Franchised Electric
Franchised Electric
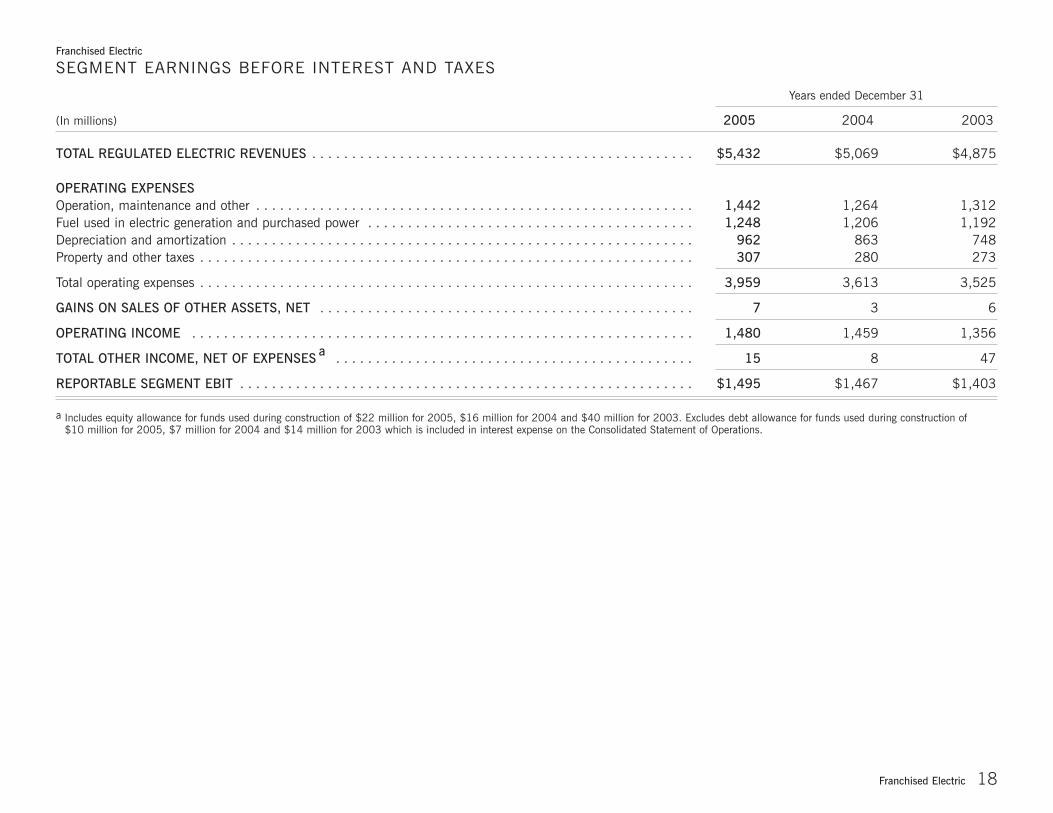
SEGMENT EARNINGS BEFORE INTEREST AND TAXES
Years ended December 31
(In millions) 2005 2004 2003
TOTAL REGULATED ELECTRIC REVENUES . . . . . . . . . . . . . . . . . . . . . . . . . . . . . . . . . . . . . . . . . . . . . . . . $5,432 $5,069 $4,875
OPERATING EXPENSESOperation, maintenance and other . . . . . . . . . . . . . . . . . . . . . . . . . . . . . . . . . . . . . . . . . . . . . . . . . . . . . . . 1,442 1,264 1,312Fuel used in electric generation and purchased power . . . . . . . . . . . . . . . . . . . . . . . . . . . . . . . . . . . . . . . . . 1,248 1,206 1,192Depreciation and amortization . . . . . . . . . . . . . . . . . . . . . . . . . . . . . . . . . . . . . . . . . . . . . . . . . . . . . . . . . . 962 863 748Property and other taxes . . . . . . . . . . . . . . . . . . . . . . . . . . . . . . . . . . . . . . . . . . . . . . . . . . . . . . . . . . . . . . 307 280 273
Total operating expenses . . . . . . . . . . . . . . . . . . . . . . . . . . . . . . . . . . . . . . . . . . . . . . . . . . . . . . . . . . . . . . 3,959 3,613 3,525
GAINS ON SALES OF OTHER ASSETS, NET . . . . . . . . . . . . . . . . . . . . . . . . . . . . . . . . . . . . . . . . . . . . . . . 7 3 6
OPERATING INCOME . . . . . . . . . . . . . . . . . . . . . . . . . . . . . . . . . . . . . . . . . . . . . . . . . . . . . . . . . . . . . . . 1,480 1,459 1,356
TOTAL OTHER INCOME, NET OF EXPENSES a . . . . . . . . . . . . . . . . . . . . . . . . . . . . . . . . . . . . . . . . . . . . . 15 8 47
REPORTABLE SEGMENT EBIT . . . . . . . . . . . . . . . . . . . . . . . . . . . . . . . . . . . . . . . . . . . . . . . . . . . . . . . . . $1,495 $1,467 $1,403
a Includes equity allowance for funds used during construction of $22 million for 2005, $16 million for 2004 and $40 million for 2003. Excludes debt allowance for funds used during construction of $10 million for 2005, $7 million for 2004 and $14 million for 2003 which is included in interest expense on the Consolidated Statement of Operations.
19Franchised Electric
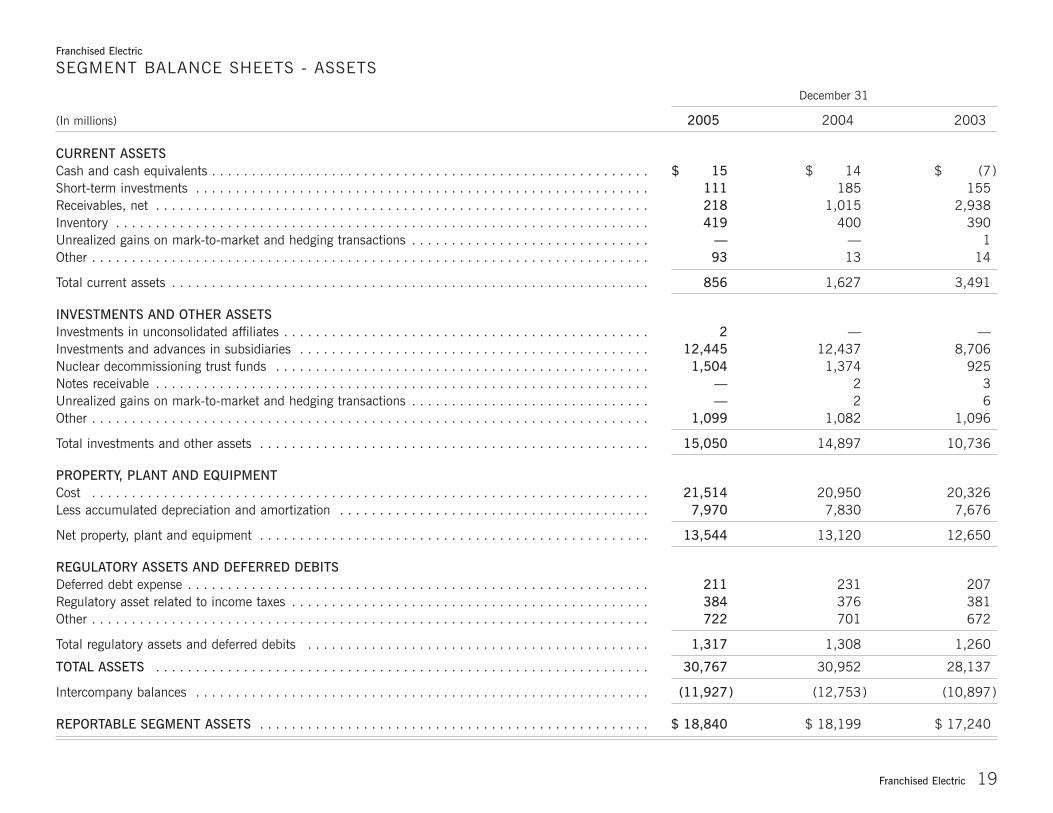
December 31
(In millions) 2005 2004 2003
CURRENT ASSETSCash and cash equivalents . . . . . . . . . . . . . . . . . . . . . . . . . . . . . . . . . . . . . . . . . . . . . . . . . . . . . . . $ 15 $ 14 $ (7)Short-term investments . . . . . . . . . . . . . . . . . . . . . . . . . . . . . . . . . . . . . . . . . . . . . . . . . . . . . . . . . 111 185 155Receivables, net . . . . . . . . . . . . . . . . . . . . . . . . . . . . . . . . . . . . . . . . . . . . . . . . . . . . . . . . . . . . . . 218 1,015 2,938Inventory . . . . . . . . . . . . . . . . . . . . . . . . . . . . . . . . . . . . . . . . . . . . . . . . . . . . . . . . . . . . . . . . . . . 419 400 390Unrealized gains on mark-to-market and hedging transactions . . . . . . . . . . . . . . . . . . . . . . . . . . . . . . — — 1Other . . . . . . . . . . . . . . . . . . . . . . . . . . . . . . . . . . . . . . . . . . . . . . . . . . . . . . . . . . . . . . . . . . . . . . 93 13 14
Total current assets . . . . . . . . . . . . . . . . . . . . . . . . . . . . . . . . . . . . . . . . . . . . . . . . . . . . . . . . . . . . 856 1,627 3,491
INVESTMENTS AND OTHER ASSETSInvestments in unconsolidated affiliates . . . . . . . . . . . . . . . . . . . . . . . . . . . . . . . . . . . . . . . . . . . . . . 2 — —Investments and advances in subsidiaries . . . . . . . . . . . . . . . . . . . . . . . . . . . . . . . . . . . . . . . . . . . . 12,445 12,437 8,706Nuclear decommissioning trust funds . . . . . . . . . . . . . . . . . . . . . . . . . . . . . . . . . . . . . . . . . . . . . . . 1,504 1,374 925Notes receivable . . . . . . . . . . . . . . . . . . . . . . . . . . . . . . . . . . . . . . . . . . . . . . . . . . . . . . . . . . . . . . — 2 3Unrealized gains on mark-to-market and hedging transactions . . . . . . . . . . . . . . . . . . . . . . . . . . . . . . — 2 6Other . . . . . . . . . . . . . . . . . . . . . . . . . . . . . . . . . . . . . . . . . . . . . . . . . . . . . . . . . . . . . . . . . . . . . . 1,099 1,082 1,096
Total investments and other assets . . . . . . . . . . . . . . . . . . . . . . . . . . . . . . . . . . . . . . . . . . . . . . . . . 15,050 14,897 10,736
PROPERTY, PLANT AND EQUIPMENTCost . . . . . . . . . . . . . . . . . . . . . . . . . . . . . . . . . . . . . . . . . . . . . . . . . . . . . . . . . . . . . . . . . . . . . . 21,514 20,950 20,326Less accumulated depreciation and amortization . . . . . . . . . . . . . . . . . . . . . . . . . . . . . . . . . . . . . . . 7,970 7,830 7,676
Net property, plant and equipment . . . . . . . . . . . . . . . . . . . . . . . . . . . . . . . . . . . . . . . . . . . . . . . . . 13,544 13,120 12,650
REGULATORY ASSETS AND DEFERRED DEBITSDeferred debt expense . . . . . . . . . . . . . . . . . . . . . . . . . . . . . . . . . . . . . . . . . . . . . . . . . . . . . . . . . . 211 231 207Regulatory asset related to income taxes . . . . . . . . . . . . . . . . . . . . . . . . . . . . . . . . . . . . . . . . . . . . . 384 376 381Other . . . . . . . . . . . . . . . . . . . . . . . . . . . . . . . . . . . . . . . . . . . . . . . . . . . . . . . . . . . . . . . . . . . . . . 722 701 672
Total regulatory assets and deferred debits . . . . . . . . . . . . . . . . . . . . . . . . . . . . . . . . . . . . . . . . . . . 1,317 1,308 1,260
TOTAL ASSETS . . . . . . . . . . . . . . . . . . . . . . . . . . . . . . . . . . . . . . . . . . . . . . . . . . . . . . . . . . . . . . 30,767 30,952 28,137
Intercompany balances . . . . . . . . . . . . . . . . . . . . . . . . . . . . . . . . . . . . . . . . . . . . . . . . . . . . . . . . . (11,927) (12,753) (10,897)
REPORTABLE SEGMENT ASSETS . . . . . . . . . . . . . . . . . . . . . . . . . . . . . . . . . . . . . . . . . . . . . . . . . $ 18,840 $ 18,199 $ 17,240
Franchised Electric
SEGMENT BALANCE SHEETS - ASSETS
20Franchised Electric
Franchised Electric
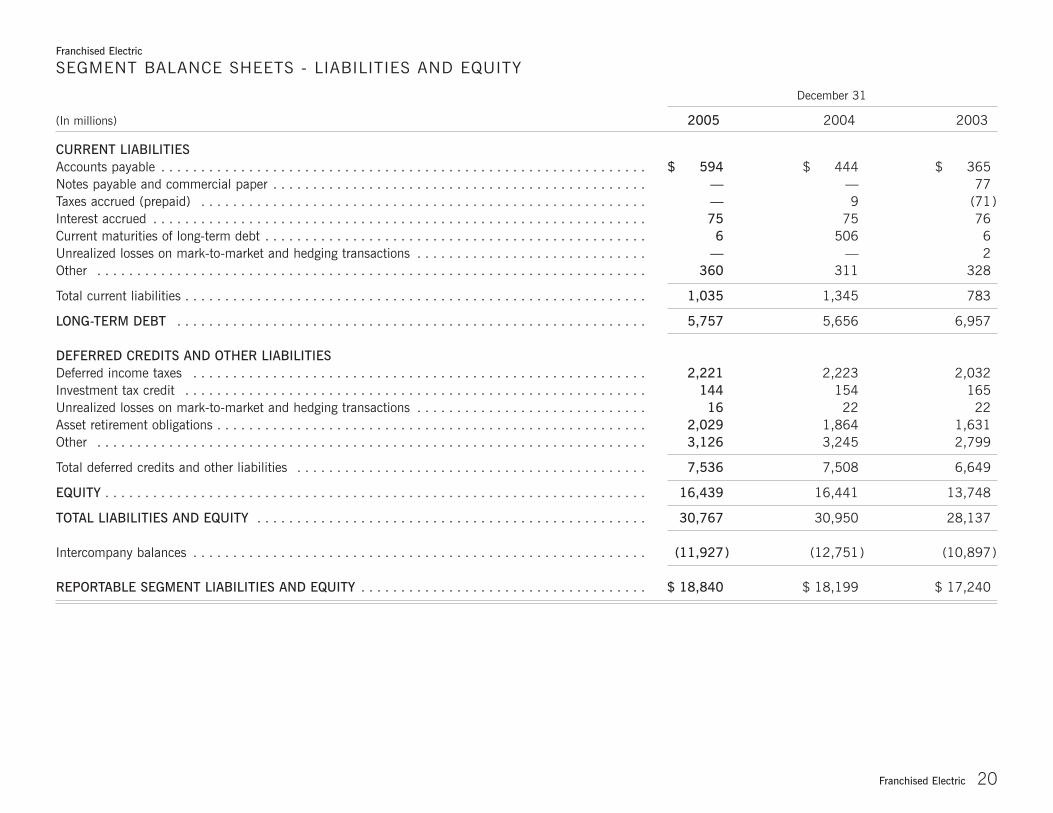
SEGMENT BALANCE SHEETS - LIABILITIES AND EQUITY
December 31
(In millions) 2005 2004 2003
CURRENT LIABILITIESAccounts payable . . . . . . . . . . . . . . . . . . . . . . . . . . . . . . . . . . . . . . . . . . . . . . . . . . . . . . . . . . . . . $ 594 $ 444 $ 365Notes payable and commercial paper . . . . . . . . . . . . . . . . . . . . . . . . . . . . . . . . . . . . . . . . . . . . . . . — — 77Taxes accrued (prepaid) . . . . . . . . . . . . . . . . . . . . . . . . . . . . . . . . . . . . . . . . . . . . . . . . . . . . . . . . — 9 (71)Interest accrued . . . . . . . . . . . . . . . . . . . . . . . . . . . . . . . . . . . . . . . . . . . . . . . . . . . . . . . . . . . . . . 75 75 76Current maturities of long-term debt . . . . . . . . . . . . . . . . . . . . . . . . . . . . . . . . . . . . . . . . . . . . . . . . 6 506 6Unrealized losses on mark-to-market and hedging transactions . . . . . . . . . . . . . . . . . . . . . . . . . . . . . — — 2Other . . . . . . . . . . . . . . . . . . . . . . . . . . . . . . . . . . . . . . . . . . . . . . . . . . . . . . . . . . . . . . . . . . . . . 360 311 328
Total current liabilities . . . . . . . . . . . . . . . . . . . . . . . . . . . . . . . . . . . . . . . . . . . . . . . . . . . . . . . . . . 1,035 1,345 783
LONG-TERM DEBT . . . . . . . . . . . . . . . . . . . . . . . . . . . . . . . . . . . . . . . . . . . . . . . . . . . . . . . . . . . 5,757 5,656 6,957
DEFERRED CREDITS AND OTHER LIABILITIESDeferred income taxes . . . . . . . . . . . . . . . . . . . . . . . . . . . . . . . . . . . . . . . . . . . . . . . . . . . . . . . . . 2,221 2,223 2,032Investment tax credit . . . . . . . . . . . . . . . . . . . . . . . . . . . . . . . . . . . . . . . . . . . . . . . . . . . . . . . . . . 144 154 165Unrealized losses on mark-to-market and hedging transactions . . . . . . . . . . . . . . . . . . . . . . . . . . . . . 16 22 22Asset retirement obligations . . . . . . . . . . . . . . . . . . . . . . . . . . . . . . . . . . . . . . . . . . . . . . . . . . . . . . 2,029 1,864 1,631Other . . . . . . . . . . . . . . . . . . . . . . . . . . . . . . . . . . . . . . . . . . . . . . . . . . . . . . . . . . . . . . . . . . . . . 3,126 3,245 2,799
Total deferred credits and other liabilities . . . . . . . . . . . . . . . . . . . . . . . . . . . . . . . . . . . . . . . . . . . . 7,536 7,508 6,649
EQUITY . . . . . . . . . . . . . . . . . . . . . . . . . . . . . . . . . . . . . . . . . . . . . . . . . . . . . . . . . . . . . . . . . . . . 16,439 16,441 13,748
TOTAL LIABILITIES AND EQUITY . . . . . . . . . . . . . . . . . . . . . . . . . . . . . . . . . . . . . . . . . . . . . . . . . 30,767 30,950 28,137
Intercompany balances . . . . . . . . . . . . . . . . . . . . . . . . . . . . . . . . . . . . . . . . . . . . . . . . . . . . . . . . . (11,927) (12,751) (10,897)
REPORTABLE SEGMENT LIABILITIES AND EQUITY . . . . . . . . . . . . . . . . . . . . . . . . . . . . . . . . . . . . $ 18,840 $ 18,199 $ 17,240

21Franchised Electric
December 31
2005 2004 2003
SOURCES OF ELECTRIC ENERGY (GWH)Generated - net output:
Coal . . . . . . . . . . . . . . . . . . . . . . . . . . . . . . . . . . . . . . . . . . . . . . . . . . . . . . . . . . . . . . . . . . . . . . . . . . . . . . . . . . . . 46,572 44,638 43,696Nuclear . . . . . . . . . . . . . . . . . . . . . . . . . . . . . . . . . . . . . . . . . . . . . . . . . . . . . . . . . . . . . . . . . . . . . . . . . . . . . . . . . . 40,545 39,218 40,256Hydro . . . . . . . . . . . . . . . . . . . . . . . . . . . . . . . . . . . . . . . . . . . . . . . . . . . . . . . . . . . . . . . . . . . . . . . . . . . . . . . . . . . 1,468 1,503 2,101Oil & gas . . . . . . . . . . . . . . . . . . . . . . . . . . . . . . . . . . . . . . . . . . . . . . . . . . . . . . . . . . . . . . . . . . . . . . . . . . . . . . . . . 74 129 106
Total generation . . . . . . . . . . . . . . . . . . . . . . . . . . . . . . . . . . . . . . . . . . . . . . . . . . . . . . . . . . . . . . . . . . . . . . . . . . . . . 88,659 85,488 86,159Purchased power and net interchange . . . . . . . . . . . . . . . . . . . . . . . . . . . . . . . . . . . . . . . . . . . . . . . . . . . . . . . . . . . . . . 2,609 2,158 1,585
Total sources of energy . . . . . . . . . . . . . . . . . . . . . . . . . . . . . . . . . . . . . . . . . . . . . . . . . . . . . . . . . . . . . . . . . . . . . . . . 91,268 87,646 87,744Less: Line loss and company usage . . . . . . . . . . . . . . . . . . . . . . . . . . . . . . . . . . . . . . . . . . . . . . . . . . . . . . . . . . . . . . . 5,991 4,938 4,916
TOTAL GWH SOURCES . . . . . . . . . . . . . . . . . . . . . . . . . . . . . . . . . . . . . . . . . . . . . . . . . . . . . . . . . . . . . . . . . . . . . . . 85,277 82,708 82,828
ELECTRIC ENERGY SALES (GWH)Residential . . . . . . . . . . . . . . . . . . . . . . . . . . . . . . . . . . . . . . . . . . . . . . . . . . . . . . . . . . . . . . . . . . . . . . . . . . . . . . . . . 26,108 25,151 23,947General service . . . . . . . . . . . . . . . . . . . . . . . . . . . . . . . . . . . . . . . . . . . . . . . . . . . . . . . . . . . . . . . . . . . . . . . . . . . . . . 25,679 25,204 24,355Industrial:
Textile . . . . . . . . . . . . . . . . . . . . . . . . . . . . . . . . . . . . . . . . . . . . . . . . . . . . . . . . . . . . . . . . . . . . . . . . . . . . . . . . . . . 6,561 7,147 7,562Other . . . . . . . . . . . . . . . . . . . . . . . . . . . . . . . . . . . . . . . . . . . . . . . . . . . . . . . . . . . . . . . . . . . . . . . . . . . . . . . . . . . 18,934 18,063 17,202
Other energy and wholesale . . . . . . . . . . . . . . . . . . . . . . . . . . . . . . . . . . . . . . . . . . . . . . . . . . . . . . . . . . . . . . . . . . . . . 8,150 7,194 9,340
Total GWh sales billed . . . . . . . . . . . . . . . . . . . . . . . . . . . . . . . . . . . . . . . . . . . . . . . . . . . . . . . . . . . . . . . . . . . . . . . . . 85,432 82,759 82,406Unbilled GWh sales . . . . . . . . . . . . . . . . . . . . . . . . . . . . . . . . . . . . . . . . . . . . . . . . . . . . . . . . . . . . . . . . . . . . . . . . . . (155) (51) 422
TOTAL GWH SALES . . . . . . . . . . . . . . . . . . . . . . . . . . . . . . . . . . . . . . . . . . . . . . . . . . . . . . . . . . . . . . . . . . . . . . . . . . 85,277 82,708 82,828
Total Capability - Net MWa
(time of peak)Summer . . . . . . . . . . . . . . . . . . . . . . . . . . . . . . . . . . . . . . . . . . . . . . . . . . . . . . . . . . . . . . . . . . . . . . . . . . . . . . . . . 18,828 18,414 18,807Winter . . . . . . . . . . . . . . . . . . . . . . . . . . . . . . . . . . . . . . . . . . . . . . . . . . . . . . . . . . . . . . . . . . . . . . . . . . . . . . . . . . . 18,469 18,469 18,521
Peak Load - MWb
Summer . . . . . . . . . . . . . . . . . . . . . . . . . . . . . . . . . . . . . . . . . . . . . . . . . . . . . . . . . . . . . . . . . . . . . . . . . . . . . . . . . 17,294 15,407 15,594Winter . . . . . . . . . . . . . . . . . . . . . . . . . . . . . . . . . . . . . . . . . . . . . . . . . . . . . . . . . . . . . . . . . . . . . . . . . . . . . . . . . . . 15,222 14,345 14,056
Nuclear Capacity Factor (%)c . . . . . . . . . . . . . . . . . . . . . . . . . . . . . . . . . . . . . . . . . . . . . . . . . . . . . . . . . . . . . . . . . . . 94 90 91
System Load Factor (%)b . . . . . . . . . . . . . . . . . . . . . . . . . . . . . . . . . . . . . . . . . . . . . . . . . . . . . . . . . . . . . . . . . . . . . . 56 61 59
a Includes 12.5% of Catawba.b Excludes the portion of the demand of the other joint owners of the Catawba Nuclear Station met by their retained ownership.c Includes 100% of Catawba.
Franchised Electric
OPERATING STATISTICS

22Franchised Electric
Franchised Electric
OPERATING STATISTICS
December 31
2005 2004 2003
REVENUES FROM GENERATION, TRANSMISSION AND DISTRIBUTION OF ELECTRICITY (IN MILLIONS)
Residential revenues . . . . . . . . . . . . . . . . . . . . . . . . . . . . . . . . . . . . . . . . . . . . . . . . . . . . . . . . . . . . . . . $1,989 $1,886 $1,777General service revenues . . . . . . . . . . . . . . . . . . . . . . . . . . . . . . . . . . . . . . . . . . . . . . . . . . . . . . . . . . . . 1,582 1,519 1,455Industrial revenues:
Textile revenues . . . . . . . . . . . . . . . . . . . . . . . . . . . . . . . . . . . . . . . . . . . . . . . . . . . . . . . . . . . . . . . . . 277 293 309Other revenues . . . . . . . . . . . . . . . . . . . . . . . . . . . . . . . . . . . . . . . . . . . . . . . . . . . . . . . . . . . . . . . . . . 821 775 738
Other energy and wholesale revenues . . . . . . . . . . . . . . . . . . . . . . . . . . . . . . . . . . . . . . . . . . . . . . . . . . . 534 351 431
Total revenues billed . . . . . . . . . . . . . . . . . . . . . . . . . . . . . . . . . . . . . . . . . . . . . . . . . . . . . . . . . . . . . . . 5,203 4,824 4,710Unbilled revenues . . . . . . . . . . . . . . . . . . . . . . . . . . . . . . . . . . . . . . . . . . . . . . . . . . . . . . . . . . . . . . . . . (4) — 27Other electric revenues . . . . . . . . . . . . . . . . . . . . . . . . . . . . . . . . . . . . . . . . . . . . . . . . . . . . . . . . . . . . . (47) 9 (25)
TOTAL REVENUES FROM GENERATION, TRANSMISSION AND DISTRIBUTION OF ELECTRICITY . . . . . . . . . . . . . . . . . . . . . . . . . . . . . . . . . . . . . . . . . . . . . . . . . . . . . . $5,152 $4,833 $4,712
AVERAGE NUMBER OF CUSTOMERS (IN THOUSANDS)Residential . . . . . . . . . . . . . . . . . . . . . . . . . . . . . . . . . . . . . . . . . . . . . . . . . . . . . . . . . . . . . . . . . . . . . . 1,901 1,865 1,835General service . . . . . . . . . . . . . . . . . . . . . . . . . . . . . . . . . . . . . . . . . . . . . . . . . . . . . . . . . . . . . . . . . . . 318 312 306Industrial:
Textile . . . . . . . . . . . . . . . . . . . . . . . . . . . . . . . . . . . . . . . . . . . . . . . . . . . . . . . . . . . . . . . . . . . . . . . . 1 1 1Other . . . . . . . . . . . . . . . . . . . . . . . . . . . . . . . . . . . . . . . . . . . . . . . . . . . . . . . . . . . . . . . . . . . . . . . . . 6 7 7
Total industrial . . . . . . . . . . . . . . . . . . . . . . . . . . . . . . . . . . . . . . . . . . . . . . . . . . . . . . . . . . . . . . . . . 7 8 8Other energy . . . . . . . . . . . . . . . . . . . . . . . . . . . . . . . . . . . . . . . . . . . . . . . . . . . . . . . . . . . . . . . . . . . . . 13 12 11
TOTAL AVERAGE NUMBER OF CUSTOMERS . . . . . . . . . . . . . . . . . . . . . . . . . . . . . . . . . . . . . . . . . . . . . 2,239 2,197 2,160

23Natural Gas Transmission
NATURAL GAS TRANSMISSION
2005 AT A GLANCE
EBIT $1,388 million
THROUGHPUT 3,410 TBtu
STORAGE CAPACITY 261 Bcf
U. S. A.
HOUSTON
NASHVILLE
BOSTON
HALIFAX
CHATHAM
CALGARYVANCOUVER
Gulfstream
Maritimes & NE
AlgonquinUnion Gas
East Tennessee
Texas Eastern
DEGTWesternCanadianOperations
Pipeline Systemne NGL PipelineMajor Office LocationProcessing PlantNatural Gas StorageUnion Gas DistributionService Area
24Natural Gas Transmission
Natural Gas Transmission
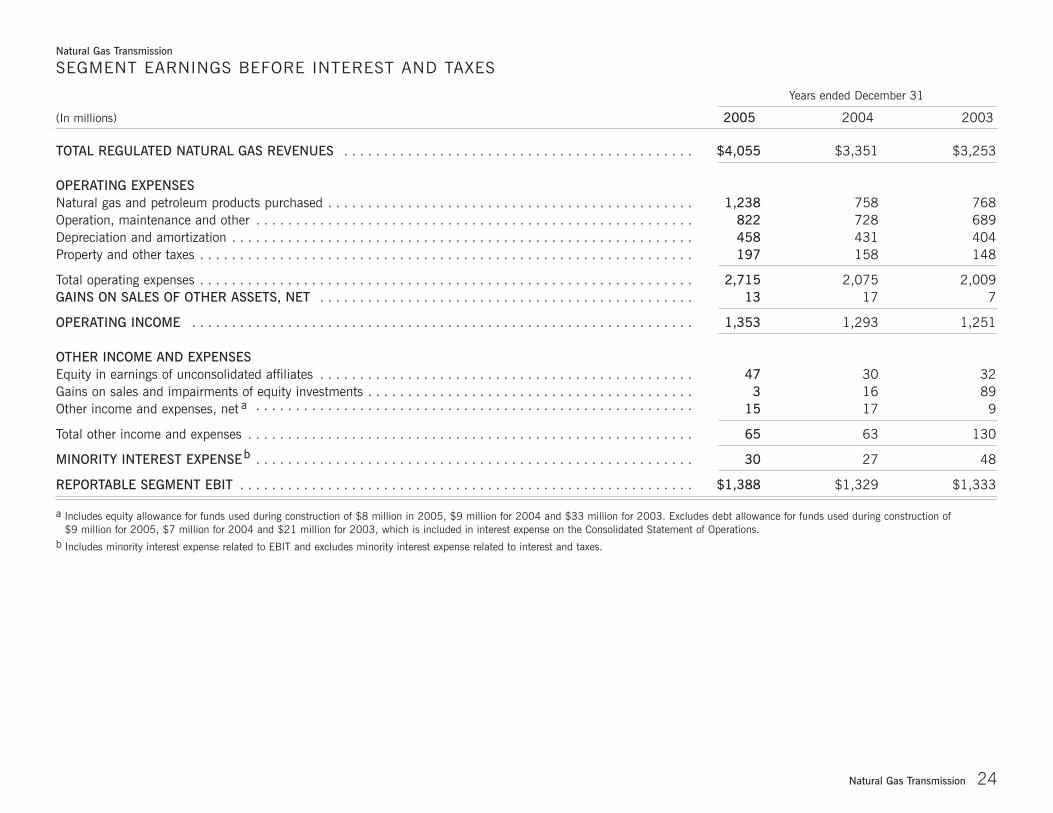
SEGMENT EARNINGS BEFORE INTEREST AND TAXES
Years ended December 31
(In millions) 2005 2004 2003
TOTAL REGULATED NATURAL GAS REVENUES . . . . . . . . . . . . . . . . . . . . . . . . . . . . . . . . . . . . . . . . . . . . $4,055 $3,351 $3,253
OPERATING EXPENSESNatural gas and petroleum products purchased . . . . . . . . . . . . . . . . . . . . . . . . . . . . . . . . . . . . . . . . . . . . . . 1,238 758 768Operation, maintenance and other . . . . . . . . . . . . . . . . . . . . . . . . . . . . . . . . . . . . . . . . . . . . . . . . . . . . . . . 822 728 689Depreciation and amortization . . . . . . . . . . . . . . . . . . . . . . . . . . . . . . . . . . . . . . . . . . . . . . . . . . . . . . . . . . 458 431 404Property and other taxes . . . . . . . . . . . . . . . . . . . . . . . . . . . . . . . . . . . . . . . . . . . . . . . . . . . . . . . . . . . . . . 197 158 148
Total operating expenses . . . . . . . . . . . . . . . . . . . . . . . . . . . . . . . . . . . . . . . . . . . . . . . . . . . . . . . . . . . . . . 2,715 2,075 2,009GAINS ON SALES OF OTHER ASSETS, NET . . . . . . . . . . . . . . . . . . . . . . . . . . . . . . . . . . . . . . . . . . . . . . . 13 17 7
OPERATING INCOME . . . . . . . . . . . . . . . . . . . . . . . . . . . . . . . . . . . . . . . . . . . . . . . . . . . . . . . . . . . . . . . 1,353 1,293 1,251
OTHER INCOME AND EXPENSESEquity in earnings of unconsolidated affiliates . . . . . . . . . . . . . . . . . . . . . . . . . . . . . . . . . . . . . . . . . . . . . . . 47 30 32Gains on sales and impairments of equity investments . . . . . . . . . . . . . . . . . . . . . . . . . . . . . . . . . . . . . . . . . 3 16 89Other income and expenses, net a . . . . . . . . . . . . . . . . . . . . . . . . . . . . . . . . . . . . . . . . . . . . . . . . . . . . . . . 15 17 9
Total other income and expenses . . . . . . . . . . . . . . . . . . . . . . . . . . . . . . . . . . . . . . . . . . . . . . . . . . . . . . . . 65 63 130
MINORITY INTEREST EXPENSEb . . . . . . . . . . . . . . . . . . . . . . . . . . . . . . . . . . . . . . . . . . . . . . . . . . . . . . . 30 27 48
REPORTABLE SEGMENT EBIT . . . . . . . . . . . . . . . . . . . . . . . . . . . . . . . . . . . . . . . . . . . . . . . . . . . . . . . . . $1,388 $1,329 $1,333
a Includes equity allowance for funds used during construction of $8 million in 2005, $9 million for 2004 and $33 million for 2003. Excludes debt allowance for funds used during construction of $9 million for 2005, $7 million for 2004 and $21 million for 2003, which is included in interest expense on the Consolidated Statement of Operations.
b Includes minority interest expense related to EBIT and excludes minority interest expense related to interest and taxes.

25Natural Gas Transmission
December 31
(In millions) 2005 2004 2003
CURRENT ASSETSCash and cash equivalents . . . . . . . . . . . . . . . . . . . . . . . . . . . . . . . . . . . . . . . . . . . . . . . . . . . . . . . $ 68 $ (3) $ 131Receivables, net . . . . . . . . . . . . . . . . . . . . . . . . . . . . . . . . . . . . . . . . . . . . . . . . . . . . . . . . . . . . . . 683 655 461Inventory . . . . . . . . . . . . . . . . . . . . . . . . . . . . . . . . . . . . . . . . . . . . . . . . . . . . . . . . . . . . . . . . . . . 381 324 236Unrealized gains on mark-to-market and hedging transactions . . . . . . . . . . . . . . . . . . . . . . . . . . . . . . 16 7 2Other . . . . . . . . . . . . . . . . . . . . . . . . . . . . . . . . . . . . . . . . . . . . . . . . . . . . . . . . . . . . . . . . . . . . . . 55 45 78
Total current assets . . . . . . . . . . . . . . . . . . . . . . . . . . . . . . . . . . . . . . . . . . . . . . . . . . . . . . . . . . . . 1,203 1,028 908
INVESTMENTS AND OTHER ASSETSInvestments in unconsolidated affiliates . . . . . . . . . . . . . . . . . . . . . . . . . . . . . . . . . . . . . . . . . . . . . . 447 790 811Investments and advances in subsidiaries . . . . . . . . . . . . . . . . . . . . . . . . . . . . . . . . . . . . . . . . . . . . 2,131 7,775 1,646Goodwill . . . . . . . . . . . . . . . . . . . . . . . . . . . . . . . . . . . . . . . . . . . . . . . . . . . . . . . . . . . . . . . . . . . 3,512 3,469 3,290Notes receivable . . . . . . . . . . . . . . . . . . . . . . . . . . . . . . . . . . . . . . . . . . . . . . . . . . . . . . . . . . . . . . 3,188 3,246 1,597Assets held for sale . . . . . . . . . . . . . . . . . . . . . . . . . . . . . . . . . . . . . . . . . . . . . . . . . . . . . . . . . . . . 12 — —Other . . . . . . . . . . . . . . . . . . . . . . . . . . . . . . . . . . . . . . . . . . . . . . . . . . . . . . . . . . . . . . . . . . . . . . 209 (9) 3
Total investments and other assets . . . . . . . . . . . . . . . . . . . . . . . . . . . . . . . . . . . . . . . . . . . . . . . . . 9,499 15,271 7,347
PROPERTY, PLANT AND EQUIPMENTCost . . . . . . . . . . . . . . . . . . . . . . . . . . . . . . . . . . . . . . . . . . . . . . . . . . . . . . . . . . . . . . . . . . . . . . 14,702 13,658 12,873Less accumulated depreciation and amortization . . . . . . . . . . . . . . . . . . . . . . . . . . . . . . . . . . . . . . . 2,622 2,575 2,171
Net property, plant and equipment . . . . . . . . . . . . . . . . . . . . . . . . . . . . . . . . . . . . . . . . . . . . . . . . . 12,080 11,083 10,702
REGULATORY ASSETS AND DEFERRED DEBITSDeferred debt expense . . . . . . . . . . . . . . . . . . . . . . . . . . . . . . . . . . . . . . . . . . . . . . . . . . . . . . . . . . 47 53 60Regulatory asset related to income taxes . . . . . . . . . . . . . . . . . . . . . . . . . . . . . . . . . . . . . . . . . . . . . 954 893 772Other . . . . . . . . . . . . . . . . . . . . . . . . . . . . . . . . . . . . . . . . . . . . . . . . . . . . . . . . . . . . . . . . . . . . . . 204 185 206
Total regulatory assets and deferred debits . . . . . . . . . . . . . . . . . . . . . . . . . . . . . . . . . . . . . . . . . . . 1,205 1,131 1,038
TOTAL ASSETS . . . . . . . . . . . . . . . . . . . . . . . . . . . . . . . . . . . . . . . . . . . . . . . . . . . . . . . . . . . . . . 23,987 28,513 19,995
Intercompany balances . . . . . . . . . . . . . . . . . . . . . . . . . . . . . . . . . . . . . . . . . . . . . . . . . . . . . . . . . (5,295) (10,715) (3,008)
REPORTABLE SEGMENT ASSETS . . . . . . . . . . . . . . . . . . . . . . . . . . . . . . . . . . . . . . . . . . . . . . . . . $18,692 $ 17,798 $16,987
Natural Gas Transmission
SEGMENT BALANCE SHEETS - ASSETS

26Natural Gas Transmission
Natural Gas Transmission
SEGMENT BALANCE SHEETS - LIABILITIES AND EQUITY
December 31
(In millions) 2005 2004 2003
CURRENT LIABILITIESAccounts payable . . . . . . . . . . . . . . . . . . . . . . . . . . . . . . . . . . . . . . . . . . . . . . . . . . . . . . . . . . . . . $ 205 $ 225 $ 239Notes payable and commercial paper . . . . . . . . . . . . . . . . . . . . . . . . . . . . . . . . . . . . . . . . . . . . . . . 87 213 12Taxes accrued . . . . . . . . . . . . . . . . . . . . . . . . . . . . . . . . . . . . . . . . . . . . . . . . . . . . . . . . . . . . . . . 215 232 232Interest accrued . . . . . . . . . . . . . . . . . . . . . . . . . . . . . . . . . . . . . . . . . . . . . . . . . . . . . . . . . . . . . . 91 125 118Current maturities of long-term debt . . . . . . . . . . . . . . . . . . . . . . . . . . . . . . . . . . . . . . . . . . . . . . . . 424 158 389Unrealized losses on mark-to-market and hedging transactions . . . . . . . . . . . . . . . . . . . . . . . . . . . . . 22 3 19Other . . . . . . . . . . . . . . . . . . . . . . . . . . . . . . . . . . . . . . . . . . . . . . . . . . . . . . . . . . . . . . . . . . . . . 660 425 514
Total current liabilities . . . . . . . . . . . . . . . . . . . . . . . . . . . . . . . . . . . . . . . . . . . . . . . . . . . . . . . . . . 1,704 1,381 1,523
LONG-TERM DEBT . . . . . . . . . . . . . . . . . . . . . . . . . . . . . . . . . . . . . . . . . . . . . . . . . . . . . . . . . . . 8,520 8,789 7,083
DEFERRED CREDITS AND OTHER LIABILITIESDeferred income taxes . . . . . . . . . . . . . . . . . . . . . . . . . . . . . . . . . . . . . . . . . . . . . . . . . . . . . . . . . 2,216 2,000 1,790Asset retirement obligations . . . . . . . . . . . . . . . . . . . . . . . . . . . . . . . . . . . . . . . . . . . . . . . . . . . . . . 28 16 38Other . . . . . . . . . . . . . . . . . . . . . . . . . . . . . . . . . . . . . . . . . . . . . . . . . . . . . . . . . . . . . . . . . . . . . 1,043 639 648
Total deferred credits and other liabilities . . . . . . . . . . . . . . . . . . . . . . . . . . . . . . . . . . . . . . . . . . . . 3,287 2,655 2,476
MINORITY INTERESTS . . . . . . . . . . . . . . . . . . . . . . . . . . . . . . . . . . . . . . . . . . . . . . . . . . . . . . . . 476 354 530
PREFERRED AND PREFERENCE STOCK WITHOUT SINKING FUND REQUIREMENTS . . . . . . . . . . . . . . . . . . . . . . . . . . . . . . . . . . . . . . . . . . . . . . . . . — — 109
EQUITY . . . . . . . . . . . . . . . . . . . . . . . . . . . . . . . . . . . . . . . . . . . . . . . . . . . . . . . . . . . . . . . . . . . . 10,000 15,334 8,274
TOTAL LIABILITIES AND EQUITY . . . . . . . . . . . . . . . . . . . . . . . . . . . . . . . . . . . . . . . . . . . . . . . . . 23,987 28,513 19,995
Intercompany balances . . . . . . . . . . . . . . . . . . . . . . . . . . . . . . . . . . . . . . . . . . . . . . . . . . . . . . . . . (5,295) (10,715) (3,008)
REPORTABLE SEGMENT LIABILITIES AND STOCKHOLDERS’ EQUITY . . . . . . . . . . . . . . . . . . . . . . . . . . . . . . . . . . . . . . . . . . . . . . . . . . . . . $18,692 $ 17,798 $16,987

27Natural Gas Transmission
December 31
2005 2004 2003
Throughput, trillion British thermal units (TBtu)a . . . . . . . . . . . . . . . . . . . . . . . . . . . . . . . . . . . . . . . . . . . . . . 3,410 3,332 3,362
Storage capacity, billion cubic feet . . . . . . . . . . . . . . . . . . . . . . . . . . . . . . . . . . . . . . . . . . . . . . . . . . . . . . . . . 261 258 257
a Represents share of capacity owned by DEGT.
Natural Gas Transmission
OPERATING STATISTICS
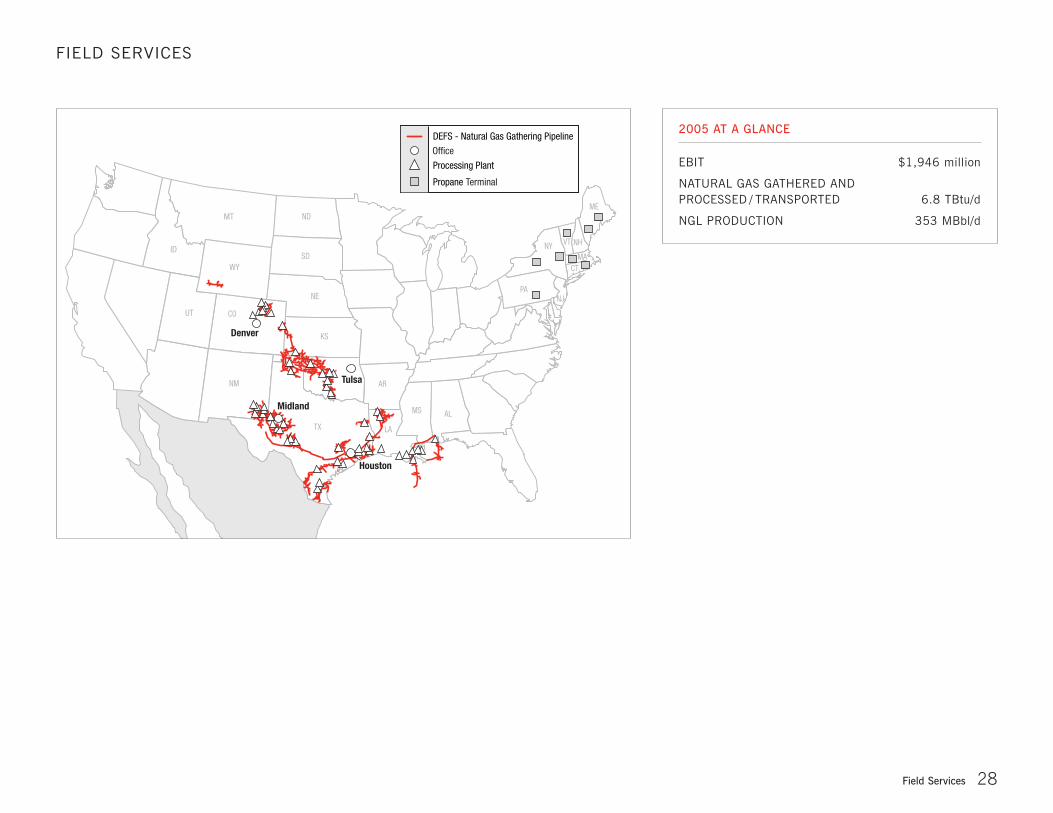
28Field Services
FIELD SERVICES
2005 AT A GLANCE
EBIT $1,946 million
NATURAL GAS GATHERED ANDPROCESSED / TRANSPORTED 6.8 TBtu/d
NGL PRODUCTION 353 MBbl/d
Tulsa
Houston
Denver
Midland
MT
WY
UT CO
NM
NDME
NHVT
MACT
NY
PANJ
SD
NE
KS
AR
TX LA
MS AL
ID
Office
DEFS - Natural Gas Gathering Pipeline
Processing Plant
TerminalPropane
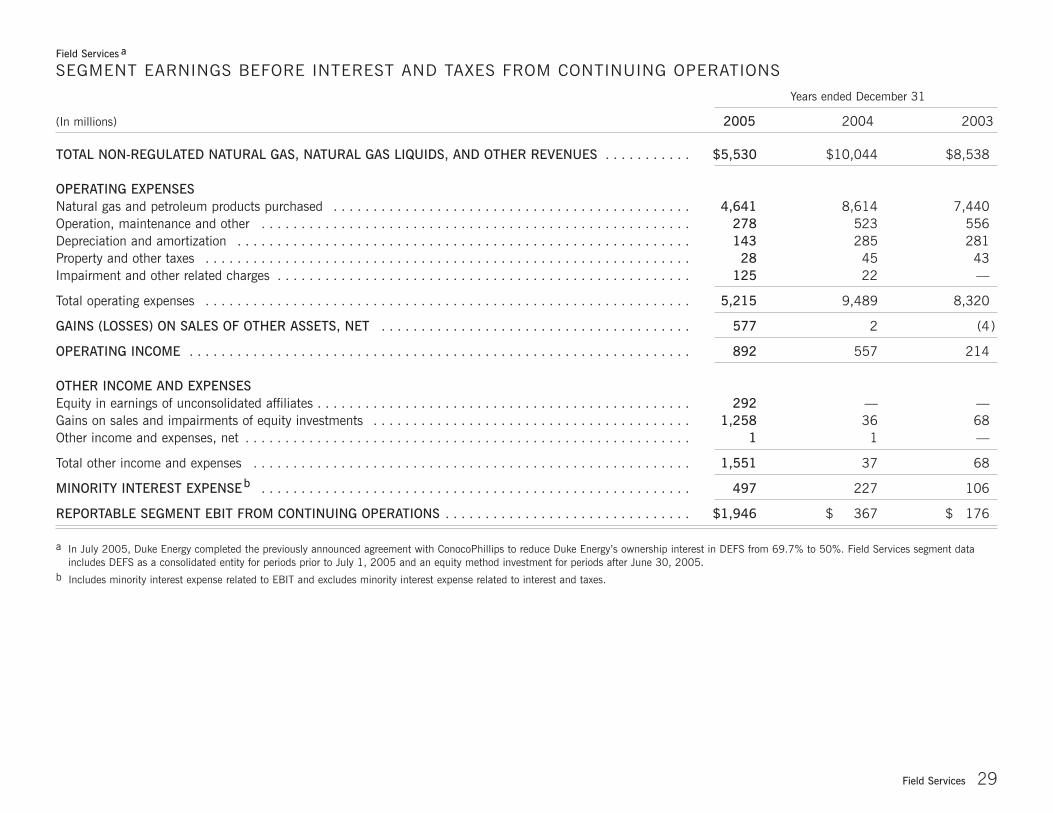
29Field Services
Years ended December 31
(In millions) 2005 2004 2003
TOTAL NON-REGULATED NATURAL GAS, NATURAL GAS LIQUIDS, AND OTHER REVENUES . . . . . . . . . . . $5,530 $10,044 $8,538
OPERATING EXPENSESNatural gas and petroleum products purchased . . . . . . . . . . . . . . . . . . . . . . . . . . . . . . . . . . . . . . . . . . . . . 4,641 8,614 7,440Operation, maintenance and other . . . . . . . . . . . . . . . . . . . . . . . . . . . . . . . . . . . . . . . . . . . . . . . . . . . . . . 278 523 556Depreciation and amortization . . . . . . . . . . . . . . . . . . . . . . . . . . . . . . . . . . . . . . . . . . . . . . . . . . . . . . . . . 143 285 281Property and other taxes . . . . . . . . . . . . . . . . . . . . . . . . . . . . . . . . . . . . . . . . . . . . . . . . . . . . . . . . . . . . . 28 45 43Impairment and other related charges . . . . . . . . . . . . . . . . . . . . . . . . . . . . . . . . . . . . . . . . . . . . . . . . . . . . 125 22 —
Total operating expenses . . . . . . . . . . . . . . . . . . . . . . . . . . . . . . . . . . . . . . . . . . . . . . . . . . . . . . . . . . . . . 5,215 9,489 8,320
GAINS (LOSSES) ON SALES OF OTHER ASSETS, NET . . . . . . . . . . . . . . . . . . . . . . . . . . . . . . . . . . . . . . . 577 2 (4)
OPERATING INCOME . . . . . . . . . . . . . . . . . . . . . . . . . . . . . . . . . . . . . . . . . . . . . . . . . . . . . . . . . . . . . . . 892 557 214
OTHER INCOME AND EXPENSESEquity in earnings of unconsolidated affiliates . . . . . . . . . . . . . . . . . . . . . . . . . . . . . . . . . . . . . . . . . . . . . . . 292 — —Gains on sales and impairments of equity investments . . . . . . . . . . . . . . . . . . . . . . . . . . . . . . . . . . . . . . . . 1,258 36 68Other income and expenses, net . . . . . . . . . . . . . . . . . . . . . . . . . . . . . . . . . . . . . . . . . . . . . . . . . . . . . . . . 1 1 —
Total other income and expenses . . . . . . . . . . . . . . . . . . . . . . . . . . . . . . . . . . . . . . . . . . . . . . . . . . . . . . . 1,551 37 68
MINORITY INTEREST EXPENSEb . . . . . . . . . . . . . . . . . . . . . . . . . . . . . . . . . . . . . . . . . . . . . . . . . . . . . . 497 227 106
REPORTABLE SEGMENT EBIT FROM CONTINUING OPERATIONS . . . . . . . . . . . . . . . . . . . . . . . . . . . . . . . $1,946 $ 367 $ 176
a In July 2005, Duke Energy completed the previously announced agreement with ConocoPhillips to reduce Duke Energy’s ownership interest in DEFS from 69.7% to 50%. Field Services segment dataincludes DEFS as a consolidated entity for periods prior to July 1, 2005 and an equity method investment for periods after June 30, 2005.
b Includes minority interest expense related to EBIT and excludes minority interest expense related to interest and taxes.
Field Services a
SEGMENT EARNINGS BEFORE INTEREST AND TAXES FROM CONTINUING OPERATIONS

30Field Services
Field Services a
SEGMENT BALANCE SHEETS - ASSETSDecember 31
(In millions) 2005 2004 2003
CURRENT ASSETSCash and cash equivalents . . . . . . . . . . . . . . . . . . . . . . . . . . . . . . . . . . . . . . . . . . . . . . . . . . . . . . . . . . $ — $ 18 $ 25Short-term investments . . . . . . . . . . . . . . . . . . . . . . . . . . . . . . . . . . . . . . . . . . . . . . . . . . . . . . . . . . . . . — 265 —Receivables, net . . . . . . . . . . . . . . . . . . . . . . . . . . . . . . . . . . . . . . . . . . . . . . . . . . . . . . . . . . . . . . . . . . 142 1,321 869Inventory . . . . . . . . . . . . . . . . . . . . . . . . . . . . . . . . . . . . . . . . . . . . . . . . . . . . . . . . . . . . . . . . . . . . . . . — 74 45Unrealized gains on mark-to-market and hedging transactions . . . . . . . . . . . . . . . . . . . . . . . . . . . . . . . . . . — 59 89Other . . . . . . . . . . . . . . . . . . . . . . . . . . . . . . . . . . . . . . . . . . . . . . . . . . . . . . . . . . . . . . . . . . . . . . . . . . (8 ) 17 18
Total current assets . . . . . . . . . . . . . . . . . . . . . . . . . . . . . . . . . . . . . . . . . . . . . . . . . . . . . . . . . . . . . . . . 134 1,754 1,046
INVESTMENTS AND OTHER ASSETSInvestments in unconsolidated affiliates . . . . . . . . . . . . . . . . . . . . . . . . . . . . . . . . . . . . . . . . . . . . . . . . . . 1,290 157 194Investments and advances in subsidiaries . . . . . . . . . . . . . . . . . . . . . . . . . . . . . . . . . . . . . . . . . . . . . . . . 4,900 10,957 34Goodwill . . . . . . . . . . . . . . . . . . . . . . . . . . . . . . . . . . . . . . . . . . . . . . . . . . . . . . . . . . . . . . . . . . . . . . . — 427 427Notes receivable . . . . . . . . . . . . . . . . . . . . . . . . . . . . . . . . . . . . . . . . . . . . . . . . . . . . . . . . . . . . . . . . . . — 213 261Unrealized (losses) gains on mark-to-market and hedging transactions . . . . . . . . . . . . . . . . . . . . . . . . . . . . — (9) 29Assets held for sale . . . . . . . . . . . . . . . . . . . . . . . . . . . . . . . . . . . . . . . . . . . . . . . . . . . . . . . . . . . . . . . . — 37 —Other . . . . . . . . . . . . . . . . . . . . . . . . . . . . . . . . . . . . . . . . . . . . . . . . . . . . . . . . . . . . . . . . . . . . . . . . . . (1 ) 96 188
Total investments and other assets . . . . . . . . . . . . . . . . . . . . . . . . . . . . . . . . . . . . . . . . . . . . . . . . . . . . . 6,189 11,878 1,133
PROPERTY, PLANT AND EQUIPMENTCost . . . . . . . . . . . . . . . . . . . . . . . . . . . . . . . . . . . . . . . . . . . . . . . . . . . . . . . . . . . . . . . . . . . . . . . . . . — 5,797 5,733Less accumulated depreciation and amortization . . . . . . . . . . . . . . . . . . . . . . . . . . . . . . . . . . . . . . . . . . . — 1,835 1,541
Net property, plant and equipment . . . . . . . . . . . . . . . . . . . . . . . . . . . . . . . . . . . . . . . . . . . . . . . . . . . . . — 3,962 4,192
TOTAL ASSETS . . . . . . . . . . . . . . . . . . . . . . . . . . . . . . . . . . . . . . . . . . . . . . . . . . . . . . . . . . . . . . . . . . 6,323 17,594 6,371
Intercompany balances . . . . . . . . . . . . . . . . . . . . . . . . . . . . . . . . . . . . . . . . . . . . . . . . . . . . . . . . . . . . . (4,900 ) (11,158) (276)
REPORTABLE SEGMENT ASSETS . . . . . . . . . . . . . . . . . . . . . . . . . . . . . . . . . . . . . . . . . . . . . . . . . . . . . $ 1,423 $ 6,436 $6,095
a In July 2005, Duke Energy completed the previously announced agreement with ConocoPhillips to reduce Duke Energy’s ownership interest in DEFS from 69.7% to 50%. Field Services segment dataincludes DEFS as a consolidated entity for periods prior to July 1, 2005 and an equity method investment for periods after June 30, 2005.

31Field Services
December 31
(In millions) 2005 2004 2003
CURRENT LIABILITIESAccounts payable . . . . . . . . . . . . . . . . . . . . . . . . . . . . . . . . . . . . . . . . . . . . . . . . . . . . . . . . . . . . . . . . . . $ 1 $ 1,160 $ 667Notes payable and commercial paper . . . . . . . . . . . . . . . . . . . . . . . . . . . . . . . . . . . . . . . . . . . . . . . . . . . . — — 22Taxes accrued . . . . . . . . . . . . . . . . . . . . . . . . . . . . . . . . . . . . . . . . . . . . . . . . . . . . . . . . . . . . . . . . . . . . 790 75 10Interest accrued . . . . . . . . . . . . . . . . . . . . . . . . . . . . . . . . . . . . . . . . . . . . . . . . . . . . . . . . . . . . . . . . . . . — 59 59Current maturities of long-term debt and preferred stock . . . . . . . . . . . . . . . . . . . . . . . . . . . . . . . . . . . . . . — 607 —Unrealized losses on mark-to-market and hedging transactions . . . . . . . . . . . . . . . . . . . . . . . . . . . . . . . . . . — 84 178Other . . . . . . . . . . . . . . . . . . . . . . . . . . . . . . . . . . . . . . . . . . . . . . . . . . . . . . . . . . . . . . . . . . . . . . . . . . — 275 152
Total current liabilities . . . . . . . . . . . . . . . . . . . . . . . . . . . . . . . . . . . . . . . . . . . . . . . . . . . . . . . . . . . . . . . 791 2,260 1,088
LONG-TERM DEBT . . . . . . . . . . . . . . . . . . . . . . . . . . . . . . . . . . . . . . . . . . . . . . . . . . . . . . . . . . . . . . . . — 1,648 2,261
DEFERRED CREDITS AND OTHER LIABILITIESDeferred income taxes . . . . . . . . . . . . . . . . . . . . . . . . . . . . . . . . . . . . . . . . . . . . . . . . . . . . . . . . . . . . . . 825 913 799Unrealized (gains) losses on mark-to-market and hedging transactions . . . . . . . . . . . . . . . . . . . . . . . . . . . . . — (27) 38Asset retirement obligations . . . . . . . . . . . . . . . . . . . . . . . . . . . . . . . . . . . . . . . . . . . . . . . . . . . . . . . . . . . — 46 37Other . . . . . . . . . . . . . . . . . . . . . . . . . . . . . . . . . . . . . . . . . . . . . . . . . . . . . . . . . . . . . . . . . . . . . . . . . . 3 51 24
Total deferred credits and other liabilities . . . . . . . . . . . . . . . . . . . . . . . . . . . . . . . . . . . . . . . . . . . . . . . . . 828 983 898
MINORITY INTERESTS . . . . . . . . . . . . . . . . . . . . . . . . . . . . . . . . . . . . . . . . . . . . . . . . . . . . . . . . . . . . . — 850 952
EQUITY . . . . . . . . . . . . . . . . . . . . . . . . . . . . . . . . . . . . . . . . . . . . . . . . . . . . . . . . . . . . . . . . . . . . . . . . . 4,704 11,853 1,172
TOTAL LIABILITIES AND EQUITY . . . . . . . . . . . . . . . . . . . . . . . . . . . . . . . . . . . . . . . . . . . . . . . . . . . . . . 6,323 17,594 6,371
Intercompany balances . . . . . . . . . . . . . . . . . . . . . . . . . . . . . . . . . . . . . . . . . . . . . . . . . . . . . . . . . . . . . . (4,900) (11,158) (276)
REPORTABLE SEGMENT LIABILITIES AND EQUITY . . . . . . . . . . . . . . . . . . . . . . . . . . . . . . . . . . . . . . . . . $ 1,423 $ 6,436 $6,095
a In July 2005, Duke Energy completed the previously announced agreement with ConocoPhillips to reduce Duke Energy’s ownership interest in DEFS from 69.7% to 50%. Field Services segment dataincludes DEFS as a consolidated entity for periods prior to July 1, 2005 and an equity method investment for periods after June 30, 2005.
Field Services a
SEGMENT BALANCE SHEETS - LIABILITIES AND EQUITY

32Field Services
Field Services
OPERATING STATISTICS
December 31
2005 2004 2003
Natural gas gathered and processed/transported, TBtu/d a . . . . . . . . . . . . . . . . . . . . . . . . . . . . . . . . . . . . . . . . . 6.8 6.8 7.0NGL production, MBbl/d b . . . . . . . . . . . . . . . . . . . . . . . . . . . . . . . . . . . . . . . . . . . . . . . . . . . . . . . . . . . . . . . 353 356 346
Average natural gas price per MMBtuc . . . . . . . . . . . . . . . . . . . . . . . . . . . . . . . . . . . . . . . . . . . . . . . . . . . . . . $8.59 $6.14 $5.39Average NGL price per gallond . . . . . . . . . . . . . . . . . . . . . . . . . . . . . . . . . . . . . . . . . . . . . . . . . . . . . . . . . . . . $0.85 $0.68 $0.53
a Trillion British thermal units per dayb Thousand barrels per dayc Million British thermal unitsd Does not reflect results of commodity hedges

33Duke Energy North America
DUKE ENERGY NORTH AMERICA
2005 AT A GLANCE
EBIT $— million
PLANT PRODUCTION 1,759 GWh
PROPORTIONAL CAPACITY IN OPERATION 3,600 MW
Houston
Bridgeport
MaineIndependence
Oakland
South Bay
Griffith
Arlington Valley
Moss LandingMorro Bay
Major OfficeDENA Continuing OperationsDENA Discontinued Operations
Lee
Hanging Rock
WashingtonFayetteVermillion

34Duke Energy North America
Duke Energy North America
SEGMENT EARNINGS BEFORE INTEREST AND TAXES FROM CONTINUING OPERATIONS
Years ended December 31
(In millions) 2005a 2004a 2003a
TOTAL NON-REGULATED ELECTRIC, NATURAL GAS, NATURAL GAS LIQUIDS, AND OTHER REVENUES . . . . . . . . . . . . . . . . . . . . . . . . . . . . . . . . . . . . . . . . . $— $ 173 $ 167
OPERATING EXPENSESNatural gas and petroleum products purchased . . . . . . . . . . . . . . . . . . . . . . . . . . . . . . . . . . . . . . . . . . . . . — — 3Operation, maintenance and other . . . . . . . . . . . . . . . . . . . . . . . . . . . . . . . . . . . . . . . . . . . . . . . . . . . . . . — 146 304Fuel used in electric generation and purchased power . . . . . . . . . . . . . . . . . . . . . . . . . . . . . . . . . . . . . . . . . — 142 67Depreciation and amortization . . . . . . . . . . . . . . . . . . . . . . . . . . . . . . . . . . . . . . . . . . . . . . . . . . . . . . . . . — 72 135Property and other taxes . . . . . . . . . . . . . . . . . . . . . . . . . . . . . . . . . . . . . . . . . . . . . . . . . . . . . . . . . . . . . — 8 10Impairment and other related charges . . . . . . . . . . . . . . . . . . . . . . . . . . . . . . . . . . . . . . . . . . . . . . . . . . . . — — 1,165b
Impairments of goodwill . . . . . . . . . . . . . . . . . . . . . . . . . . . . . . . . . . . . . . . . . . . . . . . . . . . . . . . . . . . . . . — — 254
Total operating expenses . . . . . . . . . . . . . . . . . . . . . . . . . . . . . . . . . . . . . . . . . . . . . . . . . . . . . . . . . . . . . — 368 1,938
LOSSES ON SALES OF OTHER ASSETS, NET . . . . . . . . . . . . . . . . . . . . . . . . . . . . . . . . . . . . . . . . . . . . . . — (427) (208)
OPERATING LOSS . . . . . . . . . . . . . . . . . . . . . . . . . . . . . . . . . . . . . . . . . . . . . . . . . . . . . . . . . . . . . . . . . — (622) (1,979)
OTHER INCOME AND EXPENSESEquity in earnings of unconsolidated affiliates . . . . . . . . . . . . . . . . . . . . . . . . . . . . . . . . . . . . . . . . . . . . . . . — — 15Gains on sales and impairments of equity investments . . . . . . . . . . . . . . . . . . . . . . . . . . . . . . . . . . . . . . . . — — 178Other income and expenses, net . . . . . . . . . . . . . . . . . . . . . . . . . . . . . . . . . . . . . . . . . . . . . . . . . . . . . . . . — 12 4
Total other income and expenses . . . . . . . . . . . . . . . . . . . . . . . . . . . . . . . . . . . . . . . . . . . . . . . . . . . . . . . — 12 197
MINORITY INTEREST EXPENSE c . . . . . . . . . . . . . . . . . . . . . . . . . . . . . . . . . . . . . . . . . . . . . . . . . . . . . . — (25) (106)
REPORTABLE SEGMENT EBIT FROM CONTINUING OPERATIONS . . . . . . . . . . . . . . . . . . . . . . . . . . . . . . . $— $(585) $(1,676)
a During the third quarter of 2005, the Board of Directors of Duke Energy authorized and directed management to execute the sale or disposition of substantially all of DENA’s remaining assets and contractsoutside the Midwestern United States and certain contractual positions related to Midwestern assets. As a result of this exit plan, DENA’s continuing operations (which include the operations of theMidwestern generation assets, DENA’s remaining Southeastern operations related to the assets which were disposed of in 2004, and the remaining operations of DETM) have been reclassified to Other in2005. DENA’s continuing operations for 2004 and 2003 are included as a component of DENA’s segment earnings.
b Includes impairments related to DENA’s plants and redesignation of power contracts to mark-to-market. c Includes minority interest expense (benefit) related to EBIT and excludes minority interest benefit related to interest and taxes.

35Duke Energy North America
December 31
(In millions) 2005a 2004 2003
CURRENT ASSETSCash and cash equivalents . . . . . . . . . . . . . . . . . . . . . . . . . . . . . . . . . . . . . . . . . . . . . . . . . . . . . . . . . . $ 15 $ 40 $ 51Short-term investments . . . . . . . . . . . . . . . . . . . . . . . . . . . . . . . . . . . . . . . . . . . . . . . . . . . . . . . . . . . . . — 1 1Receivables, net . . . . . . . . . . . . . . . . . . . . . . . . . . . . . . . . . . . . . . . . . . . . . . . . . . . . . . . . . . . . . . . . . . 1,043 1,434 1,933Inventory . . . . . . . . . . . . . . . . . . . . . . . . . . . . . . . . . . . . . . . . . . . . . . . . . . . . . . . . . . . . . . . . . . . . . . . — 90 63Assets held for sale . . . . . . . . . . . . . . . . . . . . . . . . . . . . . . . . . . . . . . . . . . . . . . . . . . . . . . . . . . . . . . . . 1,528 18 —Unrealized gains on mark-to-market and hedging transactions . . . . . . . . . . . . . . . . . . . . . . . . . . . . . . . . . . — 846 1,145Other . . . . . . . . . . . . . . . . . . . . . . . . . . . . . . . . . . . . . . . . . . . . . . . . . . . . . . . . . . . . . . . . . . . . . . . . . . 1,274 276 160
Total current assets . . . . . . . . . . . . . . . . . . . . . . . . . . . . . . . . . . . . . . . . . . . . . . . . . . . . . . . . . . . . . . . . 3,860 2,705 3,353
INVESTMENTS AND OTHER ASSETSInvestments in unconsolidated affiliates . . . . . . . . . . . . . . . . . . . . . . . . . . . . . . . . . . . . . . . . . . . . . . . . . . — 134 159Investments and advances in subsidiaries . . . . . . . . . . . . . . . . . . . . . . . . . . . . . . . . . . . . . . . . . . . . . . . . 635 — —Notes receivable . . . . . . . . . . . . . . . . . . . . . . . . . . . . . . . . . . . . . . . . . . . . . . . . . . . . . . . . . . . . . . . . . . 4,203 4,334 901Unrealized gains on mark-to-market and hedging transactions . . . . . . . . . . . . . . . . . . . . . . . . . . . . . . . . . . — 1,258 1,599Assets held for sale . . . . . . . . . . . . . . . . . . . . . . . . . . . . . . . . . . . . . . . . . . . . . . . . . . . . . . . . . . . . . . . . 3,585 48 120Other . . . . . . . . . . . . . . . . . . . . . . . . . . . . . . . . . . . . . . . . . . . . . . . . . . . . . . . . . . . . . . . . . . . . . . . . . . — 1,583 (102)
Total investments and other assets . . . . . . . . . . . . . . . . . . . . . . . . . . . . . . . . . . . . . . . . . . . . . . . . . . . . . 8,423 7,357 2,677
PROPERTY, PLANT AND EQUIPMENTCost . . . . . . . . . . . . . . . . . . . . . . . . . . . . . . . . . . . . . . . . . . . . . . . . . . . . . . . . . . . . . . . . . . . . . . . . . . — 2,061 2,107Less accumulated depreciation and amortization . . . . . . . . . . . . . . . . . . . . . . . . . . . . . . . . . . . . . . . . . . . — 390 290
Net property, plant and equipment . . . . . . . . . . . . . . . . . . . . . . . . . . . . . . . . . . . . . . . . . . . . . . . . . . . . . — 1,671 1,817
TOTAL ASSETS . . . . . . . . . . . . . . . . . . . . . . . . . . . . . . . . . . . . . . . . . . . . . . . . . . . . . . . . . . . . . . . . . . 12,489 11,733 7,847
Intercompany balances . . . . . . . . . . . . . . . . . . . . . . . . . . . . . . . . . . . . . . . . . . . . . . . . . . . . . . . . . . . . . (5,185) (5,014) 1,318
REPORTABLE SEGMENT ASSETS . . . . . . . . . . . . . . . . . . . . . . . . . . . . . . . . . . . . . . . . . . . . . . . . . . . . . $ 7,304 $ 6,719 $9,165
a Represents assets and liabilities associated with DENA’s discontinued operations. Assets and liabilities associated with DENA’s continuing operations are included in Other.
Duke Energy North America
SEGMENT BALANCE SHEETS - ASSETS
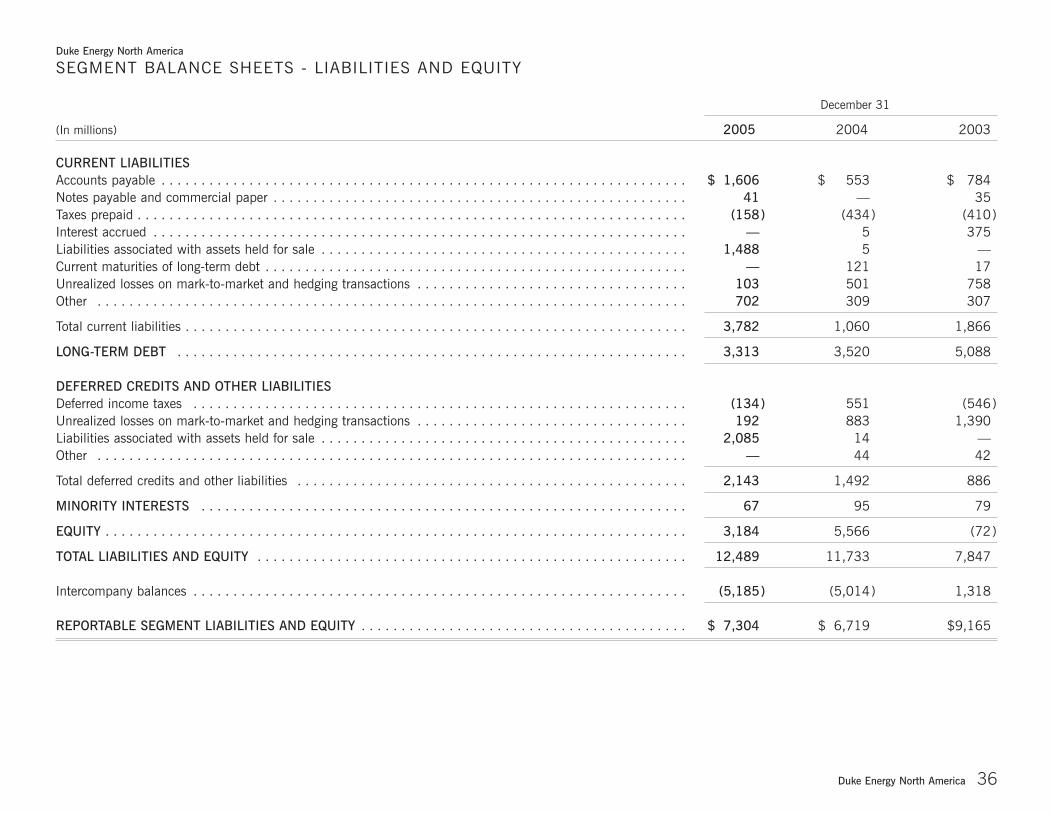
36Duke Energy North America
Duke Energy North America
SEGMENT BALANCE SHEETS - LIABILITIES AND EQUITY
December 31
(In millions) 2005 2004 2003
CURRENT LIABILITIESAccounts payable . . . . . . . . . . . . . . . . . . . . . . . . . . . . . . . . . . . . . . . . . . . . . . . . . . . . . . . . . . . . . . . . . . $ 1,606 $ 553 $ 784Notes payable and commercial paper . . . . . . . . . . . . . . . . . . . . . . . . . . . . . . . . . . . . . . . . . . . . . . . . . . . . 41 — 35Taxes prepaid . . . . . . . . . . . . . . . . . . . . . . . . . . . . . . . . . . . . . . . . . . . . . . . . . . . . . . . . . . . . . . . . . . . . . (158) (434) (410)Interest accrued . . . . . . . . . . . . . . . . . . . . . . . . . . . . . . . . . . . . . . . . . . . . . . . . . . . . . . . . . . . . . . . . . . . — 5 375Liabilities associated with assets held for sale . . . . . . . . . . . . . . . . . . . . . . . . . . . . . . . . . . . . . . . . . . . . . . 1,488 5 —Current maturities of long-term debt . . . . . . . . . . . . . . . . . . . . . . . . . . . . . . . . . . . . . . . . . . . . . . . . . . . . . — 121 17Unrealized losses on mark-to-market and hedging transactions . . . . . . . . . . . . . . . . . . . . . . . . . . . . . . . . . . 103 501 758Other . . . . . . . . . . . . . . . . . . . . . . . . . . . . . . . . . . . . . . . . . . . . . . . . . . . . . . . . . . . . . . . . . . . . . . . . . . 702 309 307
Total current liabilities . . . . . . . . . . . . . . . . . . . . . . . . . . . . . . . . . . . . . . . . . . . . . . . . . . . . . . . . . . . . . . . 3,782 1,060 1,866
LONG-TERM DEBT . . . . . . . . . . . . . . . . . . . . . . . . . . . . . . . . . . . . . . . . . . . . . . . . . . . . . . . . . . . . . . . . 3,313 3,520 5,088
DEFERRED CREDITS AND OTHER LIABILITIESDeferred income taxes . . . . . . . . . . . . . . . . . . . . . . . . . . . . . . . . . . . . . . . . . . . . . . . . . . . . . . . . . . . . . . (134) 551 (546)Unrealized losses on mark-to-market and hedging transactions . . . . . . . . . . . . . . . . . . . . . . . . . . . . . . . . . . 192 883 1,390Liabilities associated with assets held for sale . . . . . . . . . . . . . . . . . . . . . . . . . . . . . . . . . . . . . . . . . . . . . . 2,085 14 —Other . . . . . . . . . . . . . . . . . . . . . . . . . . . . . . . . . . . . . . . . . . . . . . . . . . . . . . . . . . . . . . . . . . . . . . . . . . — 44 42
Total deferred credits and other liabilities . . . . . . . . . . . . . . . . . . . . . . . . . . . . . . . . . . . . . . . . . . . . . . . . . 2,143 1,492 886
MINORITY INTERESTS . . . . . . . . . . . . . . . . . . . . . . . . . . . . . . . . . . . . . . . . . . . . . . . . . . . . . . . . . . . . . 67 95 79
EQUITY . . . . . . . . . . . . . . . . . . . . . . . . . . . . . . . . . . . . . . . . . . . . . . . . . . . . . . . . . . . . . . . . . . . . . . . . . 3,184 5,566 (72)
TOTAL LIABILITIES AND EQUITY . . . . . . . . . . . . . . . . . . . . . . . . . . . . . . . . . . . . . . . . . . . . . . . . . . . . . . 12,489 11,733 7,847
Intercompany balances . . . . . . . . . . . . . . . . . . . . . . . . . . . . . . . . . . . . . . . . . . . . . . . . . . . . . . . . . . . . . . (5,185) (5,014) 1,318
REPORTABLE SEGMENT LIABILITIES AND EQUITY . . . . . . . . . . . . . . . . . . . . . . . . . . . . . . . . . . . . . . . . . $ 7,304 $ 6,719 $9,165

37Duke Energy North America
Duke Energy North America
OPERATING STATISTICS
December 31
2005 2004 2003
Actual plant production, gigawatt-hoursa,b . . . . . . . . . . . . . . . . . . . . . . . . . . . . . . . . . . . . . . . . . . . . . . . . 1,759 3,343 6,084
Net Proportional megawatt capacity in operationb . . . . . . . . . . . . . . . . . . . . . . . . . . . . . . . . . . . . . . . . . . . 3,600 3,600 9,085
a Includes plant production from plants accounted for under the equity method.b Excludes discontinued operations.

38International Energy
INTERNATIONAL ENERGY
2005 AT A GLANCE
EBIT $314 million
SALES 18,213 GWh
PROPORTIONAL CAPACITY IN OPERATION 3,937 MW
DEI El SalvadorEl Salvador
GuatemalaDEI Guatemala
ElectroquilEcuador
Mexico
EgenorPeru
Lima
San Salvador
Sao Paulo
BuenosAires
AguaytiaPeru
Houston
Mexico City
Guatemala City
Corani Bolivia
ParanapanemaBrazil
Compañía de Serviciosde Compresión deCampeche
HidroelectricaCerros ColoradosArgentina
National Methanol Co.Saudi Arabia
OfficeOperating Plant

39International Energy
Years ended December 31
(In millions) 2005 2004 2003
TOTAL NON-REGULATED ELECTRIC, NATURAL GAS, NATURAL GAS LIQUIDS, AND OTHER REVENUES . . . . . . . . . . . . . . . . . . . . . . . . . . . . . . . . . . . . . . . . . $745 $619 $597
OPERATING EXPENSESNatural gas and petroleum products purchased . . . . . . . . . . . . . . . . . . . . . . . . . . . . . . . . . . . . . . . . . . . . . 9 4 52Operation, maintenance and other . . . . . . . . . . . . . . . . . . . . . . . . . . . . . . . . . . . . . . . . . . . . . . . . . . . . . . 181 164 107Fuel used in electric generation and purchased power . . . . . . . . . . . . . . . . . . . . . . . . . . . . . . . . . . . . . . . . . 257 228 205Depreciation and amortization . . . . . . . . . . . . . . . . . . . . . . . . . . . . . . . . . . . . . . . . . . . . . . . . . . . . . . . . . 64 58 57Property and other taxes . . . . . . . . . . . . . . . . . . . . . . . . . . . . . . . . . . . . . . . . . . . . . . . . . . . . . . . . . . . . . 25 8 5
Total operating expenses . . . . . . . . . . . . . . . . . . . . . . . . . . . . . . . . . . . . . . . . . . . . . . . . . . . . . . . . . . . . . 536 462 426
LOSSES ON SALES OF OTHER ASSETS, NET . . . . . . . . . . . . . . . . . . . . . . . . . . . . . . . . . . . . . . . . . . . . . . — (3) —
OPERATING INCOME . . . . . . . . . . . . . . . . . . . . . . . . . . . . . . . . . . . . . . . . . . . . . . . . . . . . . . . . . . . . . . . 209 154 171
OTHER INCOME AND EXPENSESEquity in earnings of unconsolidated affiliates . . . . . . . . . . . . . . . . . . . . . . . . . . . . . . . . . . . . . . . . . . . . . . . 114 51 27(Losses) gains on sales and impairments of equity investments . . . . . . . . . . . . . . . . . . . . . . . . . . . . . . . . . . (20) 2 —Other income and expenses, net . . . . . . . . . . . . . . . . . . . . . . . . . . . . . . . . . . . . . . . . . . . . . . . . . . . . . . . . 23 25 30
Total other income and expenses . . . . . . . . . . . . . . . . . . . . . . . . . . . . . . . . . . . . . . . . . . . . . . . . . . . . . . . 117 78 57
MINORITY INTEREST EXPENSE a . . . . . . . . . . . . . . . . . . . . . . . . . . . . . . . . . . . . . . . . . . . . . . . . . . . . . . 12 10 13
REPORTABLE SEGMENT EBIT . . . . . . . . . . . . . . . . . . . . . . . . . . . . . . . . . . . . . . . . . . . . . . . . . . . . . . . . . $314 $222 $215
a Includes minority interest expense related to EBIT and excludes minority interest expense related to interest and taxes.
International Energy
SEGMENT EARNINGS BEFORE INTEREST AND TAXES

40International Energy
International Energy
SEGMENT BALANCE SHEETS - ASSETS
December 31
(In millions) 2005 2004 2003
CURRENT ASSETSCash and cash equivalents . . . . . . . . . . . . . . . . . . . . . . . . . . . . . . . . . . . . . . . . . . . . . . . . . . . . . . . . . . $ 165 $ 301 $ 67Receivables, net . . . . . . . . . . . . . . . . . . . . . . . . . . . . . . . . . . . . . . . . . . . . . . . . . . . . . . . . . . . . . . . . . . 1,089 603 344Inventory . . . . . . . . . . . . . . . . . . . . . . . . . . . . . . . . . . . . . . . . . . . . . . . . . . . . . . . . . . . . . . . . . . . . . . . 37 34 28Assets held for sale . . . . . . . . . . . . . . . . . . . . . . . . . . . . . . . . . . . . . . . . . . . . . . . . . . . . . . . . . . . . . . . . — 22 346Unrealized (losses) gains on mark-to-market and hedging transactions . . . . . . . . . . . . . . . . . . . . . . . . . . . . — — (2)Other . . . . . . . . . . . . . . . . . . . . . . . . . . . . . . . . . . . . . . . . . . . . . . . . . . . . . . . . . . . . . . . . . . . . . . . . . 41 18 21
Total current assets . . . . . . . . . . . . . . . . . . . . . . . . . . . . . . . . . . . . . . . . . . . . . . . . . . . . . . . . . . . . . . . . 1,332 978 804
INVESTMENTS AND OTHER ASSETSInvestments in unconsolidated affiliates . . . . . . . . . . . . . . . . . . . . . . . . . . . . . . . . . . . . . . . . . . . . . . . . . 155 167 147Investments and advances in subsidiaries . . . . . . . . . . . . . . . . . . . . . . . . . . . . . . . . . . . . . . . . . . . . . . . . (106 ) (79) (258)Goodwill . . . . . . . . . . . . . . . . . . . . . . . . . . . . . . . . . . . . . . . . . . . . . . . . . . . . . . . . . . . . . . . . . . . . . . . 256 245 238Notes receivable . . . . . . . . . . . . . . . . . . . . . . . . . . . . . . . . . . . . . . . . . . . . . . . . . . . . . . . . . . . . . . . . . . 67 68 128Assets held for sale . . . . . . . . . . . . . . . . . . . . . . . . . . . . . . . . . . . . . . . . . . . . . . . . . . . . . . . . . . . . . . . . — — 1,216Other . . . . . . . . . . . . . . . . . . . . . . . . . . . . . . . . . . . . . . . . . . . . . . . . . . . . . . . . . . . . . . . . . . . . . . . . . 180 198 261
Total investments and other assets . . . . . . . . . . . . . . . . . . . . . . . . . . . . . . . . . . . . . . . . . . . . . . . . . . . . . 552 599 1,732
PROPERTY, PLANT AND EQUIPMENTCost . . . . . . . . . . . . . . . . . . . . . . . . . . . . . . . . . . . . . . . . . . . . . . . . . . . . . . . . . . . . . . . . . . . . . . . . . . 2,283 2,189 2,016Less accumulated depreciation and amortization . . . . . . . . . . . . . . . . . . . . . . . . . . . . . . . . . . . . . . . . . . . 412 371 264
Net property, plant and equipment . . . . . . . . . . . . . . . . . . . . . . . . . . . . . . . . . . . . . . . . . . . . . . . . . . . . . 1,871 1,818 1,752
TOTAL ASSETS . . . . . . . . . . . . . . . . . . . . . . . . . . . . . . . . . . . . . . . . . . . . . . . . . . . . . . . . . . . . . . . . . . 3,755 3,395 4,288
Intercompany balances . . . . . . . . . . . . . . . . . . . . . . . . . . . . . . . . . . . . . . . . . . . . . . . . . . . . . . . . . . . . . (592 ) (66) 262
REPORTABLE SEGMENT ASSETS . . . . . . . . . . . . . . . . . . . . . . . . . . . . . . . . . . . . . . . . . . . . . . . . . . . . . $3,163 $3,329 $4,550

41International Energy
December 31
(In millions) 2005 2004 2003
CURRENT LIABILITIESAccounts payable . . . . . . . . . . . . . . . . . . . . . . . . . . . . . . . . . . . . . . . . . . . . . . . . . . . . . . . . . . . . . . . . . . $ 52 $ 35 $ 25Taxes accrued . . . . . . . . . . . . . . . . . . . . . . . . . . . . . . . . . . . . . . . . . . . . . . . . . . . . . . . . . . . . . . . . . . . . 105 212 58Interest accrued . . . . . . . . . . . . . . . . . . . . . . . . . . . . . . . . . . . . . . . . . . . . . . . . . . . . . . . . . . . . . . . . . . . 5 1 3Liabilities associated with assets held for sale . . . . . . . . . . . . . . . . . . . . . . . . . . . . . . . . . . . . . . . . . . . . . . — 25 651Current maturities of long-term debt . . . . . . . . . . . . . . . . . . . . . . . . . . . . . . . . . . . . . . . . . . . . . . . . . . . . . 63 61 95Other . . . . . . . . . . . . . . . . . . . . . . . . . . . . . . . . . . . . . . . . . . . . . . . . . . . . . . . . . . . . . . . . . . . . . . . . . . 56 53 60
Total current liabilities . . . . . . . . . . . . . . . . . . . . . . . . . . . . . . . . . . . . . . . . . . . . . . . . . . . . . . . . . . . . . . . 281 387 892
LONG-TERM DEBT . . . . . . . . . . . . . . . . . . . . . . . . . . . . . . . . . . . . . . . . . . . . . . . . . . . . . . . . . . . . . . . . 775 513 476
DEFERRED CREDITS AND OTHER LIABILITIESDeferred income taxes . . . . . . . . . . . . . . . . . . . . . . . . . . . . . . . . . . . . . . . . . . . . . . . . . . . . . . . . . . . . . . 92 96 123Liabilities associated with assets held for sale . . . . . . . . . . . . . . . . . . . . . . . . . . . . . . . . . . . . . . . . . . . . . . — — 737Other . . . . . . . . . . . . . . . . . . . . . . . . . . . . . . . . . . . . . . . . . . . . . . . . . . . . . . . . . . . . . . . . . . . . . . . . . . 51 56 68
Total deferred credits and other liabilities . . . . . . . . . . . . . . . . . . . . . . . . . . . . . . . . . . . . . . . . . . . . . . . . . 143 152 928
MINORITY INTERESTS . . . . . . . . . . . . . . . . . . . . . . . . . . . . . . . . . . . . . . . . . . . . . . . . . . . . . . . . . . . . . 122 132 124
EQUITY . . . . . . . . . . . . . . . . . . . . . . . . . . . . . . . . . . . . . . . . . . . . . . . . . . . . . . . . . . . . . . . . . . . . . . . . . 2,434 2,211 1,866
TOTAL LIABILITIES AND EQUITY . . . . . . . . . . . . . . . . . . . . . . . . . . . . . . . . . . . . . . . . . . . . . . . . . . . . . . 3,755 3,395 4,288
Intercompany balances . . . . . . . . . . . . . . . . . . . . . . . . . . . . . . . . . . . . . . . . . . . . . . . . . . . . . . . . . . . . . . (592) (66) 262
REPORTABLE SEGMENT LIABILITIES AND EQUITY . . . . . . . . . . . . . . . . . . . . . . . . . . . . . . . . . . . . . . . . . $3,163 $3,329 $4,550
International Energy
SEGMENT BALANCE SHEETS - LIABILITIES AND EQUITY
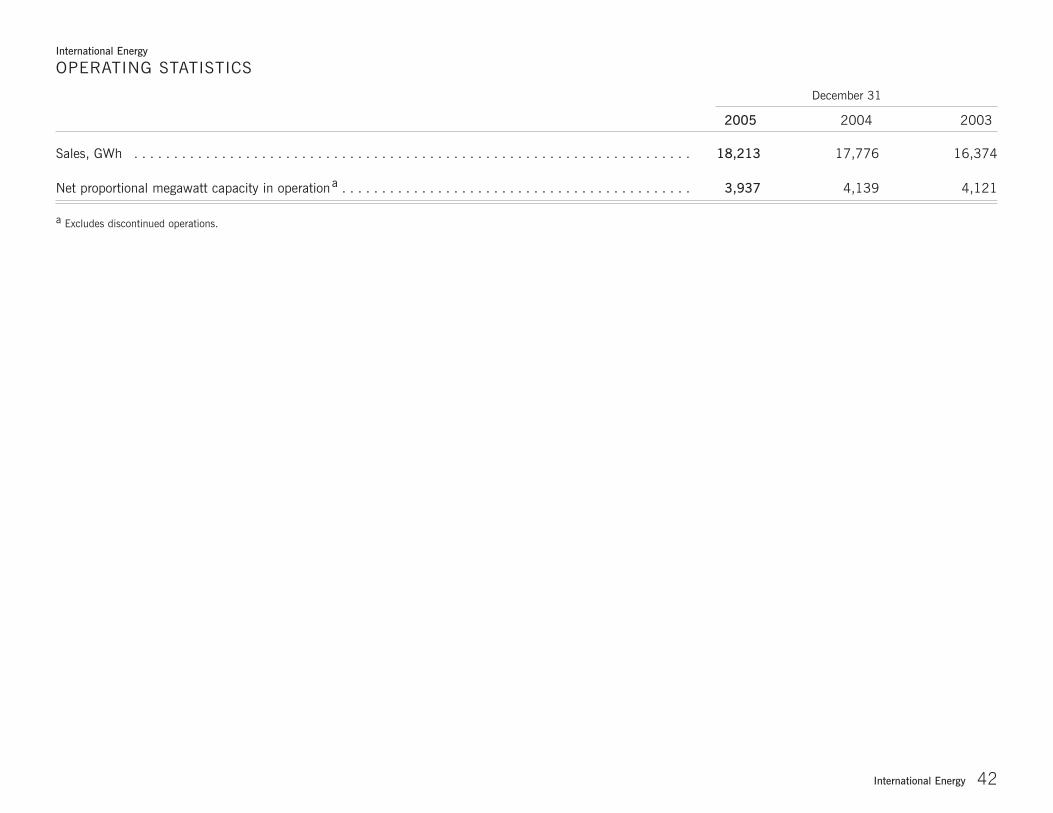
42International Energy
December 31
2005 2004 2003
Sales, GWh . . . . . . . . . . . . . . . . . . . . . . . . . . . . . . . . . . . . . . . . . . . . . . . . . . . . . . . . . . . . . . . . . . . . . . 18,213 17,776 16,374
Net proportional megawatt capacity in operationa . . . . . . . . . . . . . . . . . . . . . . . . . . . . . . . . . . . . . . . . . . . . 3,937 4,139 4,121
a Excludes discontinued operations.
International Energy
OPERATING STATISTICS

43Crescent Resources
CRESCENT RESOURCES
2005 AT A GLANCE
EBIT $314 million
RESIDENTIAL LOTS SOLD 2,483
COMMERCIAL SQUARE FOOTAGE SOLD 0.6 million
MULTI-FAMILY UNITS SOLD 352
SURPLUS (LEGACY) LAND SOLD 14,414 acres
Nashville
Lake James
Charlotte
Lake Keowee
Columbia
Atlanta
Jacksonville
Tampa
Orlando
HiltonHead

44Crescent Resources
Years ended December 31
(In millions) 2005 2004 2003
OPERATING REVENUES . . . . . . . . . . . . . . . . . . . . . . . . . . . . . . . . . . . . . . . . . . . . . . . . . . . . . . . . . . . . . $495 $437 $284
OPERATING EXPENSESOperation, maintenance and other . . . . . . . . . . . . . . . . . . . . . . . . . . . . . . . . . . . . . . . . . . . . . . . . . . . . . . 376 343 219Depreciation and amortization . . . . . . . . . . . . . . . . . . . . . . . . . . . . . . . . . . . . . . . . . . . . . . . . . . . . . . . . . 1 2 6Property and other taxes . . . . . . . . . . . . . . . . . . . . . . . . . . . . . . . . . . . . . . . . . . . . . . . . . . . . . . . . . . . . . 7 6 6Impairment and other related charges . . . . . . . . . . . . . . . . . . . . . . . . . . . . . . . . . . . . . . . . . . . . . . . . . . . . 15 42 —
Total operating expenses . . . . . . . . . . . . . . . . . . . . . . . . . . . . . . . . . . . . . . . . . . . . . . . . . . . . . . . . . . . . . 399 393 231
GAINS ON SALES OF INVESTMENTS IN COMMERCIAL AND MULTI-FAMILY REAL ESTATE . . . . . . . . . . . . . 191 192 84
OPERATING INCOME . . . . . . . . . . . . . . . . . . . . . . . . . . . . . . . . . . . . . . . . . . . . . . . . . . . . . . . . . . . . . . . 287 236 137
OTHER INCOME AND EXPENSESEquity in (loss) earnings of unconsolidated affiliates . . . . . . . . . . . . . . . . . . . . . . . . . . . . . . . . . . . . . . . . . . (1) 3 —Other income and expenses, net . . . . . . . . . . . . . . . . . . . . . . . . . . . . . . . . . . . . . . . . . . . . . . . . . . . . . . . . 45 — —
Total other income and expenses . . . . . . . . . . . . . . . . . . . . . . . . . . . . . . . . . . . . . . . . . . . . . . . . . . . . . . . 44 3 —
MINORITY INTEREST EXPENSE (BENEFIT)a . . . . . . . . . . . . . . . . . . . . . . . . . . . . . . . . . . . . . . . . . . . . . . 17 (1) 3
REPORTABLE SEGMENT EBIT FROM CONTINUING OPERATIONS . . . . . . . . . . . . . . . . . . . . . . . . . . . . . . . $314 $240 $134
a Includes minority interest expense (benefit) related to EBIT and excludes minority interest expense (benefit) related to interest and taxes.
Crescent Resources
SEGMENT EARNINGS BEFORE INTEREST AND TAXES FROM CONTINUING OPERATIONS

45Crescent Resources
Crescent Resources
SEGMENT BALANCE SHEETS - ASSETS
December 31
(In millions) 2005 2004 2003
CURRENT ASSETSCash and cash equivalents . . . . . . . . . . . . . . . . . . . . . . . . . . . . . . . . . . . . . . . . . . . . . . . . . . . . . . . . . . $ 76 $ 25 $ 18Receivables . . . . . . . . . . . . . . . . . . . . . . . . . . . . . . . . . . . . . . . . . . . . . . . . . . . . . . . . . . . . . . . . . . . . . 144 95 171
Total current assets . . . . . . . . . . . . . . . . . . . . . . . . . . . . . . . . . . . . . . . . . . . . . . . . . . . . . . . . . . . . . . . . 220 120 189
INVESTMENTS AND OTHER ASSETSInvestments in unconsolidated affiliates . . . . . . . . . . . . . . . . . . . . . . . . . . . . . . . . . . . . . . . . . . . . . . . . . 17 20 15Investments and advances in subsidiaries . . . . . . . . . . . . . . . . . . . . . . . . . . . . . . . . . . . . . . . . . . . . . . . . 1,039 772 133Goodwill . . . . . . . . . . . . . . . . . . . . . . . . . . . . . . . . . . . . . . . . . . . . . . . . . . . . . . . . . . . . . . . . . . . . . . . 7 7 7Notes receivable . . . . . . . . . . . . . . . . . . . . . . . . . . . . . . . . . . . . . . . . . . . . . . . . . . . . . . . . . . . . . . . . . . 37 55 102Investments in residential, commercial and multi-family real estate (net of accumulated depreciation of $17 million in 2005, $15 million in 2004, and $32 million in 2003) . . . . . . . . . . . . . . . 1,253 1,104 1,331
Other . . . . . . . . . . . . . . . . . . . . . . . . . . . . . . . . . . . . . . . . . . . . . . . . . . . . . . . . . . . . . . . . . . . . . . . . . 8 9 10
Total investments and other assets . . . . . . . . . . . . . . . . . . . . . . . . . . . . . . . . . . . . . . . . . . . . . . . . . . . . . 2,361 1,967 1,598
TOTAL ASSETS . . . . . . . . . . . . . . . . . . . . . . . . . . . . . . . . . . . . . . . . . . . . . . . . . . . . . . . . . . . . . . . . . . 2,581 2,087 1,787
Intercompany balances . . . . . . . . . . . . . . . . . . . . . . . . . . . . . . . . . . . . . . . . . . . . . . . . . . . . . . . . . . . . . (1,040 ) (772) (134)
REPORTABLE SEGMENT ASSETS . . . . . . . . . . . . . . . . . . . . . . . . . . . . . . . . . . . . . . . . . . . . . . . . . . . . . $ 1,541 $1,315 $1,653

46Crescent Resources
December 31
(In millions) 2005 2004 2003
CURRENT LIABILITIESAccounts payable . . . . . . . . . . . . . . . . . . . . . . . . . . . . . . . . . . . . . . . . . . . . . . . . . . . . . . . . . . . . . . . . . . $ 40 $ (1) $ (1)Taxes accrued . . . . . . . . . . . . . . . . . . . . . . . . . . . . . . . . . . . . . . . . . . . . . . . . . . . . . . . . . . . . . . . . . . . . 3 9 9Interest accrued . . . . . . . . . . . . . . . . . . . . . . . . . . . . . . . . . . . . . . . . . . . . . . . . . . . . . . . . . . . . . . . . . . . 1 1 1Current maturities of long-term debt . . . . . . . . . . . . . . . . . . . . . . . . . . . . . . . . . . . . . . . . . . . . . . . . . . . . . 2 11 11Other . . . . . . . . . . . . . . . . . . . . . . . . . . . . . . . . . . . . . . . . . . . . . . . . . . . . . . . . . . . . . . . . . . . . . . . . . . 289 147 109
Total current liabilities . . . . . . . . . . . . . . . . . . . . . . . . . . . . . . . . . . . . . . . . . . . . . . . . . . . . . . . . . . . . . . . 335 167 129
LONG-TERM DEBT . . . . . . . . . . . . . . . . . . . . . . . . . . . . . . . . . . . . . . . . . . . . . . . . . . . . . . . . . . . . . . . . 23 23 22
DEFERRED CREDITS AND OTHER LIABILITIES . . . . . . . . . . . . . . . . . . . . . . . . . . . . . . . . . . . . . . . . . . . . 40 28 45
MINORITY INTERESTS . . . . . . . . . . . . . . . . . . . . . . . . . . . . . . . . . . . . . . . . . . . . . . . . . . . . . . . . . . . . . 47 59 30
EQUITY . . . . . . . . . . . . . . . . . . . . . . . . . . . . . . . . . . . . . . . . . . . . . . . . . . . . . . . . . . . . . . . . . . . . . . . . . 2,136 1,810 1,561
TOTAL LIABILITIES AND EQUITY . . . . . . . . . . . . . . . . . . . . . . . . . . . . . . . . . . . . . . . . . . . . . . . . . . . . . . 2,581 2,087 1,787
Intercompany balances . . . . . . . . . . . . . . . . . . . . . . . . . . . . . . . . . . . . . . . . . . . . . . . . . . . . . . . . . . . . . . (1,040) (772) (134)
REPORTABLE SEGMENT LIABILITIES AND EQUITY . . . . . . . . . . . . . . . . . . . . . . . . . . . . . . . . . . . . . . . . . $ 1,541 $1,315 $1,653
Crescent Resources
SEGMENT BALANCE SHEETS - LIABILITIES AND EQUITY
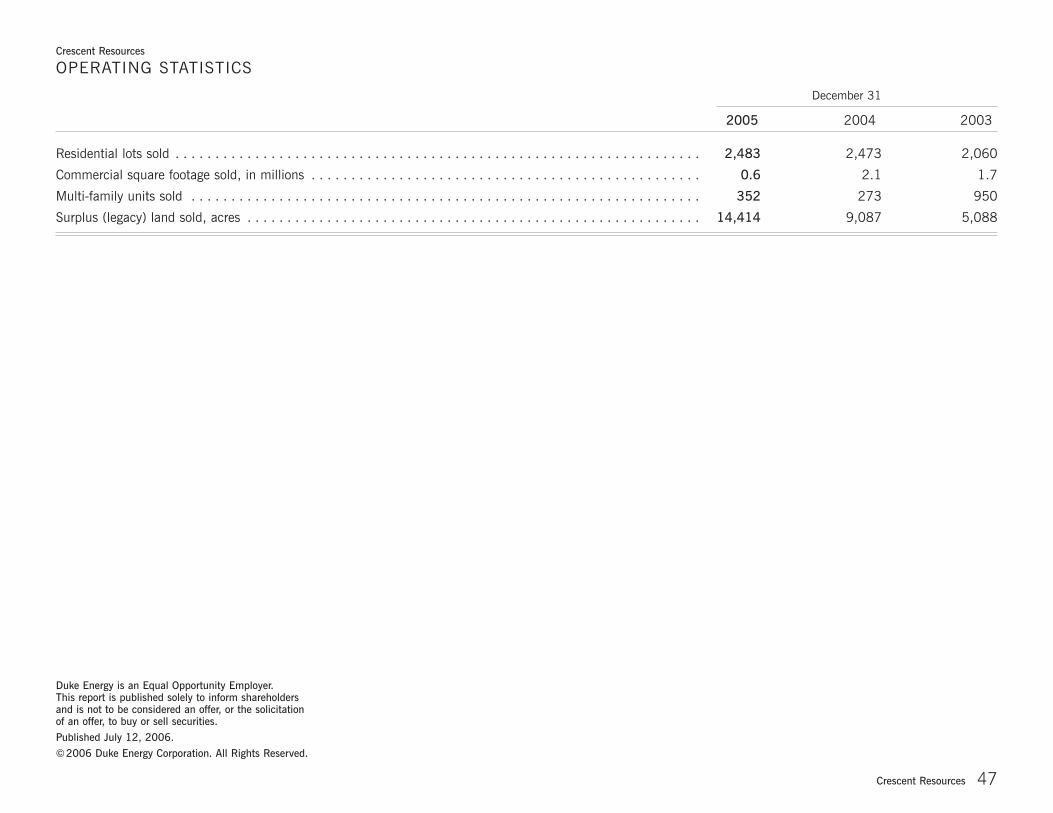
47Crescent Resources
December 31
2005 2004 2003
Residential lots sold . . . . . . . . . . . . . . . . . . . . . . . . . . . . . . . . . . . . . . . . . . . . . . . . . . . . . . . . . . . . . . . . . . 2,483 2,473 2,060
Commercial square footage sold, in millions . . . . . . . . . . . . . . . . . . . . . . . . . . . . . . . . . . . . . . . . . . . . . . . . . 0.6 2.1 1.7
Multi-family units sold . . . . . . . . . . . . . . . . . . . . . . . . . . . . . . . . . . . . . . . . . . . . . . . . . . . . . . . . . . . . . . . . 352 273 950
Surplus (legacy) land sold, acres . . . . . . . . . . . . . . . . . . . . . . . . . . . . . . . . . . . . . . . . . . . . . . . . . . . . . . . . . 14,414 9,087 5,088
Crescent Resources
OPERATING STATISTICS
Duke Energy is an Equal Opportunity Employer.This report is published solely to inform shareholders and is not to be considered an offer, or the solicitation of an offer, to buy or sell securities.Published July 12, 2006.©2006 Duke Energy Corporation. All Rights Reserved.