Duffy - Turning Point Analysis in Price and Time
127
Turning Point Analysis In Price And Time 16 Precise Methods Anticipate Market Turns And Pinpoint Highs And Lows written by Joseph T. Duffy
-
Upload
paul-perry -
Category
Documents
-
view
1.098 -
download
285
Transcript of Duffy - Turning Point Analysis in Price and Time
Turning Point Analysis In Price And Time
16 Precise Methods Anticipate Market Turns And Pinpoint
Highs And Lows
written by Joseph T. Duffy

PREFACE
This manual is a follow up to its predecessor T h e Trading Aduuntage." The Turning Point Analysis manual cant ains what I have found in my own trading to be the most powerful techniques for forecasting trend changes in price and time.
The material contained in these two manuals contain all of the G m , Fibonacci, and charting techniques I use in my own trading to forecast market movements and turning points. While the learning pmess never stops, nothing is being held back in this book, including some completely new material in the literature of technical analysis.
The combination of techniques detailed in these manuals has proven ta work for me in actual trading. This includes three real time, real money trading contests, not hypothetical or paper trading. In addition to trading, I also use these techniques in pmviding technical commentary and proprietary trading recommendations to an international trading institution.
Overall, this is an approach that I believe anyone can learn. Any trader should be able to integrate at least a few of the techniques into their own trading.
Lastly, remember that wanting to win at trading is the easy part, preparing to win is the di fh~l t part. Only if you are willing to do the homework, can you be successful. Good luck, and g o d trading.
Joe D u e 1994

I Contents
I . Advanced Fibonacci Analysis Techniques Introduction ................................................................................................................ 1 Fibonacci Spatial Relationships of Price ................................................................... 1 Using the Analysis .................................................................................................. 27 Fibonacci & Elliott Wave .......................................................................................... 27 Calculating The Projected Target Prices .................................................................. 29 Examples .................... .. ....................................................................................... 31 When To Use Each Fibonacci Technique ............................................................... 41 The 3 Point Set Up ................................................................................................... 41 Fibonacci Number Targets ....................................................................................... 41 Review and Summary .............................................................................................. 50 Fibonacci Time Relationships .................................................................................. 51 Fibonacci Number Count ......................................................................................... 51 How To Do The Time Counts ............................................................................... 53
.............................................................................................. Summary and Review 54
II . Advanced Gann Analysis Techniques W . D . Gann ............................................................................................................. 68 Master Time and Price Calculator: Square Of Nine ................................................ 68 History Of The Square Of Nine ........................................................................... 69 Construction Of The Square of Nine ........................................................................ 69 Technique I : Using Price To Forecast Price Targets .............................................. 71
Helpful Hints For Using The Square Of Nine ...................... .. .......................... 72 Technique II: Using Time To Forecast Time Targets .............................................. 80 Technique Ill: Using Time To Forecast Price Targets ............................................. 85 Technique IV: Using Price To Forecast Time Targets ............................................ 91 Technique V: How To Predict The High And Low For Each Day ............................ 97 Technique VI: The Importance Of Natural Squares .................... .. ....................... 100 Technique VII: Cardinals And Corners .......................... .. .................................... 102 The Two Master Time And Price Calculators ......................................................... 104 Summary: Square Of Nine .................................................................................... 105 Primary Nurn bers, Ratios, And Cycles ................................................................. 107 Secondary Numbers, Ratios, And Cycles .............................................................. 107
Ill . Advanced Short Term Analysis Techniques Introduction ........................................................................................................... 112 Pivot Points ............................................................................................................ 112 Hig h/Low tines .................................................................................................. 115 How To Use High/Low Lines .................................................................................. 116 Conclusion ............................................................................................................. 121
ADVANCED FIBONACCI ANALYSIS TECHNIQUES
never been revealed in this manner anywhere else in the literature of technical analysis. They are the fruits of many years of research and experimentation with the natural and recurring principles of Fibonacci, In my own trading, I have found these methodologies to be extremely powerful in forecasting price highs and lows in virtually all markets.
There are five Fibonacci techniques introduced here for forecasting market tops and bottoms. These will be referred to as the Fibonacci Spatial Relationship techniques. In this section you will learn how to apply the basic techniques. In the next section you will learn when to use each technique.
FIBONACCI SPATIAL RELATIONSHIPS OF PRICE
In 'The Trading Advantage" manual the history and concept of Fibonacci numbers and the related Golden Section ratios were detailed. A knowledge of these basic concepts is needed for the discussion of the more advanced relationships detailed in this section. For reference, a brief summary of the important Fibonacci relationships follows:
Fibonacci Number Series 1, 2, 3, 5, 8, 13,21, 34, 55, 89, 144, 233, 377, 610, 987 ...
Ratios of adjacent numbers in the series (Golden Section Ratio) ,618 and 1.618
Ratios of alternate numbers in the series .382 and 2.618
Ratios of 2nd alternate numbers in the series .236 and 4.236
The Fibonacci Spatial Relationships (FSR's) of price movements are very easy both to learn and to apply in everyday trading situations. The key factor is to at all times remember the principle of the Golden Section in its original form. This form is defined quite simply as the division of space between any 2 fixed points. It really is as simple and straight forward as that!

When applying the Fibonacci/Golden Section methodologies to the price scale, the two fixed points required may consist of any of the following:
(i) high to high (ii) low to low (iii) high to low (iv) low to high
The only other requirement is that these high and low price reference points should be significant enough to be readily discernible in a quick perusal of the chart under study. These techniques are applicable to charts of all time frames.
The Golden Section divisions of .382 and .618 and the associated expansions of 1.618 and 2.618 are the most important in the relationship of price movements in the financial markets. The .50 and 1.00 ratios and the 2nd alternate Fibonacci ratios of .236 and 4.236 are also significant, although secondary to the Golden Section ratios.
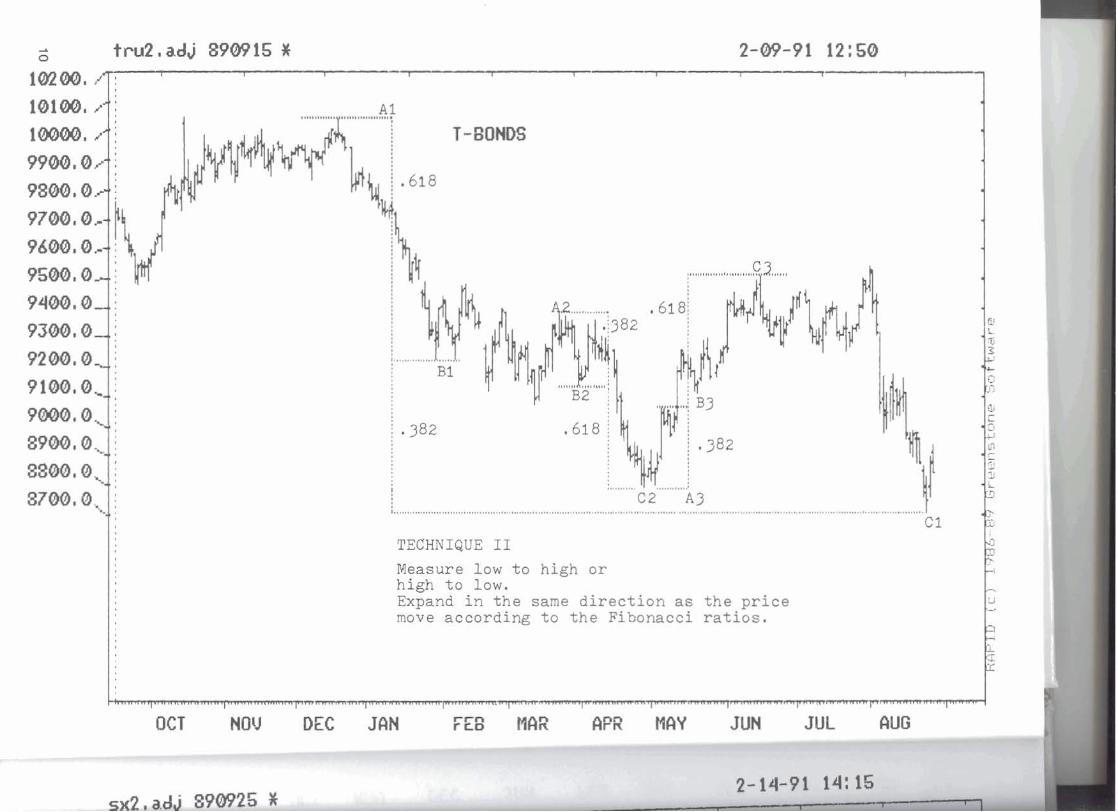
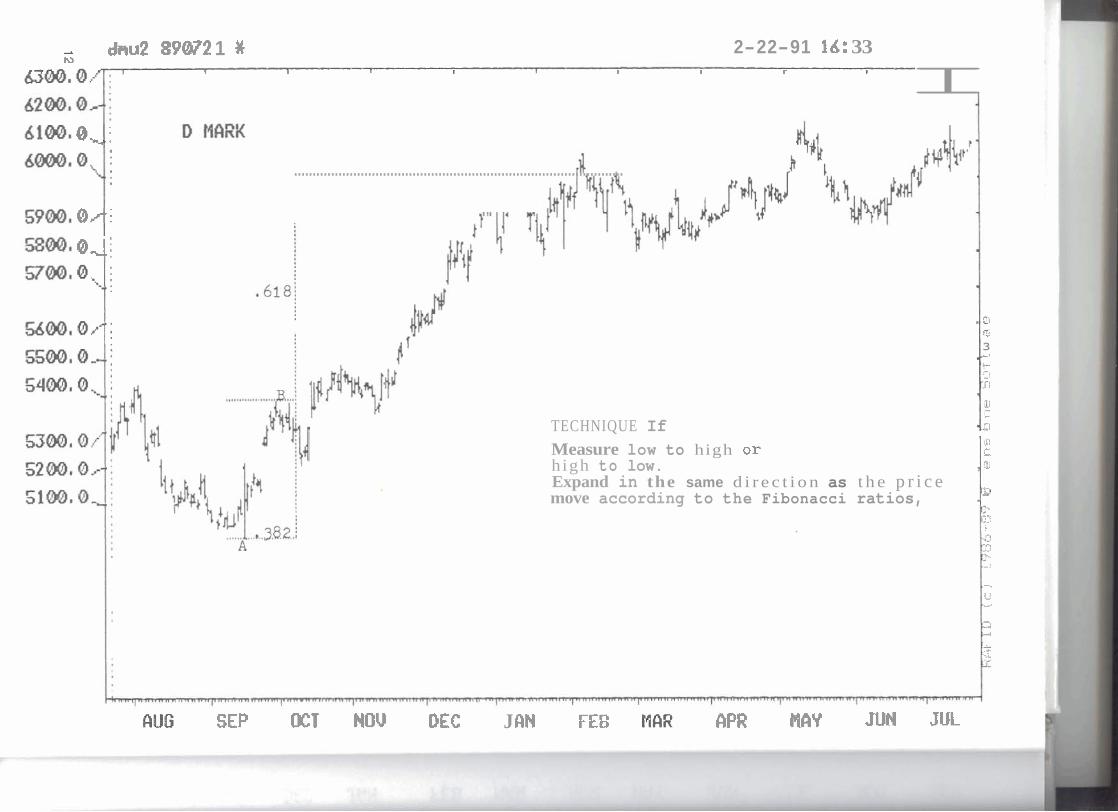
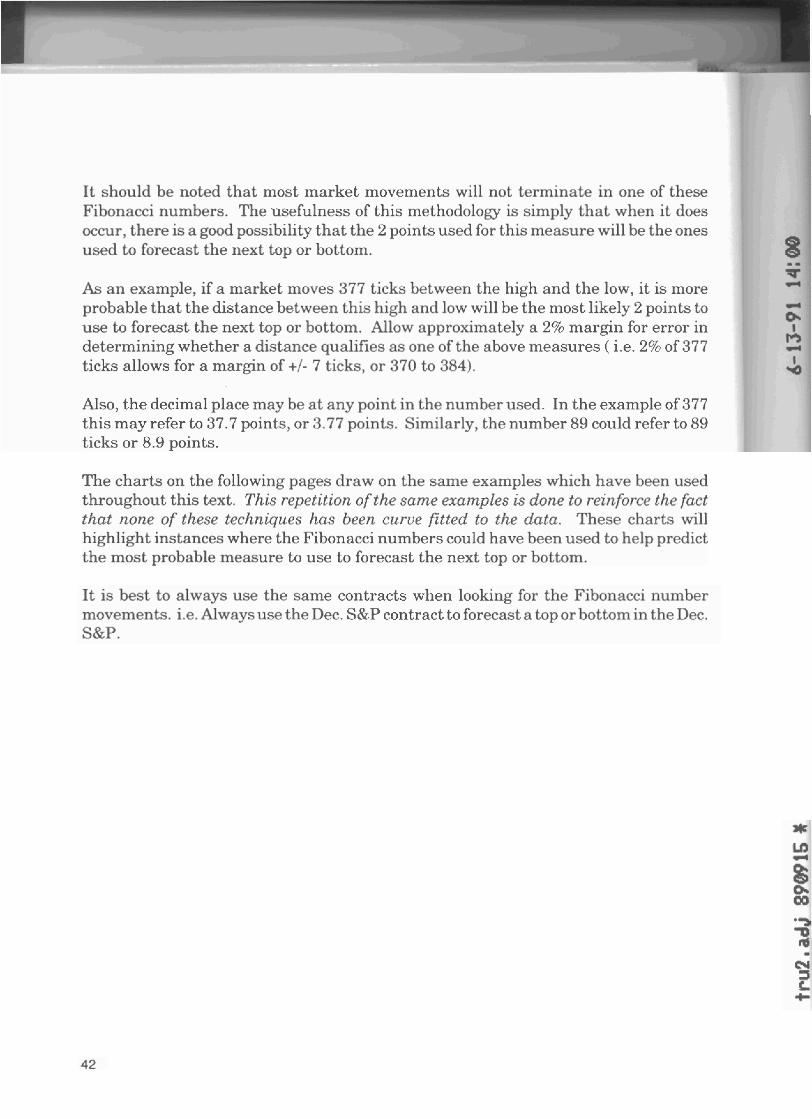
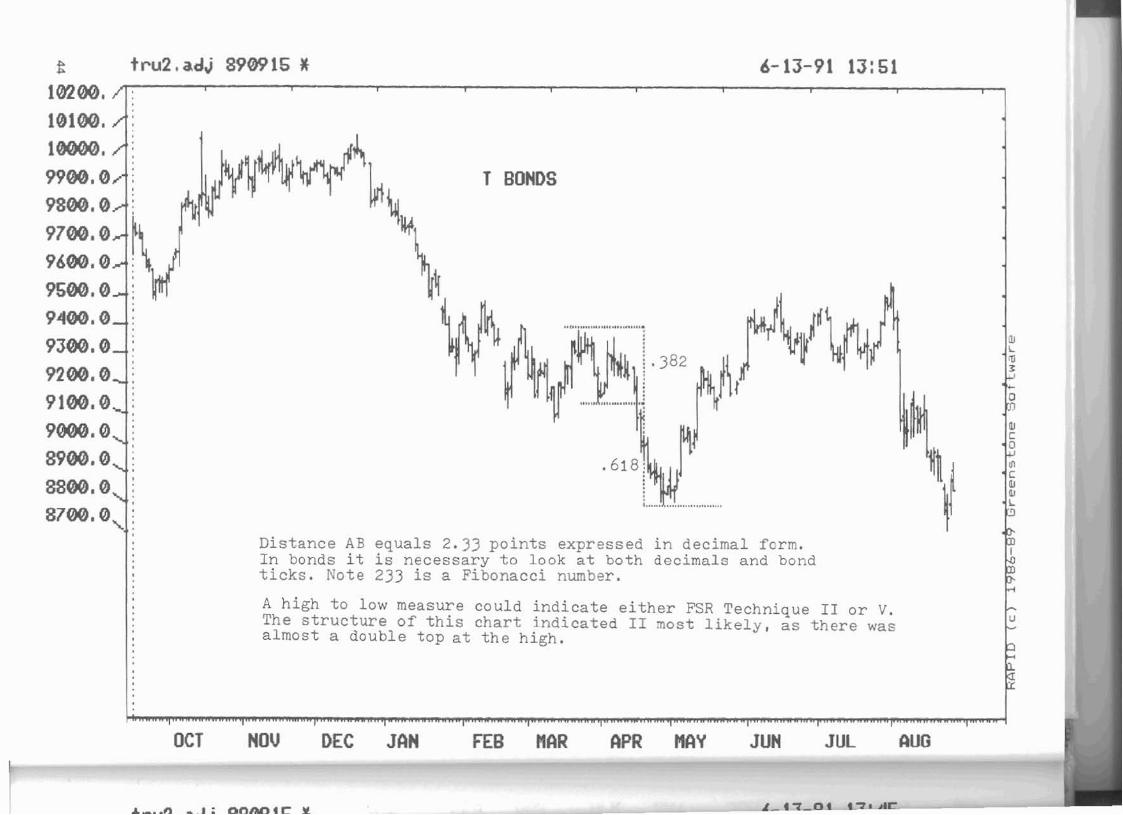
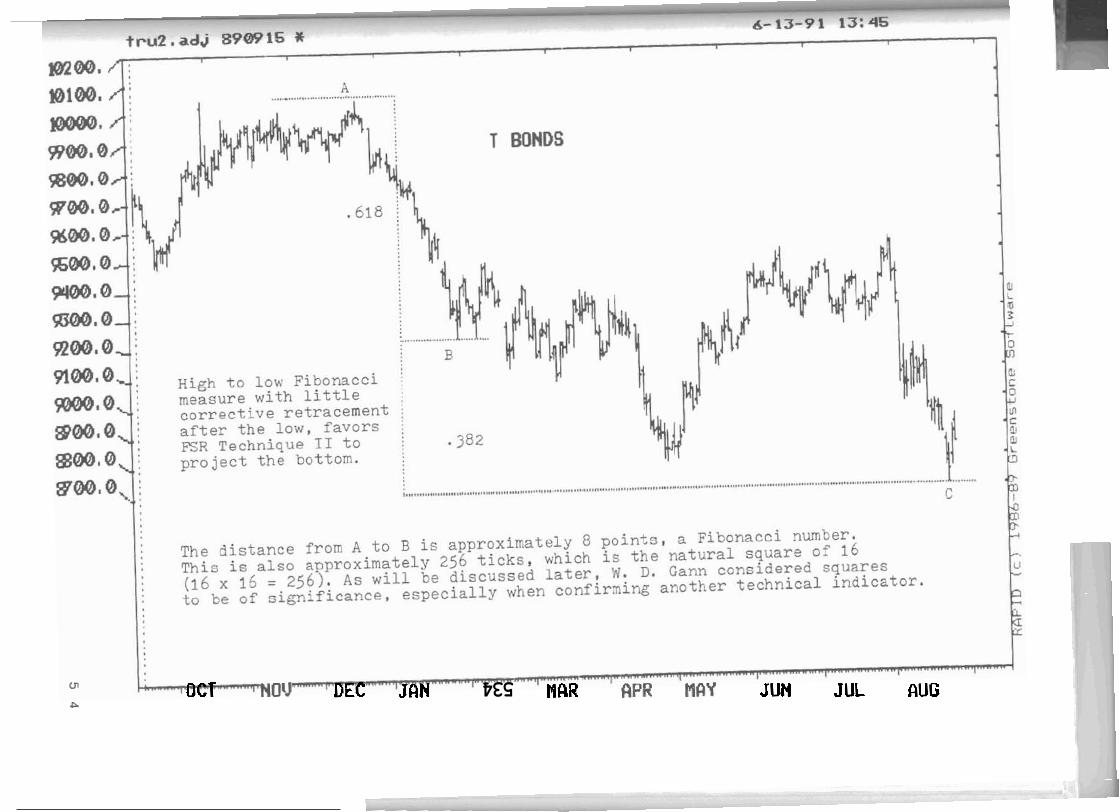
The charts included in this section are from four markets, the S&P 500, T-Bonds, D- Marks, and Soybeans. These exact same markets over the exact same time periods are used to illustrate each technique. Using the same markets over the same time periods eliminates the possibility that the techniques were "curve fitted" to the data after the fact. What you will see is that virtually every turning point in these markets can be '
explained by one of the Fibonacci Spatial Relationship techniques described. For my money, and I mean that literally, there can be no greater testament to the significance and power of these methodologies than this observation.
Conventional analysis d i c t a t e s that these points are retracements from h i g h s or lows, However, these points should be correctly seen as J&g points of potential support and/or
2 points,
I resistance as long as the market trades between the i n i t i a l
4 - U W
il H
1.
OCT NOV DEC JClN FEB M M CIPR NAY JUN J l n AUG SEP

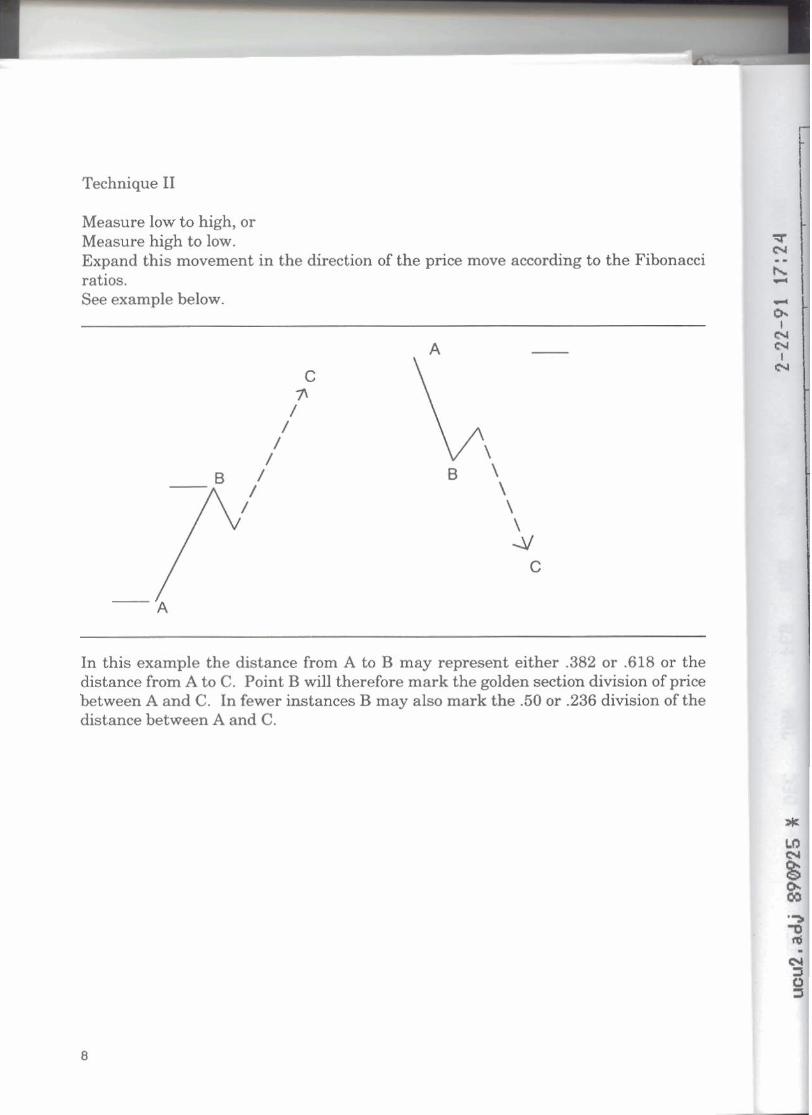
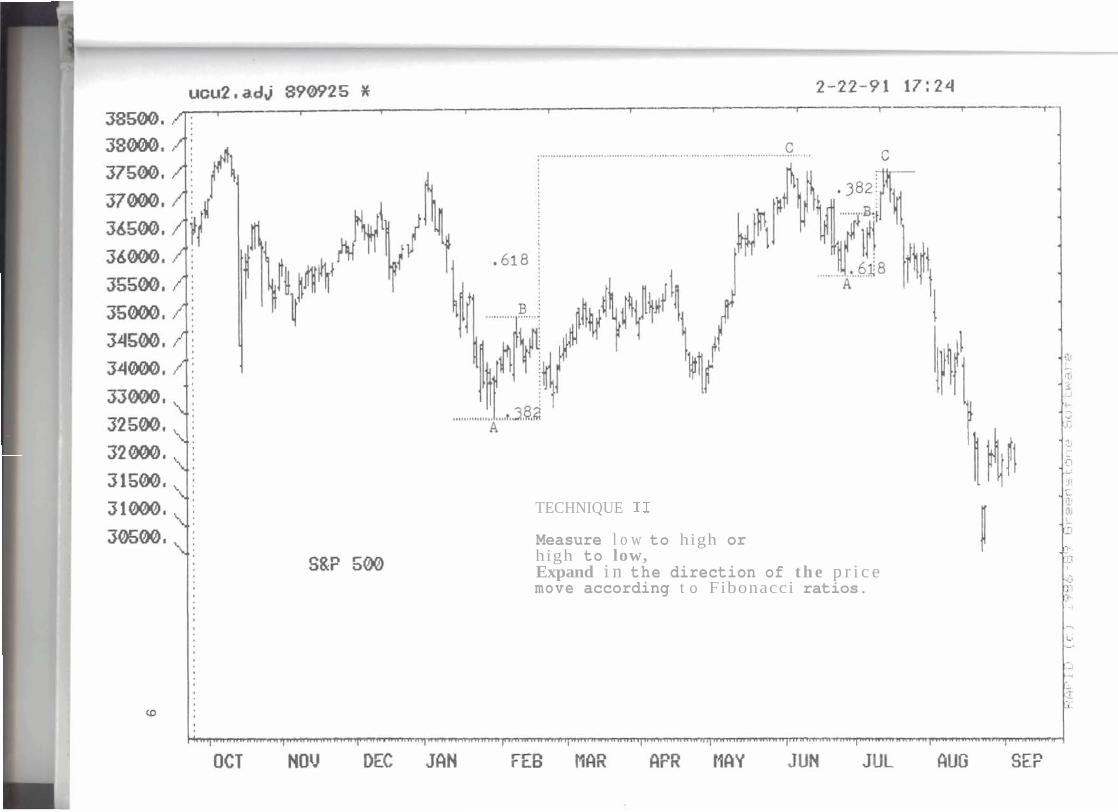
TECHNIQUE I1
Measure l o w to high or high to low, Expand i n the direction of t h e p r i c e move according t o Fibonacci ratios.

I 1 - - - - - - - - - - - a - - - - - - - - - - 1.- - - - - - - - 1 , . . . . . . . . . . . . . .
OCT NOU DEC JClN FEB HCIX JUN JUL
TECHNIQUE 11
Measure l o w to high or high t o low, Expand in the same d i r e c t i o n as the price move according to t h e Fibonacci ratios.
QCT DEC JAN FE8 WfiR OPR MAY JUH JLB, RUG 8EP
dnu2 89W2 1 # N
2-22-91 id: 33 1 I I I 1 r 1 I
0, i
.........................................................................................
0f.i
0-, ;
. s o f ' : I- s* 3
ah< l t
ct +;:I
a
u C:
TECHNIQUE If ' .CJ o
Measure low to high 01- tP f:
high to low. , B LU
Expand in the same d i r e c t i o n as t h e p r i c e 11 L move according to the Fibonacci ratios, • r rp
t a
-!
,-
L! Y
h
el
A
-z
RUG SEP OCT NUV DEC J flN FE6 Nnf? APR MCIY JUN JUL

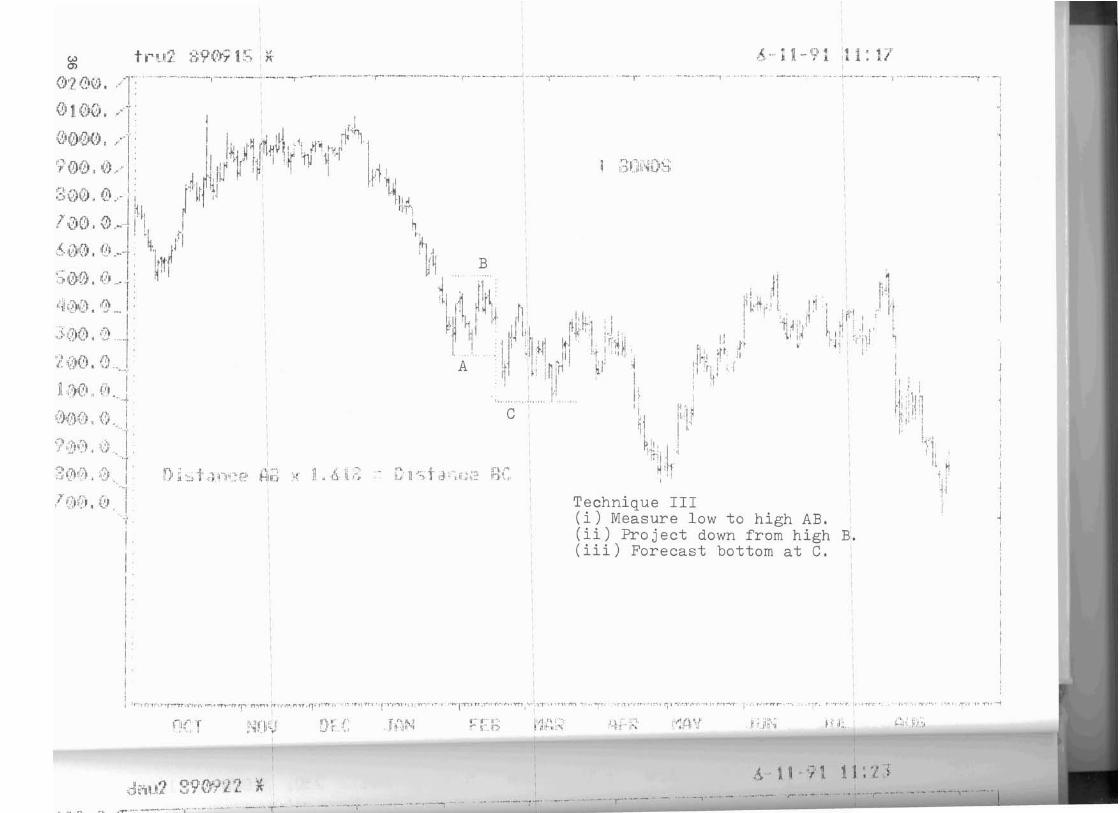
Technique 111
Measure low to high, or Measure high to low. Expand this movement in the opposite direction of the original price move according to the Fibonacci ratios. See example below.
In this example the distance from A to B may represent either ,382 or .618 of the distance from B to C. Point A wil l therefore mark the golden section division of price between B and C. In fewer instmcas A may also mark the .SO or .236 division of the dkbnce between B and C.
TECHNIQUE I11
Measure h i g h t o Pow o r low t o high .
Expand in t h e opposite d i r e c t i o n as t h e p r i c e move according t o t h e Fibonacci ratios,
- v n n . l - r l l r n n , r - T ~ - - ~
OCJ NO19 DEC JIFlN SEE MRE flP2 MAY JUN JUL fiUG
1 SEP

TECHNIQUE 111
Measure low t o h i g h o r h i g h to low. Expand in t h e opposite direction as the p r i c e move according to the Fibonacci ratios.
In this example the distance from A to B may represent either .382 or .618 of the distance from A to C. Point B will therefore mark the golden section division of price between A and C. In fewer instances B may also mark the -50 or .236 division of the distance between A and C .
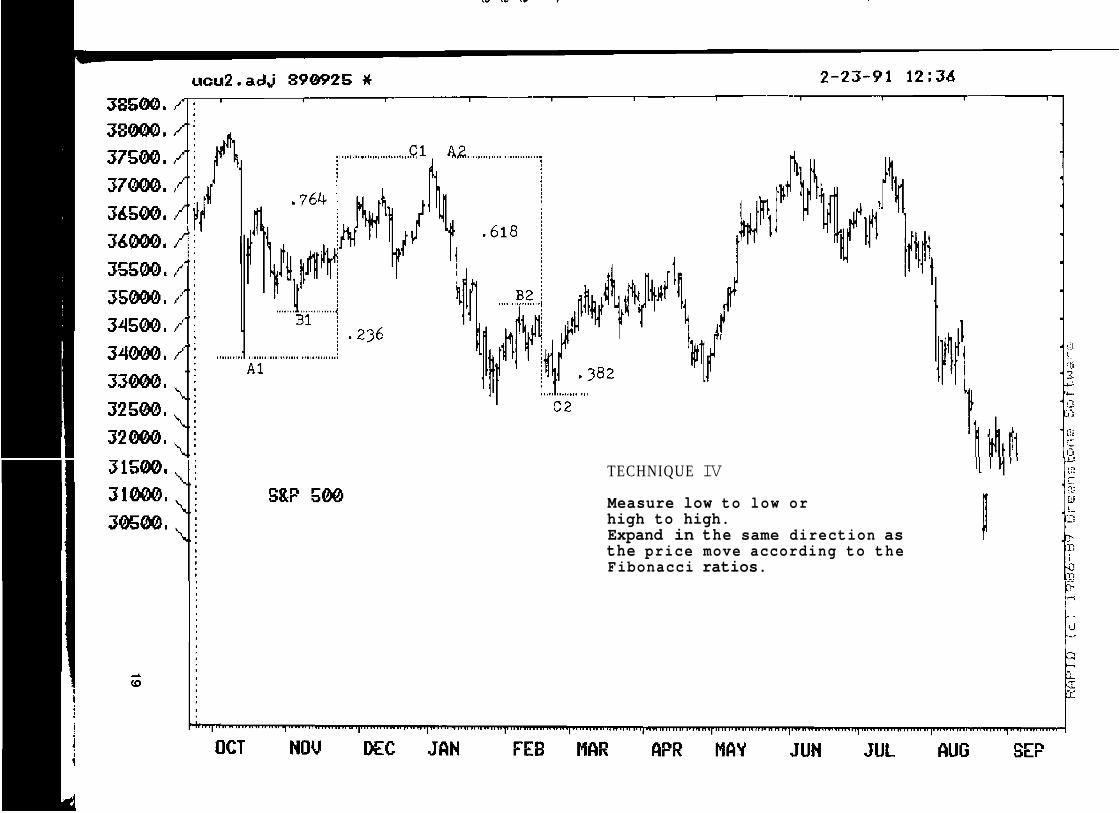
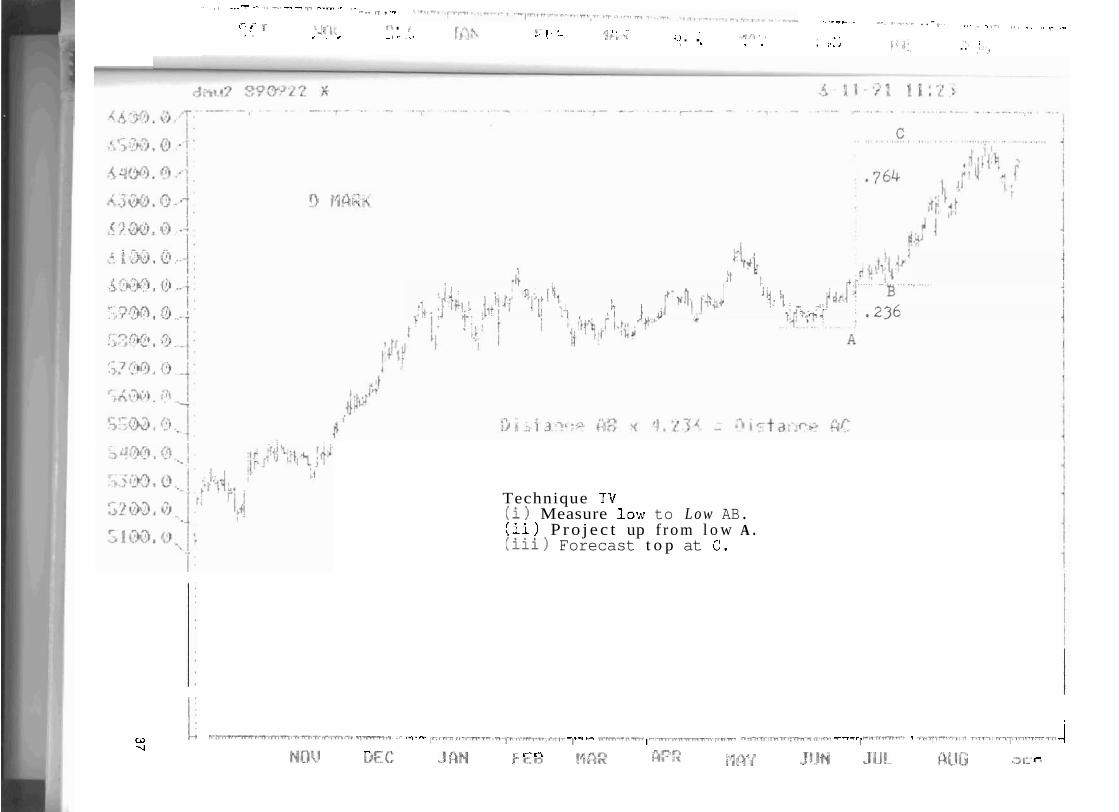
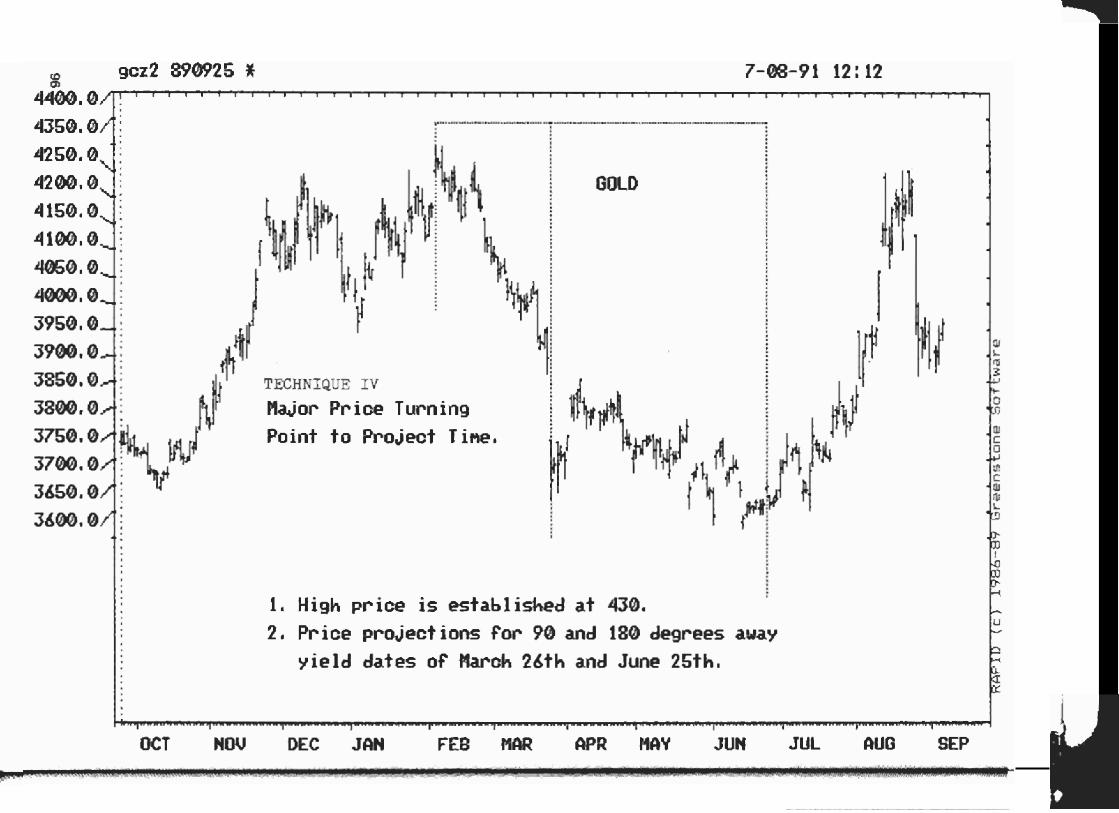
TECHNIQUE IV
Measure low to low or high to high. Expand in the same direction as the price move according to the Fibonacci ratios.

TECHNIQUE IV
Measure low t o low o r high t o h igh . Expand i n t h e same d r e c t i o n as t h e p r i c e move according t o t h e Fibonacci ratios.

TECHNIQUE IV
Measure low to low or high to high, Expand in the same direction as the price move according to the Fibonacci ratios.

~b-qm7wnyrv7mt Fwv ,*rr ,o
I? M'. 1-h I DCT
I Measure low to high, or ! - s.
Measure high to low. - Apply the Fibonacci division and expansion multiples to the next consecutive move-

a 6x3 ;:$JI j*:
' ('(i% 1 f - * (7id:'b',, J I- U I.,
0 c-,r $ {'-, 'A.
Gqy; l"$ m @mi f
- .L,
' (K$abf i
'WF;Br.C' ' c;;g
'WSm!L
' qjfiyg
i>w5yr. .(,WJ,[
a mp/,c, > A ,, ,L
!w)(jgy
' wllz8f
'3 N
.:14 I$ 9". "' , ,,-, ,, , -2 1 I, ,', <L . Ti#? , : (1 <:: r 6 r. t I, ,I,?i!i ,' i:. , 'b ((1 cu !a : I , !T nlrrir f #..I h fi -4'2; IF-; "I.{., :r ,, 1, L- ; 1
f r,-q,jz "';.Y(?? 1 ::, K. ,$. -. 05, -- 9 1 1 ,'X ; <$2
Qv2 , ,,w,,,7-,.- ~ r . . ..,..,--,I.. ,,..,.r-,--.,4 , . T....-,T-," --r- -. T-.,..-,, ,- .".C .," "' 7----,-. -- :---- ,.-- ..,. - r-.-T.-..,l.-.-. .?+ .-,r., , ... .,.T ..-,,, .. ,. , r , - - ,yL, , - . . . ,
I . - I 1
,$I 1 , ,I
U I bh I I
h
D
9jm3, 43 ,,,-.,
I .-7
:$ih&), Q , '
2v:Q;ii$l - '- 1 : .
1 . 0 : I . . . . . .
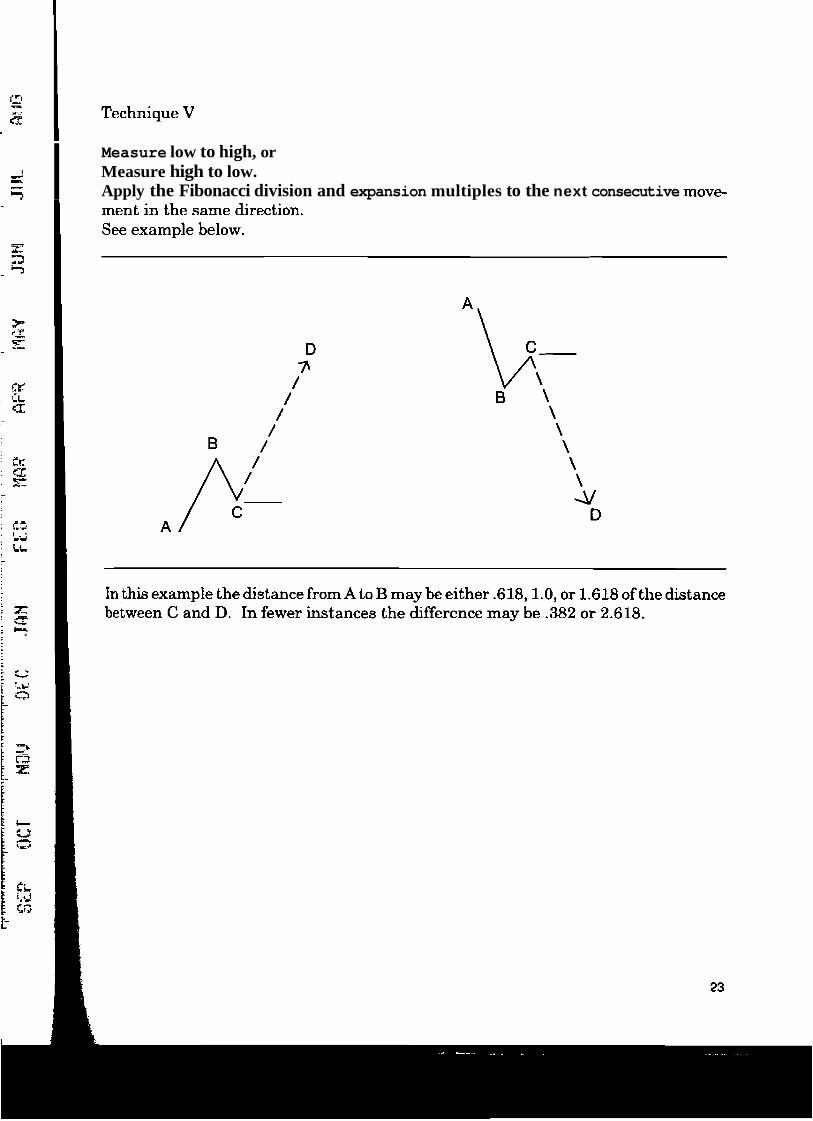
TECHNIQUE V A
Measure l ow t o high o r high t o l o w . 1 i Expand i n t h e same d i r e c t i o n f rom t h e next i n t e r v e n i n g p o i n t according t o t h e F i b o n a c c i r a t i o s .
N ul
m ~ m r r r r r m w r n . w y ~ r . n n n + r r l r m c m w r q rrrrmrrmrrrrrrr1rpnrrrm-n-nm~1~ I r m n r ~ w n ' n ~ r r ~ m ~ m w w ~ ~ w v m ~ ~ ,rmrn*n,~ r ~ r r r ~ t n n r + - ~ ~ ' , - , ~ ~ + n ? ~ ? ~ - - 1 OC'I !M OZJ DEC J ' Q W FEE MQR M'W HAY ,JUN .,1'1311. A! 1Fi
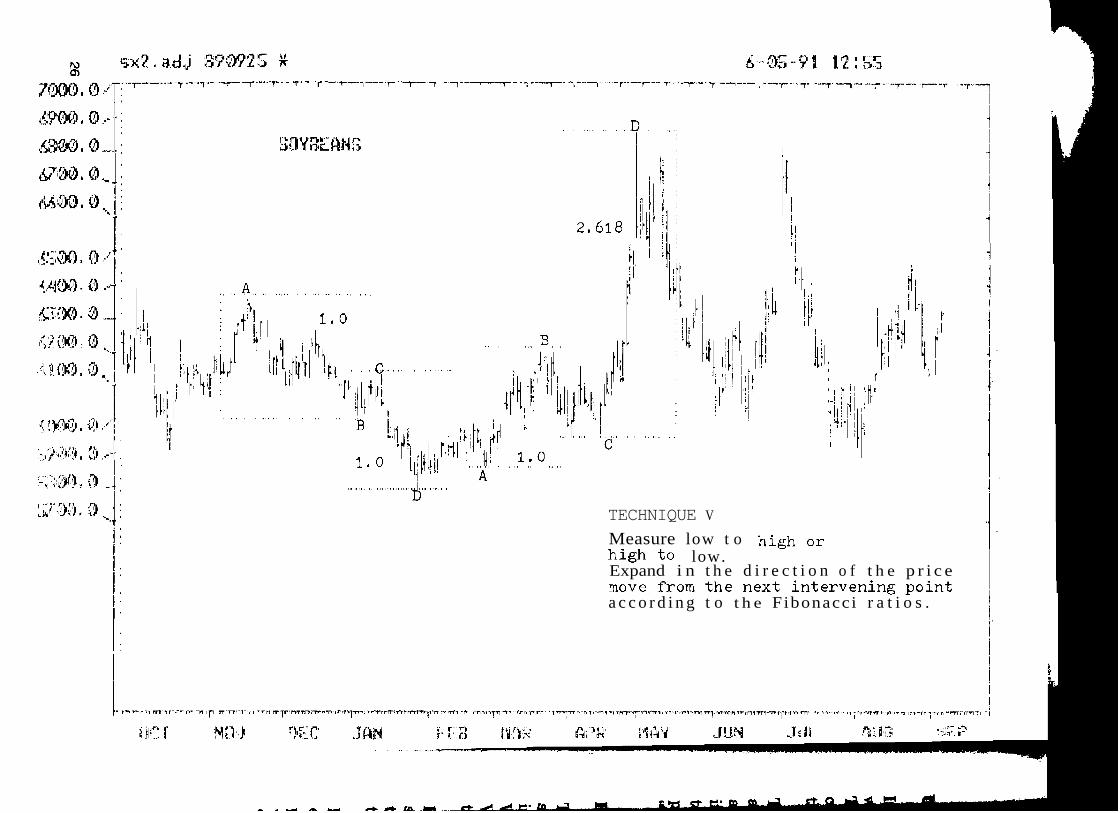
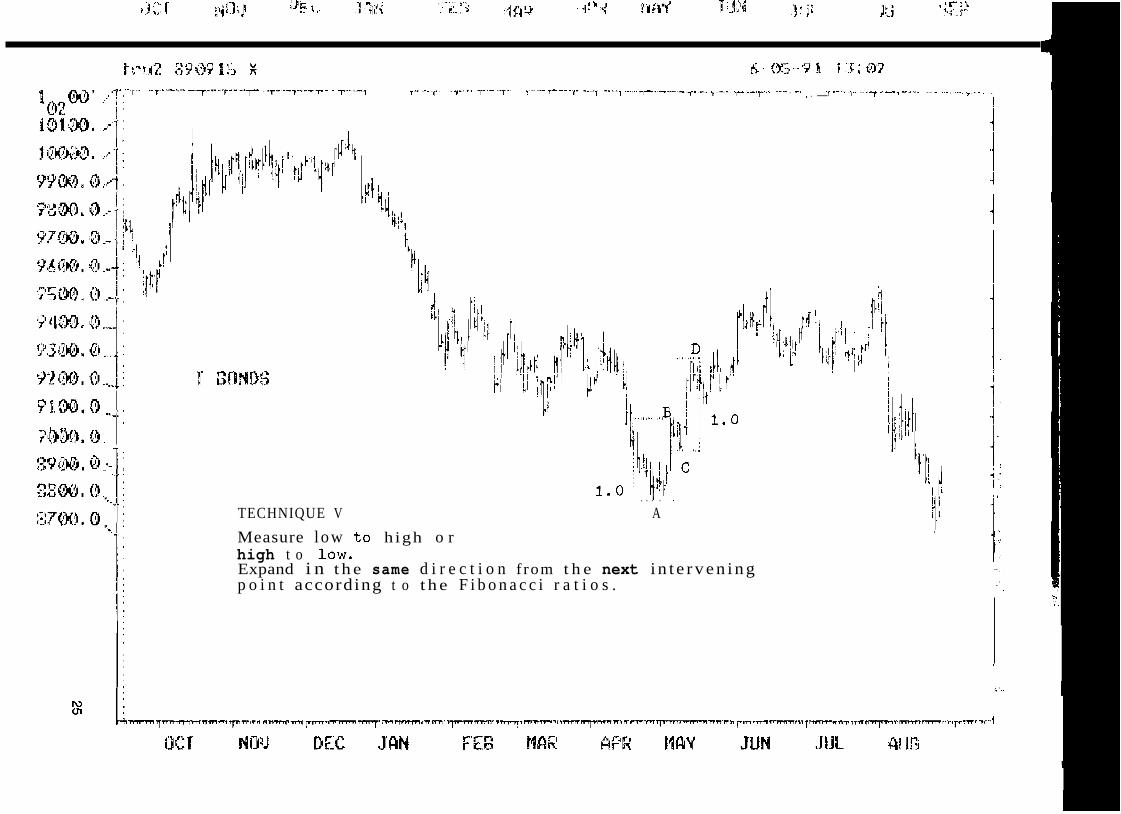
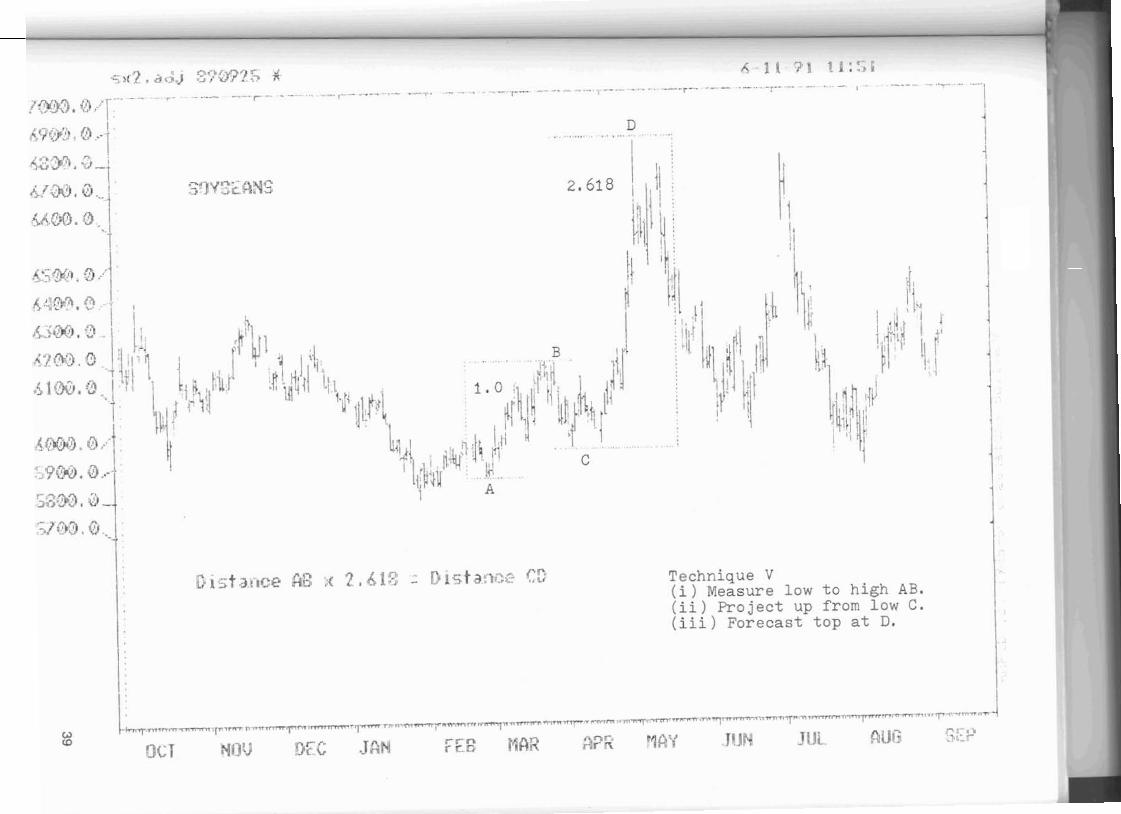
TECHNIQUE V
Measure low t o h i g h o r h igh t o low. Expand i n t h e d i r e c t i o n o f t h e p r i c e
a c c o r d i n g t o t h e Fibonacci r a t i o s .

In practice many price points established by the Fibonacci division and expansion levels will sometimes provide at least temporary support or resistance to the market. Therefore, while any Fibonacci level may at some point be eclipsed by price, these levels can often represent a t least short term support or resistance points. However, be aware that in a strong trend, any potential resistance point can be eclipsed easily and quickly.
The only other caveat that I will add is that no single method of analysis should be used alone. (I do not include mechanical trading systems in this statement, although these almost always have several components anyway.) Much better results will be obtained if the trader concentrates on looking for a convergence of several indicators and techniques, all giving like signals at a particular point in price and time. As you are probably aware, this concept of converging evidence was emphasized repeatedly in 'The Trading Advantage" manual.
FIBONACCI & ELLIOTT WAVE
The concept and connection between Fibonacci and Elliott Wave was discussed somewhat in "The Trading Advantage." Briefly, Elliott Wave holds that markets move in waves of 5 in the direction of a trend, and waves of 3 during corrections to the trend. While it has been generally assumed and accepted that Fibonacci is an adjunct to Elliott Wave, that is not actually the case. The reality is that Elliott Wave is really an adjunct to, or subset, of Fibonacci. Not the other way around!
Elliott Wave is based on the principles of Fibonacci, as its developer R. N. Elliott clearly stated. However, it has become generally accepted that Elliott Wave is more important than any other Fibonacci relationship. To accept this, is to put the proverbial cart before the horse.
In fairness, Elliott Wave has in the past proven to be a very useful trading tool. In my experience, it is just much less usehl today than it was in the early to mid-1980's, particularly in the stock market. For instance, throughout most of the 1980's there were absolutely no better forecasting tools, using Dow hourly charts, than a wave 2 "running a-b-c," or a wave 4 "a-b-c-d-e triangle." This is simply no longer the case.

Elliott Wave can still be very useful, particularly if the wave count confirms one of the Fibonacci Spatial Relationships described herein. When using Elliott in this way, it is best to avoid placing too much emphasis on what you may perceive to be the correct Elliott Wave count. This may actually be counter productive. In such an instance, you risk the danger of placing a possibly misinterpreted Elliott forecast ahead of an objective, clear cut, and more significant Fibonacci Spatial Relationship. In other words, do not put the cart before the horse.
Elliott Wave counts may not be as easily recognizable as they once were, but the natural laws of Fibonacci are still at work, albeit in different forms. One major way in which this work occurs, is illustrated by the Fibonacci Spatial Relationships detailed here.

CALCULATING THE PROJECTED TARGET PRICES
FIBONACCI MULTIPLIERS
To use the multiplier approach it is necessary to understand the relationship between the Fibonacci divisions and the Fibonacci expansion ratios. This concept is quite straight forward. Fibonacci divisions are divisions of 1.0. A Fibonacci expansion ratio is simply the number that when multiplied times the Fibonacci division will equal 1.0. A summary of these relationships follows:
For example, let's assume the distance between two reference points A and B is 89 points, as shown in the accompanying diagram. Let's also assume this distance from A to B is projected to represent a .382 division of the total spatial relationship. Note that this will mean that the distance between B and C will be a .618 division (.382 + ,618 = 1.0).
To calculate the distance to any price projection, the calculations are:
(i) Find the distance in price units between the two points being used for the forecast. In this example the distance between Point A and Point B is 89 units.
(ii) Multiply this distance by the Fibonacciexpansion multiple(s). In this example that will be 89 x 2.618 = 233.
(iii) Add the product(s) calculated above to the reference point to arrive at the price forecast. In this example add 233 points to the level of point A to arrive at point C.
Note that if in the above example the A to B distance were assumed to be .236 of the entire spatial relationship, then the 4.236 multiplier should be used to find the price projection to point C. If the distance were .618 then the 1.618 multiplier would be used, etc.
.&.
C
A t o B X 2 . 6 1 8 = C 89 X 2.61 8 = 233 Units From A
A
MULTIPLIERS FOR EACH TECHNIQUE
The multipliers which will be used most often are listed below under primary multipliers. The multipliers that will be used less often are listed under secondary multipliers. The distance between the two original reference points is referred to as "n".
Techniques (11) (111) (IV)
PRIMARY RATIOS n x 1.618 n x 2.618
SECONDARY RATIOS n x 1.309 n x 2.0 n x 4.236
Technique (V)
PRIMARY RATIOS n x .618 n x 1.0 n x 1.618
SECONDARY RATIOS n x ,382 n x -50 n x 2.618 n x 4.236
Add the product calculated above the reference point used in the original measurement for each technique. The Fibonacci multiplier procedure will become quite simple with a minimum of practice. For review, the steps may be summarized as:
(i) measure distance between 2 points (ii) multiply times the Fibonacci ratios. (iii) project to find the price target.

EXAMPLES
Several chart examples are given on the next few pages along with the calculations necessary to arrive at the forecast. Note the relationship between the divisions and the expansion ratioslmultiples. It is best to use constant month contracts. (i.e. always use the Sept. T-Bond contract to forecast tops or bottoms in the Sept. T-Bond contract). Do not use spot month contracts where there is a rollover difference in between the points used for the measurement (although contracts adjusted for the rollover should be okay).
..... ...... I. 4.. ....... "..... .... ",... .". .- . --
I..; ,,! 'C, ,, , !, " ;; , 1 [, ;fit -.-%E! 'i . 'y
. . b ,. r' . . !> ' '. ?.; 51, ' " . ., , I .. ' , 1 . ,','.. , 1 ~. '?*,;I : ... ...... 8, ,I, ;. j: ,, : !\,! ....
.' ,? .. 4 .
; ._ _I.. ... ... .... .. ..:, ......... , .I..#, :.... I.. ..... I::. ', .* ......... i.,.. ........... ,.i..,. .i.r .i ......... i'IL.L ..d ..1:. .A,<! ..... 4.l ........ .i.,i'.. '.I ',..;li. ' 1. I:..., 1 I .Ll .... t...,, .Id . .., ( ..
8, . I
I.' j .,'I "
, I'
!!L '4 r : I

! ! ,.-
I.. ..A. ............ .1 ................. .! ....................... -.I. ....... .i. ............ i. ............................. J. ......................'................. ..,... I ................. i:
; 1 ;; i: r. r 1. ;:, , :I I.. . . 5.. '!,i, , c:!.,) : , '!,, ,A Ji '8 .l .I i. ,i:,;;!; ,.. I., . "'!; . .? it,,! !L I! g 'L , ! tr!; ,:": 1: $1 , , , i " 1'
' 11"aj:'" ), ,$.,!:I1 !,
N li] j:" , 1, '13 11.n 4:..1; - 1wi ').B~.~;PJ IU GI ~I.J~~.~u.-.M :3 .J IH 'U .B? 3 ou ....v -11 I(> I, I fi! IN k.3rJ d:3S p~f'jkj ~r~i d
I . ~~^LII.~~IL~I.LLIIJ~~~,~,~,I~~LL~,J,~ I~.I;A.I,.:.L.II LLA/.~.LIJ+LI .I, :.I .i.i LIL~J~,.AA..IJ ~.L.LI..L .LI.~J-L-U-I 12 LI.(~I.I.L.'J~.:~.:AI.~. LULUU./CUI. L~..LLU.UII.JI..I.I. LL.LI-UU.UJJ.I~J~U~C.II~~~.V~U.~.LJA~-L~.~~.LL~I.~.LL I.L~-~.L ILL.J.L.~.LY.L~AI.JLI~~U~*~~*~L.I~L~J~~,~J~.I,~~~~L~A~.~~.I~,.I.I,~L~~,.~~L~~.~~~.I ALLA~..~,~, IJ "ii
I
1
In m
I 1 I I 1 I
1. i j
I
i 1. I 1,
1 I I
i I, iJ, i Q~L' "" I i.,\\.;J ! /. i ::;i , I
I ' . i I* 8 ;. ., ,:!I (1 ! I?., , I I
: tl.pr!a.~. i' ; ,.,
I.." I '- I' 0 I, II
, 4g 4[J4)$ 'i yi ! J.. - ,. I.,. a ,r, ,., ,w
I i ' ([;J! l,~!!{~b ,(;, ;$ I
1. .' ;! l\'lj#~! l[J . i' i .!
/ I,,. 8.' r'." I! 5 (q-,)iP.:;" I I. ,. i ; I ,. ,,.:' u V',, r"n ,I-",,,;
I.I. 4.d. . . I ,. . ..L. . - . J".... ... . --- .. .,. ..-.I.. . ... , .. ... ... -I. . ,... . . .., .... -, ., -I- , ., . .", , , . .-.I ..... .... . . .., .. ..,.,.., .!, ,. ~ .,.,. .. . ,. ,,,.,. ;.,. ., ,. "-- ..,, , ".-, , -.,, ,., ,A,,, ,,,. .(>?,; ,,J ;r
1. 4: : I 11, ,I,;, --..I> f 7 !g it:+ m, , , ;!::, L-,' $?? <rj':,..t8 ur ,,:is ,Q"7;k2; ;$..
8 . , I -,.. 7- .-, -I. 7.. -. *- 1- *-". .. , - .- rT. , ." - -, , - - I . - . . - , i . 17,' r + ' 4 . ; r . . . ., I . . . r 8- r ' ,,,; n ! - . .
1 , m T,, , , ,-, ,.. . . >-, .- ' r ' k : ! < . * I * . "- ' ' r:, :?-,.,u .. ' ^ ' :.! . . .<A'% # ,
, 1 ~ L . - " . '. . ; .I . I . , : .. , ' I
, ;I
Technique IV (i) Measure low to L o w AB. (ii) P r o j e c t up f rom l o w A . (iii) Forecast t o p at C .
W nvn-rm*nl'mTPTT-np I?-3. 7 ' - m-m ,n~'n-: l ;ril,+rflr?ln-+rr17.~-*nnnn~~-~l-lr r n ~ r , ,~rrn-, ,r ~ - , m ~ , ~ ~ p w - , - t r r w m ~ r . l r r - 7 n r mmr?P-r ' . ,r 1?*7'r-~.-.-v*rr m r ~ + r r l - r 8 ' ~ n - ~ w ~ 7 -
I -4
I I T
NO!rr '- r 7,
LI'~., << r r - E > GFr; ;jfYj' , i ' l . b " r ,
i ,I $\YI rc.n8 !flr12 Jl,lN Jjjl!. $t[JG ,;> L a-


. L-. , ,, . -, . 4 , . , , ,,><; 6!,] , ;, <:I 'I [ !;;;I( ,1 ,o-
--I. I ' .. ,> ,- 2. m--.. , ! d.1.: 4, rl.. / ,I ': +.. ,I _1 ., ,' -. . I Cd.. . -. ,*L ., I .. I' '. .: '1.. , - .I.L ,,-II. LA,.-. - Vl* .,.:. C . I .' >.I. .,..Lr.. .Il...ll-l ,L.LYI.-. - .I. .I ,LI.1 181 I 11 It ,.L!,.I*..LI~.L .1 ,.,.I, ..L11.I l ..I, &,,*I L I..., _,.,J ,'I, L.i ,* ,: . .,, %. I*
' j

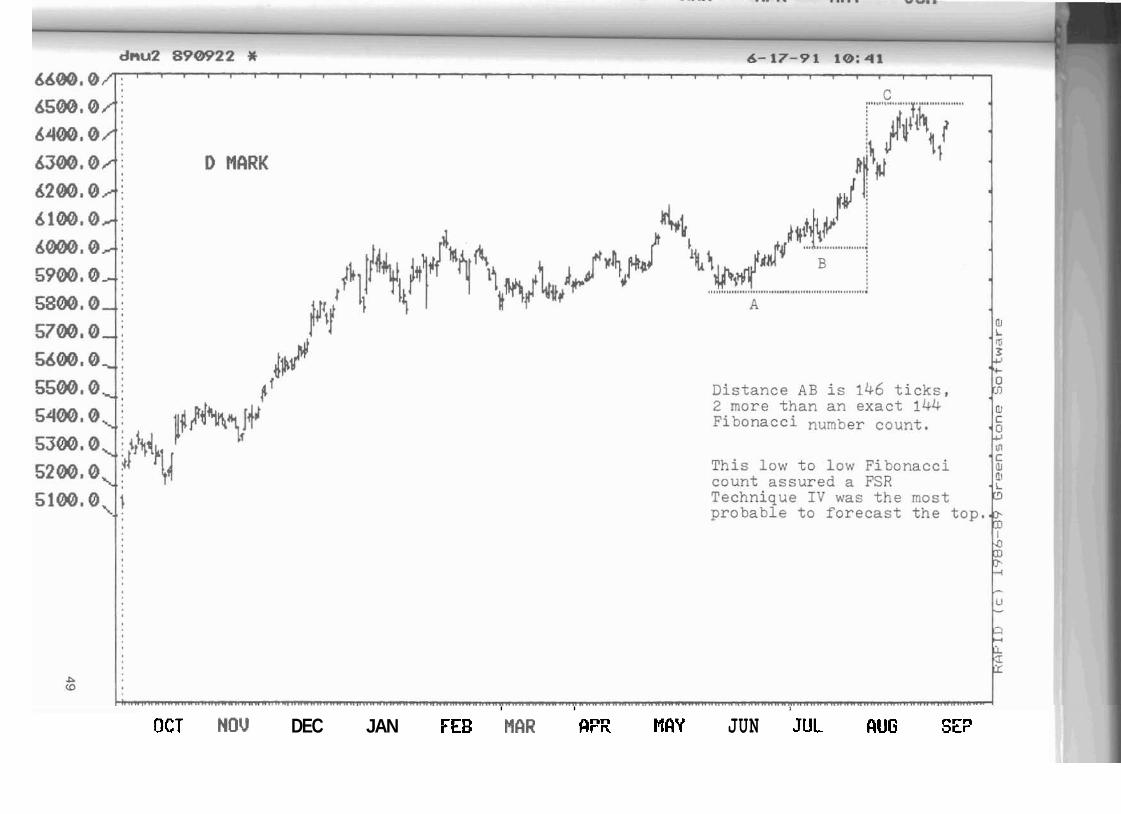
Distance AB is 55 t i c k s , a Fibonacci number,
Since a low t o l o w measure y i e l d e d t h e Fibonacci count FSR Technique IV was the o b v i o u s c h o i c e t o project t h e t o p .
Note : FSR is Fibonacci Spatial R e l a t i o n s h i p .
I I I I I I I I
OCT NOW DEC JUN FEB NbR nPR WAY JUN JUL nUG
~nw ~nr unr AU~J ~du UWW 534 r 33a OM 130 rn

Distance A B is approximately 34 c e n t s . Distance CD is approximately 89 cen t s .
T h i s c o u l d be e i t h e r FSR Technique I1 o r V , In cases such 2s t h i s it is h a r d to determine in advance which is m o s t likely. This is w h e r e t h e use o f o t h e r t e c h n i c a l tools can h e l p t o i s o l a t e t h e most l i k e l y target p r i c e . In this case Technique V turned out to b e t h e o n e used.
QCT NOV K C JAN FEE MRR APE MClY JUN JUL RUG SEP
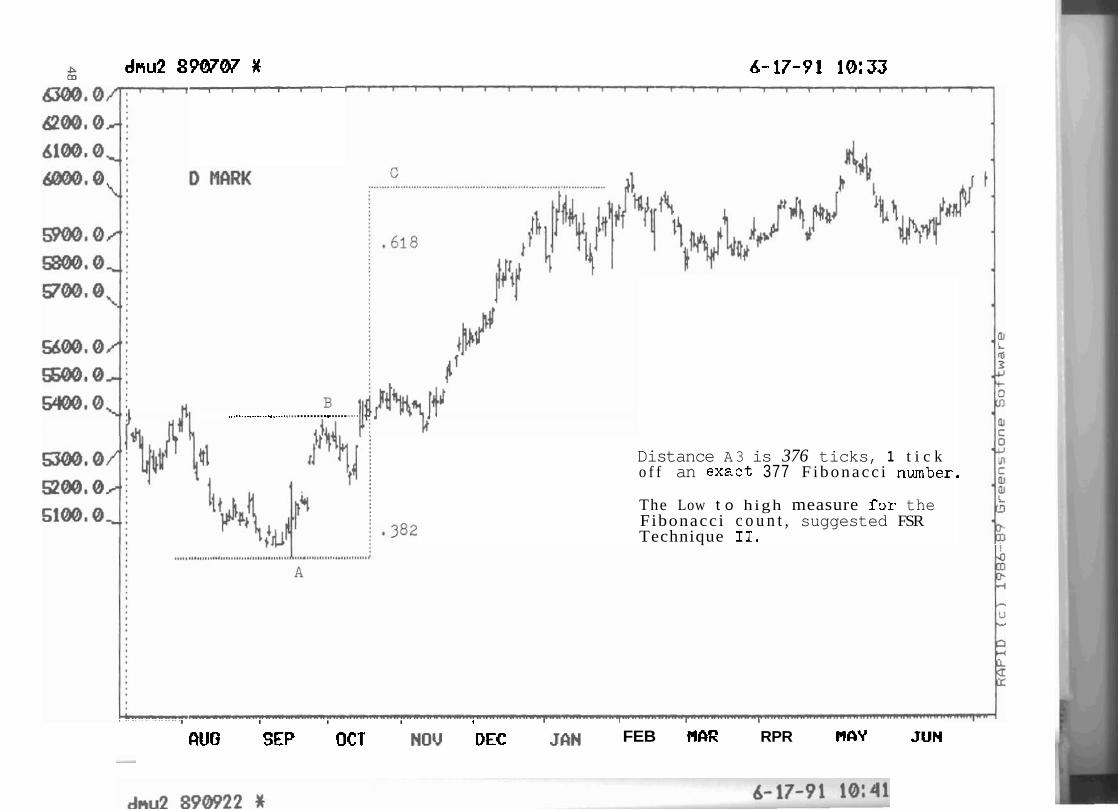
8 dnu2 8 W W # 6-17-71 10:33 1 l r 1 1 1
...................... ll.l .......... .. ...... ..,..
Distance A3 is 376 ticks, 1 t i c k o f f an e x a c t 377 F i b o n a c c i number.
The Low t o high measure f o r the Fibonacci c o u n t , suggested FSR Technique IT.
I I I I 1
RUG SEP OCT NOW DEC JON FEB MUR RPR MClY JUN
I I 1
OCT HOW DEC JAN FEB IWR RPR MqY JUN JUL fiUG SE?
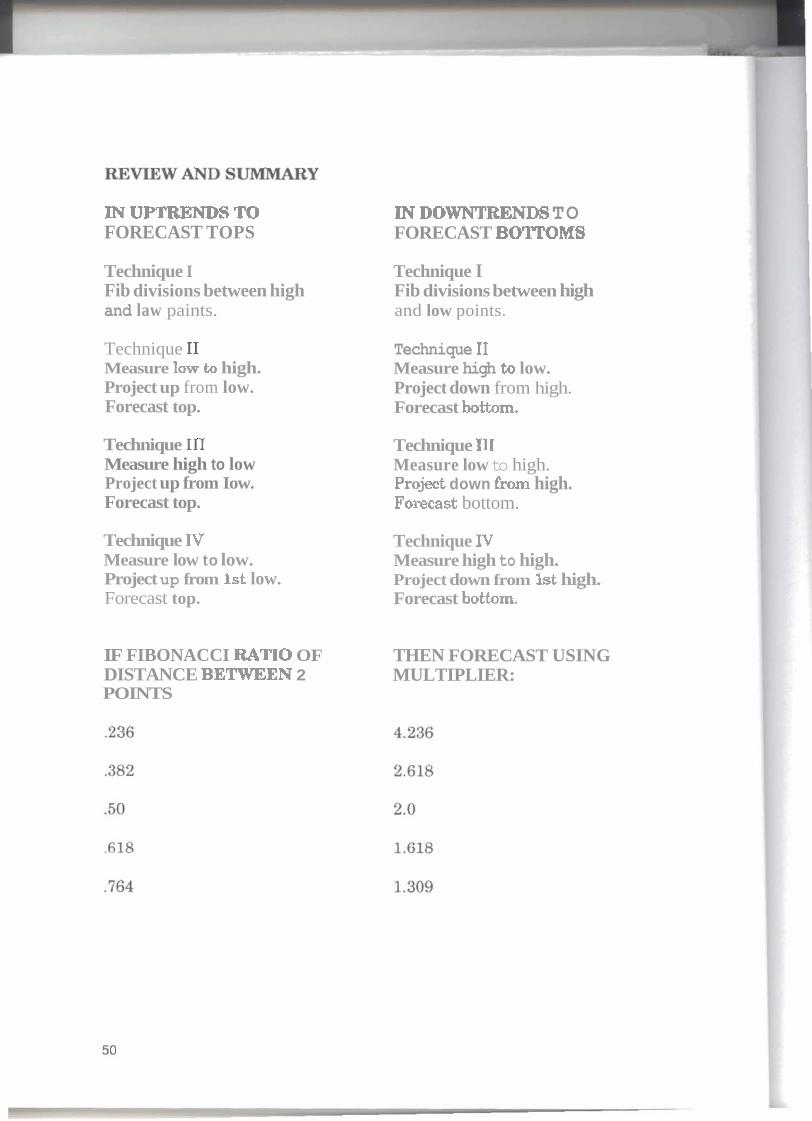
m UPTRENDS TO FORECAST TOPS
IN DOWNTRENDS TO FORECAST BOTTOMS
Technique I Fib divisions between high and law paints.
Technique 11 Measure low to high. Project up from low. Forecast top.
Technique 111 Measure high to low Project up from Iow. Forecast top.
Technique IV Measure low to low. Project up from 1st low. Forecast top.
IF FIBONACCI RATIO OF DISTANCE BElWEEN 2 POINTS
Technique I Fib divisions between high and low points.
Technique I1 Measure high to low. Project down from high. Forecast bottom,
Technique I11 Measure low to high. Projeet down from high. Foreeast bottom.
Technique IV Measure high to high. Project down from 1st high. Forecast bottom.
THEN FORECAST USING MULTIPLIER:

a a&
3 2 3
5 2e
MA
A, L,
4 $5
3 2
m=
$
3
g-3 g E
mx:;mg a h6 a
22
33
%
3 Q
u%
-cd
5 M
E $
& gl
oz
a*
rd
Q3
bd
X
3..9
~
63
C
mu
g
~m
m
ol
&
P2
m$
-%a
4 g
8e
.z w
3 *
m
*3
*
!? a 04
2 2s
"- am%$
3 z &
Y '2
sp
2%
3 t
ar
n &a
-p;,~
g
2:q
2
cd
c,rl
ac
l a
.5
-m
c,
a
&rn
g:
3.l" g
rn *G3 z
g E 2
G4
.,
2 0 4-
5u
c
i
c*
-
6 g 9,
-A*s,
fl tf:b
a
m.
,
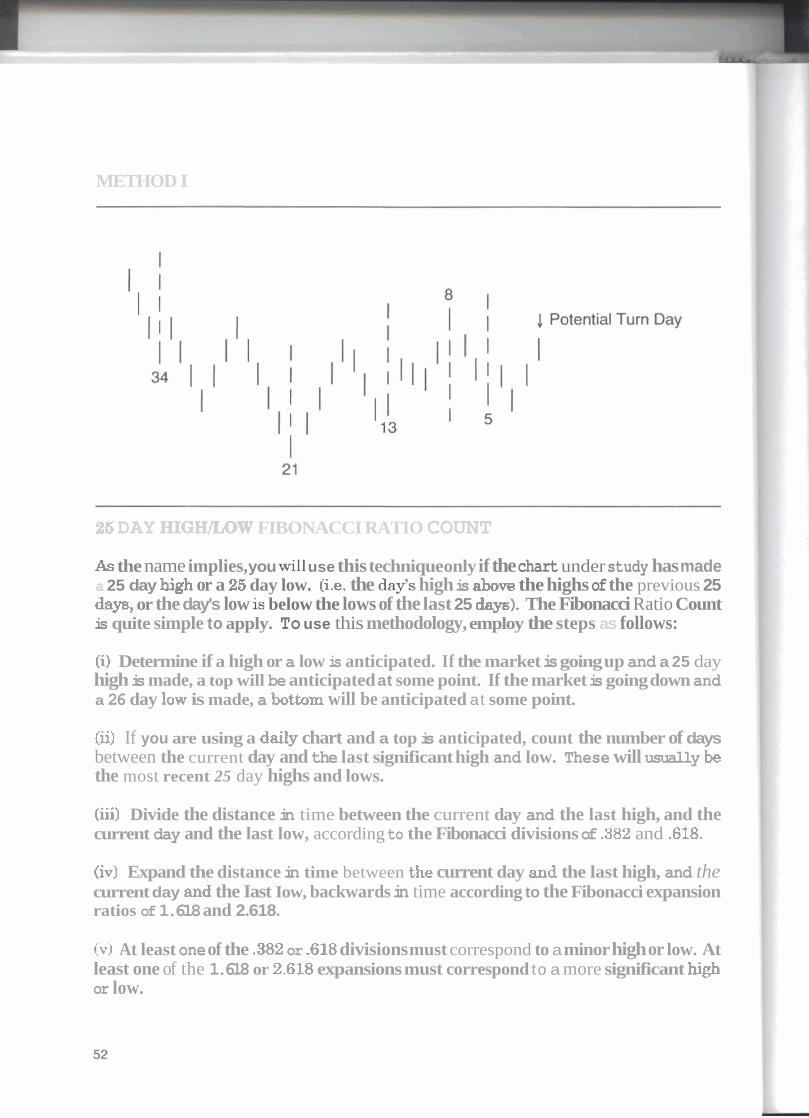
METHOD I
26 DAY HIGHLOW FIBONACCI RATIO COUNT
As the name implies, you will use this technique only if the chart under study has made a 25 day bigh or a 26 day low. (i-e. the days high is above the highs of the previous 25 dap, or the day's low is below the lows of the last 25 day^). The Fibonacci Ratio Count is quite simple to apply. To use this methodology, employ the steps as follows:
(i) Determine if a high or a low is anticipated. If the market is going up and a 25 day high is made, a top will be anticipated at some point. If the market is going down and a 26 day low is made, a bottom will be anticipated at some point.
(ii) If you are using a daily chart and a top is anticipated, count the number of days between the current day and the last significant high and low. These will usually be the most recent 25 day highs and lows.
(iii) Divide the distance in time between the current day and the last high, and the current day and the last low, according to the Fibonacci divisions of .382 and ,618,
(iv) Expand the distance in time between the current day and the last high, and the current day and the Iast Iow, backwards in time according to the Fibonacci expansion ratios of 1.618 and 2.618.
Iv) At least one of the .382 or -618 divisions must correspond to a minor high or low. At least one of the 1.618 or 2.618 expansions must correspond to a more significant high or low.
(vi) If these points do coincide with highs or lows, then there is a good possibility that the current day is a trend change day.
METHOD I1
HOW TO DO THE TIME COUNTS
There are two important considerations in employing the Fibonacci Time Relationship methodologies. The first is that you have to be somewhat more flexible in working with time than with price. In using price on a daily chart, the absolute high and the absolute low are always known and employed in the calculations. However, in using time on daily charts, we will not usually know the exact time of day a high or low was made. In order to accommodate this fact, an adjustment will be made in doing the time counts.
This adjustment will be to allow a margin for error of + or - one day in doing the counts, This is particularly important when using the expansion ratios.
The second consideration in employing the Fibonacci Time Relationship methodologies is that they should be done every day. By doing them every day, any F'ibonacci pattern that may be unfolding can usually be observed a few days in advance.

SUMMARY AND mVIm
25 DAY FIBONACCI RATIO COUNTS
I. Measure from potential high or low to hoth of the previous highs and lows,
2. Divide time distance from last high or low into Fibonacci divisions, and expand the distance backwards in time according to Fibonacci expamion multiples.
3. If at least 1 division and 1 expansion point correspond to a previous high or low, then a trend change may be expectd.
This is a good technique!
*anp ST aShrzy3 puaJq E uaqa %o~ , JO q3~q sno~~a~d E oq spuodsa~~o3
suorsu~dxa ay$ 30 auo pue I
suorsrhrp ayq jo auo TsFaT: TE JI (AT)

F i b o n a c c i Number Count
(i) Count backwards from t h e cu r ren t day. (ii) H i g h l i g h t t h e Fibonacci numbers in t h e c o u n t . ( iii) If at l e a s t 3 p o i n t s correspond t o previous
h i g h s o r l o w s , t hen a t rend change is due.
OCT HOW DEC JhN FEZ MfiR fiPR HnY JUN Jut AUG SEP
onu snr ~nr AWW ww YWW 833 NW~ 33a (ION 130

W. D. GANN
W. D. Gann was a stock and commodity trader in the first half of the 1900's. Gann enjoyed a reputation as an expert trader, and his tradingprowess has given rise to much research and speculation on the methods Gann actually used to make his market calls and trading decisions. The complete truth on how Gann actually traded will probably never be known for certain. In my opinion, it is a certainty that Gann never fully revealed his actual trading techniques. However, in my research I have found that by combining some of Gannh known trading principles with a little imagination, some very profitable trading techniques may be developed. These techniques are detailed in this section.
Are the techniques presented here the ones that Gann actually usedb trade? My guess is that t o some extent at least, the answer is yes - although to my knowledge Gann never nctunlIy wrote about or taught the techniques exactly as presented here. In any case, what is really important is the viability of the techniques themselves in actual trading.
This section contains what I believe to be the very best of Gann related methodologies. Actual trading performance must be the ultimate yardstick of any trading methodol- ogy, and based on that yardstick, what follows are the methods that have proven to be the most worthwhile for me in real time trading,
MASTER TIME AND PRICE CALCULATOR SQUARE OF NINE
The basic concept of the Square of Nine was introduced in "The Trading Advantage." To refresh your knowledge, the Square of Nine is sometimes also referred to as the Master Time and Price Calculator. The reason for this very appropriate title will I'm sure become clear as we progress. The Square of Nine is also sometimes referred to as the Octagon Chart. This is because there are eight squares (Octa meaning eight) surrounding the central square. Lastly, it is also sometimes referred to as the Gann Wheel. For the purposes of this manual, however, it will be referred to as the "Square of Nine," or simply the "Square."
The Square of Nine has nothing to do with squaring 9 as in 9 X 9. Observe the Square of Nine which accompanies the manual. The term square simply refers to the geometric 2 dimensional shape of a square. As well, there are nine boxes which make up the inner most, or centre square, Hence the name Square of Nine. There can be some confusion surrounding the name because Gann used the term square in so many different con texts.
If I could pick just one trading tool, aside from a bar chart of price history, it would

undoubtedly be the Square of Nine. This is true for three reasons. First, the readings and position of other standard technical indicators such as RSI, momentum, and moving averages, can be approximately known just by looking at the bar chart. However, the important time and price information given by the Square of Nine can only be realized by using the Square itself.
Second, the Square of Nine can be used in many different ways. There are four major trading techniques which will be illustrated, and three secondary techniques which will be discussed in this section. Each technique gives specific price and time information for applications over a1 trading horizons.
The third reason I believe the Square of Nine is so valuable is that it combines ease of use with very accurate price and time forecasts. I have seen markets trade for months at a time, where virtually every market turning point corresponded to a turning point related to some methodology using the Square of Nine. This is incredibly powerful information.
HISTORY OF THE SQUARE OF NINE
Many traders beIieve that the Square of Nine was invented by W. D. Gann. However, this is not true. The Square of Nine has been around for centuries. We know that ancient civilizations, including the Egyptians, were aware of its existence, and judging by its inclusion in tempIes and sacred buildings, these civilizations also accorded the Square of Nine great powers.
Based on his discovery of the Square of Nine, Gann also experimented with other mathematical squares. Hence, ifyou read literature written by or about Gann, you may hear of the Square of 4, or the Square of 12, as well as the Hexagon Chart. The latter is based on 6 squares surrounding the central square, and is in the shape ofa hexagon. In my experience, it is best to stick with the original, which is the Square of Nine.
CONSTRUCTION OF THE SQUARE OF NINE
The Square of Nine is so named because the numbers one through nine complete a square in the centre of the diagram. To appreciate the Square of Nine in terms of its geometric origins, look at the diagram and visualize it as a pyramid, At the apex of the pyramid is the number 1 and there are four equal sized triangular walls descending down to a square base. Each block in the pyramid is given a number. As you can see, each block has a cousin which is in the exact same relative position on the other three walls. These related cousins are separated precisely by intervals of 90 degrees, 180 degrees, and 270 degrees. As you will see later, these relationships are key to using the Square.
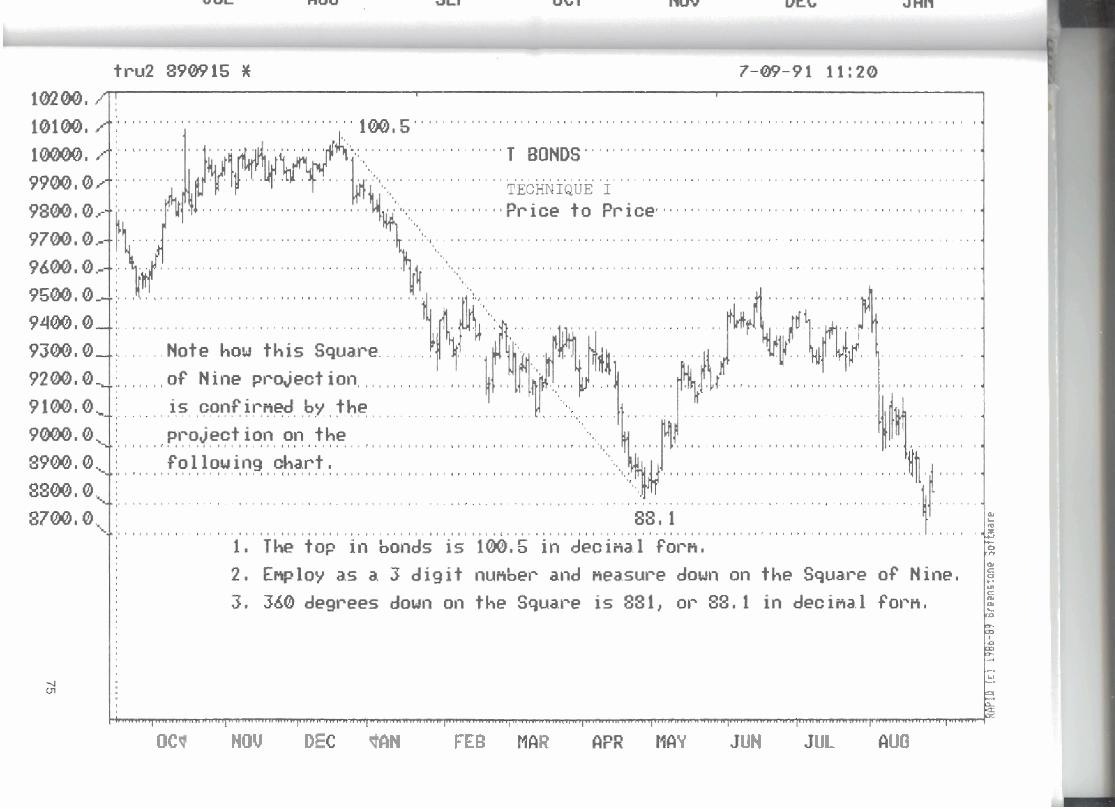
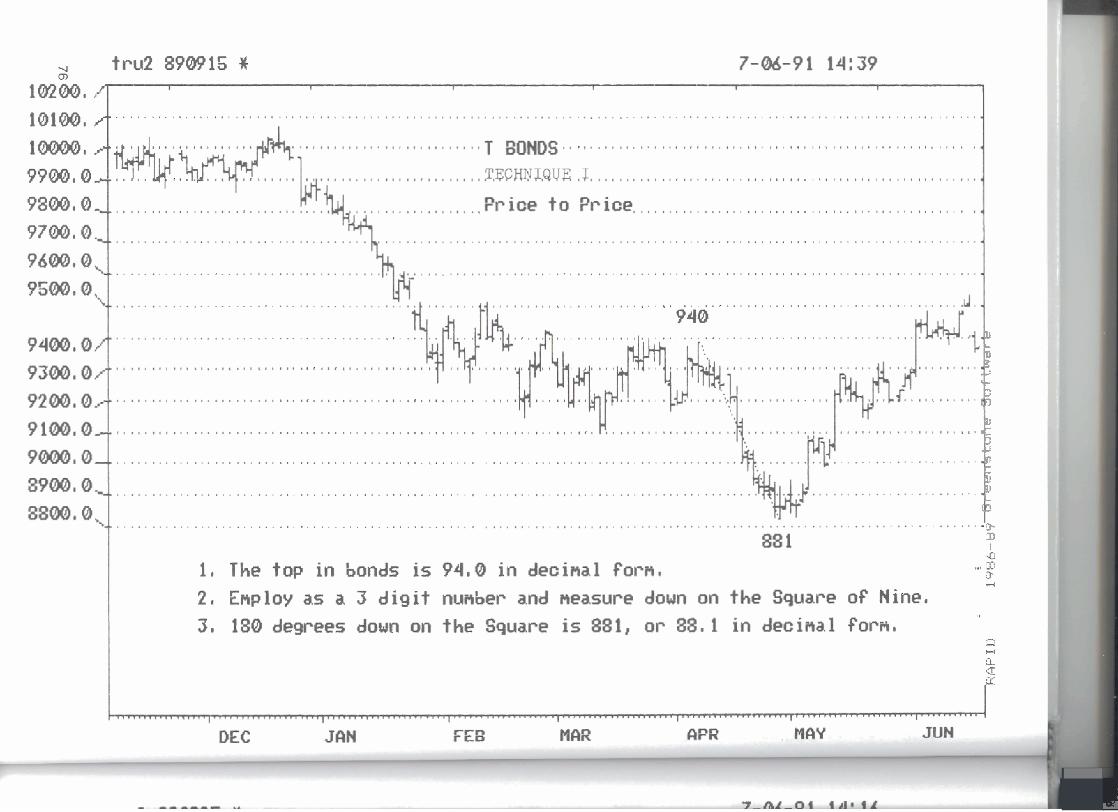
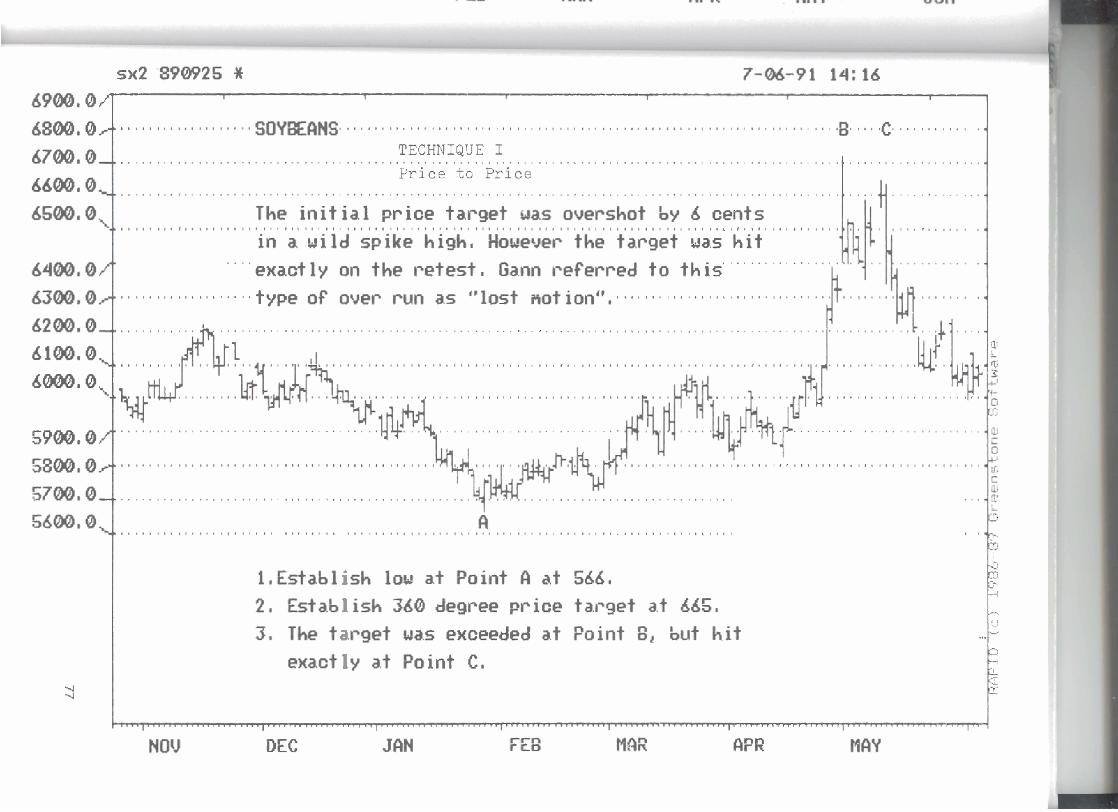
TECHNIQUE I
USING PRICE TO FORECAST PRICE TARGETS
This basic technique uses previous price highs and lows to forecast the level of future turning points in price. Generally, major tops or bottoms will forecast the most significant turning points in price. Minor tops and bottoms will usually only forecast rmnor turning points in price.
The steps are as follows:
(i) To find a price bottom use a previous high to start. To find a price top use a previous low to start.
(ii) Locate the block on the Square that corresponds to the historical high or low price. If using n significant high or low it may be any length of time in the past. Minor highs and lows should be the most recent highs or lows.
(iii) If starting from a price high, then move counter clockwise numerically 90 degrees, 180 degrees, 270 degrees, and 360 degrees t o find potentiaZ price support targets. If starting from a price low, then move clockwise numerically 90 degrees, 180 degrees, 270 degrees, and 360 degrees to find potential ~esistance targets.
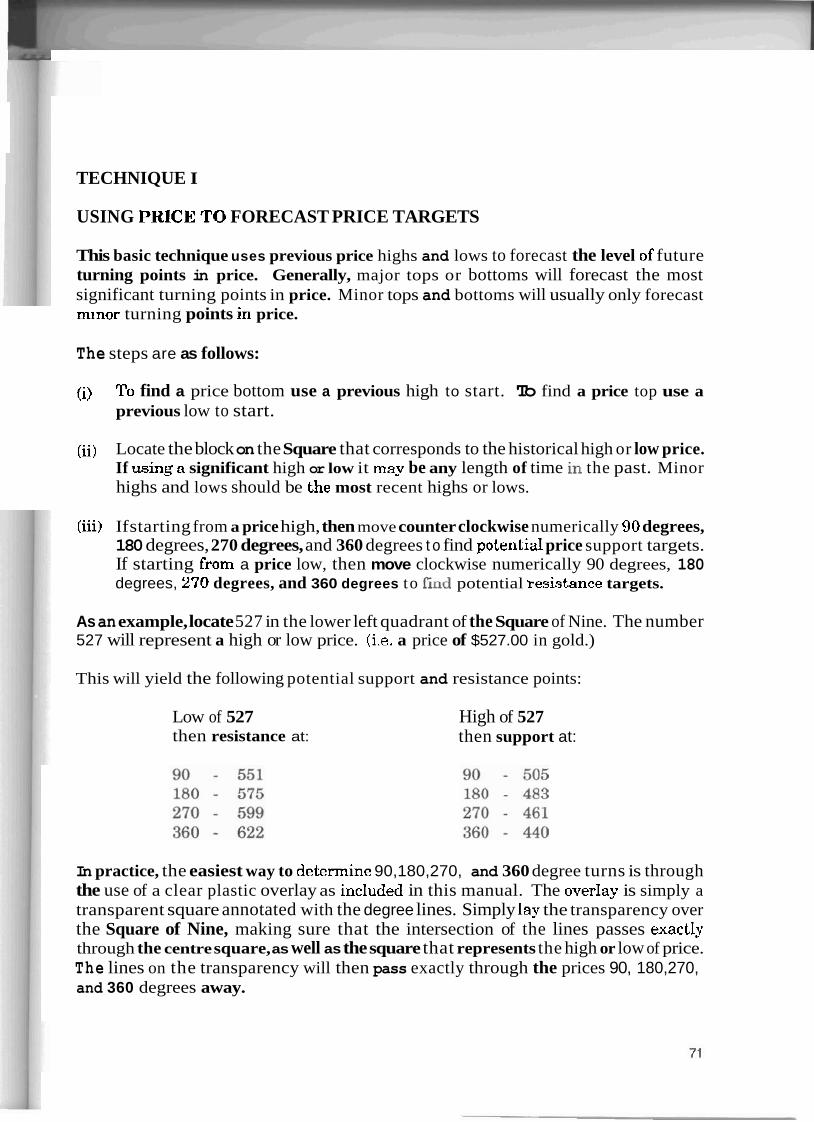
As an example, locate 527 in the lower left quadrant of the Square of Nine. The number 527 will represent a high or low price. (i.e. a price of $527.00 in gold.)
This will yield the following potential support and resistance points:
Low of 527 then resistance at:
High of 527 then support at:
In practice, the easiest way to determine 90,180,270, and 360 degree turns is through the use of a clear plastic overlay as included in this manual. The overlay is simply a transparent square annotated with the degree lines. Simply lay the transparency over the Square of Nine, making sure that the intersection of the lines passes exactIy through the centre square, as well as the square that represents the high or low of price. The lines on the transparency will then pass exactly through the prices 90, 180,270, and 360 degrees away.
HELPFUL HINTS FOR USING THE SQUARE OF NINE
The following factors should be considered when using the Square of Nine with any and all of the specialized techniques in this section:
1. Best results are usually obtained by using three digits on the Square. Therefore, round prices accordingly. For example, 9812 becomes 981. For stocks, 20 318 becomes 204.
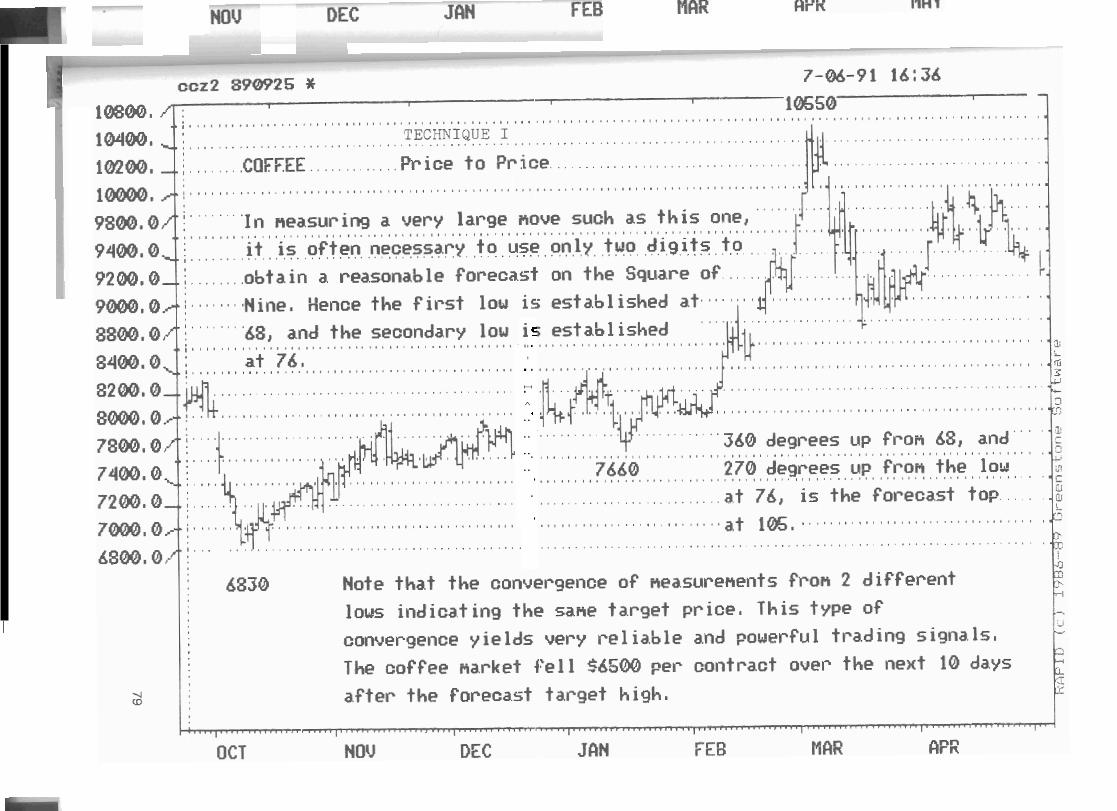
2. For some commodities it may work to continue to use four digits as long as the price is under about 1500. The same is true for stocks or commodities on the down side, as long as the number is over about 80. These are guidelines only, and for some very large moves these boundaries may need to be expanded somewhat. An example of this is in the accompanying Coffee chart.
3 . Bonds trade in 32nds so they may be converted to decimals. i-e. 98 16/32 becomes 985 rounded. Alternatively they may be converted to ticks. i.e. 98 16132 becomes (98 x 32) + 16 = 3152 or 3 15 rounded. The third alternative is to convert to yields, for which you will need a yield conversion table.
4. Occasionally, in runaway markets or blow offs, the price may exceed the measured target. This is what Gann referred t o as 'lost motion." Allow for this in exceptionally volatile markets. An example of this is in the accompanying Soybean chart.
5. Gann recommended maintaining constant contracts when using other methodolo- gies trading commodities. This means Dec. Gold would aIways be compared t o Dec. Gold, even if the comparison was to a period when Dec. Gold was not very active. In current times, however, it seems that continually using only front month prices for comparisons on the Square often yields better results. Usually one eor the other technique will be working. Hence I would recommend trying both, and using the one that is working.
6. Look for two or more square measures to converge in the same price area. For instance, look for 2 highs that both yield measures to the same potential low or vice versa. [See Coffee chart for an example.) This will add to reliability.
7. The best way to use the Square of Nine is to be aware of the potential turning points in advance. When the market nears these potential turning points, look to other technical evidence to see if a turn is indeed supported.
The market will often pause at the support and resistance targets indicated by the Square of Nine. If the market pauses, but does not reverse, it is a good indication

of the strength of the trend. If the support or resistance target only causes a temporary pause in prices, then this indicates that the trend in force is strong and will likely continue.
8. Many markets will work on the Square of Nine very well using just the futures prices. For some markets you should experiment with cash prices if you find the futures prices unsatisfactory.
9. For some markets it is wise to keep track of related commodities in a complex. (e.g. D-Mark, Swiss Franc, and Dollar Index or Soybeans and Corn, etc.) You may sometimes find that one or the other will hit an objective on the Square, and mark a reversal in the entire complex. Also, be aware that cash prices may work better where applicable. The only way to find what works is to experiment and track the results.
10. When using the clear plastic overlay, be sure to always have the intersection point where the lines cross over the number 1, or centre square.
11. Remember that the above points apply, where appropriate, to all of the Square of Nine techniques referred to in this manual.
Lastly, like most of the techniques in this book, you will find these techniques quite straightforward if you study the charts, and look at the actual Square of Nine to follow how the projections were made. The text can then be used to fill in the details, once you understand the concept.
--
.... *.
.. ..
.., -
.--.-.-..
0 0
4
2 0
C
0
m
n
4 P
YI m
m
x
m
XJ
D 3 x
m
4
k e Z
k
e
r
m
C=
Q
D !c
l iW
b-H
Fre
enst
one
Sof t
uare
rww
n 1986
B?
1
-
Ere
en
st~
ns
Sn
f tw
are
I E..
. 4
- I
Q1
YY
.

U
(11
19
86
8Y G
-
r-e
en
s tone
Sa
t tw
ar
e
WI
.
. -
.
.-
.-
.d
*
--
.I
<:
::
:
. .
TECHNIQUE I1
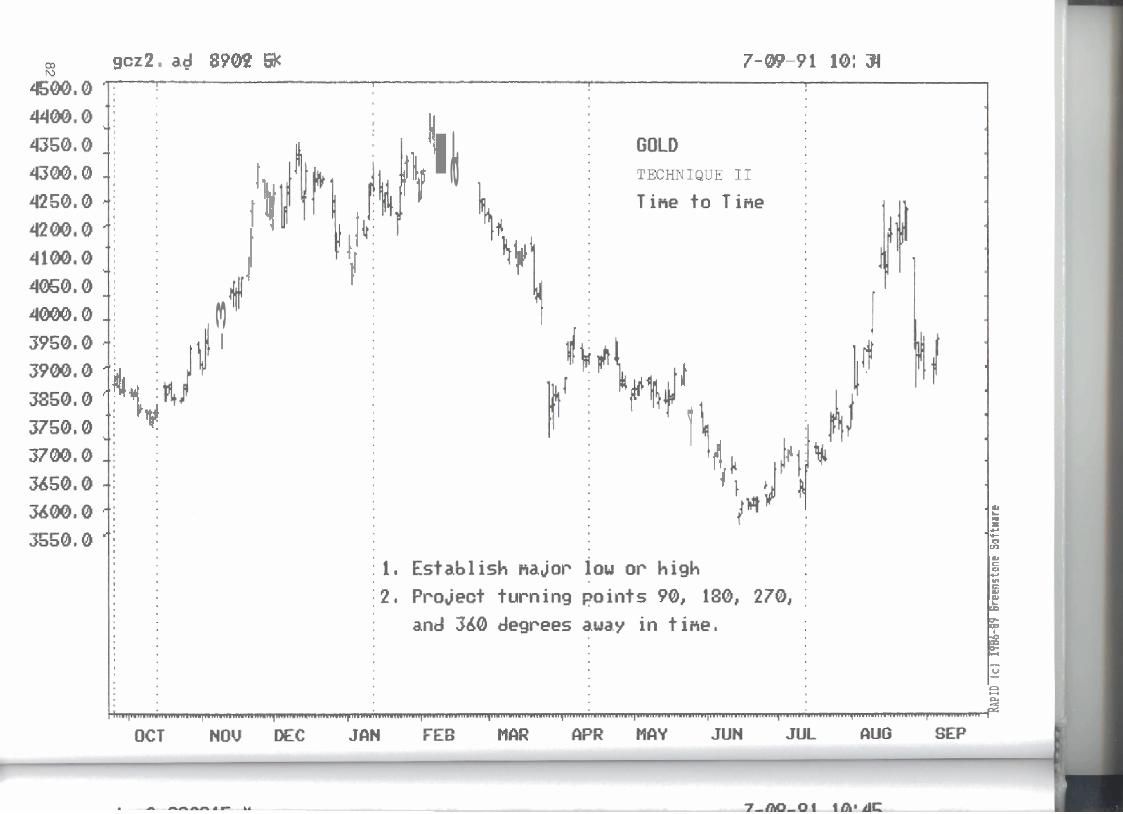
USING TIME TO FORECAST TIME TARGETS
This technique uses the dates of previous price highs and lows to forecast the dates of future potential turning points. Use the dates of major highs and lows to begin the forecast.
The steps are as follows:
(i) Place the transparent overlay on the Square of Nine such that one of the lines passes through the date of a previous high or low as indicated arotuid the perimeter of the Square. The intersection of the lines at the centre of the overlay should also pass directly though the centre square.
(ii) The lines of the overlay will now indicate the dates that are 90,180,270, and 360 degrees away in time. These dates represent possible trend change dates.
(iii) Allow for a margin for error of t or - one day in the forecasts.
You may have already recognized that the distance in time between each date in the above methodology will the same. In fact, since this methodology in effect divides the calendar year into quarters, the distance between each potential turning point will alwaysbe 91,25 days. i-e. 36514 = 91.25. This will be true no matter what date isused as the starting point.
Given the above, there is really no need to actually use the Square of Nine to obtain T h e to Time trend change projections. Simply look for trend changes to occur in approxi- mately 91 calendar day intervals, measured from the daks of major highs or lows, Note that these are indications only, and in some cases may provide no more than vety temporary support or h t a n c e to a trend,
The ue3e of 90-91 day intern& was discussed in The Trading Advantage." You may also recall that these internah were divided again into 45 day segments. The 45-90 day count is one of the most useful time related indicatam. You should watch for this count on both calendar days and trading days.
The charts on the following pages &ow examples of this technique.

eeeeeeeeaessaeeee
----
-.-.
.-.-
..-.
----
.---
---.
.-.-
----
+--
-.-
'*.
......
......
......
......
......
......
......
. ..
....
rn
4
3 ..
.. .*
..
....
. N
I
2= L
C
,
t -3
00
* -- m
- ii N V
I =
*
T
-
---
....
...
s -- -- 39
- a- -
-9-
a*
-& -
w --
..
....
. e ..
...
... .
- 5
Y
-=s 5
-L-
-4
=k-
/
-- --
=
s G
7
-
t
-- 8
I I. ..
.
- ..
....
..-.
..
... w
I s
w
~ >
c.
-7
e
I I
'a-
W
- -
-
- .
.
RAPI
D [c
l 19
8b-1
9 G
reen
ston
e So
ftmar
e 1
..
1
-1
-1
1

TECHNIQUE III
USING TIME TO FORECAST PRICE TARGETS
This technique uses the date of a major high or low to forecast the price of future support and resistance zones. It may at fmt seem incongruous that one can use time to forecast price. However, time and price are inextricably related. If you practice using this technique in your own trading, you should soon begin to see that this statement is an absolute truism.
The steps for applying this technique are quite easy to follow:
Ci) Establish the date of a major turning point. A major turning point will usually be the high or low of the last year, or at least the high or low before a significant trend move. For example assume Jan. 20th was a significant low. h a t e Jan. 20th in the lower right quadrant of the Square of Nine along the perimeter.
(ii) Place the transparent overlay on the Square of Nine such that one of the Iines passes directly through the date of the major turning point, and the intersection of lines passes through the centre square. Far the example given, Jine up the overlay such that one of the lines passes through Jan, 20th, and the intersection of the overlay lines passes through the centre square.
(iii) The lines of the overlay will now pass through price levels which may act as support or resistance in the future. Note that the lines will pass through many levels in the square. You will have to use the level that fits the price level of the commodity or stock under study. For example, if you are measuring in a down trend, you would use the first price level below the high price of the turning point date. Vice versa in an up trend. For example, assume a low of 527 was made on Jan. 20th and an up trend was under way. Resistance would then be expected at 534,558,582, and 606.
(iv) This will yield four price levels. In practice, price may not always reach all of the levels. As well, these levels may not always provide significant support or resistance.
Iv) There is some difficulty in obtaining exactly precise measurements using the overlay for this particular technique. Therefore, view the levels as target zones rat her than specific prices. Use other methodologies in this manual to help you obtain more precise price targets.
The charts on the following pages all use the Counter Clockwise Square of Nine. This does not mean that this is the best for all markets. It may not even be the best for the

markets illustrahd here, by the time you are reading this. A little experimentation should both help you better understand how to use the techniques, as well as determine which Square of Nine is best for a particular market.
TheSquareofNineis averyeasytool touse. Withminimal practice, youshouldbeable to determine the best methodologies for a particular market, all of which can be done very quickly. Follow the examples using the Square of Nine with the following charts and you will see what I mean.
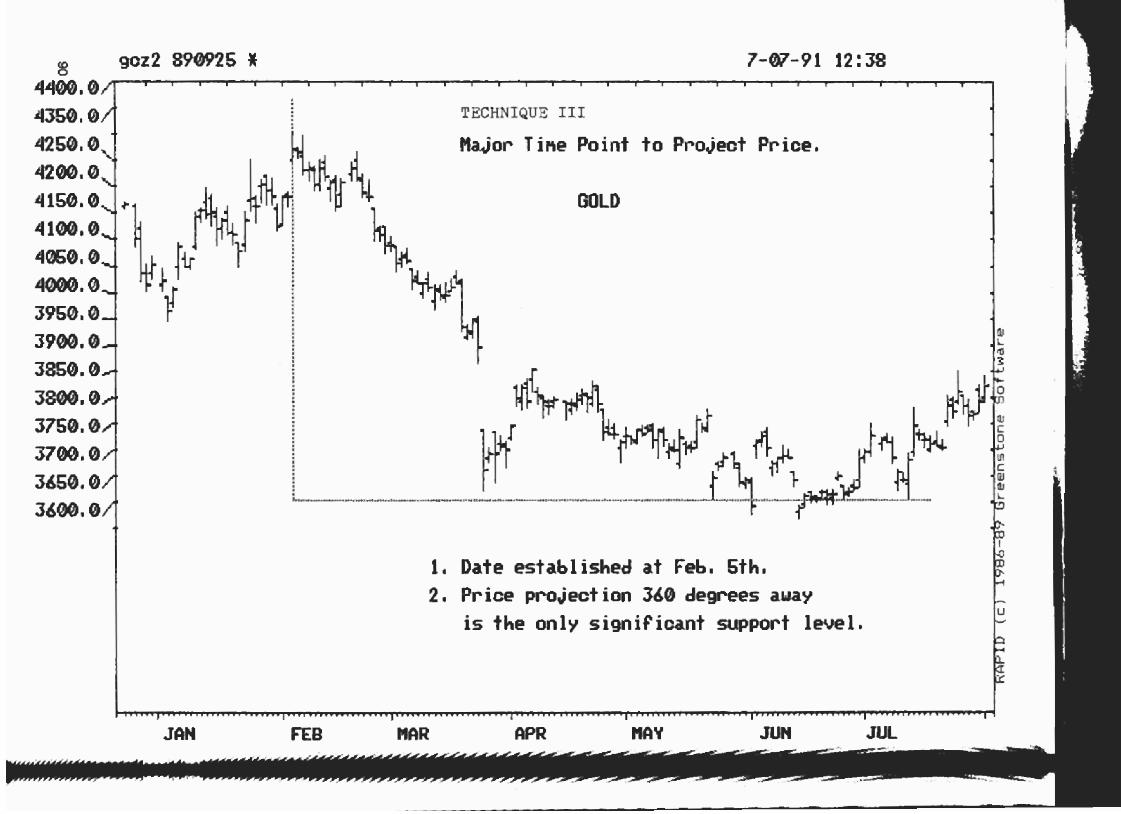
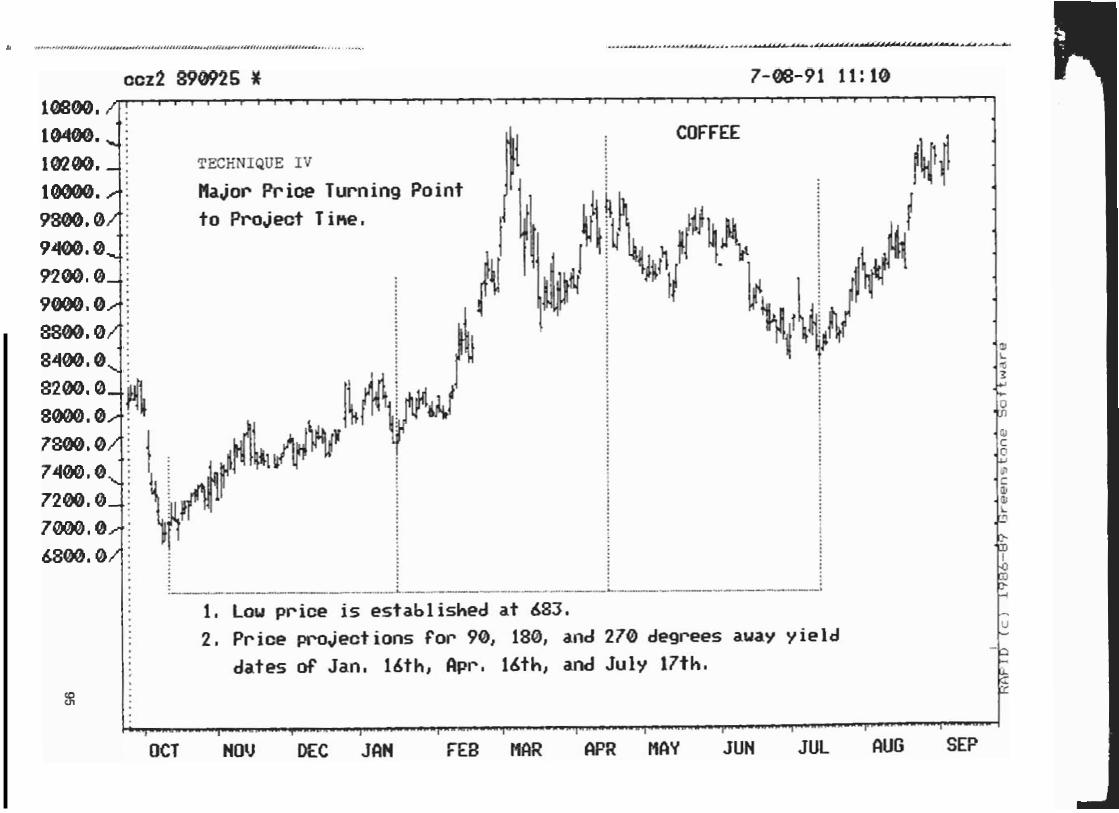
USING PRICE TO FORECAST TIME TARGETS
This technique uses the actual price readings of previous highs and lows to forecast the dates of future turning points. As with the previous technique, this bchnique is dependent on the intermlationship of PI-ice and time in the rnarlrek.
5 1 The steps for applying this technique are as follows: 7
I (i) Establish the actual price level of the high or low at a major market turning point. I A major turning point will usually be the high or Iow of the last year, or at lenst the
high or low before n significnn t trend move. For example, assume a significant high I was made at 674 1 in thc Swiss Franc. Rounding to 3 digits this is 674. h t e this
* I figorre in the upper right quadrant af the Square of Nine. x c 1
i (ii) Place the overlay on the Squaw of Nine such that one of the lines passes exactly I through the price of the high or low, and the lines of the overlay intersect through
the centre square. Forexemple, line up the overlay such that one of the lines passes through 674, and the intetrimtion passea through the centre square.
I liii) The linesof the overlay will now pass through dates that are probably future trend change dates or turning points in time. Allow a margin for error of +1- 2 days. In
I the example, Feb. 13th, May 13th, Aug. E3th, and Nov. 13th.
(iv) This will yield four trend change d a h . However, all of these dates may net always provide trend changes.
I ZEROING IN ON PRICE TO TEME FORECASTS
$ C
I I
There are two methodologies that can help in obtaining a more precise forecast of future trend change d a b while employing Technique IV as justdcscribed. The first is to look backwads 90 degrees from the approximate dateof thefimt forecast trend change date. You will m a l l that 90 degrees is equal to approximately 9 1 calendar days. Therefore,
The charts on the Following pages nll use the Counter Clockwise Square of Nine. This does not mean Ghat this is the best for nll markets. It may not even be the best for the markets illustrated here, by the time you are reading this. A little experimentation should both help you better undentand how to use the techniques, as we1 l as determine which Square of Nine is best for n particular market.
you will look back 9 1 calendar days from the approximate date of the first farecast trend change date.
h o k for asignificant high or low point within 1 ar 2 days on either side d t h i s date. This will not always occur. I-Iowever, if it does occur, the first forecast turning point date can be expected exactly 91 calendar days forward from the date ofthe high or low. This will give you a rnm precise date target to expect, although you should still allow for n margin d error of +/- 1 day.
To employ the .second way to zero in on a more precise time target, you must wait for a high or low to be est=ablished at the first turning point. Then simply measure 91 calendar days forward in time to get a more precise foreeast of the next trend change date. Again allow for a margin of error of +J- I day,
Both of these methodologies for zeroing in on n more precise target date, are illustrated with one example for each on the following charts.


TECHNIQUE V
HOW TO PREDICT THE HJGH ANI) LOW FOR EXCH DAY
The Square of Nine can also be used to help in establishing very short term support and resistance points in price, These can be used to help confirm the techniques discussed previously, andlor as action p i n t s for day trading. A11 the price points established are plus or minus n few ticks.
There are two methodologies which will yield eight potential high and low pints for the next day. These ptcntial support and mistance points can be narrow4 down further, because usually six of these points wiI1 be tso far awny t~ be considered useful. Therefom, you will usually be lefi with m e potential: mistance point and one potential support point for each day.
Further you will usually find that either one of the two techniques works best with R
particular oommdity. Therefore, this will narrow down the potential high and low points even further.
The steps to calculate tarnorrow's support and resistntlce points are as follows:
TECHNIQUE I
(i) Locate the date on the perimeter of the Square of Nine. As discussed previously, place tho overlay on the Square such that one of the lines passes through the date, while confirming that the overlay lines cross directly over the centre square.
(ii) Fiecord the closest two prices which are intersected by the lines and above the previous closing price. Also record the closest two prices which are int.ersec&d try the lines below the previrms closing price. These are four oft he potential support and resistance points.
TECHNIQUE XI
(i) Translate tomorrow's date into pl, numeric degree rending. Yiozl may recall that this is simply the number of degrees the current date is past zero, which is March 21st. For instance March 2 3 d would be 2 degrees, and January 2 1 st w I d be 300 degrees. You will recall that each 90 degree movement equals 91.25 calendar days, EXJ calculations should not be difficult.
(ii) Locate the degree reading on the main W y of the Square of Nine. That is, find
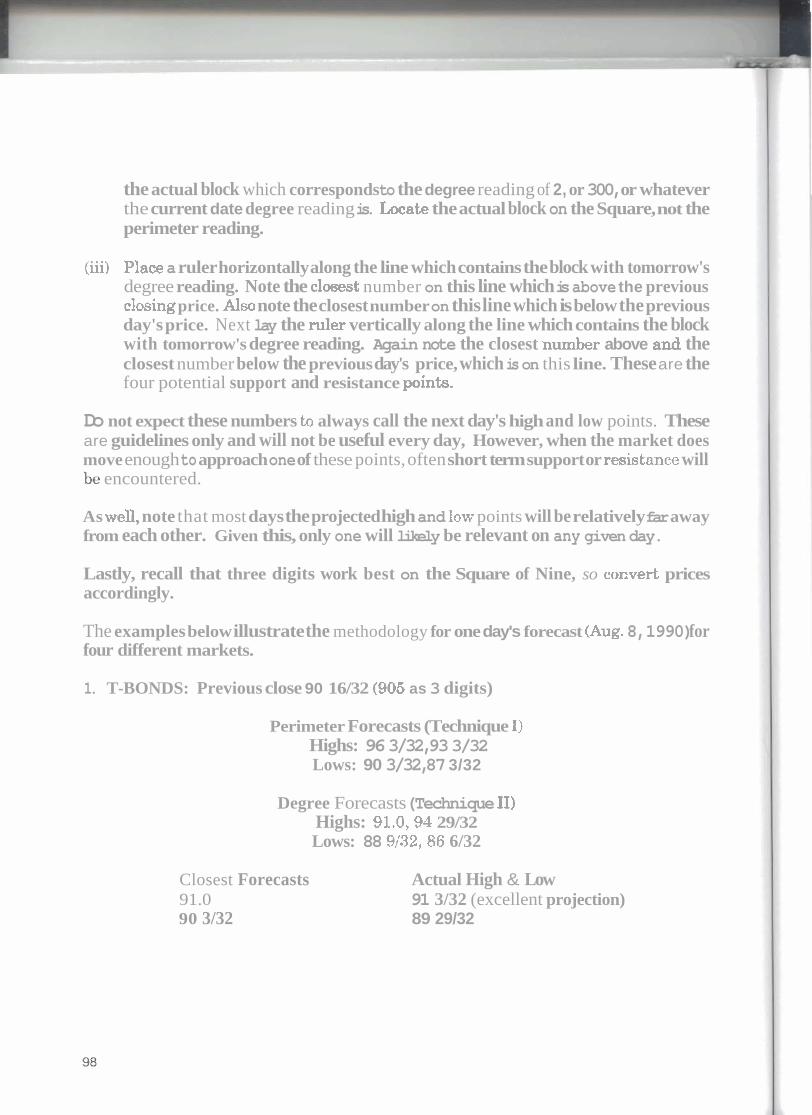
the actual block which corresponds to the degree reading of 2, or 300, or whatever the current date degree reading is. Locate the actual block on the Square, not the perimeter reading.
(iii) Place a ruler horizontally along the line which contains the block with tomorrow's degree reading. Note the closest: number on this line which is above the previous closing price. AIso note the closest number on this line which is below the previous day's price. Next lay the ruler vertically along the line which contains the block with tomorrow's degree reading. Again note the closest number above and the closest number below the previous day's price, which is on this line. These are the four potential support and resistance points.
Do not expect these numbers to always call the next day's high and low points. These are guidelines only and will not be useful every day, However, when the market does move enough to approach one of these points, often short term support or resis tmce will he encountered.
As well, note that most days the projected high and low points will be relatively far away from each other. Given this, only one will likely be relevant on any given day.
Lastly, recall that three digits work best on the Square of Nine, so co~vert prices accordingly.
The examples below illustrate the methodology for one day's forecast (Aug. 8,1990) for four different markets.
1. T-BONDS: Previous close 90 16/32 I905 as 3 digits)
Perimeter Forecasts (Technique I) Highs: 96 3/32, 93 3/32 Lows: 90 3/32, 87 3/32
Degree Forecasts (Technique 11) Highs: 91.0,94 29/32 Lows: 88 9/32,86 6/32
Closest Forecasts 91.0 90 3/32
Actual High & Low 91 3/32 (excellent projection) 89 29/32
the actual block which corresponds to the degree reading of 2, or 300, or whatever the current date degree reading is. Locate the actual block on the Square, not the perimeter reading.
(iii) Place a ruler horizontally along the 1 ine which contains the block with tomorrow's degree reading. Note the closest number on this line which is above the previous dosing prim, Also note the clmcst number on this line which is below t he previous day's price, Next lay the mler vertically along the line which contains the block with tumorrow's d e w wading, Again note the closest number above and the close~t number below the previous day's price, which is on this line. These are the Four potential support and resistance points.
Do not expect these numbers to always call the next dafs high and low points. These are guidelines only and will not be useful every dny. However, when the market does move enough to appmach one of these points, often short term supprt or resistance will be encountered.
.As well, note that most days the projected high nnd low points will be relabively far away from each other. Given this, only one wilI likely be relevant on any given day.
Lastly, recall that three digits work best on the Square d Nine, so cocvert prices word ingly .
The examples below illustrate the methodolow for one day's Forecast (Aug. 8,1990) far four different markets.
1. T-BONDS: f revious close 90 16/32 (905 as 3 digits)
Perimeter Forecasts (Technique I) Highs: 96 3132,93 3/32 Laws: 90 3/32, 87 8/32
Degree Fortxnsts (Technique TI) Highs: 91.0, 94 29/32
Lows: #I 9/32, 86 6/32
Closest Forecasts Actual High & Low 91.0 91 3/32 (excellent projection)
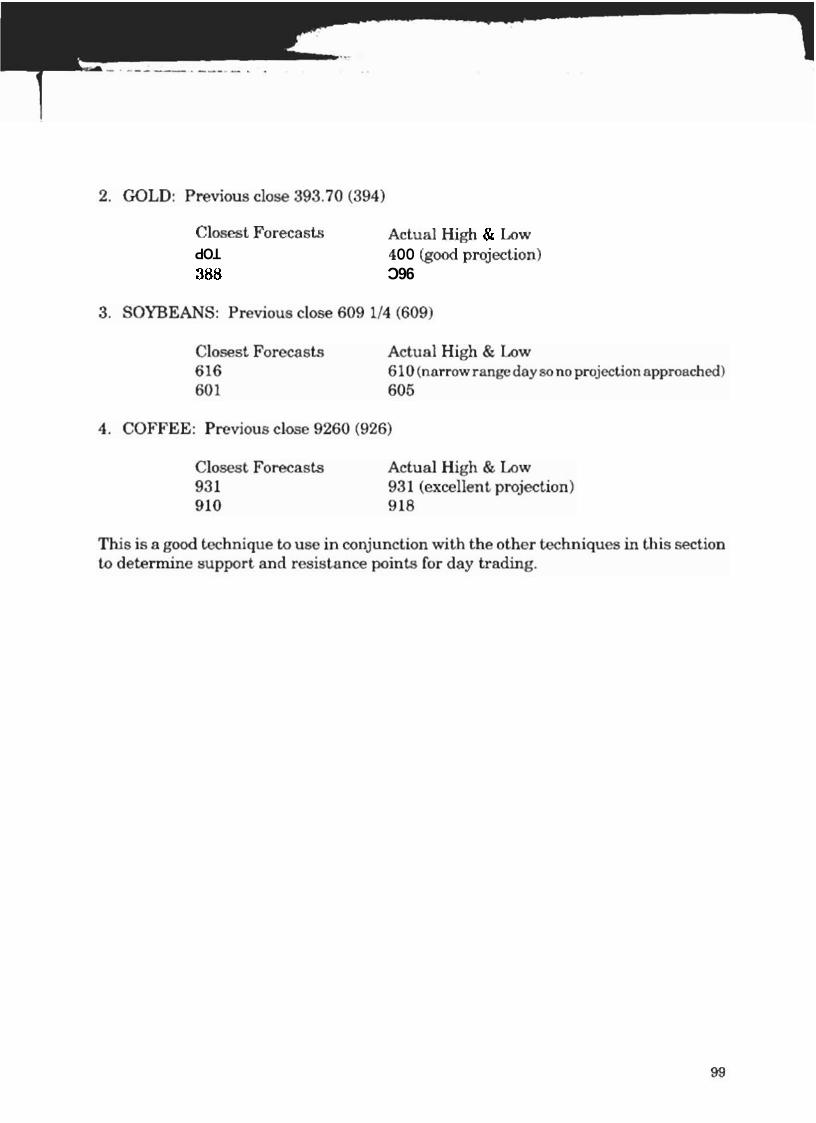
96C 8% ~uvl=!md pooa 00 F TOP fiq ?? W!H lanlW qslsmaao~ lsaml3

-ploS "3 label q~oddns 13 maaq uqo ee y a3g3w~d U! pun '61 JO arenbs pmtqnn aqa s! siq~ 'p1& U! 1968 ah! .sananhs gvrnqsujo qaq aqq saymo~dde q~d ss WmqsaJ JO g~oddns JOJ yoq
smnbs WIULLVN BSn 0.L MOH
vApq~u~u! auq Lpapo mms aqg sar~as p!qsuaqsnr asaya quas~dar p an!N jo aenbg ayL qa "8 '6~ "2 '6 y sayas $q~ 'qu~Jpunb 73al Jafiol aq? y3nq out1 ~q%!uqs w u! amw pnw qqq
aq3 78 par~nbs mequrna ppo aqqjo 11" 'qa 'pg 'gg '9.1 'p q sapas aq, 'qu~.'pwnb ~@YJ ~ddn aqq yanaryl auYl qy8!s~ls e u! anom puw q30[q aqua3 ayq 38 pels penbs %3qumn ua~a aq? jo [p 9sp-l am n!fi nob au!Njo msnbs aq? uo qos~ ~l!fi noLj1
.~y~uur u! Jape aqq aayap saop uqo arsnb~ ay7 Llqw -uo~asanbun anq '-an24 a,auoiCutr sr . aurNjo . arnnbs ey3 u! pu!qulx, ars suqql.Crl~ waqq Aqm puw AOH -qagmm UI quamahow a-3 pas a~l~dgo ury@p [w~n3eu ay? sleanaa uqo 7; y~q~ uaas Lp(psarla &aq a~ -Jqelna[m ayuourmq p~rqou s s! au!~jo a~snbg eq&

NATURAL SQUARES
1x1- 1
2x2- 4
3x31 9
4 x 4 ~ 16
5x5- 2 5
6x6- 3 6
7x7- 4 9
8x8- 6 4
9x9- 81
IOXLO- 100
llxll- 121
12x121 1 4 4
13x13- 169
14x14- 196
15x151 225
16x161 256
17x17- 289
1 8 x 1 8 ~ 324
19x19- 361
20x20- 4013
21x21- 4 4 1
22x22- 4 8 4
2 3 x 2 3 - 529
24x24- 5 7 6
25x25- 6 2 5
26x26- 676

CARDINALS AND CORNERS
This technique is the easiest of all of the Squam of Nine methodologies to employ. I t requires no calculations or measurements, simply observntian of the block or p s i tion where price is on the Square of Nine.
h k at the Square d N i n e and note Chat the line of numbers that run horizontally and vertically through the centre square are highlighted by a darker border, These lines of blocks are referred to as the "Cardinal" squares.
The''Gomem"are the lines of numbem which run diagcmnIly out from the centw square in four directions. These join the centre, or number m e square, ta the corners of the Square of Nine, hence the name Corners,
FZXPANDITYG THE SQUARE
It has previously been stated under the widelines far using the Square of Nine that it is usually best to use three difits on the Square. However, when using Cardinals and Corners it is equally beneficial to expand the Square to include four digit and five digit numbrs. For example a T-Bond price of 102 25/32 would cornspond to a Cardinal at 10279. I102 25/32 converted tm decimal form equals 102,79).
Cndinals and h e r s are not significant in Chemelves. The most important fnchr to note in using this technique is that it will tend ta be very useful in streaka of three or more occurrences, That is, once a Cardinal or n Corner price block is coincident with a turning point in price, then a, smies of Cardinal or .Corner turning pints wiII o b n follow. Therefore, once R high or low is coincident with a cardinal or corner, you should be alert for mkquent highs rind lows coincident with n c~rdinal or corner.
A numeric listing of the Square of Nine Cardinals and Cornera is contaEned an the following page.

GZ9P ""~vP
tq&P qZZb L60P B96E C88E TZLE: 1 O9E TQbE G9CF 6PZE LFTF SZOG L 162 6082 SOL2 11092 IDSZ TOP2 91365 60ZZ I LC2 7 86 7 €681 LORI EZLT IP91 T9GI F 8 b 1 LO~T €CCT 1921 T6TT 6801 Gzar 196 r 0s t PQ S8L 6ZL LL9 szg LL$ EZS SOP TFP TOY T 9€ GZF: 6QZ LGZ
T6q6 9SVP PZFP C6T P G90P 9C8E $la€ T69E 1 LGC ZFPG SCCE: TZZE 60TC 8562 0682 EBLZ 6L9Z 9LSZ 9LVZ LLEZ THZZ 9812 b60Z 6GB1 I LOT 9BLI ZOLT 1291 'I FS t WbI QSEl ST FT EFZI ~tl,~ T CLOT 6 0 0 '1 9 tB me LZ8 T LC 91C Pg9 FT9 F9< 81s PLP IFF 16F ZCC 91 E: I RZ fib2
LSSP €ZP& 16ZP 7915 EFOP LOGE E8LF 199€ T PGE EZPF LQGE E61F: t80C 'I L6Z 6982 CSLZ CSBZ T WZ ITbZ EGG2 LGZZ €912 IEZOZ LCRT 6P8I G9LI 1891 f09P IZSt CbbT 69EI L6ZT szzt
CR6 TE6 PL!3 €10 LSL SOL IC9 709 FS'2 LO'; F9tr TZb TG€ 6 PI: LOF F/!Z I tZ
THE TWO MASTER PRICE AND T M E CALCUTATORS
This is the shortest section in this manual. However, it contains very important information for using the Square of Nine far maximum benefit, You will notice that on the Square of Nine there is a clockwise scale and n counter clockwim scale. This simply refers to which direction the dates move away from the starting point of March 21at. Hcnce there are really two distinct Squaw.
Although there are a few traders who am a w m of the existence of the Square of Nine, very, very few are aware of the existence of two distinct Squares. One of these two Squares will work best for each market, A littllc experimentation should quickly determine which Square to use for which market.
Note that in using the Square of Nine far price to price and time ta time measures, each Squam will yield identical results. I t is only when using the Square for time to price, and price to time, measures that the distinction will make a difFcmce.
The chart examples in thb manual have used the counter clockwise Square for all the measurn. However, you must determine by your own experimentation what Squam is best for each market. You should be able to do this in n b u t 30 minutes with a little back testing using previous highs and lows.

SUMMARY: SQUARE OF NINE
In the introduction to this section 1 state$ that the Square of Nine was probably the single most powerful tool available for use in market analysis and forecasting. HopefuIIy, you now see why I made this statement.
What the Square also shows us, is that time and price are undoubtdly related. The Squnre of Nine can enable you to pinpoint the relationship hctween both high and low prices and trend change dates, and h e m help reveal the arder in market movements.
Remember that no method of analysis contained in this manual will be applicable to all markets, all of the time, This applies eqrrnI1y to the Square of Nine, As a trader, the optimum point to take action will be when a confluence of analysis techniques are all pointing toward a specific turning point in price and time. There are actually 14 different ways to use the Square of Nine. In this manual,seven havekendetailed. The other m e n ways simply involve using a number other than one for the centre square. Thk number would be the price of a significant high m low. 'fiereafler, the analysis w w l d be the aame as has been previo~isly described.
This latter methodology obviously requires substantially more work. I personally do not use this methodology, and therefore, cannot a t k t to lthe relative merits ofusing the Square of Nine in this way.
PRIMARY NUMBERS, MTIOS, AND CYCLES
When fir.& ~tudying oridnal W. D. Gann materials, one can be stmck by the fact that Cenn seemd to think tbnt virtually every number and division was an Uirnportant"one. This characteristic nllows one to see, in retrospect of course, that one or more of the "important" numbers played a part in turning the market at a particular p i n t in price and time. If one stap.s their investigation of Gann at this point, one could easily a m m e that Gann considered so many numbers significant, as to b practically useless market forecasting h t s .
While it is true that Gnnn did in fact write that many numbers and divisions were important, a practical and objmtive study leads me ta conclude that most of G m ' s more public writing was perhaps a diversion. Whul Gann discowned thal redly works, hR r e d s more in t k r y t h in specif~s.
By theory, I mean that the essence of all Gann's work is based on simple geometric relationships. The geometric mnfirnrations uwd by Gam are the circle, the square, and the triangle. In three dimensional terms, these are the sphere, the cube, and the pyramid.
Gann waFi not the only historical figure of note Eo find power and substance in baaic geometry. Leonardo Da Vinci consciously used these configurations, as well as the Fibonacci ratios, in much uf his work. Isaac Newton had a Fibonacci circular spird and a triangle carved into the headboard of his bed. In a self portrait, Pythagoraa held in his hand a pyamid, which he proclaimed contained the key to the universe, In the modern era, Albert Einstein nccorded great respect to simple geometry, and to its repetitive nature and power = it is played out Ithrorrghaut the Universe.
Therefore, by studying thc numbers and ratios most n s h a t e d with basic geometry, you can dismwr the basis for b d h Gann's number cycles, as well as the Fihnncci numbem and ratios, These numbers me prevalent and repetitive in many areas of nature, By starting from this premise, I have found it possible to separate the tmly significant from thc marginally useful, in the application of number cycles and ratios in the financial markets.
Following is a brief discussion of important number cycles as well as speculation as ta their possible derivation.
The circle contains 360 degrees, which is very close to the number of days in the earth's solar year. Our solar ycar is also divided into 90 d s p e segments according to solstice and equinox, based on the relative position of the earth ns it revolves around the sun. Therefore, the n u m b 360 and 90 represent two impartant nurnbr cycles which have ;a firm and repetitive foundation in geometry and nature.
am!) ,,auV WRaaJ, 6V - GP aV Jo 7~pd Pn J! Lluo Pm '~~~!J~!s JO T ol6P 41110 punoj ~AEY I 4m3y7~~ w-t~lef) rCq aumg~u3!s ua~g a~a~ "6 t! yaym "30 annbs eyq PIXB 'CL at auaH .alqyq ay? u! L1asln3!p~d wou q put! 'suo!pztl!np quayau~ rCq ?! cq p~pa1~ WUB~TJI~~~!S~E~ L qmnu ayj, *uu.rr~), Xq wumyru3rs , . uan@snm ~aqumu aru
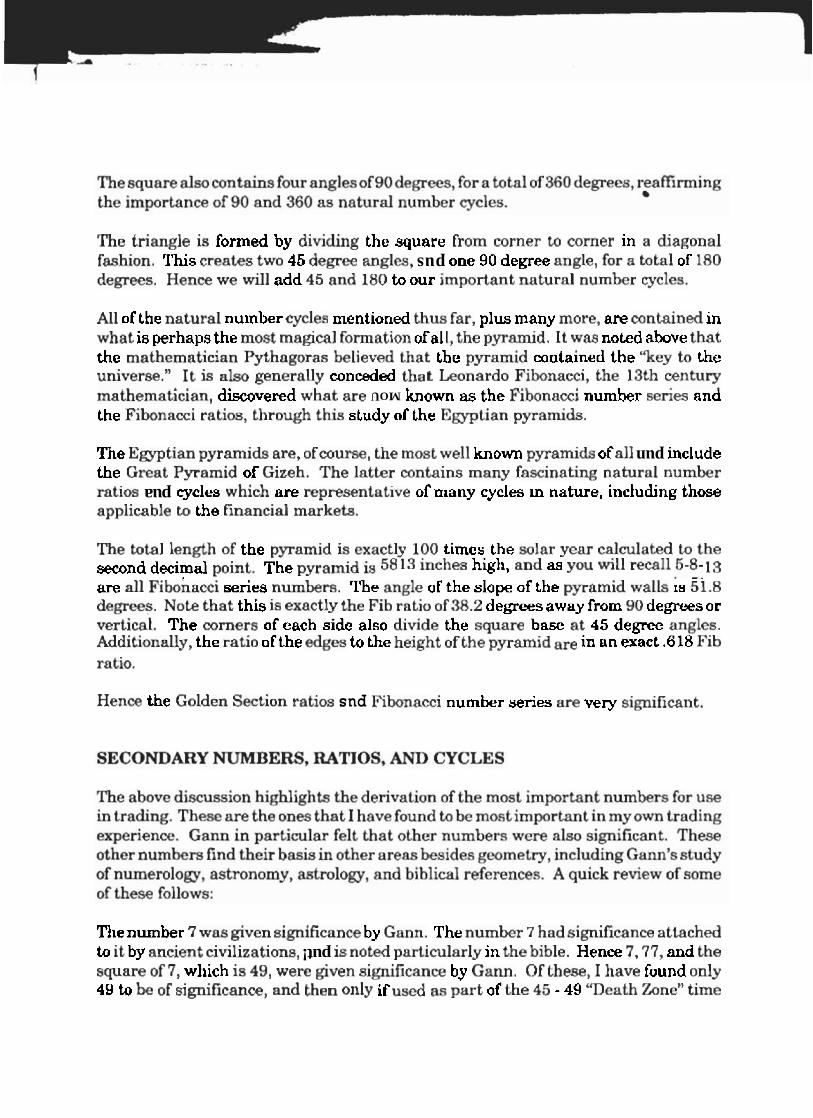
'?umg!US!s ha~ an sap^ qwnu !338aqu pus soys~ uop3a~ uapp~ aq wuaH
*o!7nJ q!,q $19, y'sxa u~ u! p?m~Ad ayqjo ~yB!ay aql g sarSpa aqlja o!'gls~ aqq 'L~pnotpppv -sa13u~ dap glp 3s aswq ar~nbs eq3 apmp ovIe ap~s y3aa jo s~su~m au -1mrq~a~ Jo swap 06 moq hms saaaap Z.~C~O O~LI q!j aw ~3uxa SF qql qeq? qoN #&aP g.19 sz q~e~ py~u~Ld arp jo dogs ayq jo q8uw aq;L mwqmu saps !331euoqj~ [p arw
-8-0 1[maa 11" MA BB PUB *yaq saq~u! €1 $9 p~ure~~ci aqJ -lu!od pdpp pumas aq3 07 pqqm1wa ma4 avps ayq samy 001 L~PPX~ q P~BLCCI aqa 30 ly@ual lqq ayLT,
.s?9ynmx p!anaur_l; ay7 107 arqmgdds asoq Burpnpur 'amleu ur sap115 Luemjo a~r~rtlq-dm ara y31qm saph pua sotlnl Jaqmnu ~n.mqeu ~'hr!?supmj LUBW su!yutx, ~qqq aq& .yaz!g p p~ar~dd lna~f) aq7 apnpq pun IIB jo sp€~f~~Ld wouy IlaM JFSOUI a117 'rnnmjs 'am ap~ur~~Ad ulegdG3g ay&
xpule~Ld us!3dCl3 aq? JO Kpnqs qq~ @no~q~ 'go!qv~ !msuoq!j aqa puu wuas daqurnu rmsuoqr~ ayq se UMO~ MOU am ~WYM panmp 'usmqawaq~sm finl& qq~~ aqy '!&suoq!i opmuaq papurn Allo~ana q .,*as~ayun aq g ilCa% aql paurqam p!znafld aqa ley? paaa!laq se~oBnq& ngp!puraqqem: arp IE~F) anoqe pqoo ST& .ppmr~.Kd aqlL, ISJO ~~B~OJ ~~@BUI 3s0~l aq sdsq~ad s! ~svm Y! pau!quw aw ba~~~ LUBW m~d 'JBJ my3 parnoguaur sapA3 ~aqurnu ~e~nl~u aqq jo 11~
.sap43 J~WRU Imnqau quepodw! Jno g OST PUB 9p ppe I~M a* a3eaH .saad?ap 087 JO 1~1~ B JOJ l'al%u~ wBap 06 ano pus 'sal9m asap gp om2 sqwas sq,~ .uo!qssj 1~uoSef~ v U! laudm a JauJcx, rrro~j a~wnbs ayl %upn!p rCq pauuoj q al%my 39~~

period, ( N o k The "Death 7fine" was discussed in the 'Trading Advantage" manual.)
The number cycle 72 - l.34 - 288 was also considered important by Gann. You may have heardorreadof"thesqua~dl44." Gannused theterm"squ.lareWbrdertoasi~ificant market cycle. You will recall that '644 ia a Fibonacci number. Fibonacci numbers nm important. I t is also the natural square of 12. i.e. 12 x 12 = 144. Natural squares are also imprtnnt. The number 72 is half af 144, but also twice 36, which is thc natural square of 6. The number 288 is twice 144, but. is also only 1 away from the natural square of 17, which is 289. Hence what we = is that 144 is probably no more significant than any other natural quere, except that it is also a Fibonacci n u m b and is closely related to other natural squares around it. Themfore, in my own trading I acood this cycle same importance.
Another number cycle Gann considered important was 30 -60 - 96. Thiscycle probably has its roods in nstronomical phenomena. That is, 90 degrees is the distance between solstice and equinox. 30 degrees is the distance between Zadiac divisions. 60 degrees is the halfway division point between the former 2 points. It in also the interior angle measure in an epuilakral triangle. This can, therefore, also be conc;idel.ecE a g o d secondary cycle.
Gann also m i d d 62 as a srignificant trend chnnm cycle. This probably also is based on an astronomical phenomena. Thus far we hava seen Gann consider 7,30, and 52 ns important numbers. Them are the nurnbr of days in a week, days in a month, and weeks in a year. As wall, the slope of the Great Pyramid waHs was approximately 52 degrees. I hnve sersn this cycle of 52 work in the s k k market particularly, ht its influence fades in and out. It can be considered of significance in some markets.
Gann often divided tradingranges and other numbers into eighths. Each of these 118th divisions then also became irnprtrmt. There is more than one possibility aa to why Gann c h m to do this. One is the 45 degree and 360 degree relationship, Roth 45 and 360 are significant numbera which are recurrent using a variety of geometric and sstronomical techniques, Since 45 is exactly U8th of 360, Gann may have chosen to carry this relationship forward and apply it ta other kading situations,
However, I believe that the real basis for Gann'sdivision of8 may well be Fibonacci, The really interesting part of this, is that Gann never made reference to Fibonacci in any of his writings. Not even one . This lock of reference is p m i ~ e l y why I believe Gann accorded such great importance tn Fibonacci. Let me explain further.
It is well known that Gann was a workaholic, who studied virtually all significant mathematical discoveries, especially those directly involving numbers. Something as mysterious and esoteric as Fibonacci would be something virtually sure to capture the attention af W, D. Gann, While Gann did not specifically mention Fibonacci, I believe
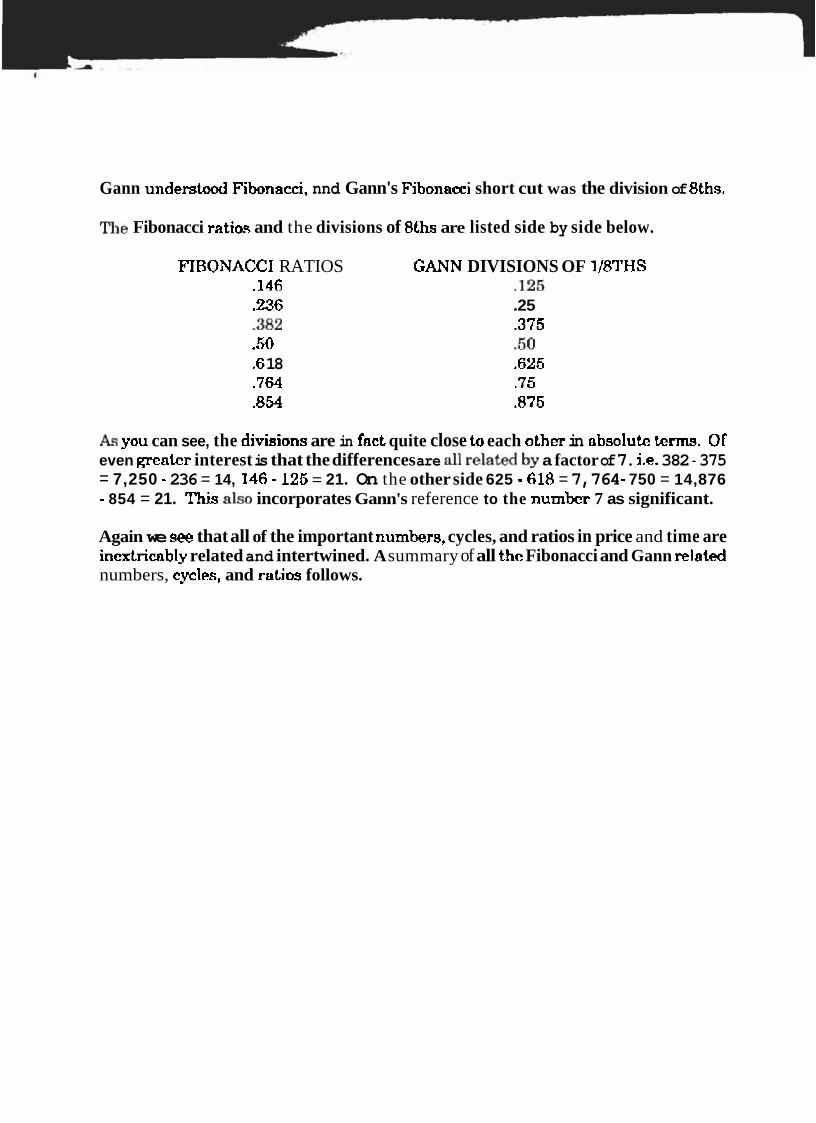
Gann understood Fibonacci, nnd Gann's Fibonacci short cut was the division of Bths,
The Fibonacci ratios and the divisions of 8ths are listed side by side below.
FTBONACCI RATIOS ,146 ,236 382 .50 .6 18 ,764 ,854
GANN DIVISIONS OF 118THS .I25 .25 -375 .SO ,625 .75 .875
As you can see, the divisions are in fnct quite close ta each other in absolute t e rn . Of even greater interest is that the differences are all relrrM by a factor of 7. i,e. 382 - 375 = 7,250 - 236 = 14, I46 - 125 = 21. On the other side 625 - ti18 = 7,764 - 750 = 14,876 - 854 = 21. This also incorporates Gann's reference to the number 7 as significant.
Again we see that all of the important numhers, cycles, and ratios in price and time are inedricably related and intertwined. A summary of all the Fibonacci and Gann related numbers, cyclea, and ratiw follows.
INTRODUCTION
This is a short section of the manual. However, do not underestimate its importance ifyou are a day trader. These techniques can often provide uncannily accurate support, resistance and trigger points on a short term trading basis. I use the price level where there is a confluence of these points. This confluence does not happen every day. But the days it does make it very worthwhile.
PIVOT POINTS
The Pivot Point formulas and derivations have been around for a long time and are very well known. In fact, many tool box software programs and real time quotation services provide these points as part of the analysis tools. However, their popularity does not diminish the usefulness of these points. This section will introduce a new wrinkle for using the pivot points for determining important support or resistance in price, First the formulas for deriving the points are given below.
2nd HIGH PIVOT = P + 2 (P - L) 2nd LOW PIVOT = P - 2 (H - P)
3rd HIGH PIVOT = H + 2 (P - L) 3rd LOW PIVOT = L - 2 (H - P)
where P = PIVOT, H = HIGH, L = LOW, C = CLOSE.
The new wrinkle to the Pivot Point technique is to introduce an integration of time frames. This simply means that the calculations are done using daily, weekly, and monthly data.
All of the Pivot Points may act as either support or resistance. For example, if price is below the 1st low pivot, then this pivot point will be potential resistance. If price is above the 1st low pivot, thenit will be potentialsupport. Themonthly and weekly pivot points are valid throughout the week or month, no matter how many times they may be approached by price, However the first time a pivot point is approached is the most significant.
After the Pivot Points are calculated on three time frames, the system can be used for determining the strength of potential support and resistance zones. This is done by

looking for a confluence of Pivot Points at a specific price area within a few ticks. To have significance, a particular price area must have a confluence of Pivot Points at a particular price level. The greater the number of points at a particular price area, the greater the potential for support or resistance.
Example
Daily H = 70.00 L = 67.00 C = 68.00 Weekly H = 72.65 L = 67.89 C = 68.40 Monthly H = 78.01 L = 73.00 C = 77.99
Calculations
DAILY PIVOT = 70.00 + 67.00 + 68.00 1 3 = 68.33
1st HIGH PIVOT = 68.33 + (68.33 - 67.00) = 69.67" 1st LOW PIVOT = 68.33 - (70.00 - 68.33) = 66.67#
2nd HIGH PIVOT = 68.33 + 2 (68.33 - 67.00) = 70.99 2nd LOW PIVOT = 68.33 - 2 (70.00 - 68.33) = 65.67
3rd HIGH PIVOT = 70.00 + 2 (68.33 - 67.00) = 72.66 3rd LOW PIVOT = 67.00 - 2 (70.00 - 68.33) = 63.66
WEEKLY PIVOT = 72.65 + 67.89 + 68.40 1 3 = 69.65*
1st HIGH PIVOT = 69.65 + (69.65 - 67.89) = 71.41 1st LOW PIVOT = 69.65 - (72.65 - 69.65) = 66.65#
2nd HIGH PIVOT = 69.65 + 2 (69.65 - 67.89) = 73.17 2nd LOW PIVOT = 69.65 - 2 (72.65 - 69.65) = 63.65
3rd HIGH PIVOT = 72.65 + 2 (69.65 - 67.89) = 76.17 3rd LOW PIVOT = 67.89 - 2 (72.65 - 69.55) = 61.89
MONTHLY PIVOT = 78.01 + 73.00 + 77.99 1 3 = 76.33
1st HIGH PIVOT = 76.33 + (76.33 - 73.00) = 79.66 1st LOW PIVOT = 76.33 - (78.01 - 76.33) = 74.65
ZndHIGHPIVOT=76.33+2(76.33-73.00) =82.99 2nd LOW PIVOT = 76.33 - 2 (78.01 - 76.33) = 72.97
3rd HIGH PIVOT = 78.01 + 2 (76.33 - 73.00) = 81.34 3rd LOW PIVOT = 73.00 - 2 (78.01 - 76.33) = 69.64"
* = price resistance in area of 69.65 # = price support in the area 66.65

HIGH/LOW LINES
Many well known traders have used the concept of line analysis in the past. From past generations these would include W. D. Gann, George Marechal, Alan Andrews, and Roger Babson, and more recentIy Charles Drurnmond. While the concepts introduced here share a basic similarity with the work of all of the aforementioned traders, the methodologies that follow are distinctly different. These methodologies represent what I have found to be the best representation of geometric order in markets.
The lines which will be illustrated will be referred to as HighLLow Lines. This is simply because they are all constructed using only the highs and lows of the last two bars on any chart. They project potential short terrr~ geometric order in the markets. The High/ Low Lines will not always be meaningful. This is because the market is not always trading in an order that we can discern and quantify only using a straight line. Therefore, HigWLow Lines are best used in conjunction with other s~lpport and resistance techniques. '-'
HH & LL (High to High and Low to Low)
These lines are constructed simply by joining the highs of the last two bars and extending the lines into the future by one bar. This is a basic trendline. (A chart example is on the page following this section.) Mathematically this would be expressed as:
HH = (High Today - High Yesterday) t High Today
LL = (Low Today - Low Yesterday) + Low Today
HL & LH (High to Low and Low to High)
Constructed by joining high to low and low to high of the last two bars and extending the lines into the future. Mathematically this would be expressed as:
HL = (High Today - Low Yesterday) + High Today
LH = (Low Today - High Yesterday) + Low Today
HHP & LLP (High to High Parallel and Low to Low Parallel)
The HHP is constructed by drawing a line off of the low, parallel to the HH line. The LLP is constructed by drawing a line off of the high, parallel to the LL line. Mathemati- cally expressed as:
HHP = (High Today - High Yesterday) + Low Today LLP = (Low Today - Low Yesterday) + High Today
HHPI & LLPI (High to High parallel Inverted and Low to Low Parallel Inverted)
These lines, as the name implies, are simply drawn inverted to the HHP and LLP lines. Hence if the HHP slopes up off of the low, the HHPI will slope down from the low by the same amount. Mathematically expressed as:
HHPI = (High Taday - High Yesterday) - Low Today LLPI = (Low Today - Low Yesterday) - High Today
HOW TO USE HIGHlLOW LINES
In using weekly and monthly lines be sure touse constant contracts. That is, you always do calculations using the same contract month. This way the lines will not be skewed by the rollover between contracts.
Any Hl/Lo Line can act as both support and resistance to prices. The first time price approaches a price level indicated by a H i b o line, it is slightly more significant than subsequent attempts at the same price level. However, when using the weekly and monthly lines, remember that they are valid until the week or month is over, and a new line is calculated. This holds true no matter how many penetrations and repenetrations may occur.
The integration of time frames is an important attribute of Highbow lines. You should calculate the numbers for each of daily, weekly, and monthly bar charts. This will provide you with more ammunition in the quest for finding a confluence of support or resistance points using different techniques over different time frames. This conflu- ence in turn translates into a high probability trading opportunity.
H i g U o w lines could create quite a cluttered lmking chart if you attempted to draw them all graphically. It is far easier and cleaner to simply calculate the values where the lines are coming in. There are some tool box software packages with formula builders where inputting the formulas for the Highbow lines and the Pivot Points should be a reasonably simple endeavor.
EL
P
Id
- 3
CD

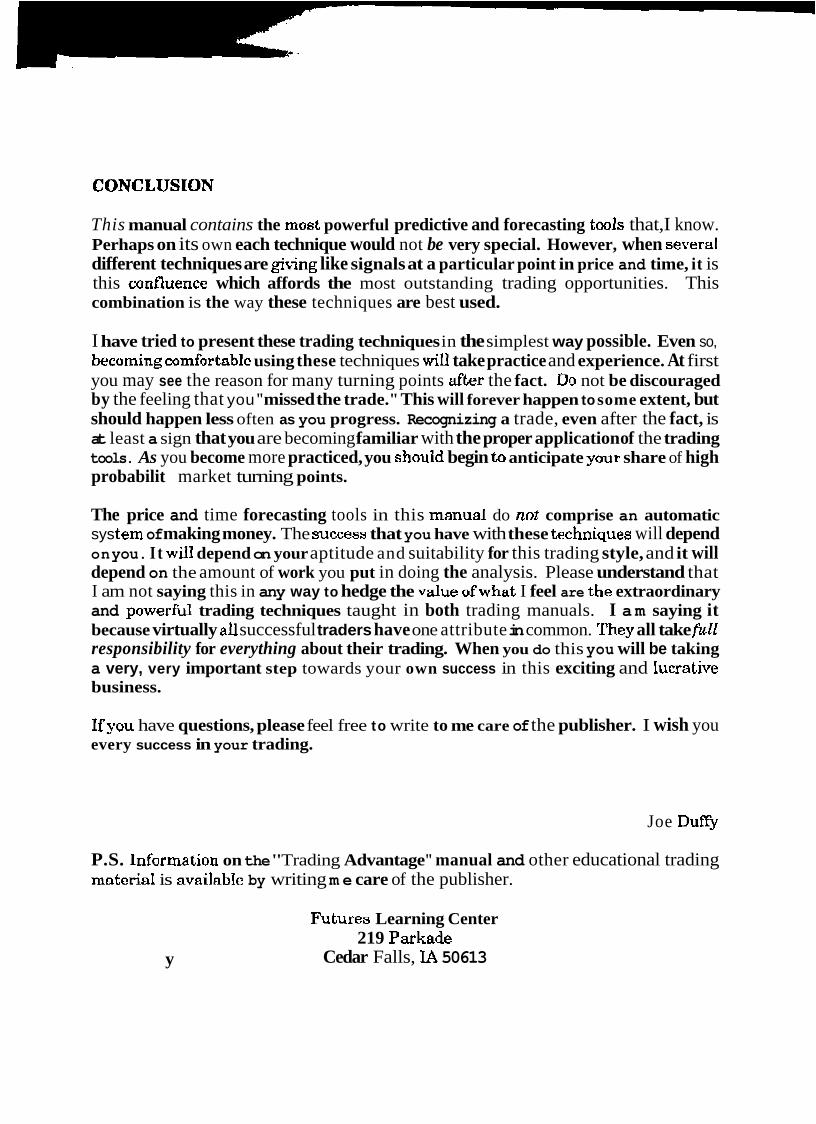
This manual contains the rnost powerful predictive and forecasting taols that, I know. Perhaps on its own each technique would not be very special. However, when several different techniques are giving like signals at a particular point in price and time, it is this confluence which affords the most outstanding trading opportunities. This combination is the way these techniques are best used.
I have tried to present these trading techniques in the simplest way possible. Even so, becoming comfortable using these techniques will take practice and experience. At first you may see the reason for many turning points after the fact. Uo not be discouraged by the feeling that you "missed the trade." This will forever happen to some extent, but should happen less often as you progress. Recognizing a trade, even after the fact, is at least a sign that you are becoming familiar with the proper application of the trading tools. As you become more practiced, you should begin to anticipate your share of high probabilit
y
market turning points.
The price and time forecasting tools in this manual do not comprise an automatic sys tern of making money. The success that you have with these t~chniques will depend on you. I t will depend on your aptitude and suitability for this trading style, and it will depend on the amount of work you put in doing the analysis. Please understand that I am not saying this in any way to hedge the v d u e ofwhat I feel are the extraordinary and powerhl trading techniques taught in both trading manuals. I am saying it because virtually all successful traders have one attribute in common. They all take f i l l responsibility for everything about their trading. When you do this you will be taking a very, very important step towards your own success in this exciting and Iucrative business.
Ifyou have questions, please feel free to write to me care of the publisher. I wish you every success in your trading.
Joe Duffy
P.S. lnforrnation on the "Trading Advantage" manual and other educational trading material is avai1abIe by writing m e care of the publisher.
Futurea Learning Center 219 Parkade
Cedar Falls, IA 50613

INTRODUCTION
The Fibonacci Time Spiral technique is based on the principle of a series of expanding Fibonacci relationships between turning points in the market. In order that even those completely unfamiliar with Fibonacci can completely understand this concept we will start with a review of the basics.
The Fibonacci or Golden Section Ratio simply refers to the division of space in a ratio of ,618 and .382. See the illustrations below.
In the above diagrams one can calculate point C , given points A and B. As well one can calculate point 2, given points X and Y. To do this you need only know the multipliers which produce a Fibonacci division. These multipliers are;
and
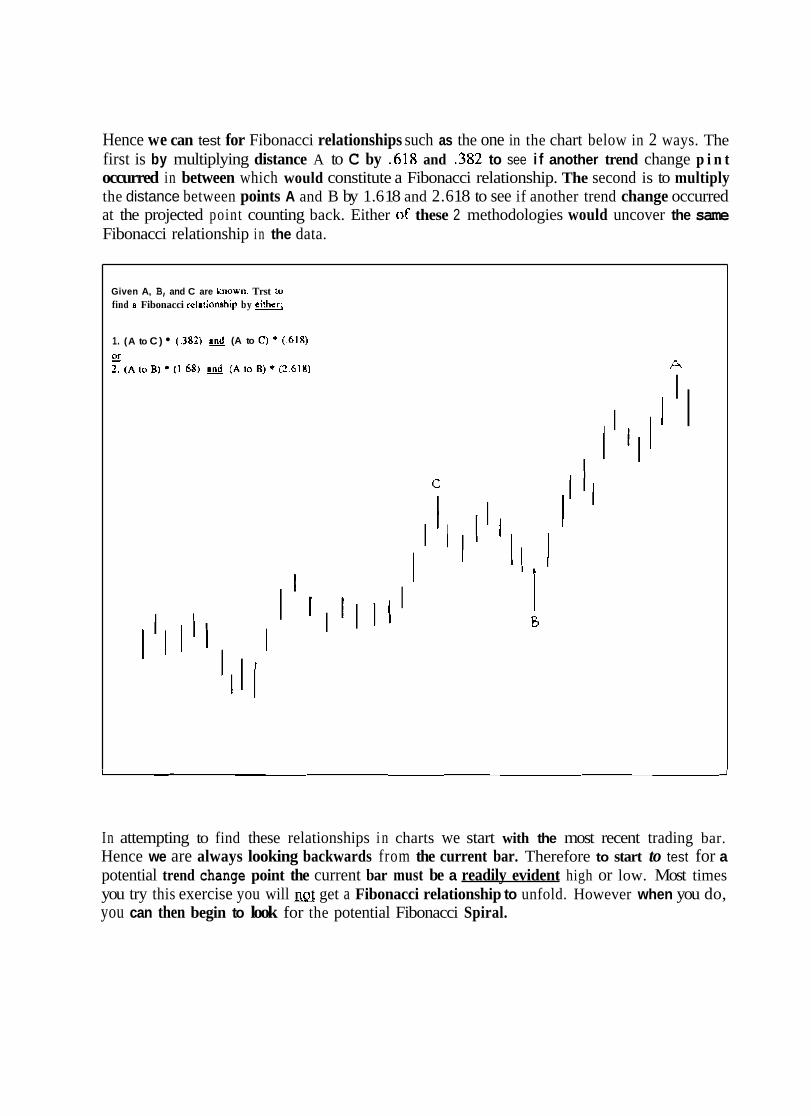
Hence we can test for Fibonacci relationships such as the one in the chart below in 2 ways. The first is by multiplying distance A to C by .618 and ,382 to see i f another trend change p i n t occurred in between which would constitute a Fibonacci relationship. The second is to multiply the distance between points A and B by 1.6 18 and 2.6 18 to see if another trend change occurred at the projected point counting back. Either nf these 2 methodologies would uncover the same Fibonacci relationship i n the data.
Given A, B, and C are known. Trst tu
find e Fibonacci rcla~ionship by eithrr;
1. (A to C) (.382) (A to C) * (.blR)
or 2. (A to^)+(^ 68) snd (A IOB) * (261x1 e
I 1 I
C
I 0
In attempting to find these relationships in charts we start with the most recent trading bar. Hence we are always looking backwards from the current bar. Therefore to start to test for a potential trend change point the current bar must be a readily evident high or low. Most times you try this exercise you will Q get a Fibonacci relationship to unfold. However when you do, you can then begin to look for the potential Fibonacci Spiral.
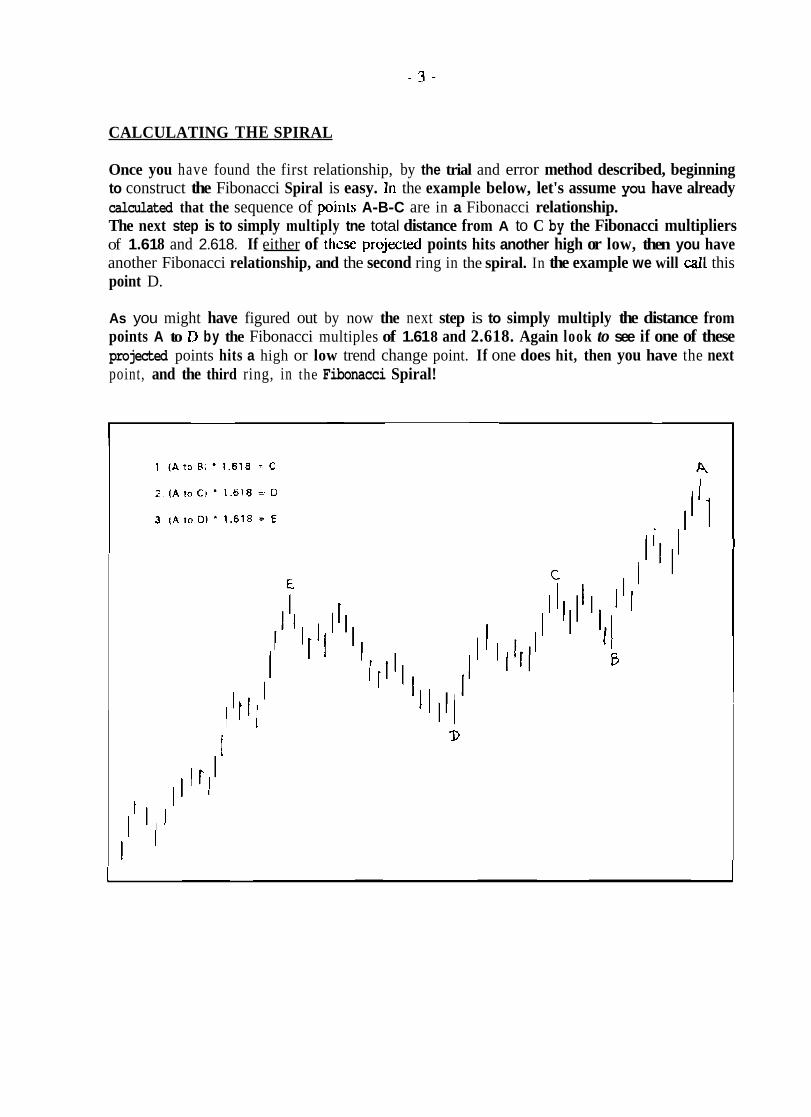
CALCULATING THE SPIRAL
Once you have found the first relationship, by the trial and error method described, beginning to construct the Fibonacci Spiral is easy. In the example below, let's assume you have already calculated that the sequence of points A-B-C are in a Fibonacci relationship. The next step is to simply multiply tne total distance from A to C by the Fibonacci multipliers of 1.61 8 and 2.618. If either of these project4 points hits another high or low, then you have another Fibonacci relationship, and the second ring in the spiral. In the example we will call this point D.
As you might have figured out by now the next step is to simply multiply the distance from points A to l) by the Fibonacci multiples of 1.61 8 and 2.618. Again look to see if one of these projected points hits a high or low trend change point. If one does hit, then you have the next point, and the third ring, in the Fibonacci Spiral!

The Fibonacci Spiral works on any time frame. On intraday charts allow a little more room for emor (2 or 3 bars). On daily and weekly charts plus or minus 1 day margin for error is usually good, but this may be expanded as the length of time gets greater. The charts following this text show a step by step progression of the Fibonacci Spiral in the daily T-Bond market.