Duff & Phelps - TMP · Duff & Phelps October 24, 2015 7 Channel Overview 2015 Avg. Subs (M)1 2015...
48
2016 Duff & Phelps YOUniversity Deal Challenge October 24, 2015
Transcript of Duff & Phelps - TMP · Duff & Phelps October 24, 2015 7 Channel Overview 2015 Avg. Subs (M)1 2015...

2016 Duff & Phelps
YOUniversity Deal Challenge
October 24, 2015

Table of Contents
1. Executive Summary
2. Background
3. Industry Information
4. Management Plan
Appendix A: Deliverables
Appendix B: Additional Information
Appendix C: Networks Level Details
Duff & Phelps 2 October 24, 2015

Executive Summary Section 1
Duff & Phelps 3
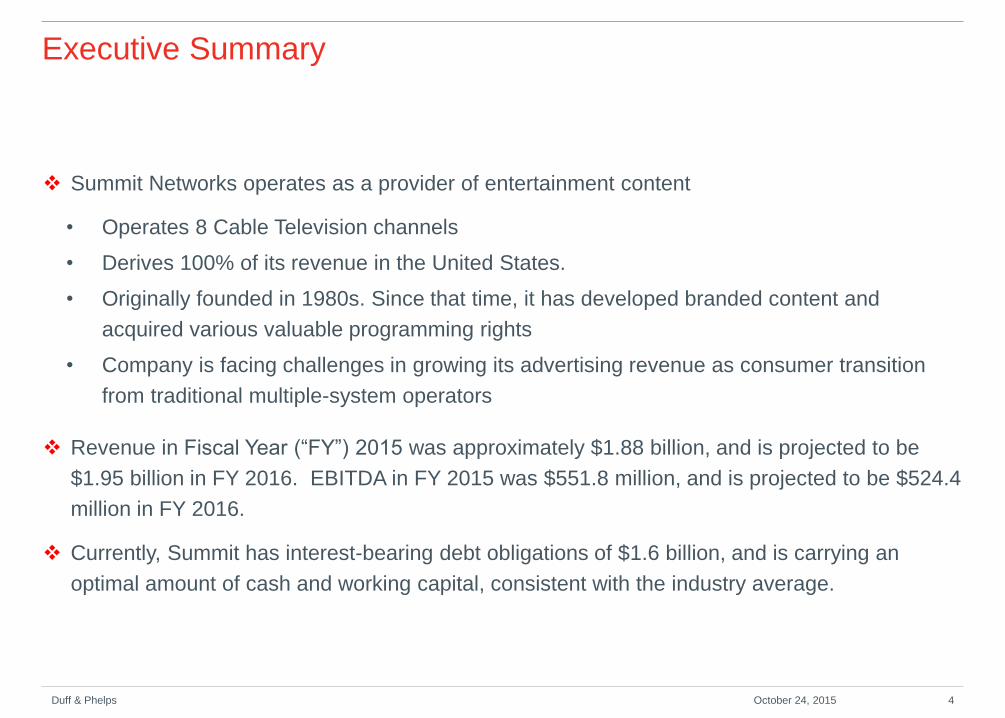
Executive Summary
Summit Networks operates as a provider of entertainment content
• Operates 8 Cable Television channels
• Derives 100% of its revenue in the United States.
• Originally founded in 1980s. Since that time, it has developed branded content and
acquired various valuable programming rights
• Company is facing challenges in growing its advertising revenue as consumer transition
from traditional multiple-system operators
Revenue in Fiscal Year (“FY”) 2015 was approximately $1.88 billion, and is projected to be
$1.95 billion in FY 2016. EBITDA in FY 2015 was $551.8 million, and is projected to be $524.4
million in FY 2016.
Currently, Summit has interest-bearing debt obligations of $1.6 billion, and is carrying an
optimal amount of cash and working capital, consistent with the industry average.
Duff & Phelps 4 October 24, 2015

Background Section 2
Duff & Phelps 5
Business Description
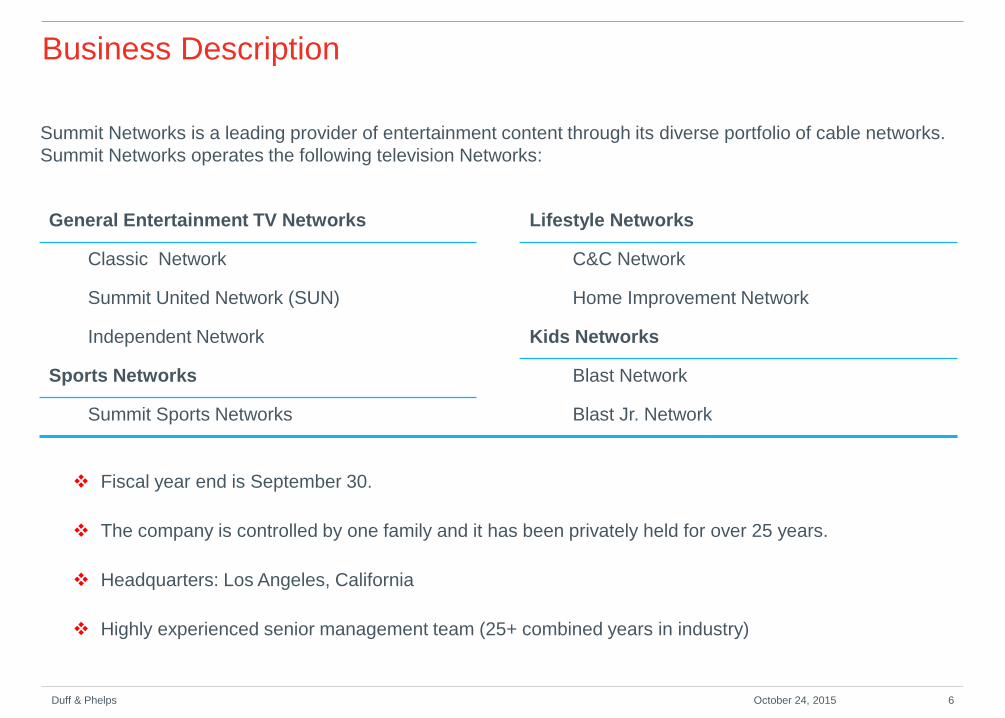
Summit Networks is a leading provider of entertainment content through its diverse portfolio of cable networks.
Summit Networks operates the following television Networks:
General Entertainment TV Networks Lifestyle Networks
Classic Network C&C Network
Summit United Network (SUN) Home Improvement Network
Independent Network Kids Networks
Sports Networks Blast Network
Summit Sports Networks Blast Jr. Network
Fiscal year end is September 30.
The company is controlled by one family and it has been privately held for over 25 years.
Headquarters: Los Angeles, California
Highly experienced senior management team (25+ combined years in industry)
Duff & Phelps 6 October 24, 2015
Duff & Phelps 7 October 24, 2015
Channel Overview 2015 Avg.
Subs (M)1
2015 Avg.
Affiliate Fee
per Sub/
Month
Major
Affiliate
Contracts
Expire
Description
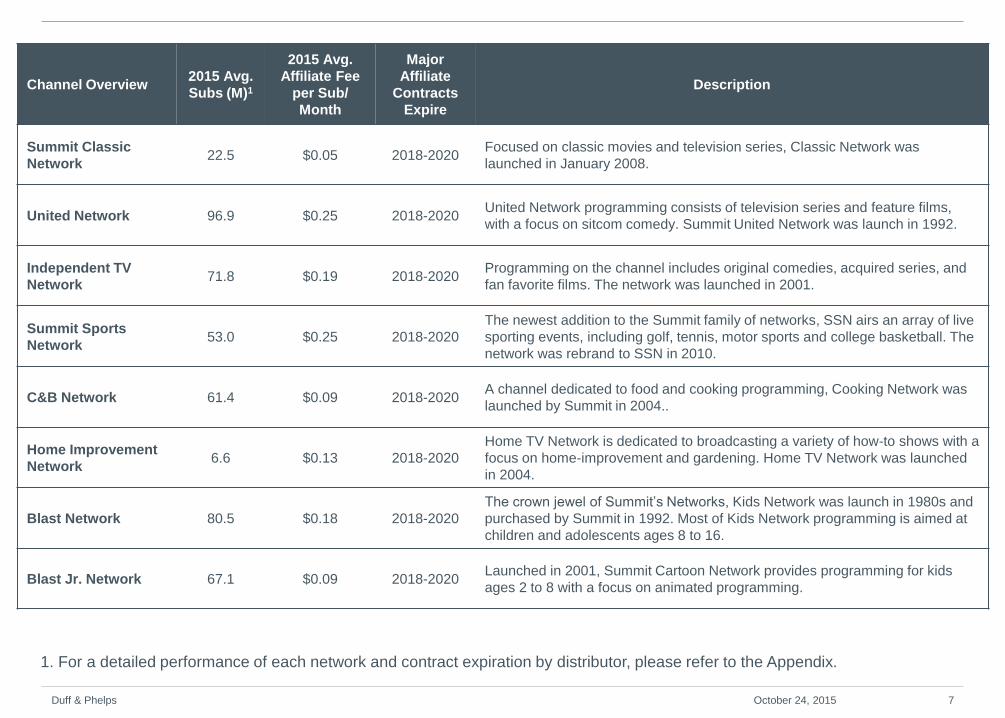
Summit Classic
Network 22.5 $0.05 2018-2020
Focused on classic movies and television series, Classic Network was
launched in January 2008.
United Network 96.9 $0.25 2018-2020 United Network programming consists of television series and feature films,
with a focus on sitcom comedy. Summit United Network was launch in 1992.
Independent TV
Network 71.8 $0.19 2018-2020
Programming on the channel includes original comedies, acquired series, and
fan favorite films. The network was launched in 2001.
Summit Sports
Network 53.0 $0.25 2018-2020
The newest addition to the Summit family of networks, SSN airs an array of live
sporting events, including golf, tennis, motor sports and college basketball. The
network was rebrand to SSN in 2010.
C&B Network 61.4 $0.09 2018-2020 A channel dedicated to food and cooking programming, Cooking Network was
launched by Summit in 2004..
Home Improvement
Network 6.6 $0.13 2018-2020
Home TV Network is dedicated to broadcasting a variety of how-to shows with a
focus on home-improvement and gardening. Home TV Network was launched
in 2004.
Blast Network 80.5 $0.18 2018-2020
The crown jewel of Summit’s Networks, Kids Network was launch in 1980s and
purchased by Summit in 1992. Most of Kids Network programming is aimed at
children and adolescents ages 8 to 16.
Blast Jr. Network 67.1 $0.09 2018-2020 Launched in 2001, Summit Cartoon Network provides programming for kids
ages 2 to 8 with a focus on animated programming.
1. For a detailed performance of each network and contract expiration by distributor, please refer to the Appendix.
Affiliate Fee vs. Subscribers
Duff & Phelps 8 October 24, 2015
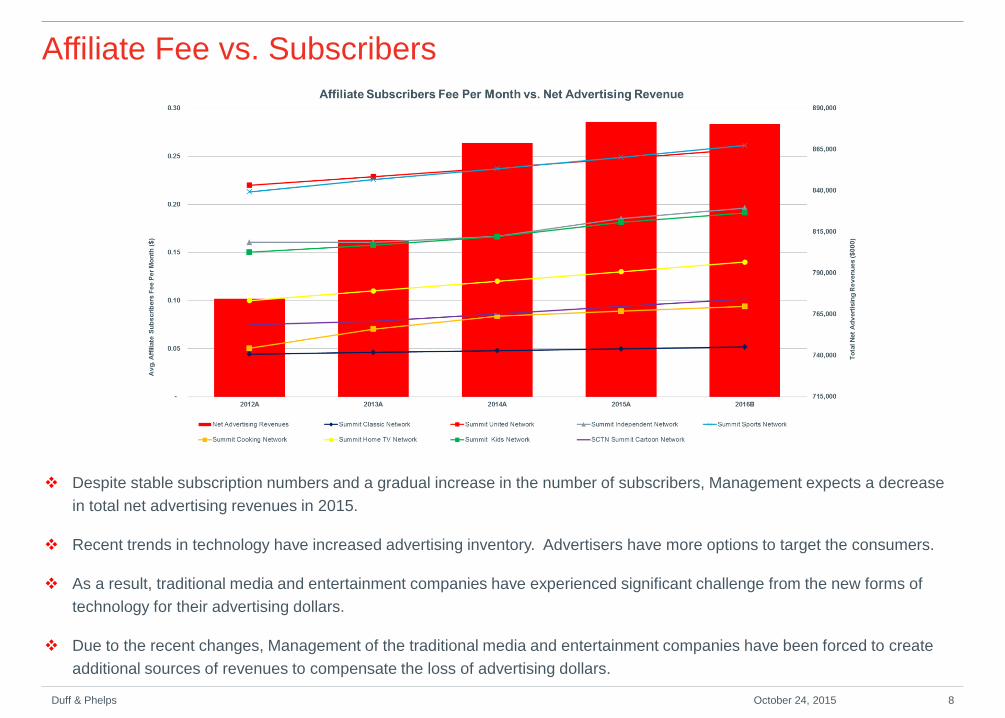
Despite stable subscription numbers and a gradual increase in the number of subscribers, Management expects a decrease
in total net advertising revenues in 2015.
Recent trends in technology have increased advertising inventory. Advertisers have more options to target the consumers.
As a result, traditional media and entertainment companies have experienced significant challenge from the new forms of
technology for their advertising dollars.
Due to the recent changes, Management of the traditional media and entertainment companies have been forced to create
additional sources of revenues to compensate the loss of advertising dollars.
A Market In turmoil
Duff & Phelps 9 October 24, 2015
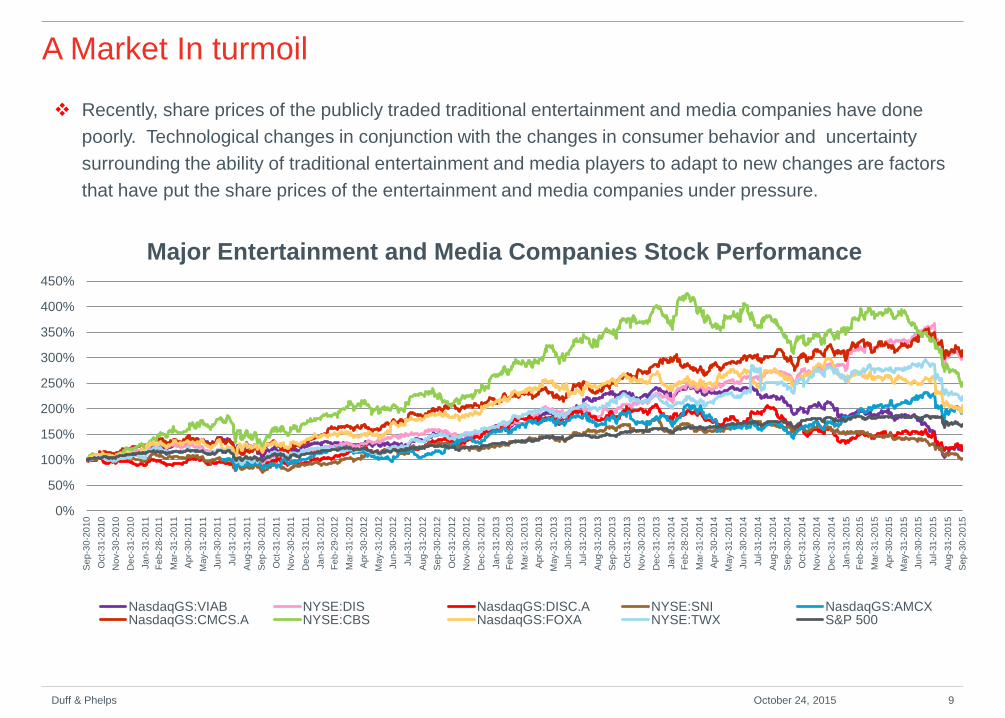
Recently, share prices of the publicly traded traditional entertainment and media companies have done
poorly. Technological changes in conjunction with the changes in consumer behavior and uncertainty
surrounding the ability of traditional entertainment and media players to adapt to new changes are factors
that have put the share prices of the entertainment and media companies under pressure.
0%
50%
100%
150%
200%
250%
300%
350%
400%
450%
Sep
-30-2
010
Oct-
31-2
01
0
No
v-3
0-2
01
0
De
c-3
1-2
01
0
Ja
n-3
1-2
011
Feb
-28
-201
1
Mar-
31
-201
1
Apr-
30-2
01
1
May-3
1-2
011
Ju
n-3
0-2
011
Ju
l-31
-201
1
Aug
-31-2
011
Sep
-30-2
011
Oct-
31-2
01
1
No
v-3
0-2
01
1
De
c-3
1-2
01
1
Ja
n-3
1-2
012
Feb
-29
-201
2
Mar-
31
-201
2
Apr-
30-2
01
2
May-3
1-2
012
Ju
n-3
0-2
012
Ju
l-31
-201
2
Aug
-31-2
012
Sep
-30-2
012
Oct-
31-2
01
2
No
v-3
0-2
01
2
De
c-3
1-2
01
2
Ja
n-3
1-2
013
Feb
-28
-201
3
Mar-
31
-201
3
Apr-
30-2
01
3
May-3
1-2
013
Ju
n-3
0-2
013
Ju
l-31
-201
3
Aug
-31-2
013
Sep
-30-2
013
Oct-
31-2
01
3
No
v-3
0-2
01
3
De
c-3
1-2
01
3
Ja
n-3
1-2
014
Feb
-28
-201
4
Mar-
31
-201
4
Apr-
30-2
01
4
May-3
1-2
014
Ju
n-3
0-2
014
Ju
l-31
-201
4
Aug
-31-2
014
Sep
-30-2
014
Oct-
31-2
01
4
No
v-3
0-2
01
4
De
c-3
1-2
01
4
Ja
n-3
1-2
015
Feb
-28
-201
5
Mar-
31
-201
5
Apr-
30-2
01
5
May-3
1-2
015
Ju
n-3
0-2
015
Ju
l-31
-201
5
Aug
-31-2
015
Sep
-30-2
015
Major Entertainment and Media Companies Stock Performance
NasdaqGS:VIAB NYSE:DIS NasdaqGS:DISC.A NYSE:SNI NasdaqGS:AMCXNasdaqGS:CMCS.A NYSE:CBS NasdaqGS:FOXA NYSE:TWX S&P 500
Historical Financial Information1
Duff & Phelps 10 October 24, 2015
Notes:
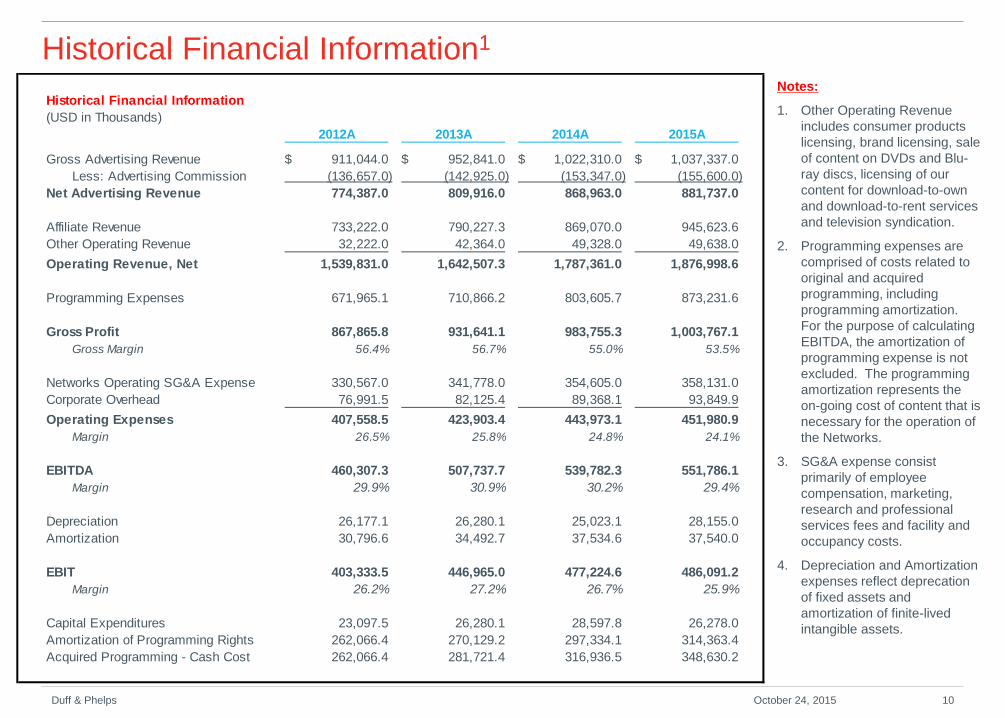
1. Other Operating Revenue
includes consumer products
licensing, brand licensing, sale
of content on DVDs and Blu-
ray discs, licensing of our
content for download-to-own
and download-to-rent services
and television syndication.
2. Programming expenses are
comprised of costs related to
original and acquired
programming, including
programming amortization.
For the purpose of calculating
EBITDA, the amortization of
programming expense is not
excluded. The programming
amortization represents the
on-going cost of content that is
necessary for the operation of
the Networks.
3. SG&A expense consist
primarily of employee
compensation, marketing,
research and professional
services fees and facility and
occupancy costs.
4. Depreciation and Amortization
expenses reflect deprecation
of fixed assets and
amortization of finite-lived
intangible assets.
Historical Financial Information
(USD in Thousands)
2012A 2013A 2014A 2015A
Gross Advertising Revenue 911,044.0$ 952,841.0$ 1,022,310.0$ 1,037,337.0$
Less: Advertising Commission (136,657.0) (142,925.0) (153,347.0) (155,600.0)
Net Advertising Revenue 774,387.0 809,916.0 868,963.0 881,737.0
Affiliate Revenue 733,222.0 790,227.3 869,070.0 945,623.6
Other Operating Revenue 32,222.0 42,364.0 49,328.0 49,638.0
Operating Revenue, Net 1,539,831.0 1,642,507.3 1,787,361.0 1,876,998.6
Programming Expenses 671,965.1 710,866.2 803,605.7 873,231.6
Gross Profit 867,865.8 931,641.1 983,755.3 1,003,767.1
Gross Margin 56.4% 56.7% 55.0% 53.5%
Networks Operating SG&A Expense 330,567.0 341,778.0 354,605.0 358,131.0
Corporate Overhead 76,991.5 82,125.4 89,368.1 93,849.9
Operating Expenses 407,558.5 423,903.4 443,973.1 451,980.9
Margin 26.5% 25.8% 24.8% 24.1%
EBITDA 460,307.3 507,737.7 539,782.3 551,786.1
Margin 29.9% 30.9% 30.2% 29.4%
Depreciation 26,177.1 26,280.1 25,023.1 28,155.0
Amortization 30,796.6 34,492.7 37,534.6 37,540.0
EBIT 403,333.5 446,965.0 477,224.6 486,091.2
Margin 26.2% 27.2% 26.7% 25.9%
Capital Expenditures 23,097.5 26,280.1 28,597.8 26,278.0
Amortization of Programming Rights 262,066.4 270,129.2 297,334.1 314,363.4
Acquired Programming - Cash Cost 262,066.4 281,721.4 316,936.5 348,630.2
Historical Financial Information
Duff & Phelps 11 October 24, 2015
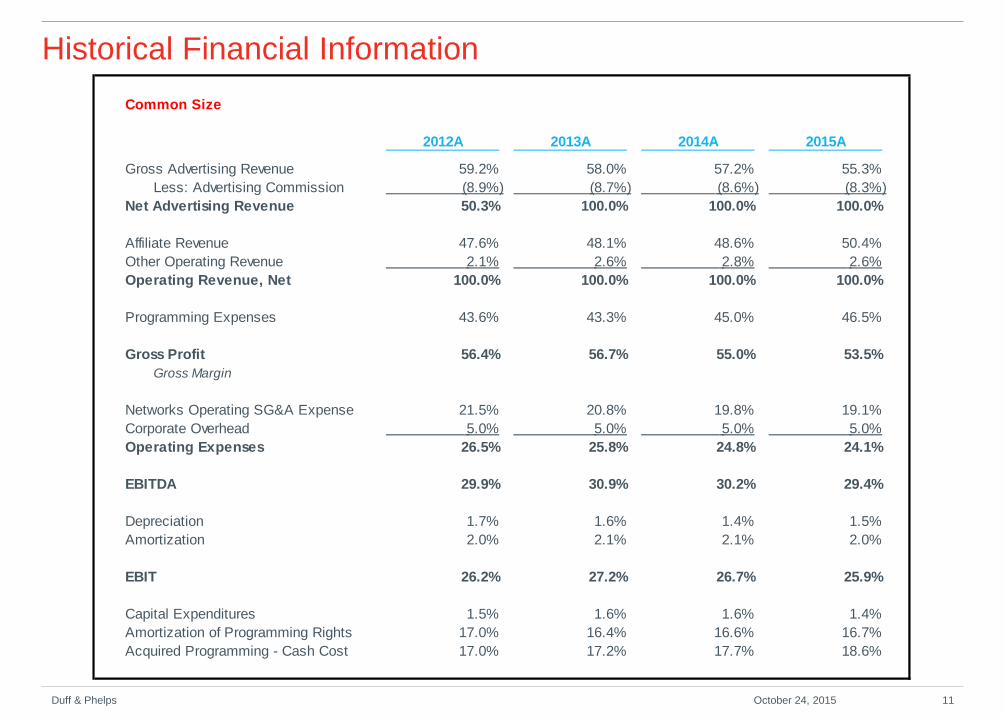
Common Size
2012A 2013A 2014A 2015A
Gross Advertising Revenue 59.2% 58.0% 57.2% 55.3%
Less: Advertising Commission (8.9%) (8.7%) (8.6%) (8.3%)
Net Advertising Revenue 50.3% 100.0% 100.0% 100.0%
Affiliate Revenue 47.6% 48.1% 48.6% 50.4%
Other Operating Revenue 2.1% 2.6% 2.8% 2.6%
Operating Revenue, Net 100.0% 100.0% 100.0% 100.0%
Programming Expenses 43.6% 43.3% 45.0% 46.5%
Gross Profit 56.4% 56.7% 55.0% 53.5%
Gross Margin
Networks Operating SG&A Expense 21.5% 20.8% 19.8% 19.1%
Corporate Overhead 5.0% 5.0% 5.0% 5.0%
Operating Expenses 26.5% 25.8% 24.8% 24.1%
EBITDA 29.9% 30.9% 30.2% 29.4%
Depreciation 1.7% 1.6% 1.4% 1.5%
Amortization 2.0% 2.1% 2.1% 2.0%
EBIT 26.2% 27.2% 26.7% 25.9%
Capital Expenditures 1.5% 1.6% 1.6% 1.4%
Amortization of Programming Rights 17.0% 16.4% 16.6% 16.7%
Acquired Programming - Cash Cost 17.0% 17.2% 17.7% 18.6%

Historical Financial Information
Duff & Phelps 12 October 24, 2015
Trend Analysis
2012A 2013A 2014A 2015A
Gross Advertising Revenue 10.0% 4.6% 7.3% 1.5%
Less: Advertising Commission 10.0% 4.6% 7.3% 1.5%
Net Advertising Revenue 10.0% 4.6% 7.3% 1.5%
Affiliate Revenue 6.0% 7.8% 10.0% 8.8%
Other Operating Revenue 61.0% 31.5% 16.4% 0.6%
Operating Revenue, Net 5.9% 6.7% 8.8% 5.0%
Programming Expenses 5.0% 5.8% 13.0% 8.7%
Gross Profit 6.6% 7.3% 5.6% 2.0%
Networks Operating SG&A Expense 5.9% 3.4% 3.8% 1.0%
Corporate Overhead 5.9% 6.7% 8.8% 5.0%
Operating Expenses 5.9% 4.0% 4.7% 1.8%
EBITDA 7.2% 10.3% 6.3% 2.2%
Depreciation 5.9% 0.4% (4.8%) 12.5%
Amortization 5.9% 12.0% 8.8% 0.0%
EBIT 7.4% 10.8% 6.8% 1.9%
Capital Expenditures 5.9% 13.8% 8.8% (8.1%)
Amortization of Programming Rights 2.4% 3.1% 10.1% 5.7%
Acquired Programming - Cash Cost 2.4% 7.5% 12.5% 10.0%

Industry Information Section 3
Duff & Phelps 13
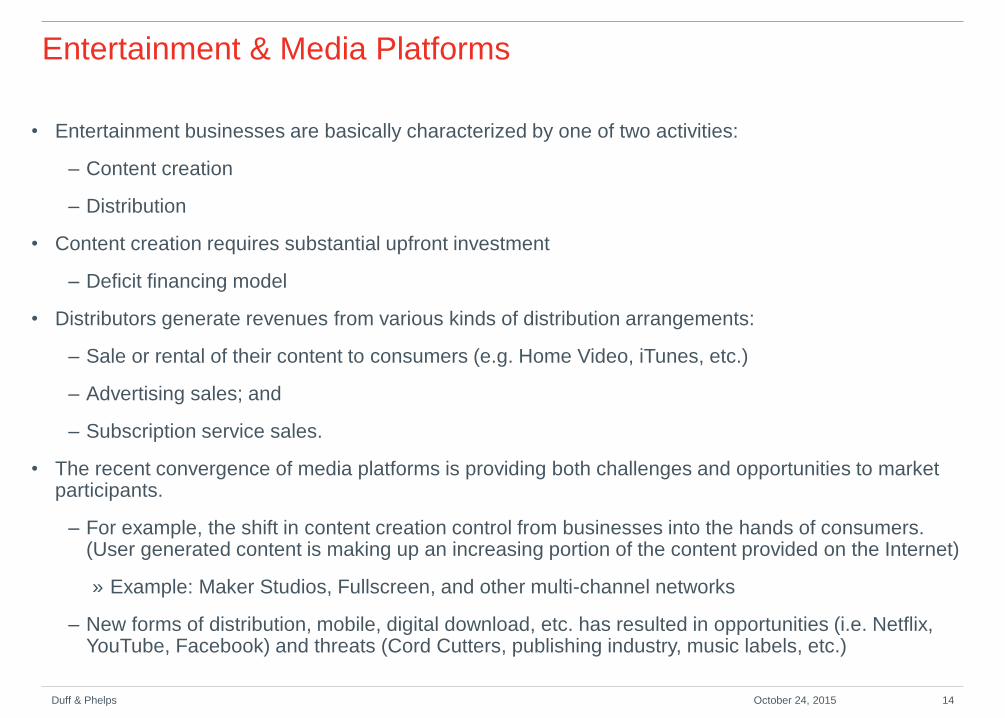
• Entertainment businesses are basically characterized by one of two activities:
– Content creation
– Distribution
• Content creation requires substantial upfront investment
– Deficit financing model
• Distributors generate revenues from various kinds of distribution arrangements:
– Sale or rental of their content to consumers (e.g. Home Video, iTunes, etc.)
– Advertising sales; and
– Subscription service sales.
• The recent convergence of media platforms is providing both challenges and opportunities to market participants.
– For example, the shift in content creation control from businesses into the hands of consumers. (User generated content is making up an increasing portion of the content provided on the Internet)
» Example: Maker Studios, Fullscreen, and other multi-channel networks
– New forms of distribution, mobile, digital download, etc. has resulted in opportunities (i.e. Netflix, YouTube, Facebook) and threats (Cord Cutters, publishing industry, music labels, etc.)
Entertainment & Media Platforms
Duff & Phelps 14 October 24, 2015
Television Industry Overview
Duff & Phelps 15 October 24, 2015
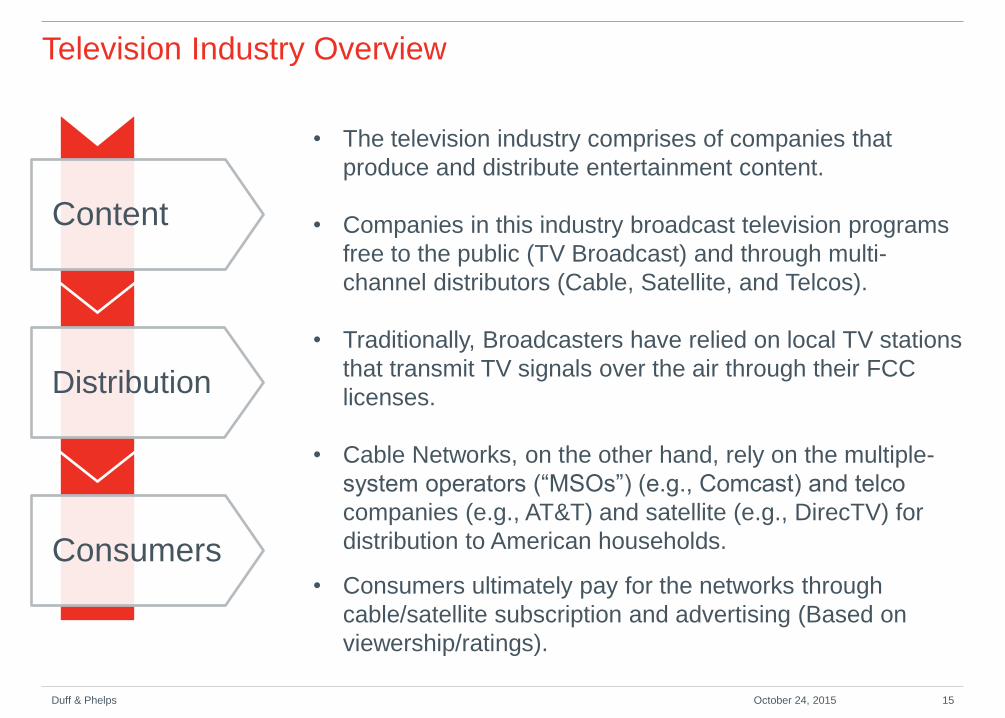
• The television industry comprises of companies that
produce and distribute entertainment content.
• Companies in this industry broadcast television programs
free to the public (TV Broadcast) and through multi-
channel distributors (Cable, Satellite, and Telcos).
• Traditionally, Broadcasters have relied on local TV stations
that transmit TV signals over the air through their FCC
licenses.
• Cable Networks, on the other hand, rely on the multiple-
system operators (“MSOs”) (e.g., Comcast) and telco
companies (e.g., AT&T) and satellite (e.g., DirecTV) for
distribution to American households.
• Consumers ultimately pay for the networks through
cable/satellite subscription and advertising (Based on
viewership/ratings).
Content
Distribution
Consumers
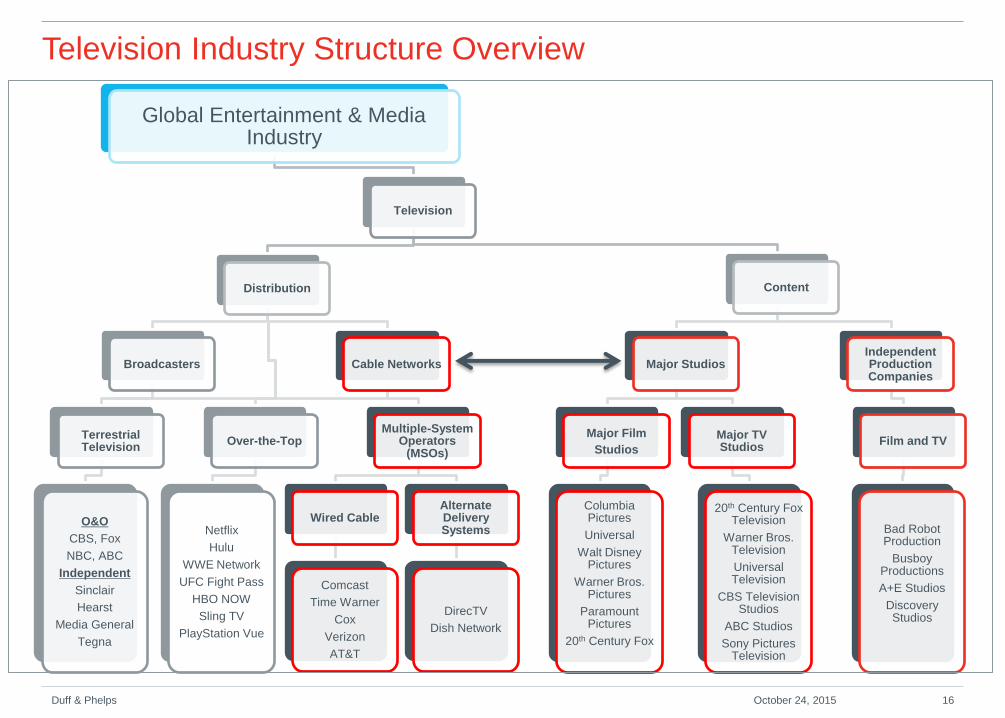
Television Industry Structure Overview
Global Entertainment & Media Industry
Television
Content
Major Studios
Major Film
Studios
Columbia Pictures
Universal
Walt Disney Pictures
Warner Bros. Pictures
Paramount Pictures
20th Century Fox
Major TV Studios
20th Century Fox Television
Warner Bros. Television
Universal Television
CBS Television Studios
ABC Studios
Sony Pictures Television
Independent Production Companies
Film and TV
Bad Robot Production
Busboy Productions
A+E Studios
Discovery Studios
Distribution
Broadcasters
Terrestrial Television
O&O
CBS, Fox
NBC, ABC
Independent
Sinclair
Hearst
Media General
Tegna
Cable Networks
Over-the-Top
Netflix
Hulu
WWE Network
UFC Fight Pass
HBO NOW
Sling TV
PlayStation Vue
Multiple-System Operators
(MSOs)
Wired Cable
Comcast
Time Warner
Cox
Verizon
AT&T
Alternate Delivery Systems
DirecTV
Dish Network
Duff & Phelps 16 October 24, 2015
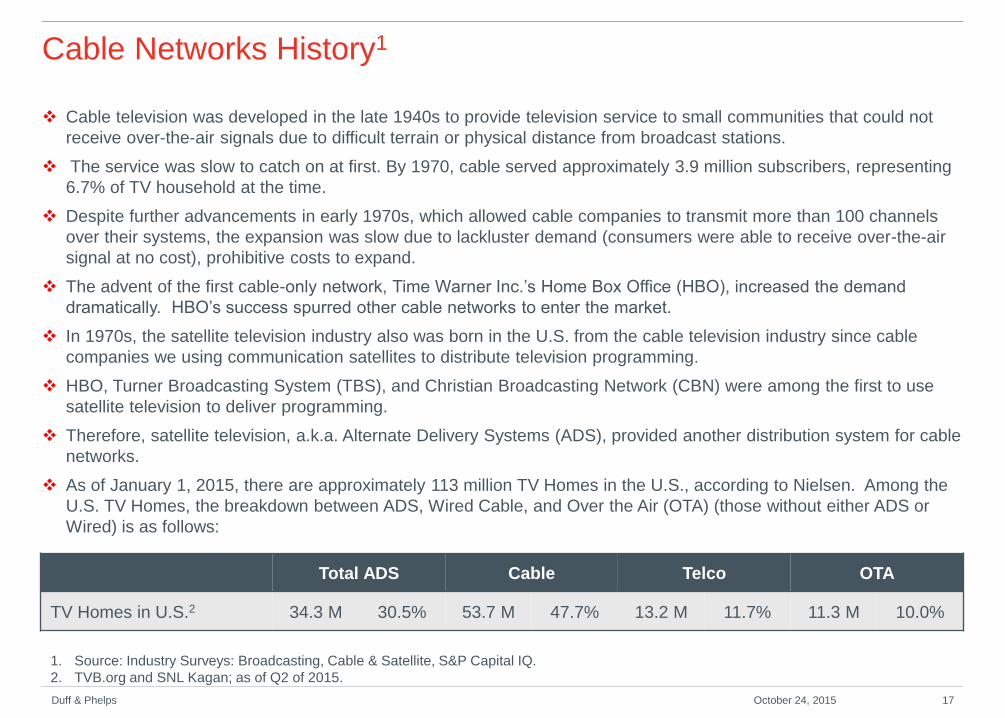
Cable Networks History1
Cable television was developed in the late 1940s to provide television service to small communities that could not
receive over-the-air signals due to difficult terrain or physical distance from broadcast stations.
The service was slow to catch on at first. By 1970, cable served approximately 3.9 million subscribers, representing
6.7% of TV household at the time.
Despite further advancements in early 1970s, which allowed cable companies to transmit more than 100 channels
over their systems, the expansion was slow due to lackluster demand (consumers were able to receive over-the-air
signal at no cost), prohibitive costs to expand.
The advent of the first cable-only network, Time Warner Inc.’s Home Box Office (HBO), increased the demand
dramatically. HBO’s success spurred other cable networks to enter the market.
In 1970s, the satellite television industry also was born in the U.S. from the cable television industry since cable
companies we using communication satellites to distribute television programming.
HBO, Turner Broadcasting System (TBS), and Christian Broadcasting Network (CBN) were among the first to use
satellite television to deliver programming.
Therefore, satellite television, a.k.a. Alternate Delivery Systems (ADS), provided another distribution system for cable
networks.
As of January 1, 2015, there are approximately 113 million TV Homes in the U.S., according to Nielsen. Among the
U.S. TV Homes, the breakdown between ADS, Wired Cable, and Over the Air (OTA) (those without either ADS or
Wired) is as follows:
1. Source: Industry Surveys: Broadcasting, Cable & Satellite, S&P Capital IQ.
2. TVB.org and SNL Kagan; as of Q2 of 2015.
Total ADS Cable Telco OTA
TV Homes in U.S.2 34.3 M 30.5% 53.7 M 47.7% 13.2 M 11.7% 11.3 M 10.0%
Duff & Phelps 17 October 24, 2015
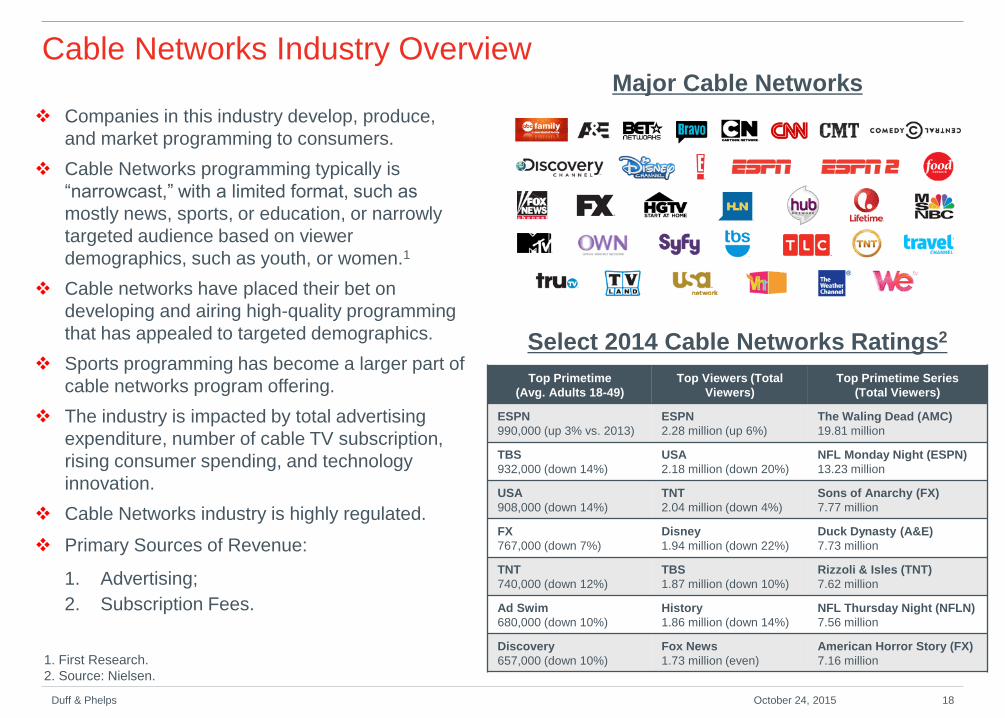
Cable Networks Industry Overview Major Cable Networks
Select 2014 Cable Networks Ratings2
Companies in this industry develop, produce,
and market programming to consumers.
Cable Networks programming typically is
“narrowcast,” with a limited format, such as
mostly news, sports, or education, or narrowly
targeted audience based on viewer
demographics, such as youth, or women.1
Cable networks have placed their bet on
developing and airing high-quality programming
that has appealed to targeted demographics.
Sports programming has become a larger part of
cable networks program offering.
The industry is impacted by total advertising
expenditure, number of cable TV subscription,
rising consumer spending, and technology
innovation.
Cable Networks industry is highly regulated.
Primary Sources of Revenue:
1. Advertising;
2. Subscription Fees.
Top Primetime
(Avg. Adults 18-49)
Top Viewers (Total
Viewers)
Top Primetime Series
(Total Viewers)
ESPN
990,000 (up 3% vs. 2013)
ESPN
2.28 million (up 6%)
The Waling Dead (AMC)
19.81 million
TBS
932,000 (down 14%)
USA
2.18 million (down 20%)
NFL Monday Night (ESPN)
13.23 million
USA
908,000 (down 14%)
TNT
2.04 million (down 4%)
Sons of Anarchy (FX)
7.77 million
FX
767,000 (down 7%)
Disney
1.94 million (down 22%)
Duck Dynasty (A&E)
7.73 million
TNT
740,000 (down 12%)
TBS
1.87 million (down 10%)
Rizzoli & Isles (TNT)
7.62 million
Ad Swim
680,000 (down 10%)
History
1.86 million (down 14%)
NFL Thursday Night (NFLN)
7.56 million
Discovery
657,000 (down 10%)
Fox News
1.73 million (even)
American Horror Story (FX)
7.16 million 1. First Research.
2. Source: Nielsen.
Duff & Phelps 18 October 24, 2015
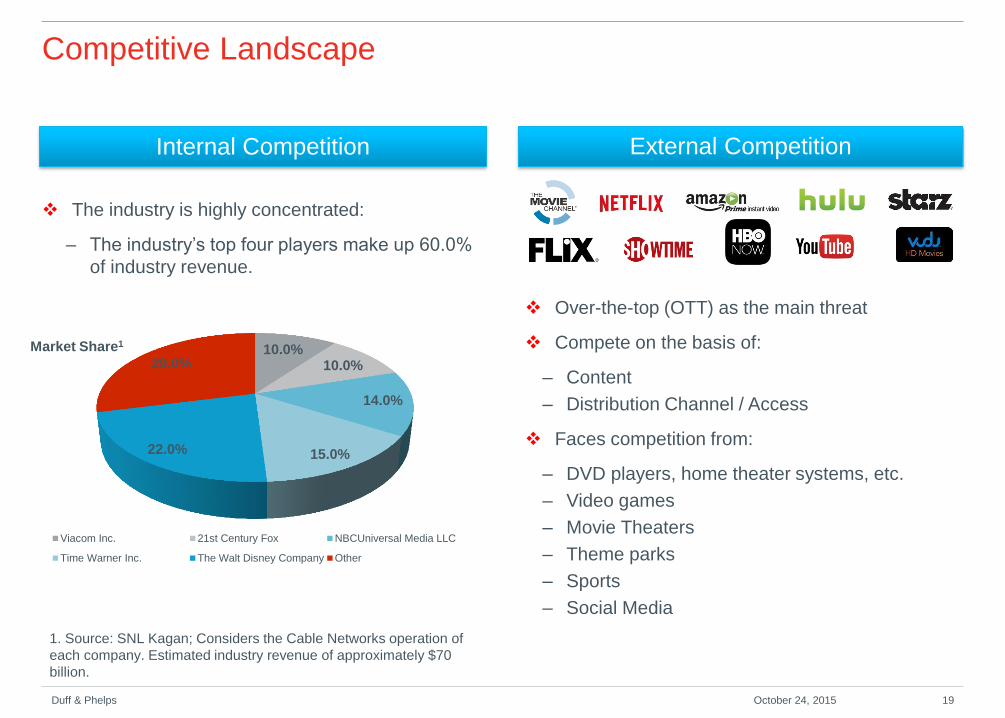
Competitive Landscape
The industry is highly concentrated:
– The industry’s top four players make up 60.0%
of industry revenue.
Duff & Phelps 19 October 24, 2015
External Competition Internal Competition
10.0% 10.0%
14.0%
15.0% 22.0%
29.0%
Market Share1
Viacom Inc. 21st Century Fox NBCUniversal Media LLC
Time Warner Inc. The Walt Disney Company Other
Over-the-top (OTT) as the main threat
Compete on the basis of:
– Content
– Distribution Channel / Access
Faces competition from:
– DVD players, home theater systems, etc.
– Video games
– Movie Theaters
– Theme parks
– Sports
– Social Media
1. Source: SNL Kagan; Considers the Cable Networks operation of
each company. Estimated industry revenue of approximately $70
billion.
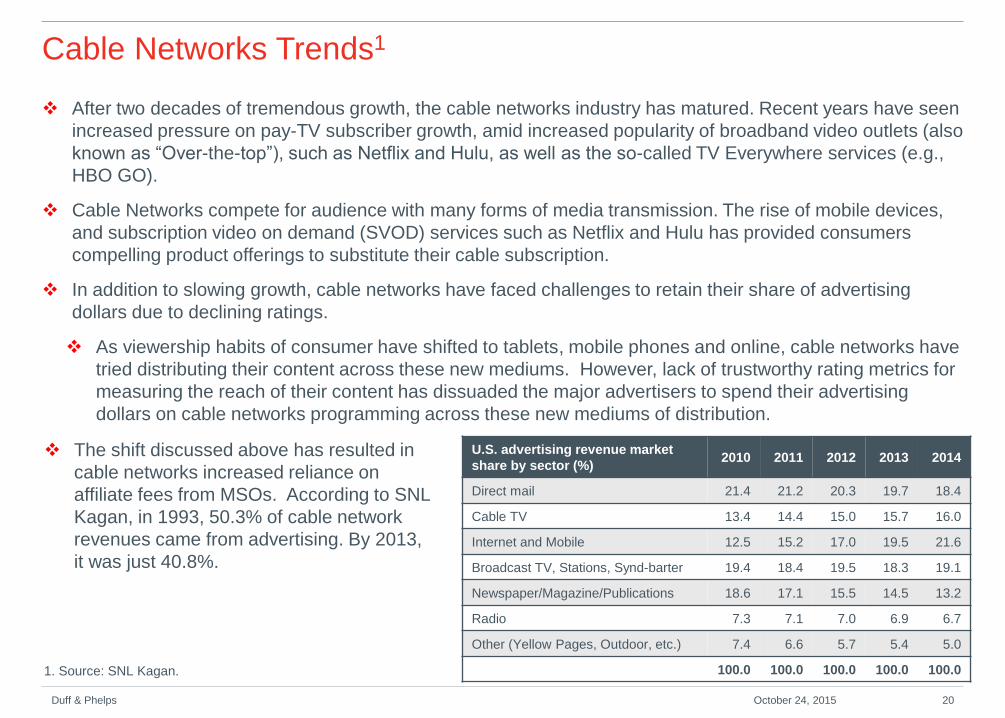
Cable Networks Trends1
After two decades of tremendous growth, the cable networks industry has matured. Recent years have seen
increased pressure on pay-TV subscriber growth, amid increased popularity of broadband video outlets (also
known as “Over-the-top”), such as Netflix and Hulu, as well as the so-called TV Everywhere services (e.g.,
HBO GO).
Cable Networks compete for audience with many forms of media transmission. The rise of mobile devices,
and subscription video on demand (SVOD) services such as Netflix and Hulu has provided consumers
compelling product offerings to substitute their cable subscription.
In addition to slowing growth, cable networks have faced challenges to retain their share of advertising
dollars due to declining ratings.
As viewership habits of consumer have shifted to tablets, mobile phones and online, cable networks have
tried distributing their content across these new mediums. However, lack of trustworthy rating metrics for
measuring the reach of their content has dissuaded the major advertisers to spend their advertising
dollars on cable networks programming across these new mediums of distribution.
Duff & Phelps 20 October 24, 2015
1. Source: SNL Kagan.
U.S. advertising revenue market
share by sector (%) 2010 2011 2012 2013 2014
Direct mail 21.4 21.2 20.3 19.7 18.4
Cable TV 13.4 14.4 15.0 15.7 16.0
Internet and Mobile 12.5 15.2 17.0 19.5 21.6
Broadcast TV, Stations, Synd-barter 19.4 18.4 19.5 18.3 19.1
Newspaper/Magazine/Publications 18.6 17.1 15.5 14.5 13.2
Radio 7.3 7.1 7.0 6.9 6.7
Other (Yellow Pages, Outdoor, etc.) 7.4 6.6 5.7 5.4 5.0
100.0 100.0 100.0 100.0 100.0
The shift discussed above has resulted in
cable networks increased reliance on
affiliate fees from MSOs. According to SNL
Kagan, in 1993, 50.3% of cable network
revenues came from advertising. By 2013,
it was just 40.8%.
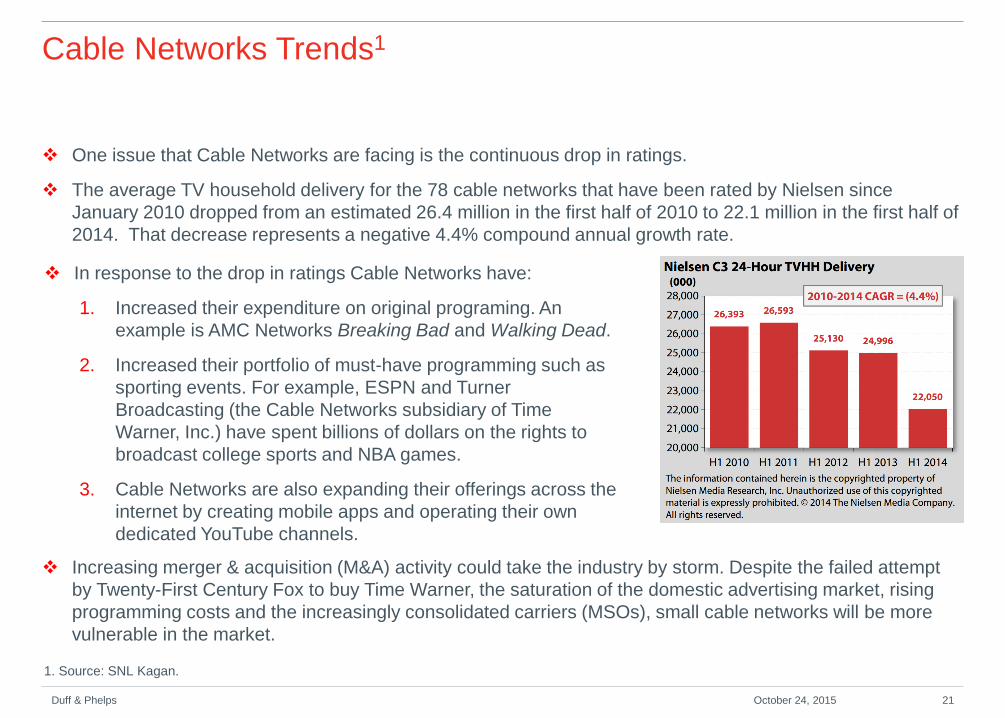
Cable Networks Trends1
Duff & Phelps 21 October 24, 2015
1. Source: SNL Kagan.
One issue that Cable Networks are facing is the continuous drop in ratings.
The average TV household delivery for the 78 cable networks that have been rated by Nielsen since
January 2010 dropped from an estimated 26.4 million in the first half of 2010 to 22.1 million in the first half of
2014. That decrease represents a negative 4.4% compound annual growth rate.
Increasing merger & acquisition (M&A) activity could take the industry by storm. Despite the failed attempt
by Twenty-First Century Fox to buy Time Warner, the saturation of the domestic advertising market, rising
programming costs and the increasingly consolidated carriers (MSOs), small cable networks will be more
vulnerable in the market.
In response to the drop in ratings Cable Networks have:
1. Increased their expenditure on original programing. An
example is AMC Networks Breaking Bad and Walking Dead.
2. Increased their portfolio of must-have programming such as
sporting events. For example, ESPN and Turner
Broadcasting (the Cable Networks subsidiary of Time
Warner, Inc.) have spent billions of dollars on the rights to
broadcast college sports and NBA games.
3. Cable Networks are also expanding their offerings across the
internet by creating mobile apps and operating their own
dedicated YouTube channels.
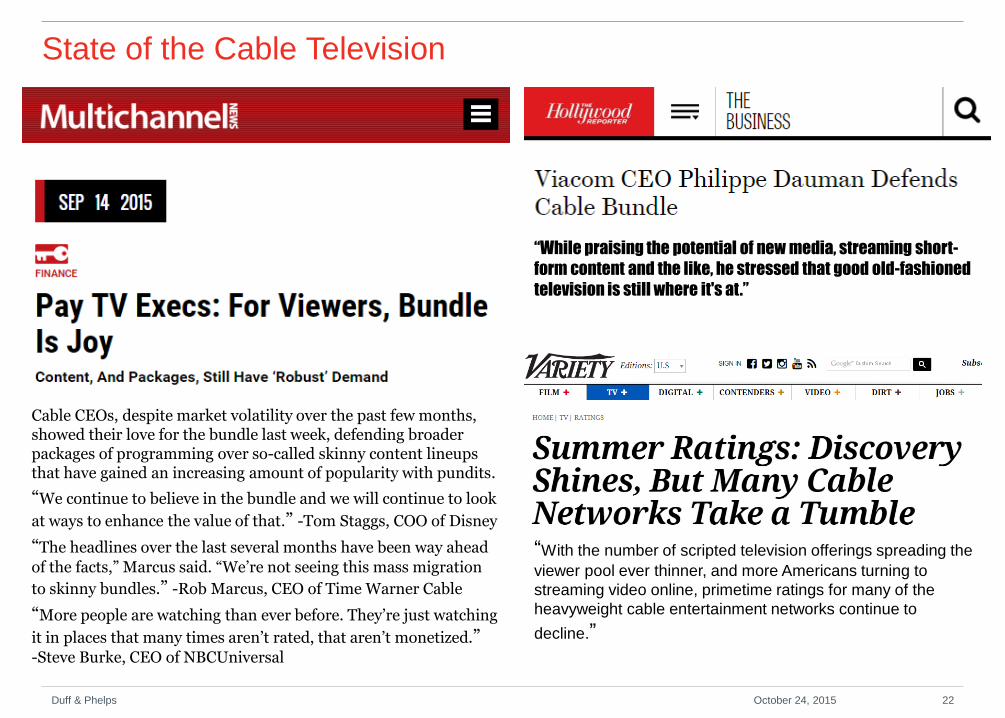
State of the Cable Television
Duff & Phelps 22 October 24, 2015
“While praising the potential of new media, streaming short-
form content and the like, he stressed that good old-fashioned
television is still where it's at.”
“With the number of scripted television offerings spreading the
viewer pool ever thinner, and more Americans turning to
streaming video online, primetime ratings for many of the
heavyweight cable entertainment networks continue to
decline.”
Cable CEOs, despite market volatility over the past few months, showed their love for the bundle last week, defending broader packages of programming over so-called skinny content lineups that have gained an increasing amount of popularity with pundits.
“We continue to believe in the bundle and we will continue to look
at ways to enhance the value of that.” -Tom Staggs, COO of Disney
“The headlines over the last several months have been way ahead
of the facts,” Marcus said. “We’re not seeing this mass migration
to skinny bundles.” -Rob Marcus, CEO of Time Warner Cable
“More people are watching than ever before. They’re just watching
it in places that many times aren’t rated, that aren’t monetized.” -Steve Burke, CEO of NBCUniversal
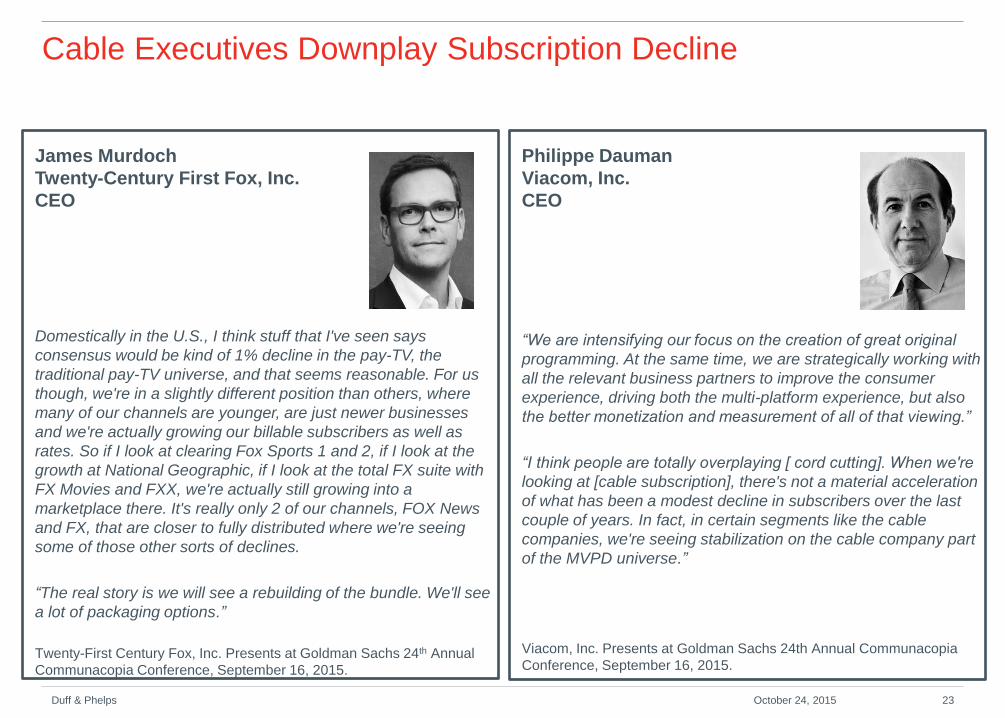
Philippe Dauman
Viacom, Inc.
CEO
“We are intensifying our focus on the creation of great original
programming. At the same time, we are strategically working with
all the relevant business partners to improve the consumer
experience, driving both the multi-platform experience, but also
the better monetization and measurement of all of that viewing.”
“I think people are totally overplaying [ cord cutting]. When we're
looking at [cable subscription], there's not a material acceleration
of what has been a modest decline in subscribers over the last
couple of years. In fact, in certain segments like the cable
companies, we're seeing stabilization on the cable company part
of the MVPD universe.”
Viacom, Inc. Presents at Goldman Sachs 24th Annual Communacopia
Conference, September 16, 2015.
Cable Executives Downplay Subscription Decline
James Murdoch
Twenty-Century First Fox, Inc.
CEO
Domestically in the U.S., I think stuff that I've seen says
consensus would be kind of 1% decline in the pay-TV, the
traditional pay-TV universe, and that seems reasonable. For us
though, we're in a slightly different position than others, where
many of our channels are younger, are just newer businesses
and we're actually growing our billable subscribers as well as
rates. So if I look at clearing Fox Sports 1 and 2, if I look at the
growth at National Geographic, if I look at the total FX suite with
FX Movies and FXX, we're actually still growing into a
marketplace there. It's really only 2 of our channels, FOX News
and FX, that are closer to fully distributed where we're seeing
some of those other sorts of declines.
“The real story is we will see a rebuilding of the bundle. We'll see
a lot of packaging options.”
Twenty-First Century Fox, Inc. Presents at Goldman Sachs 24th Annual
Communacopia Conference, September 16, 2015.
Duff & Phelps 23 October 24, 2015
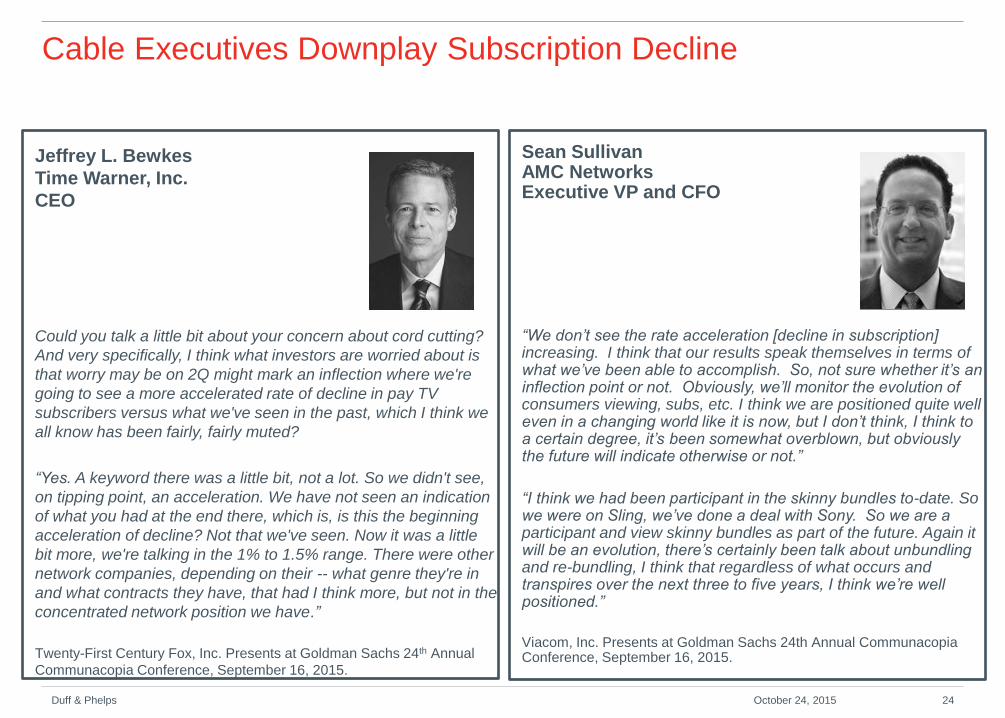
Sean Sullivan AMC Networks Executive VP and CFO
“We don’t see the rate acceleration [decline in subscription] increasing. I think that our results speak themselves in terms of what we’ve been able to accomplish. So, not sure whether it’s an inflection point or not. Obviously, we’ll monitor the evolution of consumers viewing, subs, etc. I think we are positioned quite well even in a changing world like it is now, but I don’t think, I think to a certain degree, it’s been somewhat overblown, but obviously the future will indicate otherwise or not.”
“I think we had been participant in the skinny bundles to-date. So we were on Sling, we’ve done a deal with Sony. So we are a participant and view skinny bundles as part of the future. Again it will be an evolution, there’s certainly been talk about unbundling and re-bundling, I think that regardless of what occurs and transpires over the next three to five years, I think we’re well positioned.”
Viacom, Inc. Presents at Goldman Sachs 24th Annual Communacopia Conference, September 16, 2015.
Cable Executives Downplay Subscription Decline
Jeffrey L. Bewkes
Time Warner, Inc.
CEO
Could you talk a little bit about your concern about cord cutting?
And very specifically, I think what investors are worried about is
that worry may be on 2Q might mark an inflection where we're
going to see a more accelerated rate of decline in pay TV
subscribers versus what we've seen in the past, which I think we
all know has been fairly, fairly muted?
“Yes. A keyword there was a little bit, not a lot. So we didn't see,
on tipping point, an acceleration. We have not seen an indication
of what you had at the end there, which is, is this the beginning
acceleration of decline? Not that we've seen. Now it was a little
bit more, we're talking in the 1% to 1.5% range. There were other
network companies, depending on their -- what genre they're in
and what contracts they have, that had I think more, but not in the
concentrated network position we have.”
Twenty-First Century Fox, Inc. Presents at Goldman Sachs 24th Annual
Communacopia Conference, September 16, 2015.
Duff & Phelps 24 October 24, 2015
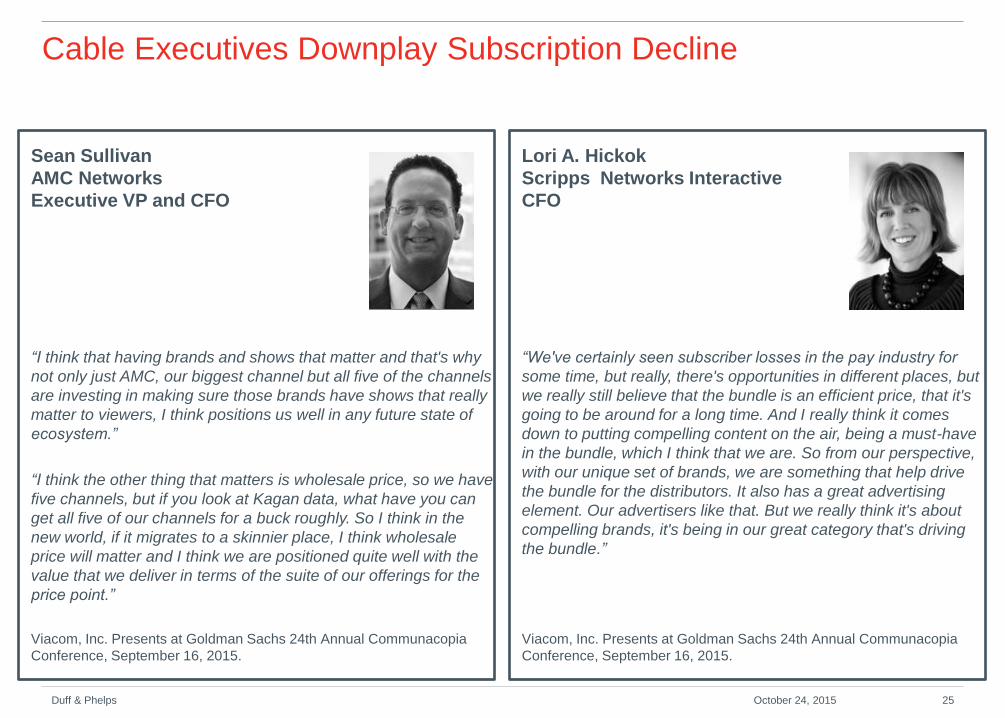
Sean Sullivan
AMC Networks
Executive VP and CFO
“I think that having brands and shows that matter and that's why
not only just AMC, our biggest channel but all five of the channels
are investing in making sure those brands have shows that really
matter to viewers, I think positions us well in any future state of
ecosystem.”
“I think the other thing that matters is wholesale price, so we have
five channels, but if you look at Kagan data, what have you can
get all five of our channels for a buck roughly. So I think in the
new world, if it migrates to a skinnier place, I think wholesale
price will matter and I think we are positioned quite well with the
value that we deliver in terms of the suite of our offerings for the
price point.”
Viacom, Inc. Presents at Goldman Sachs 24th Annual Communacopia
Conference, September 16, 2015.
Cable Executives Downplay Subscription Decline
Duff & Phelps 25 October 24, 2015
Lori A. Hickok
Scripps Networks Interactive
CFO
“We've certainly seen subscriber losses in the pay industry for
some time, but really, there's opportunities in different places, but
we really still believe that the bundle is an efficient price, that it's
going to be around for a long time. And I really think it comes
down to putting compelling content on the air, being a must-have
in the bundle, which I think that we are. So from our perspective,
with our unique set of brands, we are something that help drive
the bundle for the distributors. It also has a great advertising
element. Our advertisers like that. But we really think it's about
compelling brands, it's being in our great category that's driving
the bundle.”
Viacom, Inc. Presents at Goldman Sachs 24th Annual Communacopia
Conference, September 16, 2015.

Management Plan Section 4
Duff & Phelps 26
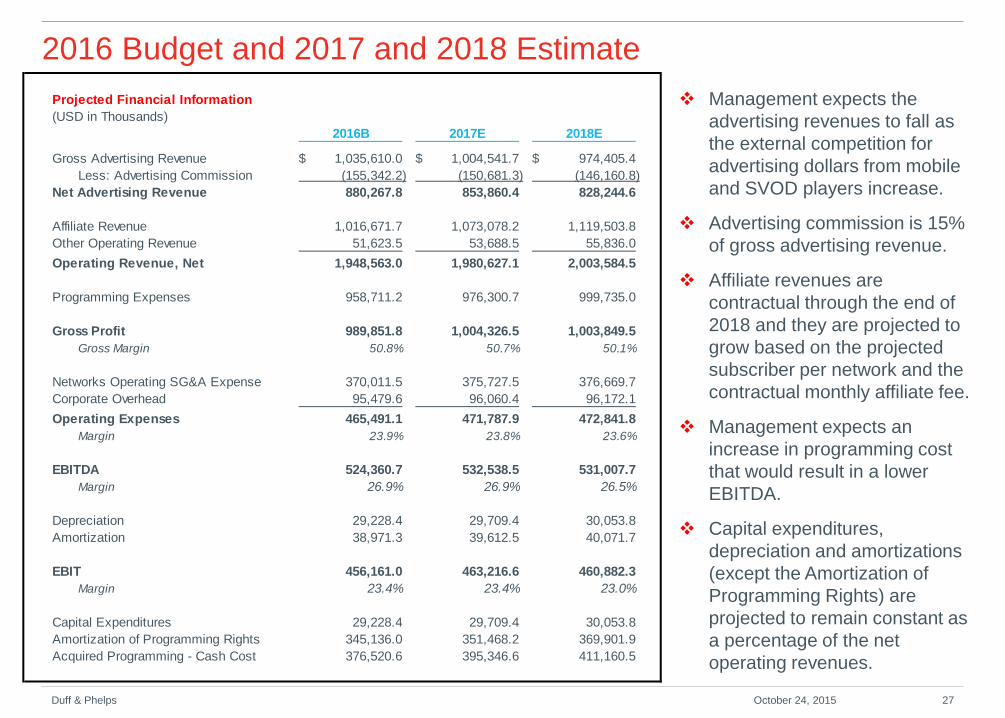
2016 Budget and 2017 and 2018 Estimate
Management expects the
advertising revenues to fall as
the external competition for
advertising dollars from mobile
and SVOD players increase.
Advertising commission is 15%
of gross advertising revenue.
Affiliate revenues are
contractual through the end of
2018 and they are projected to
grow based on the projected
subscriber per network and the
contractual monthly affiliate fee.
Management expects an
increase in programming cost
that would result in a lower
EBITDA.
Capital expenditures,
depreciation and amortizations
(except the Amortization of
Programming Rights) are
projected to remain constant as
a percentage of the net
operating revenues.
Duff & Phelps 27 October 24, 2015
Projected Financial Information
(USD in Thousands)
2016B 2017E 2018E
Gross Advertising Revenue 1,035,610.0$ 1,004,541.7$ 974,405.4$
Less: Advertising Commission (155,342.2) (150,681.3) (146,160.8)
Net Advertising Revenue 880,267.8 853,860.4 828,244.6
Affiliate Revenue 1,016,671.7 1,073,078.2 1,119,503.8
Other Operating Revenue 51,623.5 53,688.5 55,836.0
Operating Revenue, Net 1,948,563.0 1,980,627.1 2,003,584.5
Programming Expenses 958,711.2 976,300.7 999,735.0
Gross Profit 989,851.8 1,004,326.5 1,003,849.5
Gross Margin 50.8% 50.7% 50.1%
Networks Operating SG&A Expense 370,011.5 375,727.5 376,669.7
Corporate Overhead 95,479.6 96,060.4 96,172.1
Operating Expenses 465,491.1 471,787.9 472,841.8
Margin 23.9% 23.8% 23.6%
EBITDA 524,360.7 532,538.5 531,007.7
Margin 26.9% 26.9% 26.5%
Depreciation 29,228.4 29,709.4 30,053.8
Amortization 38,971.3 39,612.5 40,071.7
EBIT 456,161.0 463,216.6 460,882.3
Margin 23.4% 23.4% 23.0%
Capital Expenditures 29,228.4 29,709.4 30,053.8
Amortization of Programming Rights 345,136.0 351,468.2 369,901.9
Acquired Programming - Cash Cost 376,520.6 395,346.6 411,160.5
Long-term Prospect
The negotiations with the MSOs regarding the renewal of the affiliate contracts has not started yet.
Management believes they may be in a weaker negotiating power against the MSOs since they are a
smaller network group compared to others.
The Management is confident that they will be able to renew their contracts; however, they are not sure
whether they are positioned to increase their affiliate fee for their networks.
In addition, Management is concerned about the influence of OTT options and the impact on affiliate
revenue and ad revenue.
Duff & Phelps 28 October 24, 2015

Deliverables Appendix A
Duff & Phelps 29
Deliverable 1
Research 2 potential buyers for Summit Networks: 1 strategic buyer and 1 financial buyer. For each buyer,
estimate what they are willing to pay and why? How will they structure the purchase? Conclusion should
assess all facts and circumstances, including consideration of the value perspective of opposing parties
(e.g., you must consider value perspectives of the two buyers and the seller.)
Assume a deal close (and valuation date) as of December 31, 2015.
Specific deliverables must include:
1. Valuation models for Summit Networks showing concluded value and detailed calculations for revenue,
gross margin, operating expenses, depreciation, amortization, capital expenditures, programming cost,
working capital, present value factors, and residual calculations; synergy calculations, if any, should be
separately quantified.
2. Common size and growth trend analysis for concluded forecasts.
3. Calculation of cost of capital showing detailed calculations for cost of debt and cost of equity (including
leveraging/re-leveraging beta as appropriate), and debt and equity weighting factors.
4. Qualitative list of issues analyzed, and support for final assumptions; list should describe analysis of
opposing party views as appropriate.
5. Your team’s recommendation for best buyer based on all information, including quantitative support for
qualitative decisions – e.g., alternate views of cost of capital, achievable synergies, long-term
assumptions, sensitivity of value conclusions to different inputs, etc.
Duff & Phelps 30 October 24, 2015
Deliverable 1
As part of you analysis, you should rely on the Income Approach (i.e. Discount Cash Flow Method) and the
Market Approach (i.e. a Market Comparable Method and Precedent Transaction Method).
Consider sensitivity and scenario analysis of key drivers of value.
Comment on the results of the valuation approaches utilized. In specific:
1. Provide your opinion on relevance of the key assumptions in your Discounted Cash Flow Method;
2. Comment on the relevance of the selected transactions in your Precedent Transaction Method; and
3. Comment on the rationale behind selecting the comparable guideline companies in your Market
Comparable Method and provide your reasoning for selecting the appropriate multiple for Summit
Networks.
If necessary, reconcile the result of the valuation approaches utilized above, for both the strategic and
financial buyer. That is, if the value indicators from the various valuation approaches (i.e. DCF, Market
Comparable Method, etc.) materially differ, provide rationale for the differences in values.
Duff & Phelps 31 October 24, 2015
Deliverable 2
Summit is the one of the few pure-play cable network operators.
It’s reliance on the cable network model makes it vulnerable to rapid changes in the entertainment and
media industry
Summit launched Summit Sports Network to increase its leverage against MSOs. However, it expects the
cost of programming to escalate substantially going forward.
To continue its growth and maintain its profitability, Summit has decided to increase its presence over online
platforms such as YouTube and other Subscription Video on Demand (SVOD) providers such as Netflix and
Hulu.
Management does not breakdown its advertising revenue by its sources; however, in the latest presentation
to the Board, Management indicated that 10% of their advertising revenue is generated through non-MSO
distribution method (i.e. YouTube, etc.).
Discuss the impact of Management’s proposed digital strategy. How would it impact the upcoming
negotiations with the MSOs in FY 2017. Discuss potential cannibalization of the current relationship with the
MSOs.
Duff & Phelps 32 October 24, 2015
Deliverable 3
RatingsTRAK ratings calculates viewership size and composition for television programming. These ratings
are the primary metrics used by broadcasters and cable networks to establish the value of their airtime and
more effectively schedule and promote their programming. Advertisers also use this information to negotiate
advertising rates.
RatingsTRAK calculates television ratings in the United States by collecting viewership data from a sample
of households. It uses various methods to collect data, including electronic meters and written diaries.
These methods enable RatingsTRAK to measure not only the audience size but also the demographics of
the sample audience.
Due to a miscalculation in the way RatingsTRAK had been estimating total audience size, the ratings given
to certain television programming (including those by Summit) had been artificially inflated for the past year.
As a result, advertisers were paying higher rates to run commercials on the affected television programs
(including those on Summit’s networks).
The affected television advertisers have brought a class action lawsuit against RatingsTRAK and the cable
networks for damages due to inaccurate viewership measurement and overpayment of advertising.
Present a methodology for calculating potential damages in this matter (i.e., how would one determine
damages based on the allegations?). A final damages calculation is not required.
Duff & Phelps 33 October 24, 2015

Additional Assumptions Appendix B
Duff & Phelps 34
Suggested Comparable Companies
Pure-play Cable Networks Companies:
1. Crown Media Holdings Inc.
2. Discovery Communications, Inc.
3. AMC Networks, Inc.
4. Scripps Networks Interactive, Inc.
Media Companies with Cable Networks Division:
1. Twenty-First Century Fox, Inc.
2. Viacom, Inc.
3. The Walt Disney Company
4. Comcast Corporation
5. Time Warner, Inc.
Duff & Phelps 35 October 24, 2015
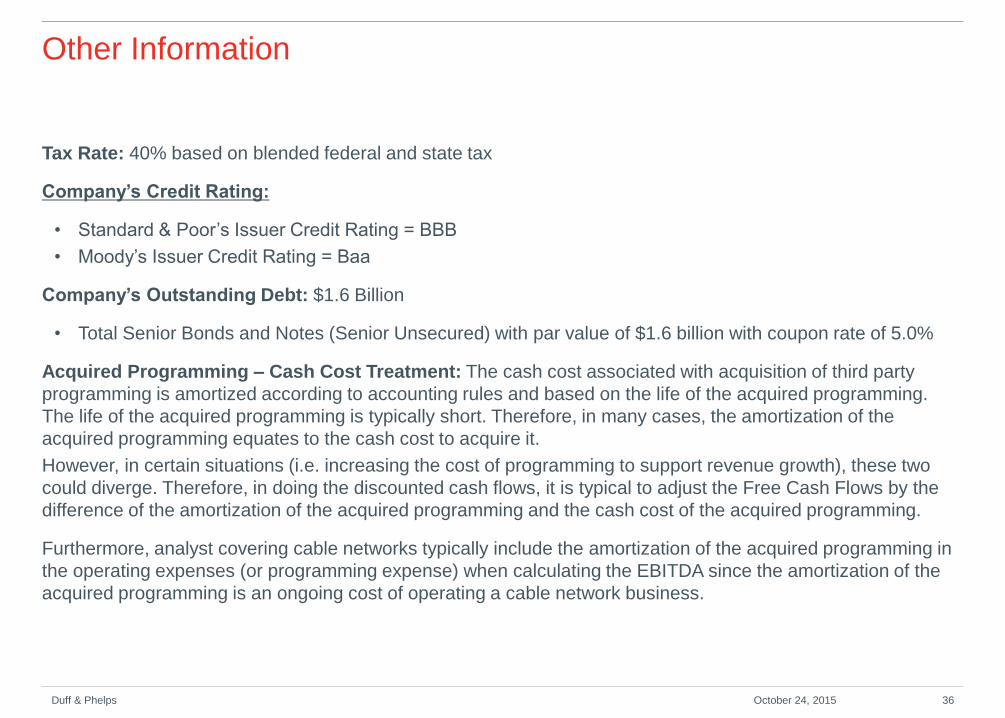
Other Information
Tax Rate: 40% based on blended federal and state tax
Company’s Credit Rating:
• Standard & Poor’s Issuer Credit Rating = BBB
• Moody’s Issuer Credit Rating = Baa
Company’s Outstanding Debt: $1.6 Billion
• Total Senior Bonds and Notes (Senior Unsecured) with par value of $1.6 billion with coupon rate of 5.0%
Acquired Programming – Cash Cost Treatment: The cash cost associated with acquisition of third party
programming is amortized according to accounting rules and based on the life of the acquired programming.
The life of the acquired programming is typically short. Therefore, in many cases, the amortization of the
acquired programming equates to the cash cost to acquire it.
However, in certain situations (i.e. increasing the cost of programming to support revenue growth), these two
could diverge. Therefore, in doing the discounted cash flows, it is typical to adjust the Free Cash Flows by the
difference of the amortization of the acquired programming and the cash cost of the acquired programming.
Furthermore, analyst covering cable networks typically include the amortization of the acquired programming in
the operating expenses (or programming expense) when calculating the EBITDA since the amortization of the
acquired programming is an ongoing cost of operating a cable network business.
Duff & Phelps 36 October 24, 2015

Network Level Details Appendix C
Duff & Phelps 37
Summit Classic Network
Duff & Phelps 38 October 24, 2015
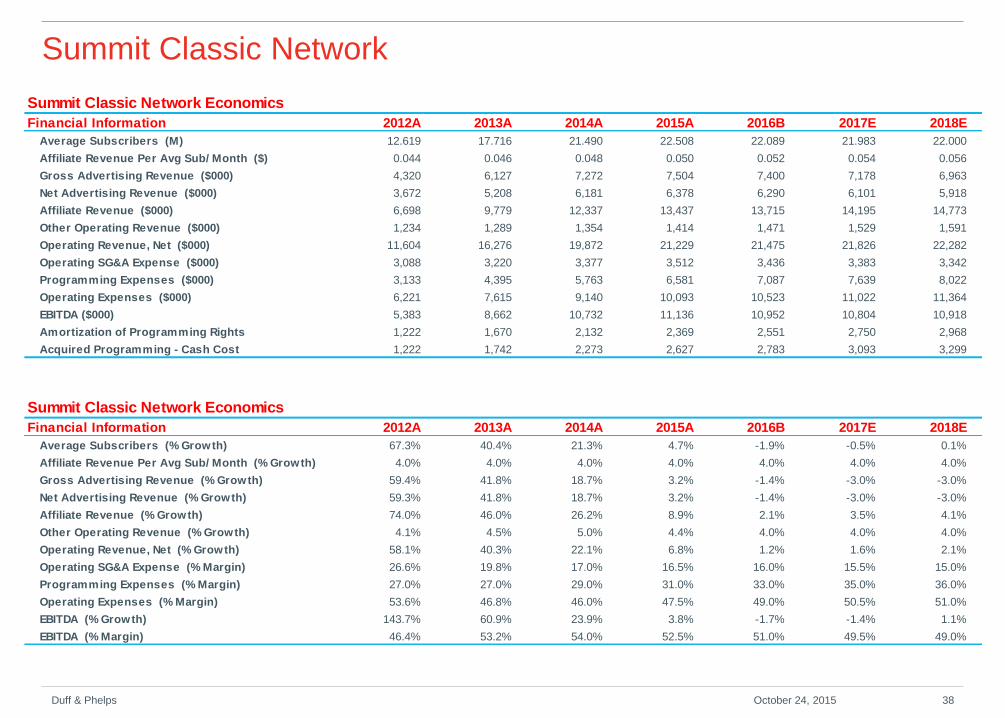
Summit Classic Network Economics
Financial Information 2012A 2013A 2014A 2015A 2016B 2017E 2018E
Average Subscribers (M) 12.619 17.716 21.490 22.508 22.089 21.983 22.000
Affiliate Revenue Per Avg Sub/ Month ($) 0.044 0.046 0.048 0.050 0.052 0.054 0.056
Gross Advertising Revenue ($000) 4,320 6,127 7,272 7,504 7,400 7,178 6,963
Net Advertising Revenue ($000) 3,672 5,208 6,181 6,378 6,290 6,101 5,918
Affiliate Revenue ($000) 6,698 9,779 12,337 13,437 13,715 14,195 14,773
Other Operating Revenue ($000) 1,234 1,289 1,354 1,414 1,471 1,529 1,591
Operating Revenue, Net ($000) 11,604 16,276 19,872 21,229 21,475 21,826 22,282
Operating SG&A Expense ($000) 3,088 3,220 3,377 3,512 3,436 3,383 3,342
Programming Expenses ($000) 3,133 4,395 5,763 6,581 7,087 7,639 8,022
Operating Expenses ($000) 6,221 7,615 9,140 10,093 10,523 11,022 11,364
EBITDA ($000) 5,383 8,662 10,732 11,136 10,952 10,804 10,918
Amortization of Programming Rights 1,222 1,670 2,132 2,369 2,551 2,750 2,968
Acquired Programming - Cash Cost 1,222 1,742 2,273 2,627 2,783 3,093 3,299
Summit Classic Network Economics
Financial Information 2012A 2013A 2014A 2015A 2016B 2017E 2018E
Average Subscribers (% Growth) 67.3% 40.4% 21.3% 4.7% -1.9% -0.5% 0.1%
Affiliate Revenue Per Avg Sub/ Month (% Growth) 4.0% 4.0% 4.0% 4.0% 4.0% 4.0% 4.0%
Gross Advertising Revenue (% Growth) 59.4% 41.8% 18.7% 3.2% -1.4% -3.0% -3.0%
Net Advertising Revenue (% Growth) 59.3% 41.8% 18.7% 3.2% -1.4% -3.0% -3.0%
Affiliate Revenue (% Growth) 74.0% 46.0% 26.2% 8.9% 2.1% 3.5% 4.1%
Other Operating Revenue (% Growth) 4.1% 4.5% 5.0% 4.4% 4.0% 4.0% 4.0%
Operating Revenue, Net (% Growth) 58.1% 40.3% 22.1% 6.8% 1.2% 1.6% 2.1%
Operating SG&A Expense (% Margin) 26.6% 19.8% 17.0% 16.5% 16.0% 15.5% 15.0%
Programming Expenses (% Margin) 27.0% 27.0% 29.0% 31.0% 33.0% 35.0% 36.0%
Operating Expenses (% Margin) 53.6% 46.8% 46.0% 47.5% 49.0% 50.5% 51.0%
EBITDA (% Growth) 143.7% 60.9% 23.9% 3.8% -1.7% -1.4% 1.1%
EBITDA (% Margin) 46.4% 53.2% 54.0% 52.5% 51.0% 49.5% 49.0%
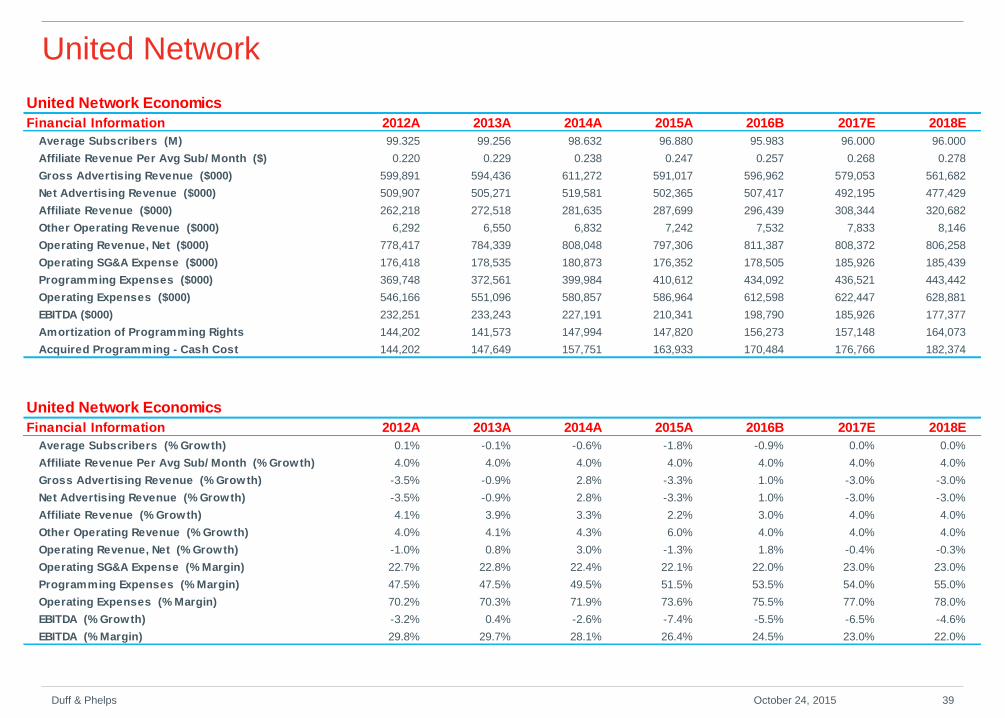
United Network
Duff & Phelps 39 October 24, 2015
United Network Economics
Financial Information 2012A 2013A 2014A 2015A 2016B 2017E 2018E
Average Subscribers (M) 99.325 99.256 98.632 96.880 95.983 96.000 96.000
Affiliate Revenue Per Avg Sub/ Month ($) 0.220 0.229 0.238 0.247 0.257 0.268 0.278
Gross Advertising Revenue ($000) 599,891 594,436 611,272 591,017 596,962 579,053 561,682
Net Advertising Revenue ($000) 509,907 505,271 519,581 502,365 507,417 492,195 477,429
Affiliate Revenue ($000) 262,218 272,518 281,635 287,699 296,439 308,344 320,682
Other Operating Revenue ($000) 6,292 6,550 6,832 7,242 7,532 7,833 8,146
Operating Revenue, Net ($000) 778,417 784,339 808,048 797,306 811,387 808,372 806,258
Operating SG&A Expense ($000) 176,418 178,535 180,873 176,352 178,505 185,926 185,439
Programming Expenses ($000) 369,748 372,561 399,984 410,612 434,092 436,521 443,442
Operating Expenses ($000) 546,166 551,096 580,857 586,964 612,598 622,447 628,881
EBITDA ($000) 232,251 233,243 227,191 210,341 198,790 185,926 177,377
Amortization of Programming Rights 144,202 141,573 147,994 147,820 156,273 157,148 164,073
Acquired Programming - Cash Cost 144,202 147,649 157,751 163,933 170,484 176,766 182,374
United Network Economics
Financial Information 2012A 2013A 2014A 2015A 2016B 2017E 2018E
Average Subscribers (% Growth) 0.1% -0.1% -0.6% -1.8% -0.9% 0.0% 0.0%
Affiliate Revenue Per Avg Sub/ Month (% Growth) 4.0% 4.0% 4.0% 4.0% 4.0% 4.0% 4.0%
Gross Advertising Revenue (% Growth) -3.5% -0.9% 2.8% -3.3% 1.0% -3.0% -3.0%
Net Advertising Revenue (% Growth) -3.5% -0.9% 2.8% -3.3% 1.0% -3.0% -3.0%
Affiliate Revenue (% Growth) 4.1% 3.9% 3.3% 2.2% 3.0% 4.0% 4.0%
Other Operating Revenue (% Growth) 4.0% 4.1% 4.3% 6.0% 4.0% 4.0% 4.0%
Operating Revenue, Net (% Growth) -1.0% 0.8% 3.0% -1.3% 1.8% -0.4% -0.3%
Operating SG&A Expense (% Margin) 22.7% 22.8% 22.4% 22.1% 22.0% 23.0% 23.0%
Programming Expenses (% Margin) 47.5% 47.5% 49.5% 51.5% 53.5% 54.0% 55.0%
Operating Expenses (% Margin) 70.2% 70.3% 71.9% 73.6% 75.5% 77.0% 78.0%
EBITDA (% Growth) -3.2% 0.4% -2.6% -7.4% -5.5% -6.5% -4.6%
EBITDA (% Margin) 29.8% 29.7% 28.1% 26.4% 24.5% 23.0% 22.0%
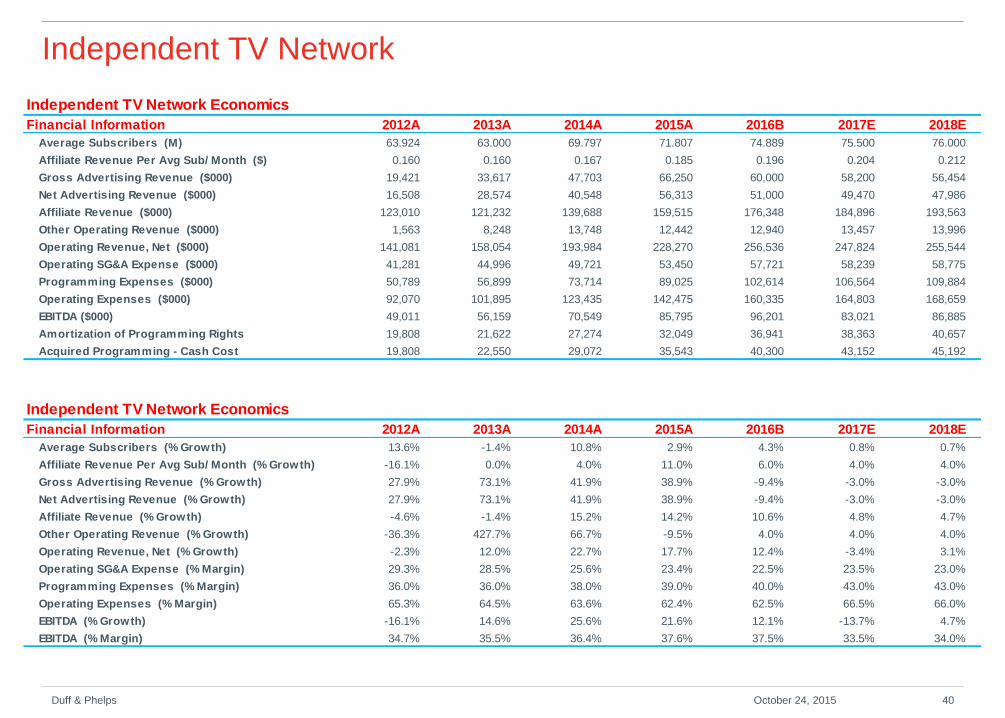
Independent TV Network
Duff & Phelps 40 October 24, 2015
Independent TV Network Economics
Financial Information 2012A 2013A 2014A 2015A 2016B 2017E 2018E
Average Subscribers (M) 63.924 63.000 69.797 71.807 74.889 75.500 76.000
Affiliate Revenue Per Avg Sub/ Month ($) 0.160 0.160 0.167 0.185 0.196 0.204 0.212
Gross Advertising Revenue ($000) 19,421 33,617 47,703 66,250 60,000 58,200 56,454
Net Advertising Revenue ($000) 16,508 28,574 40,548 56,313 51,000 49,470 47,986
Affiliate Revenue ($000) 123,010 121,232 139,688 159,515 176,348 184,896 193,563
Other Operating Revenue ($000) 1,563 8,248 13,748 12,442 12,940 13,457 13,996
Operating Revenue, Net ($000) 141,081 158,054 193,984 228,270 256,536 247,824 255,544
Operating SG&A Expense ($000) 41,281 44,996 49,721 53,450 57,721 58,239 58,775
Programming Expenses ($000) 50,789 56,899 73,714 89,025 102,614 106,564 109,884
Operating Expenses ($000) 92,070 101,895 123,435 142,475 160,335 164,803 168,659
EBITDA ($000) 49,011 56,159 70,549 85,795 96,201 83,021 86,885
Amortization of Programming Rights 19,808 21,622 27,274 32,049 36,941 38,363 40,657
Acquired Programming - Cash Cost 19,808 22,550 29,072 35,543 40,300 43,152 45,192
Independent TV Network Economics
Financial Information 2012A 2013A 2014A 2015A 2016B 2017E 2018E
Average Subscribers (% Growth) 13.6% -1.4% 10.8% 2.9% 4.3% 0.8% 0.7%
Affiliate Revenue Per Avg Sub/ Month (% Growth) -16.1% 0.0% 4.0% 11.0% 6.0% 4.0% 4.0%
Gross Advertising Revenue (% Growth) 27.9% 73.1% 41.9% 38.9% -9.4% -3.0% -3.0%
Net Advertising Revenue (% Growth) 27.9% 73.1% 41.9% 38.9% -9.4% -3.0% -3.0%
Affiliate Revenue (% Growth) -4.6% -1.4% 15.2% 14.2% 10.6% 4.8% 4.7%
Other Operating Revenue (% Growth) -36.3% 427.7% 66.7% -9.5% 4.0% 4.0% 4.0%
Operating Revenue, Net (% Growth) -2.3% 12.0% 22.7% 17.7% 12.4% -3.4% 3.1%
Operating SG&A Expense (% Margin) 29.3% 28.5% 25.6% 23.4% 22.5% 23.5% 23.0%
Programming Expenses (% Margin) 36.0% 36.0% 38.0% 39.0% 40.0% 43.0% 43.0%
Operating Expenses (% Margin) 65.3% 64.5% 63.6% 62.4% 62.5% 66.5% 66.0%
EBITDA (% Growth) -16.1% 14.6% 25.6% 21.6% 12.1% -13.7% 4.7%
EBITDA (% Margin) 34.7% 35.5% 36.4% 37.6% 37.5% 33.5% 34.0%
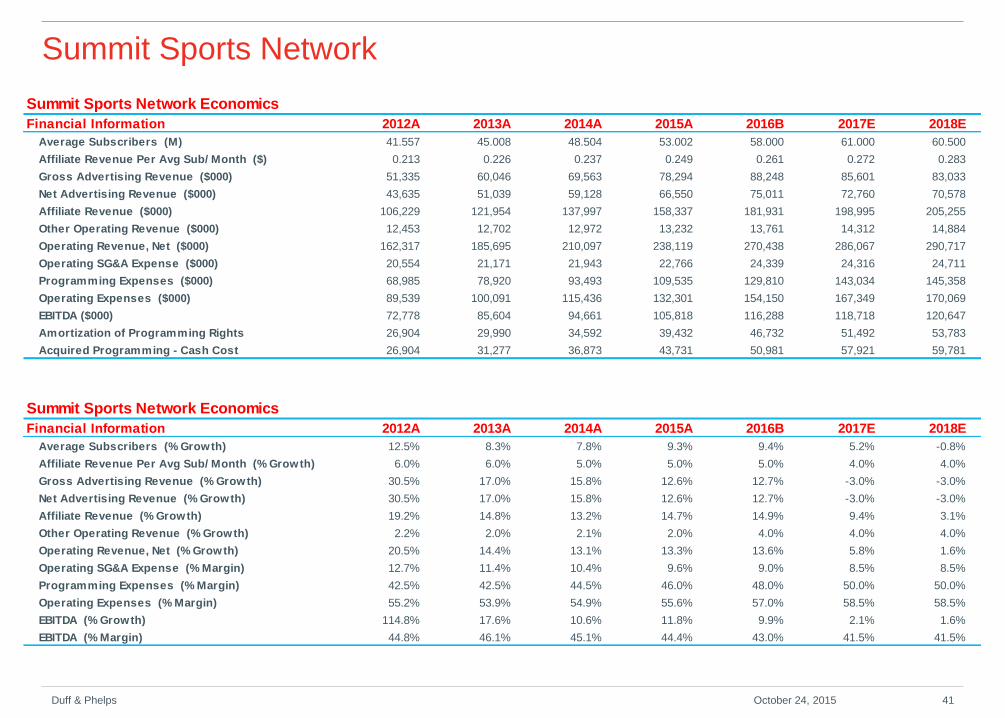
Summit Sports Network
Duff & Phelps 41 October 24, 2015
Summit Sports Network Economics
Financial Information 2012A 2013A 2014A 2015A 2016B 2017E 2018E
Average Subscribers (M) 41.557 45.008 48.504 53.002 58.000 61.000 60.500
Affiliate Revenue Per Avg Sub/ Month ($) 0.213 0.226 0.237 0.249 0.261 0.272 0.283
Gross Advertising Revenue ($000) 51,335 60,046 69,563 78,294 88,248 85,601 83,033
Net Advertising Revenue ($000) 43,635 51,039 59,128 66,550 75,011 72,760 70,578
Affiliate Revenue ($000) 106,229 121,954 137,997 158,337 181,931 198,995 205,255
Other Operating Revenue ($000) 12,453 12,702 12,972 13,232 13,761 14,312 14,884
Operating Revenue, Net ($000) 162,317 185,695 210,097 238,119 270,438 286,067 290,717
Operating SG&A Expense ($000) 20,554 21,171 21,943 22,766 24,339 24,316 24,711
Programming Expenses ($000) 68,985 78,920 93,493 109,535 129,810 143,034 145,358
Operating Expenses ($000) 89,539 100,091 115,436 132,301 154,150 167,349 170,069
EBITDA ($000) 72,778 85,604 94,661 105,818 116,288 118,718 120,647
Amortization of Programming Rights 26,904 29,990 34,592 39,432 46,732 51,492 53,783
Acquired Programming - Cash Cost 26,904 31,277 36,873 43,731 50,981 57,921 59,781
Summit Sports Network Economics
Financial Information 2012A 2013A 2014A 2015A 2016B 2017E 2018E
Average Subscribers (% Growth) 12.5% 8.3% 7.8% 9.3% 9.4% 5.2% -0.8%
Affiliate Revenue Per Avg Sub/ Month (% Growth) 6.0% 6.0% 5.0% 5.0% 5.0% 4.0% 4.0%
Gross Advertising Revenue (% Growth) 30.5% 17.0% 15.8% 12.6% 12.7% -3.0% -3.0%
Net Advertising Revenue (% Growth) 30.5% 17.0% 15.8% 12.6% 12.7% -3.0% -3.0%
Affiliate Revenue (% Growth) 19.2% 14.8% 13.2% 14.7% 14.9% 9.4% 3.1%
Other Operating Revenue (% Growth) 2.2% 2.0% 2.1% 2.0% 4.0% 4.0% 4.0%
Operating Revenue, Net (% Growth) 20.5% 14.4% 13.1% 13.3% 13.6% 5.8% 1.6%
Operating SG&A Expense (% Margin) 12.7% 11.4% 10.4% 9.6% 9.0% 8.5% 8.5%
Programming Expenses (% Margin) 42.5% 42.5% 44.5% 46.0% 48.0% 50.0% 50.0%
Operating Expenses (% Margin) 55.2% 53.9% 54.9% 55.6% 57.0% 58.5% 58.5%
EBITDA (% Growth) 114.8% 17.6% 10.6% 11.8% 9.9% 2.1% 1.6%
EBITDA (% Margin) 44.8% 46.1% 45.1% 44.4% 43.0% 41.5% 41.5%
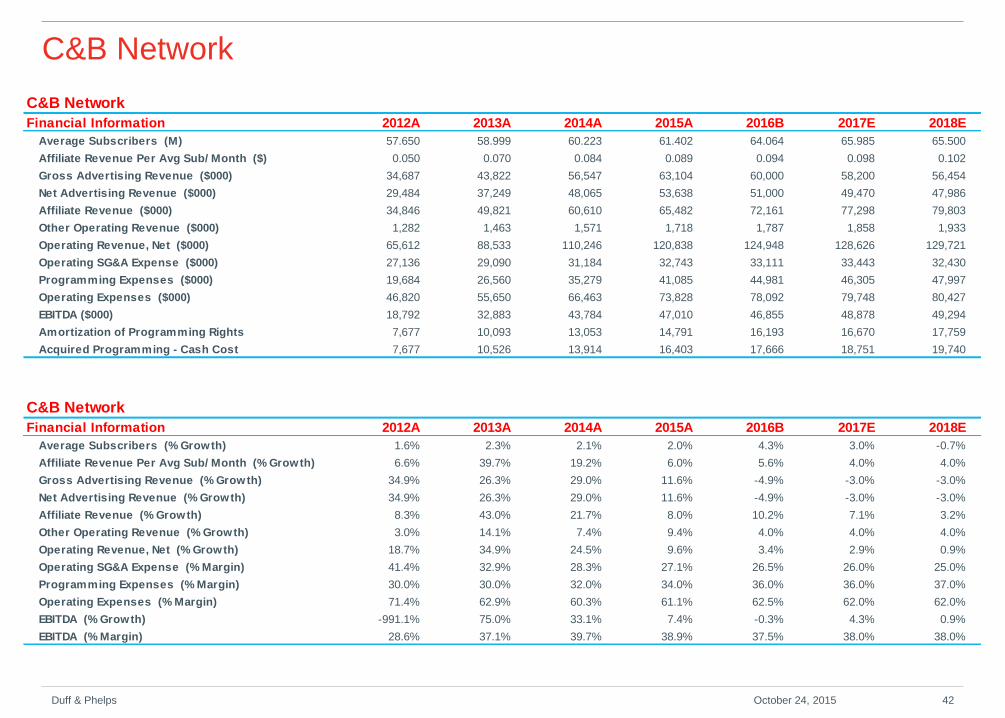
C&B Network
Duff & Phelps 42 October 24, 2015
C&B Network
Financial Information 2012A 2013A 2014A 2015A 2016B 2017E 2018E
Average Subscribers (M) 57.650 58.999 60.223 61.402 64.064 65.985 65.500
Affiliate Revenue Per Avg Sub/ Month ($) 0.050 0.070 0.084 0.089 0.094 0.098 0.102
Gross Advertising Revenue ($000) 34,687 43,822 56,547 63,104 60,000 58,200 56,454
Net Advertising Revenue ($000) 29,484 37,249 48,065 53,638 51,000 49,470 47,986
Affiliate Revenue ($000) 34,846 49,821 60,610 65,482 72,161 77,298 79,803
Other Operating Revenue ($000) 1,282 1,463 1,571 1,718 1,787 1,858 1,933
Operating Revenue, Net ($000) 65,612 88,533 110,246 120,838 124,948 128,626 129,721
Operating SG&A Expense ($000) 27,136 29,090 31,184 32,743 33,111 33,443 32,430
Programming Expenses ($000) 19,684 26,560 35,279 41,085 44,981 46,305 47,997
Operating Expenses ($000) 46,820 55,650 66,463 73,828 78,092 79,748 80,427
EBITDA ($000) 18,792 32,883 43,784 47,010 46,855 48,878 49,294
Amortization of Programming Rights 7,677 10,093 13,053 14,791 16,193 16,670 17,759
Acquired Programming - Cash Cost 7,677 10,526 13,914 16,403 17,666 18,751 19,740
C&B Network
Financial Information 2012A 2013A 2014A 2015A 2016B 2017E 2018E
Average Subscribers (% Growth) 1.6% 2.3% 2.1% 2.0% 4.3% 3.0% -0.7%
Affiliate Revenue Per Avg Sub/ Month (% Growth) 6.6% 39.7% 19.2% 6.0% 5.6% 4.0% 4.0%
Gross Advertising Revenue (% Growth) 34.9% 26.3% 29.0% 11.6% -4.9% -3.0% -3.0%
Net Advertising Revenue (% Growth) 34.9% 26.3% 29.0% 11.6% -4.9% -3.0% -3.0%
Affiliate Revenue (% Growth) 8.3% 43.0% 21.7% 8.0% 10.2% 7.1% 3.2%
Other Operating Revenue (% Growth) 3.0% 14.1% 7.4% 9.4% 4.0% 4.0% 4.0%
Operating Revenue, Net (% Growth) 18.7% 34.9% 24.5% 9.6% 3.4% 2.9% 0.9%
Operating SG&A Expense (% Margin) 41.4% 32.9% 28.3% 27.1% 26.5% 26.0% 25.0%
Programming Expenses (% Margin) 30.0% 30.0% 32.0% 34.0% 36.0% 36.0% 37.0%
Operating Expenses (% Margin) 71.4% 62.9% 60.3% 61.1% 62.5% 62.0% 62.0%
EBITDA (% Growth) -991.1% 75.0% 33.1% 7.4% -0.3% 4.3% 0.9%
EBITDA (% Margin) 28.6% 37.1% 39.7% 38.9% 37.5% 38.0% 38.0%
Home Improvement Network
Duff & Phelps 43 October 24, 2015
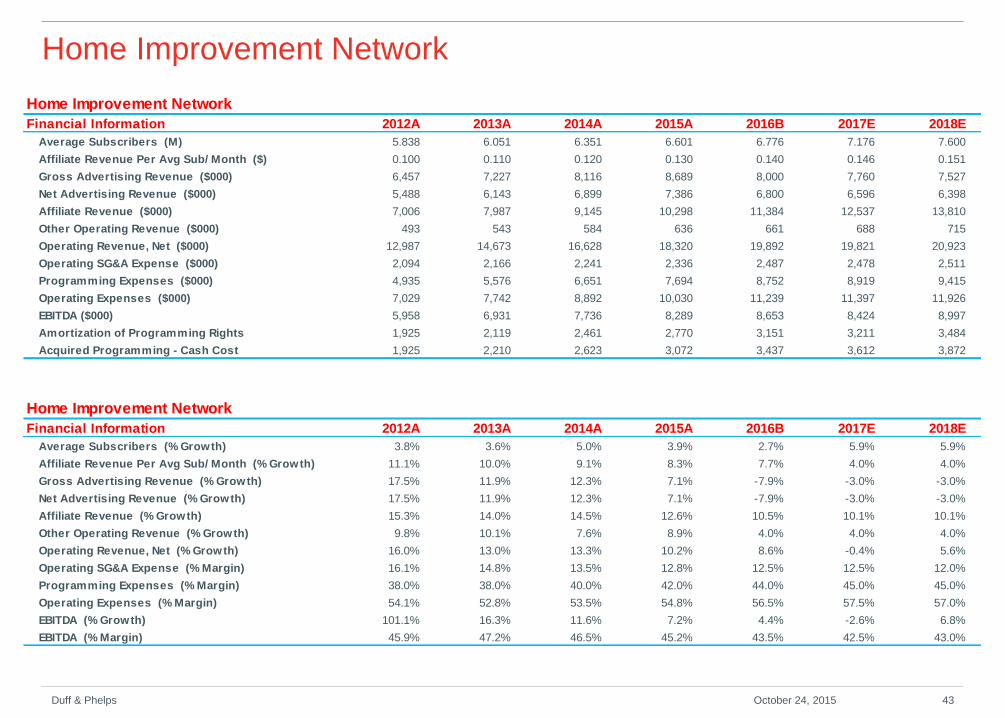
Home Improvement Network
Financial Information 2012A 2013A 2014A 2015A 2016B 2017E 2018E
Average Subscribers (M) 5.838 6.051 6.351 6.601 6.776 7.176 7.600
Affiliate Revenue Per Avg Sub/ Month ($) 0.100 0.110 0.120 0.130 0.140 0.146 0.151
Gross Advertising Revenue ($000) 6,457 7,227 8,116 8,689 8,000 7,760 7,527
Net Advertising Revenue ($000) 5,488 6,143 6,899 7,386 6,800 6,596 6,398
Affiliate Revenue ($000) 7,006 7,987 9,145 10,298 11,384 12,537 13,810
Other Operating Revenue ($000) 493 543 584 636 661 688 715
Operating Revenue, Net ($000) 12,987 14,673 16,628 18,320 19,892 19,821 20,923
Operating SG&A Expense ($000) 2,094 2,166 2,241 2,336 2,487 2,478 2,511
Programming Expenses ($000) 4,935 5,576 6,651 7,694 8,752 8,919 9,415
Operating Expenses ($000) 7,029 7,742 8,892 10,030 11,239 11,397 11,926
EBITDA ($000) 5,958 6,931 7,736 8,289 8,653 8,424 8,997
Amortization of Programming Rights 1,925 2,119 2,461 2,770 3,151 3,211 3,484
Acquired Programming - Cash Cost 1,925 2,210 2,623 3,072 3,437 3,612 3,872
Home Improvement Network
Financial Information 2012A 2013A 2014A 2015A 2016B 2017E 2018E
Average Subscribers (% Growth) 3.8% 3.6% 5.0% 3.9% 2.7% 5.9% 5.9%
Affiliate Revenue Per Avg Sub/ Month (% Growth) 11.1% 10.0% 9.1% 8.3% 7.7% 4.0% 4.0%
Gross Advertising Revenue (% Growth) 17.5% 11.9% 12.3% 7.1% -7.9% -3.0% -3.0%
Net Advertising Revenue (% Growth) 17.5% 11.9% 12.3% 7.1% -7.9% -3.0% -3.0%
Affiliate Revenue (% Growth) 15.3% 14.0% 14.5% 12.6% 10.5% 10.1% 10.1%
Other Operating Revenue (% Growth) 9.8% 10.1% 7.6% 8.9% 4.0% 4.0% 4.0%
Operating Revenue, Net (% Growth) 16.0% 13.0% 13.3% 10.2% 8.6% -0.4% 5.6%
Operating SG&A Expense (% Margin) 16.1% 14.8% 13.5% 12.8% 12.5% 12.5% 12.0%
Programming Expenses (% Margin) 38.0% 38.0% 40.0% 42.0% 44.0% 45.0% 45.0%
Operating Expenses (% Margin) 54.1% 52.8% 53.5% 54.8% 56.5% 57.5% 57.0%
EBITDA (% Growth) 101.1% 16.3% 11.6% 7.2% 4.4% -2.6% 6.8%
EBITDA (% Margin) 45.9% 47.2% 46.5% 45.2% 43.5% 42.5% 43.0%
Blast Network
Duff & Phelps 44 October 24, 2015
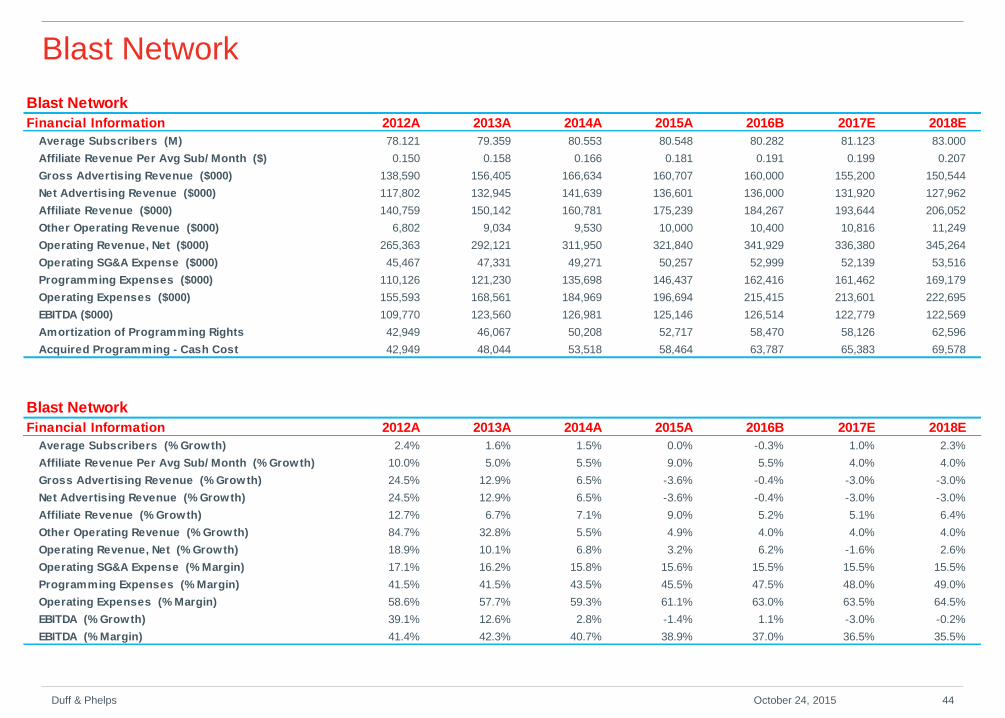
Blast Network
Financial Information 2012A 2013A 2014A 2015A 2016B 2017E 2018E
Average Subscribers (M) 78.121 79.359 80.553 80.548 80.282 81.123 83.000
Affiliate Revenue Per Avg Sub/ Month ($) 0.150 0.158 0.166 0.181 0.191 0.199 0.207
Gross Advertising Revenue ($000) 138,590 156,405 166,634 160,707 160,000 155,200 150,544
Net Advertising Revenue ($000) 117,802 132,945 141,639 136,601 136,000 131,920 127,962
Affiliate Revenue ($000) 140,759 150,142 160,781 175,239 184,267 193,644 206,052
Other Operating Revenue ($000) 6,802 9,034 9,530 10,000 10,400 10,816 11,249
Operating Revenue, Net ($000) 265,363 292,121 311,950 321,840 341,929 336,380 345,264
Operating SG&A Expense ($000) 45,467 47,331 49,271 50,257 52,999 52,139 53,516
Programming Expenses ($000) 110,126 121,230 135,698 146,437 162,416 161,462 169,179
Operating Expenses ($000) 155,593 168,561 184,969 196,694 215,415 213,601 222,695
EBITDA ($000) 109,770 123,560 126,981 125,146 126,514 122,779 122,569
Amortization of Programming Rights 42,949 46,067 50,208 52,717 58,470 58,126 62,596
Acquired Programming - Cash Cost 42,949 48,044 53,518 58,464 63,787 65,383 69,578
Blast Network
Financial Information 2012A 2013A 2014A 2015A 2016B 2017E 2018E
Average Subscribers (% Growth) 2.4% 1.6% 1.5% 0.0% -0.3% 1.0% 2.3%
Affiliate Revenue Per Avg Sub/ Month (% Growth) 10.0% 5.0% 5.5% 9.0% 5.5% 4.0% 4.0%
Gross Advertising Revenue (% Growth) 24.5% 12.9% 6.5% -3.6% -0.4% -3.0% -3.0%
Net Advertising Revenue (% Growth) 24.5% 12.9% 6.5% -3.6% -0.4% -3.0% -3.0%
Affiliate Revenue (% Growth) 12.7% 6.7% 7.1% 9.0% 5.2% 5.1% 6.4%
Other Operating Revenue (% Growth) 84.7% 32.8% 5.5% 4.9% 4.0% 4.0% 4.0%
Operating Revenue, Net (% Growth) 18.9% 10.1% 6.8% 3.2% 6.2% -1.6% 2.6%
Operating SG&A Expense (% Margin) 17.1% 16.2% 15.8% 15.6% 15.5% 15.5% 15.5%
Programming Expenses (% Margin) 41.5% 41.5% 43.5% 45.5% 47.5% 48.0% 49.0%
Operating Expenses (% Margin) 58.6% 57.7% 59.3% 61.1% 63.0% 63.5% 64.5%
EBITDA (% Growth) 39.1% 12.6% 2.8% -1.4% 1.1% -3.0% -0.2%
EBITDA (% Margin) 41.4% 42.3% 40.7% 38.9% 37.0% 36.5% 35.5%
Blast Jr. Network
Duff & Phelps 45 October 24, 2015
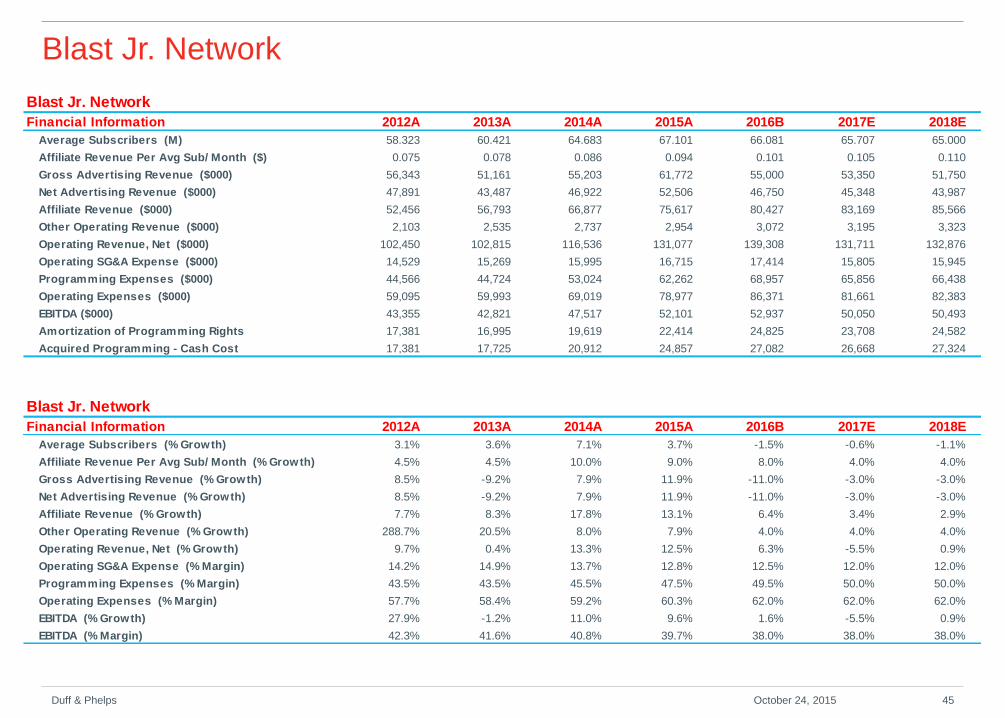
Blast Jr. Network
Financial Information 2012A 2013A 2014A 2015A 2016B 2017E 2018E
Average Subscribers (M) 58.323 60.421 64.683 67.101 66.081 65.707 65.000
Affiliate Revenue Per Avg Sub/ Month ($) 0.075 0.078 0.086 0.094 0.101 0.105 0.110
Gross Advertising Revenue ($000) 56,343 51,161 55,203 61,772 55,000 53,350 51,750
Net Advertising Revenue ($000) 47,891 43,487 46,922 52,506 46,750 45,348 43,987
Affiliate Revenue ($000) 52,456 56,793 66,877 75,617 80,427 83,169 85,566
Other Operating Revenue ($000) 2,103 2,535 2,737 2,954 3,072 3,195 3,323
Operating Revenue, Net ($000) 102,450 102,815 116,536 131,077 139,308 131,711 132,876
Operating SG&A Expense ($000) 14,529 15,269 15,995 16,715 17,414 15,805 15,945
Programming Expenses ($000) 44,566 44,724 53,024 62,262 68,957 65,856 66,438
Operating Expenses ($000) 59,095 59,993 69,019 78,977 86,371 81,661 82,383
EBITDA ($000) 43,355 42,821 47,517 52,101 52,937 50,050 50,493
Amortization of Programming Rights 17,381 16,995 19,619 22,414 24,825 23,708 24,582
Acquired Programming - Cash Cost 17,381 17,725 20,912 24,857 27,082 26,668 27,324
Blast Jr. Network
Financial Information 2012A 2013A 2014A 2015A 2016B 2017E 2018E
Average Subscribers (% Growth) 3.1% 3.6% 7.1% 3.7% -1.5% -0.6% -1.1%
Affiliate Revenue Per Avg Sub/ Month (% Growth) 4.5% 4.5% 10.0% 9.0% 8.0% 4.0% 4.0%
Gross Advertising Revenue (% Growth) 8.5% -9.2% 7.9% 11.9% -11.0% -3.0% -3.0%
Net Advertising Revenue (% Growth) 8.5% -9.2% 7.9% 11.9% -11.0% -3.0% -3.0%
Affiliate Revenue (% Growth) 7.7% 8.3% 17.8% 13.1% 6.4% 3.4% 2.9%
Other Operating Revenue (% Growth) 288.7% 20.5% 8.0% 7.9% 4.0% 4.0% 4.0%
Operating Revenue, Net (% Growth) 9.7% 0.4% 13.3% 12.5% 6.3% -5.5% 0.9%
Operating SG&A Expense (% Margin) 14.2% 14.9% 13.7% 12.8% 12.5% 12.0% 12.0%
Programming Expenses (% Margin) 43.5% 43.5% 45.5% 47.5% 49.5% 50.0% 50.0%
Operating Expenses (% Margin) 57.7% 58.4% 59.2% 60.3% 62.0% 62.0% 62.0%
EBITDA (% Growth) 27.9% -1.2% 11.0% 9.6% 1.6% -5.5% 0.9%
EBITDA (% Margin) 42.3% 41.6% 40.8% 39.7% 38.0% 38.0% 38.0%
Fiscal Year 2018 Contractual Subscribers Chart
Duff & Phelps 46 October 24, 2015
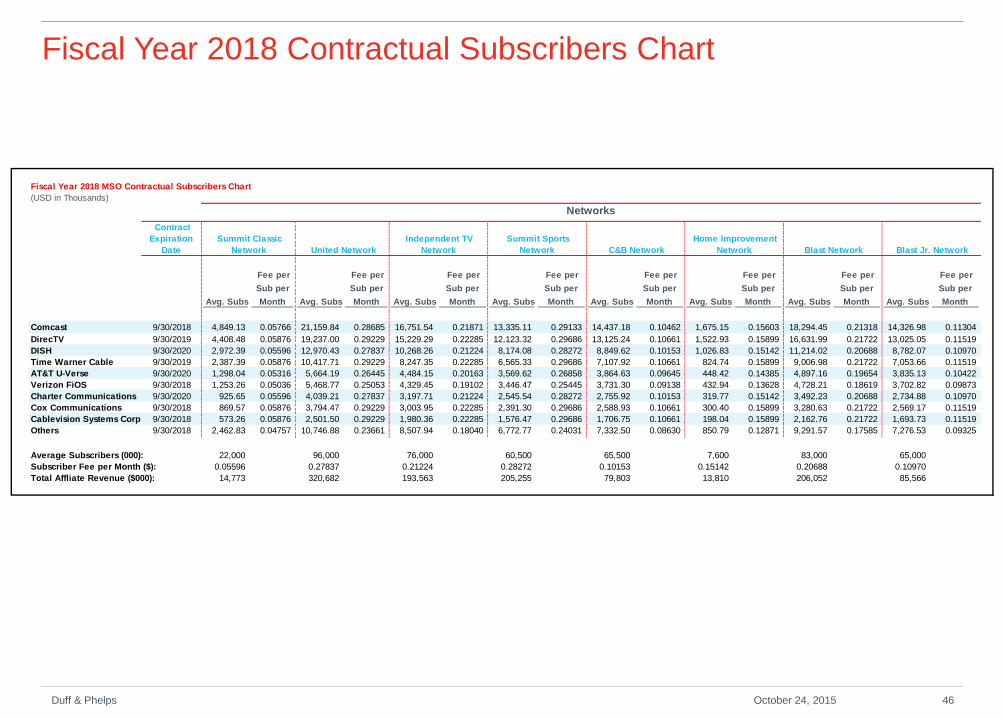
Fiscal Year 2018 MSO Contractual Subscribers Chart
(USD in Thousands)
Networks
Contract
Expiration
Date
Summit Classic
Network United Network
Independent TV
Network
Summit Sports
Network C&B Network
Home Improvement
Network Blast Network Blast Jr. Network
Avg. Subs
Fee per
Sub per
Month Avg. Subs
Fee per
Sub per
Month Avg. Subs
Fee per
Sub per
Month Avg. Subs
Fee per
Sub per
Month Avg. Subs
Fee per
Sub per
Month Avg. Subs
Fee per
Sub per
Month Avg. Subs
Fee per
Sub per
Month Avg. Subs
Fee per
Sub per
Month
Comcast 9/30/2018 4,849.13 0.05766 21,159.84 0.28685 16,751.54 0.21871 13,335.11 0.29133 14,437.18 0.10462 1,675.15 0.15603 18,294.45 0.21318 14,326.98 0.11304
DirecTV 9/30/2019 4,408.48 0.05876 19,237.00 0.29229 15,229.29 0.22285 12,123.32 0.29686 13,125.24 0.10661 1,522.93 0.15899 16,631.99 0.21722 13,025.05 0.11519
DISH 9/30/2020 2,972.39 0.05596 12,970.43 0.27837 10,268.26 0.21224 8,174.08 0.28272 8,849.62 0.10153 1,026.83 0.15142 11,214.02 0.20688 8,782.07 0.10970
Time Warner Cable 9/30/2019 2,387.39 0.05876 10,417.71 0.29229 8,247.35 0.22285 6,565.33 0.29686 7,107.92 0.10661 824.74 0.15899 9,006.98 0.21722 7,053.66 0.11519
AT&T U-Verse 9/30/2020 1,298.04 0.05316 5,664.19 0.26445 4,484.15 0.20163 3,569.62 0.26858 3,864.63 0.09645 448.42 0.14385 4,897.16 0.19654 3,835.13 0.10422
Verizon FiOS 9/30/2018 1,253.26 0.05036 5,468.77 0.25053 4,329.45 0.19102 3,446.47 0.25445 3,731.30 0.09138 432.94 0.13628 4,728.21 0.18619 3,702.82 0.09873
Charter Communications 9/30/2020 925.65 0.05596 4,039.21 0.27837 3,197.71 0.21224 2,545.54 0.28272 2,755.92 0.10153 319.77 0.15142 3,492.23 0.20688 2,734.88 0.10970
Cox Communications 9/30/2018 869.57 0.05876 3,794.47 0.29229 3,003.95 0.22285 2,391.30 0.29686 2,588.93 0.10661 300.40 0.15899 3,280.63 0.21722 2,569.17 0.11519
Cablevision Systems Corp. 9/30/2018 573.26 0.05876 2,501.50 0.29229 1,980.36 0.22285 1,576.47 0.29686 1,706.75 0.10661 198.04 0.15899 2,162.76 0.21722 1,693.73 0.11519
Others 9/30/2018 2,462.83 0.04757 10,746.88 0.23661 8,507.94 0.18040 6,772.77 0.24031 7,332.50 0.08630 850.79 0.12871 9,291.57 0.17585 7,276.53 0.09325
Average Subscribers (000): 22,000 96,000 76,000 60,500 65,500 7,600 83,000 65,000
Subscriber Fee per Month ($): 0.05596 0.27837 0.21224 0.28272 0.10153 0.15142 0.20688 0.10970
Total Affliate Revenue ($000): 14,773 320,682 193,563 205,255 79,803 13,810 206,052 85,566
-
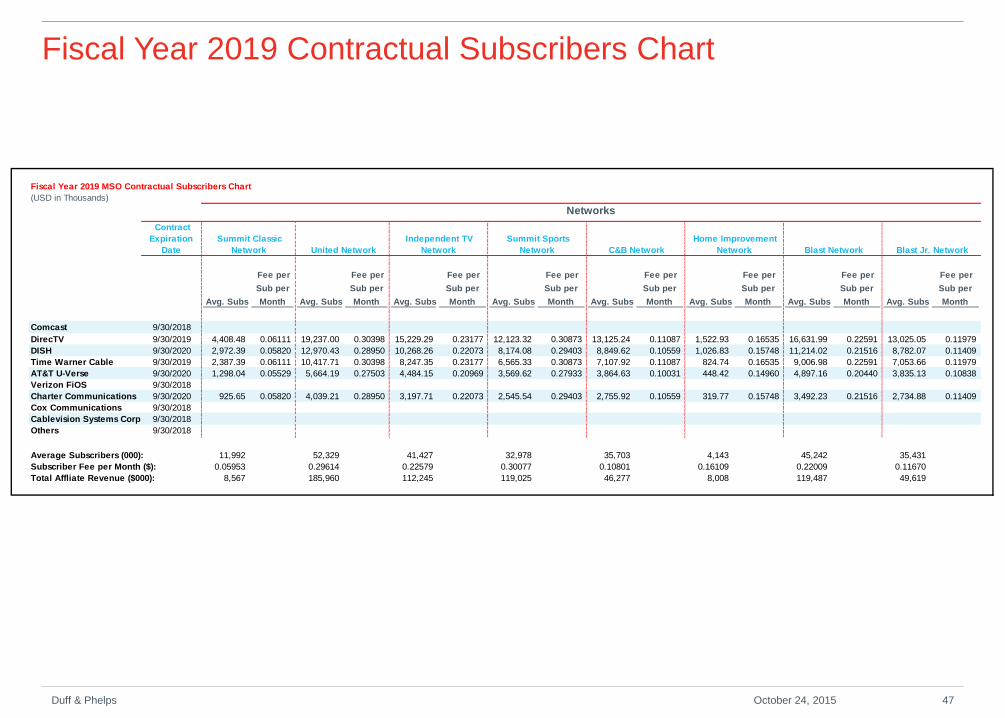
Fiscal Year 2019 Contractual Subscribers Chart
Duff & Phelps 47 October 24, 2015
Fiscal Year 2019 MSO Contractual Subscribers Chart
(USD in Thousands)
Networks
Contract
Expiration
Date
Summit Classic
Network United Network
Independent TV
Network
Summit Sports
Network C&B Network
Home Improvement
Network Blast Network Blast Jr. Network
Avg. Subs
Fee per
Sub per
Month Avg. Subs
Fee per
Sub per
Month Avg. Subs
Fee per
Sub per
Month Avg. Subs
Fee per
Sub per
Month Avg. Subs
Fee per
Sub per
Month Avg. Subs
Fee per
Sub per
Month Avg. Subs
Fee per
Sub per
Month Avg. Subs
Fee per
Sub per
Month
Comcast 9/30/2018
DirecTV 9/30/2019 4,408.48 0.06111 19,237.00 0.30398 15,229.29 0.23177 12,123.32 0.30873 13,125.24 0.11087 1,522.93 0.16535 16,631.99 0.22591 13,025.05 0.11979
DISH 9/30/2020 2,972.39 0.05820 12,970.43 0.28950 10,268.26 0.22073 8,174.08 0.29403 8,849.62 0.10559 1,026.83 0.15748 11,214.02 0.21516 8,782.07 0.11409
Time Warner Cable 9/30/2019 2,387.39 0.06111 10,417.71 0.30398 8,247.35 0.23177 6,565.33 0.30873 7,107.92 0.11087 824.74 0.16535 9,006.98 0.22591 7,053.66 0.11979
AT&T U-Verse 9/30/2020 1,298.04 0.05529 5,664.19 0.27503 4,484.15 0.20969 3,569.62 0.27933 3,864.63 0.10031 448.42 0.14960 4,897.16 0.20440 3,835.13 0.10838
Verizon FiOS 9/30/2018
Charter Communications 9/30/2020 925.65 0.05820 4,039.21 0.28950 3,197.71 0.22073 2,545.54 0.29403 2,755.92 0.10559 319.77 0.15748 3,492.23 0.21516 2,734.88 0.11409
Cox Communications 9/30/2018
Cablevision Systems Corp. 9/30/2018
Others 9/30/2018
Average Subscribers (000): 11,992 52,329 41,427 32,978 35,703 4,143 45,242 35,431
Subscriber Fee per Month ($): 0.05953 0.29614 0.22579 0.30077 0.10801 0.16109 0.22009 0.11670
Total Affliate Revenue ($000): 8,567 185,960 112,245 119,025 46,277 8,008 119,487 49,619
-
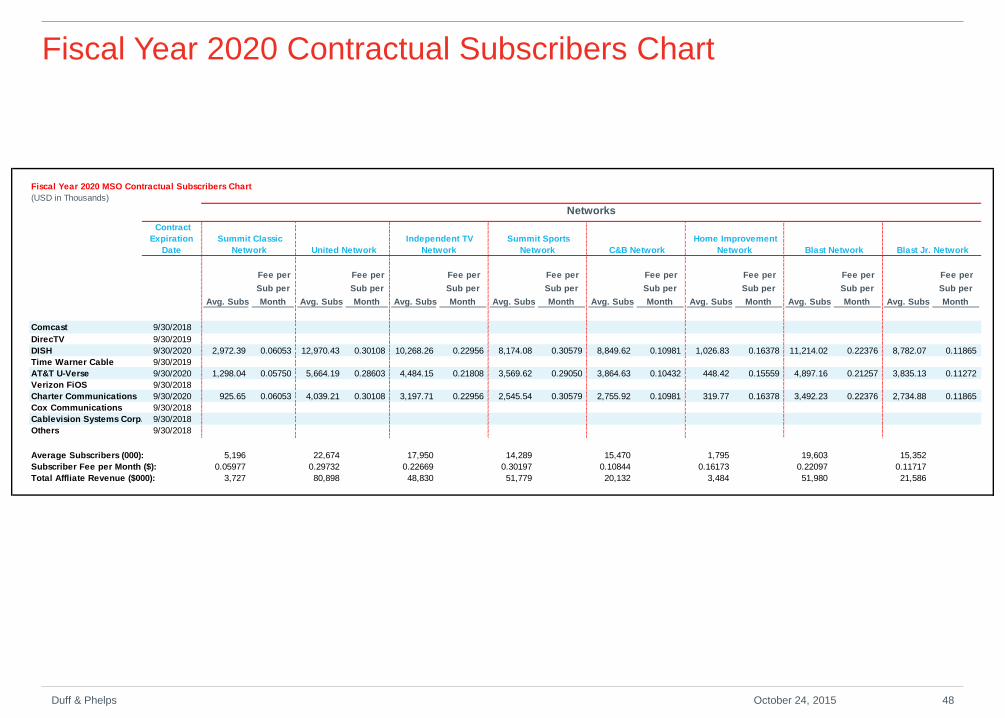
Fiscal Year 2020 Contractual Subscribers Chart
Duff & Phelps 48 October 24, 2015
Fiscal Year 2020 MSO Contractual Subscribers Chart
(USD in Thousands)
Networks
Contract
Expiration
Date
Summit Classic
Network United Network
Independent TV
Network
Summit Sports
Network C&B Network
Home Improvement
Network Blast Network Blast Jr. Network
Avg. Subs
Fee per
Sub per
Month Avg. Subs
Fee per
Sub per
Month Avg. Subs
Fee per
Sub per
Month Avg. Subs
Fee per
Sub per
Month Avg. Subs
Fee per
Sub per
Month Avg. Subs
Fee per
Sub per
Month Avg. Subs
Fee per
Sub per
Month Avg. Subs
Fee per
Sub per
Month
Comcast 9/30/2018
DirecTV 9/30/2019
DISH 9/30/2020 2,972.39 0.06053 12,970.43 0.30108 10,268.26 0.22956 8,174.08 0.30579 8,849.62 0.10981 1,026.83 0.16378 11,214.02 0.22376 8,782.07 0.11865
Time Warner Cable 9/30/2019
AT&T U-Verse 9/30/2020 1,298.04 0.05750 5,664.19 0.28603 4,484.15 0.21808 3,569.62 0.29050 3,864.63 0.10432 448.42 0.15559 4,897.16 0.21257 3,835.13 0.11272
Verizon FiOS 9/30/2018
Charter Communications 9/30/2020 925.65 0.06053 4,039.21 0.30108 3,197.71 0.22956 2,545.54 0.30579 2,755.92 0.10981 319.77 0.16378 3,492.23 0.22376 2,734.88 0.11865
Cox Communications 9/30/2018
Cablevision Systems Corp. 9/30/2018
Others 9/30/2018
Average Subscribers (000): 5,196 22,674 17,950 14,289 15,470 1,795 19,603 15,352
Subscriber Fee per Month ($): 0.05977 0.29732 0.22669 0.30197 0.10844 0.16173 0.22097 0.11717
Total Affliate Revenue ($000): 3,727 80,898 48,830 51,779 20,132 3,484 51,980 21,586
-