"Dude, where's my graph?" RDF Data Cubes for Clinical Trials Data
25
‘Dude, where’s my graph?’ RDF Data Cubes for Clinical Trials Data. PhUSE 2015, Vienna Part I: Graphing RDF with D3.js Tim Williams, UCB BioSciences Inc, USA [email protected] Part 2: Interactive Summary Tables Marc Andersen Stat Group ApS, Denmark [email protected]
-
Upload
marc-andersen -
Category
Data & Analytics
-
view
819 -
download
0
Transcript of "Dude, where's my graph?" RDF Data Cubes for Clinical Trials Data
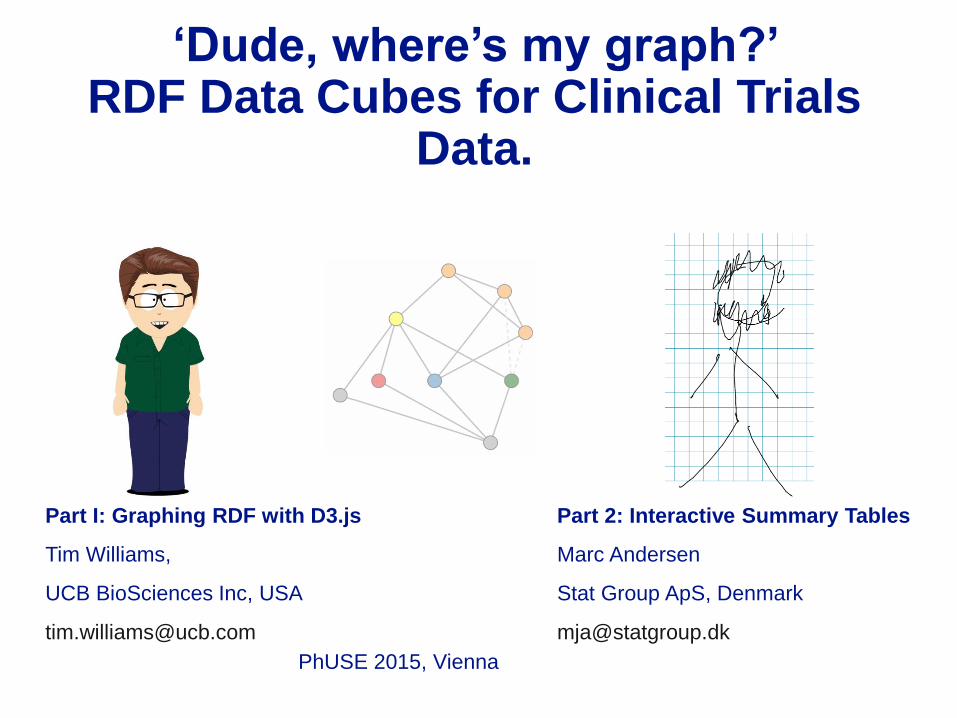
‘Dude, where’s my graph?’ RDF Data Cubes for Clinical Trials
Data.
PhUSE 2015, Vienna
Part I: Graphing RDF with D3.js
Tim Williams,
UCB BioSciences Inc, USA
Part 2: Interactive Summary Tables
Marc Andersen
Stat Group ApS, Denmark
TT07 PhUSE 2015 Vienna 12 Oct 2
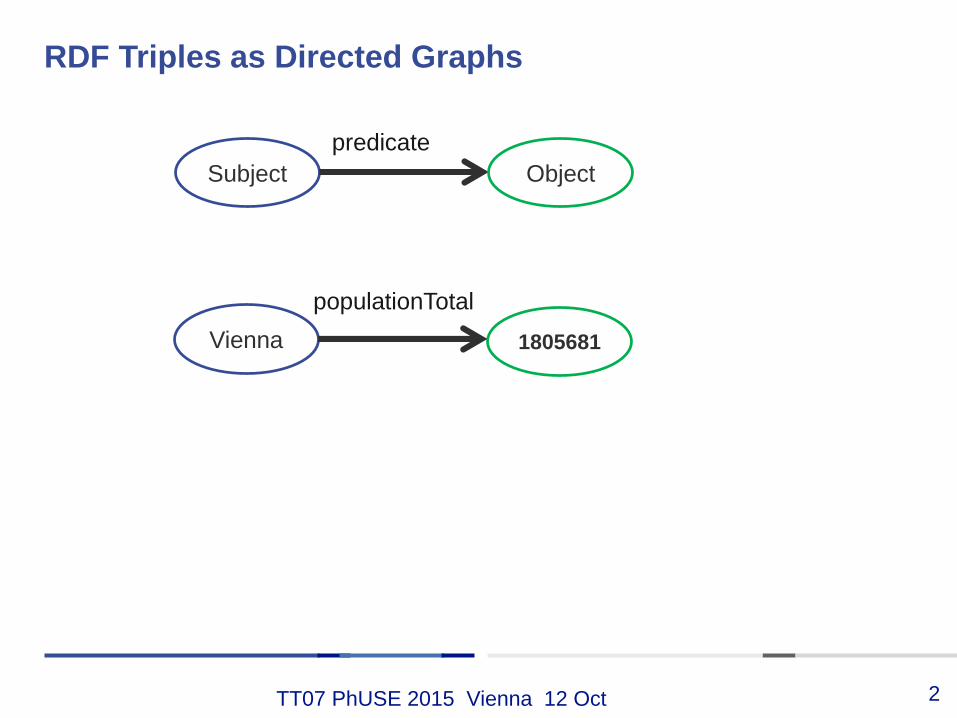
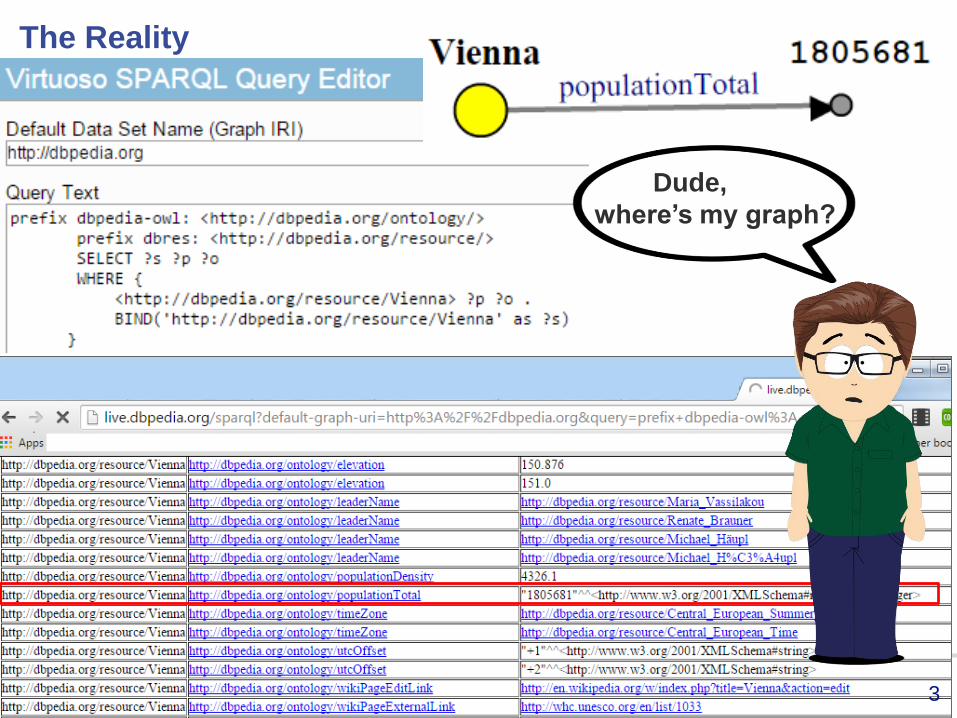
RDF Triples as Directed Graphs
Subject
predicate
Object
Vienna 1805681
populationTotal
TT07 PhUSE 2015 Vienna 12 Oct
The Reality
3
Dude,
where’s my graph?
TT07 PhUSE 2015 Vienna 12 Oct
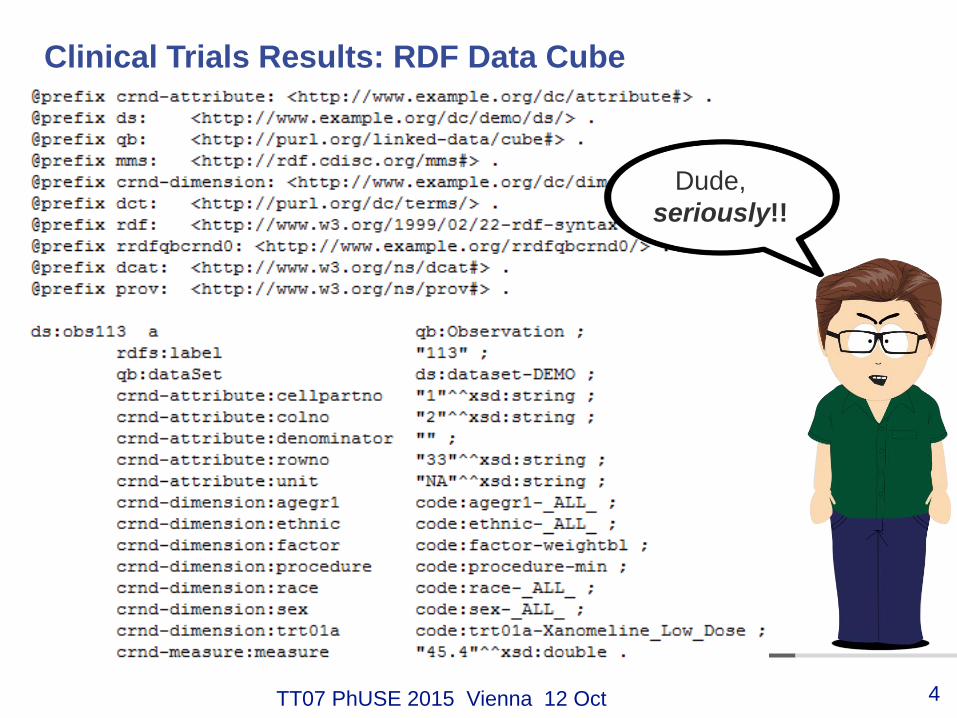
Clinical Trials Results: RDF Data Cube
4
Dude,
seriously!!
TT07 PhUSE 2015 Vienna 12 Oct
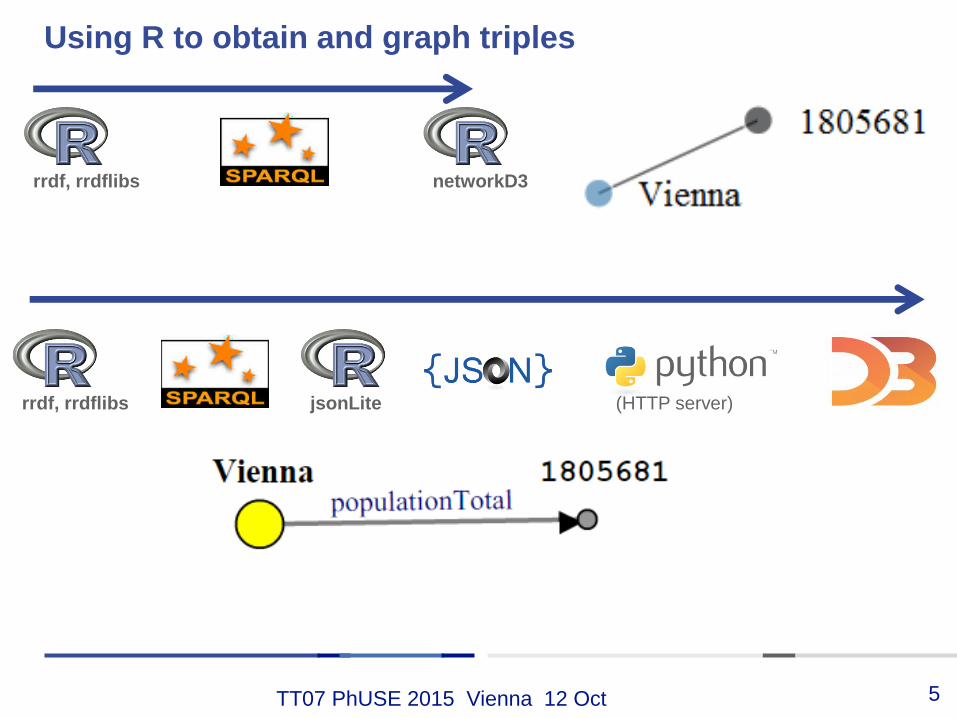
Using R to obtain and graph triples
5
rrdf, rrdflibs networkD3
rrdf, rrdflibs jsonLite (HTTP server)
TT07 PhUSE 2015 Vienna 12 Oct
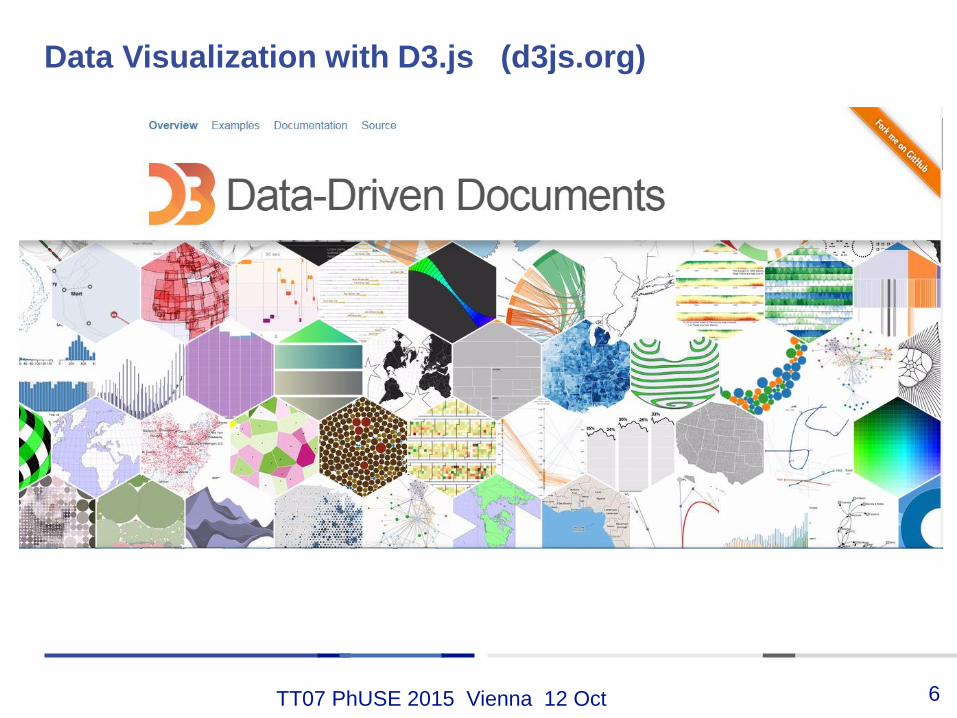
Data Visualization with D3.js (d3js.org)
6
TT07 PhUSE 2015 Vienna 12 Oct
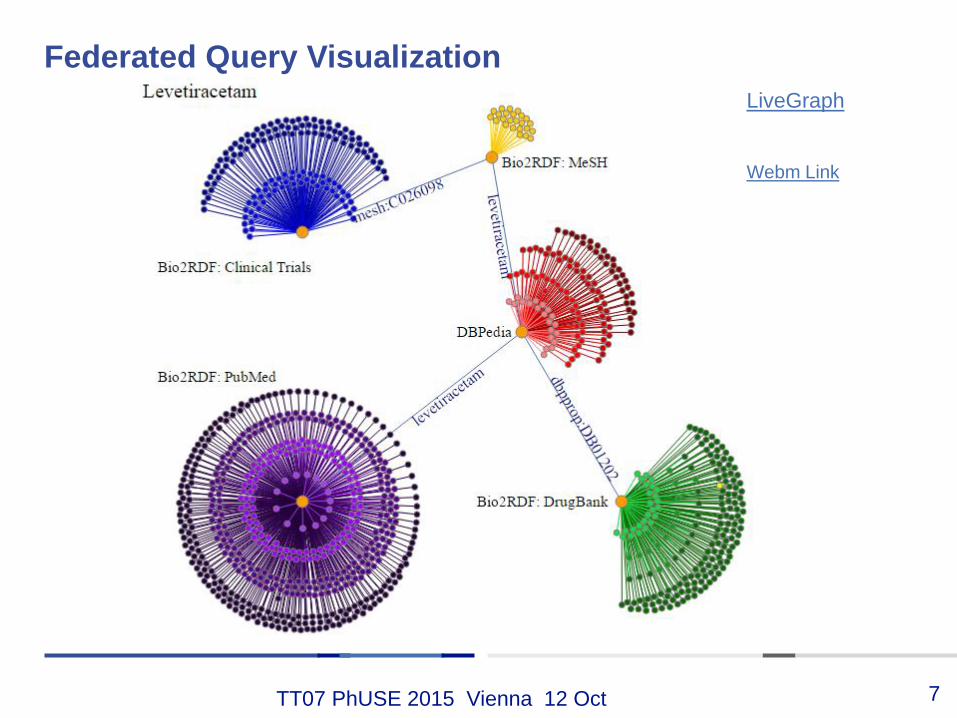
Federated Query Visualization
7
Webm Link
LiveGraph
TT07 PhUSE 2015 Vienna 12 Oct
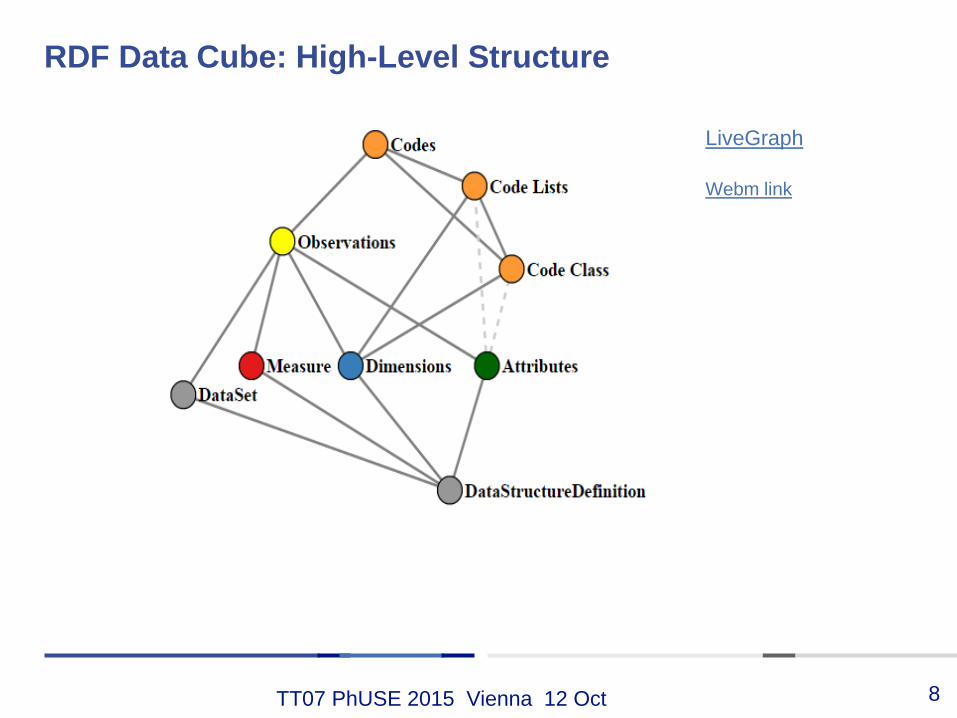
RDF Data Cube: High-Level Structure
8
Webm link
LiveGraph
TT07 PhUSE 2015 Vienna 12 Oct
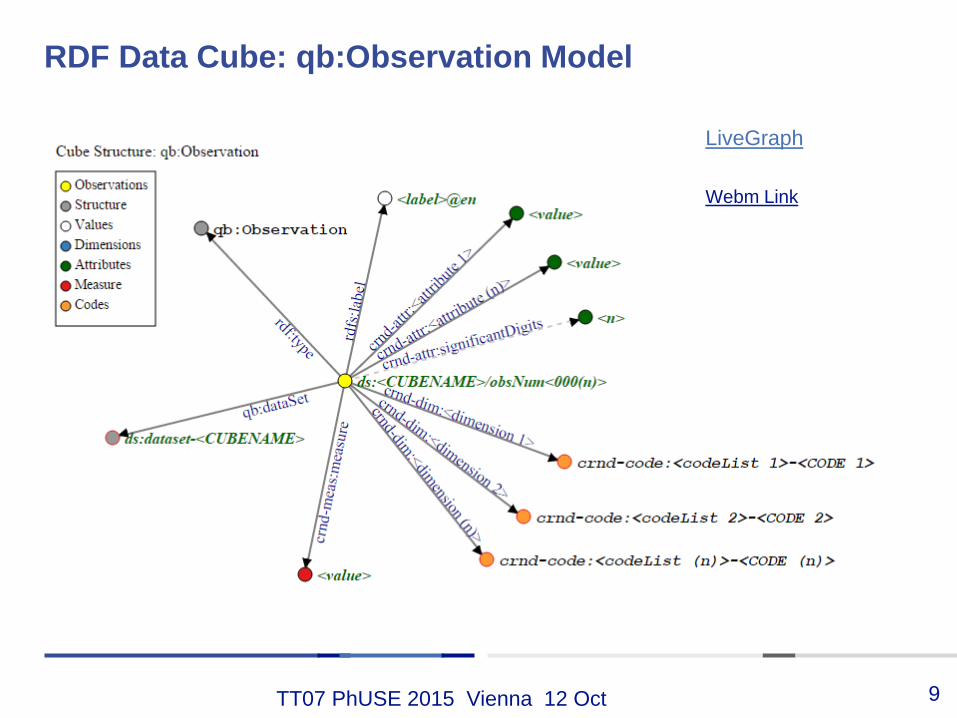
RDF Data Cube: qb:Observation Model
9
Webm Link
LiveGraph
TT07 PhUSE 2015 Vienna 12 Oct
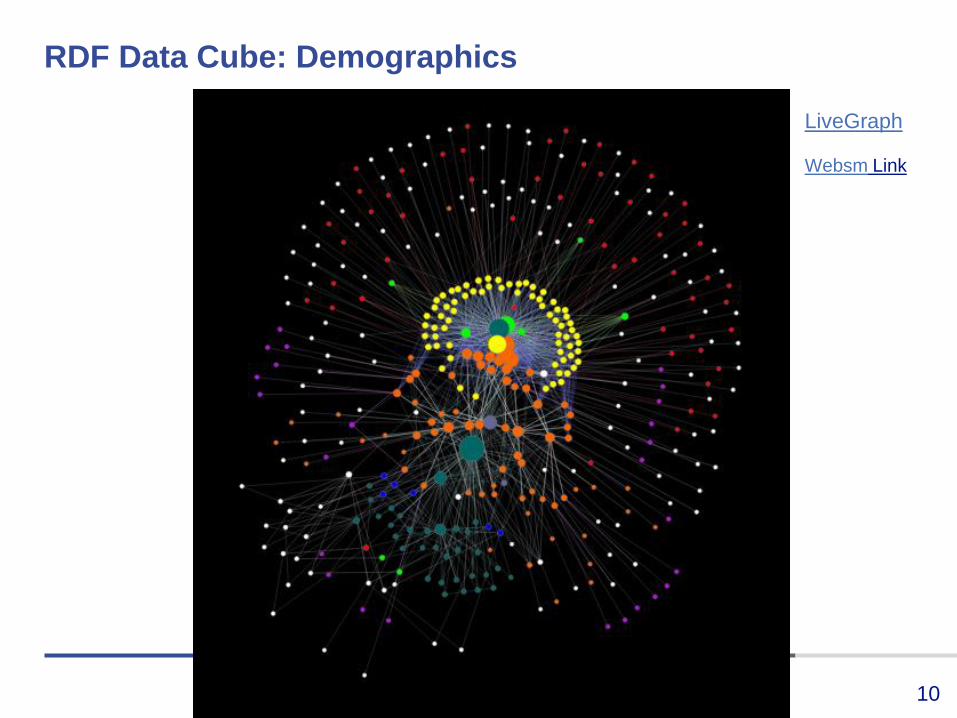
RDF Data Cube: Demographics
10
Websm Link
LiveGraph
TT07 PhUSE 2015 Vienna 12 Oct
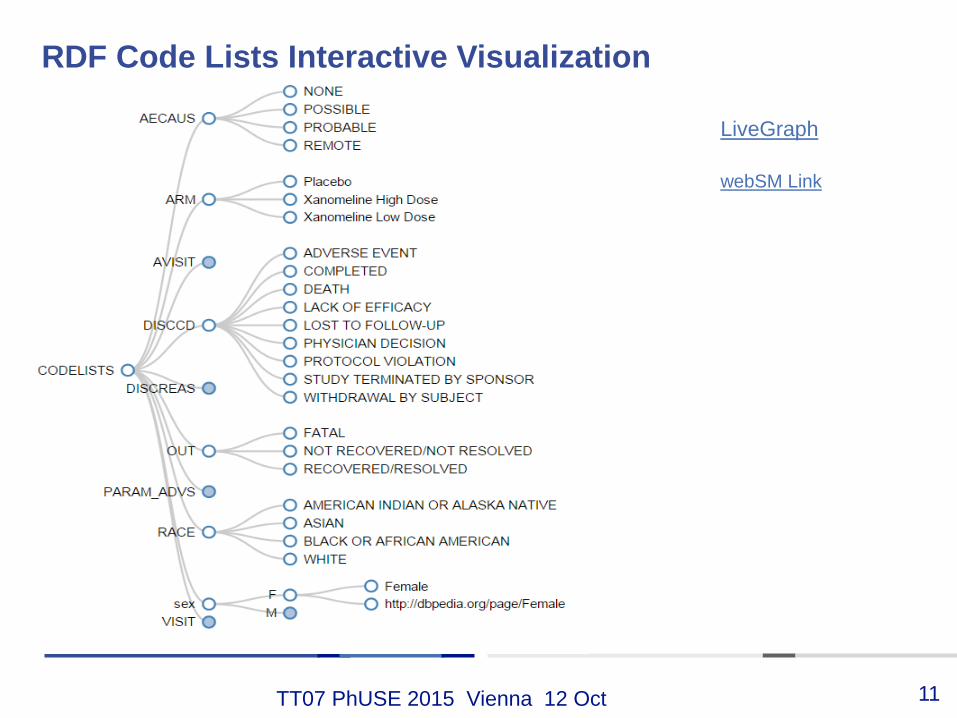
RDF Code Lists Interactive Visualization
11
webSM Link
LiveGraph
TT07 PhUSE 2015 Vienna 12 Oct 12
But there is more
than graphs!
Everything is a
graph!
TT07 PhUSE 2015 Vienna 12 Oct
Presented by Marc Andersen, StatGroup ApS
Part II : Interactive Summary Tables
13
TT07 PhUSE 2015 Vienna 12 Oct
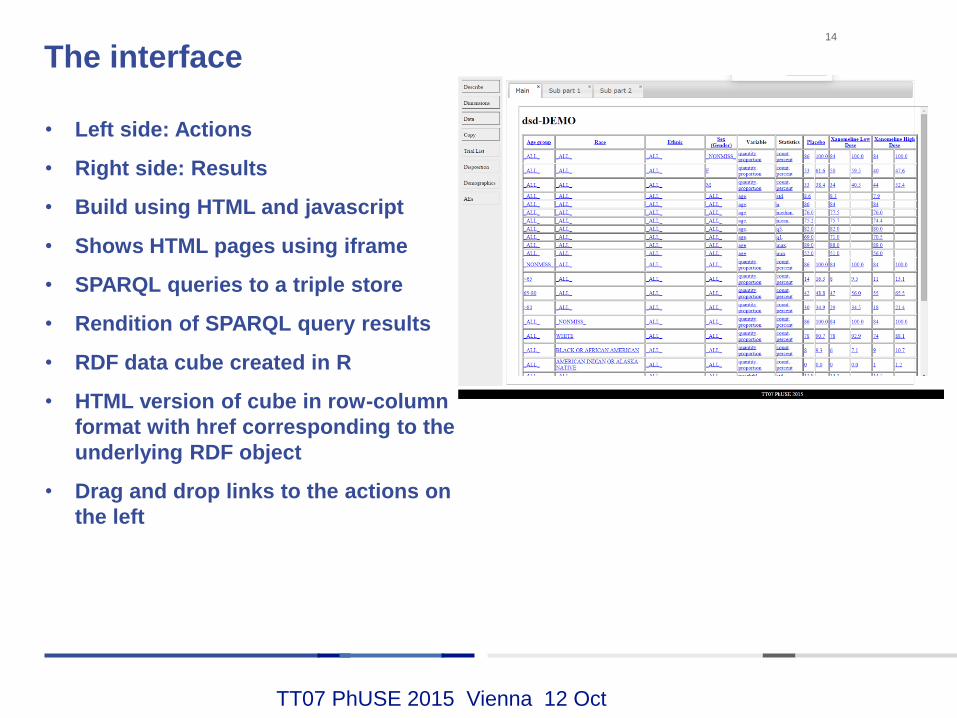
The interface
• Left side: Actions
• Right side: Results
• Build using HTML and javascript
• Shows HTML pages using iframe
• SPARQL queries to a triple store
• Rendition of SPARQL query results
• RDF data cube created in R
• HTML version of cube in row-column
format with href corresponding to the
underlying RDF object
• Drag and drop links to the actions on
the left
14
TT07 PhUSE 2015 Vienna 12 Oct
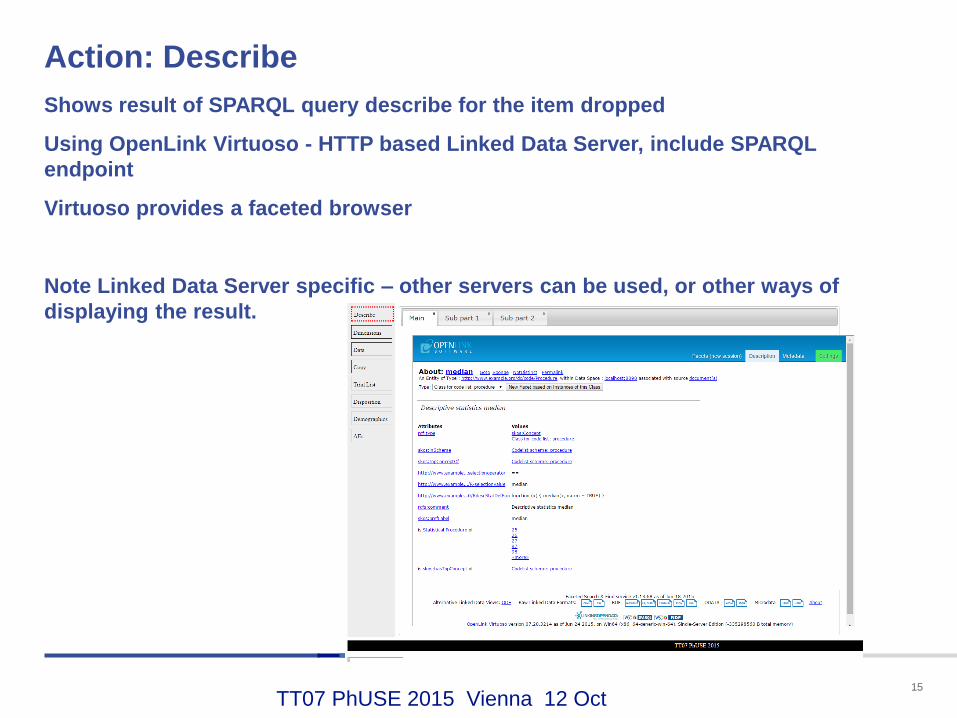
Action: Describe
15
Shows result of SPARQL query describe for the item dropped
Using OpenLink Virtuoso - HTTP based Linked Data Server, include SPARQL
endpoint
Virtuoso provides a faceted browser
Note Linked Data Server specific – other servers can be used, or other ways of
displaying the result.
TT07 PhUSE 2015 Vienna 12 Oct
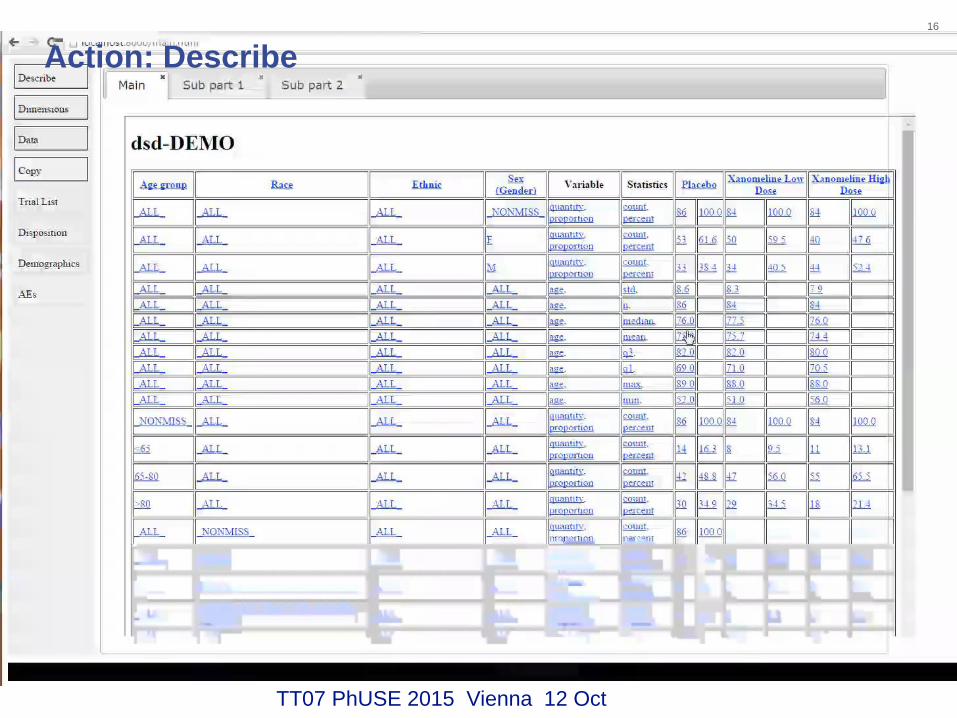
Action: Describe
16
TT07 PhUSE 2015 Vienna 12 Oct
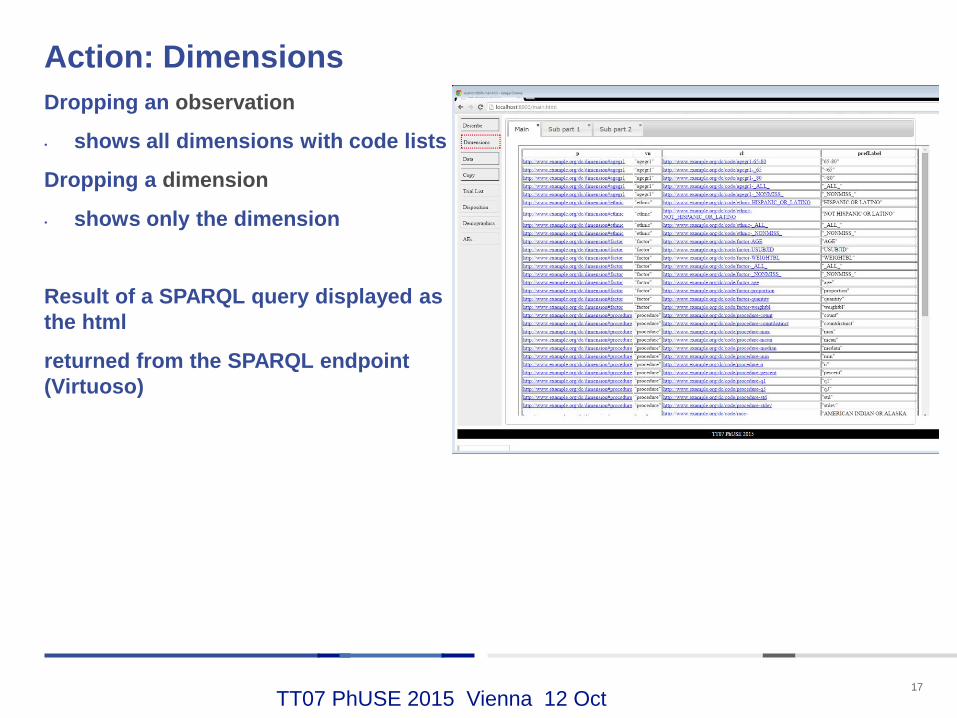
Action: Dimensions
17
Dropping an observation
• shows all dimensions with code lists
Dropping a dimension
• shows only the dimension
Result of a SPARQL query displayed as
the html
returned from the SPARQL endpoint
(Virtuoso)

TT07 PhUSE 2015 Vienna 12 Oct
Action: Dimensions
18
TT07 PhUSE 2015 Vienna 12 Oct
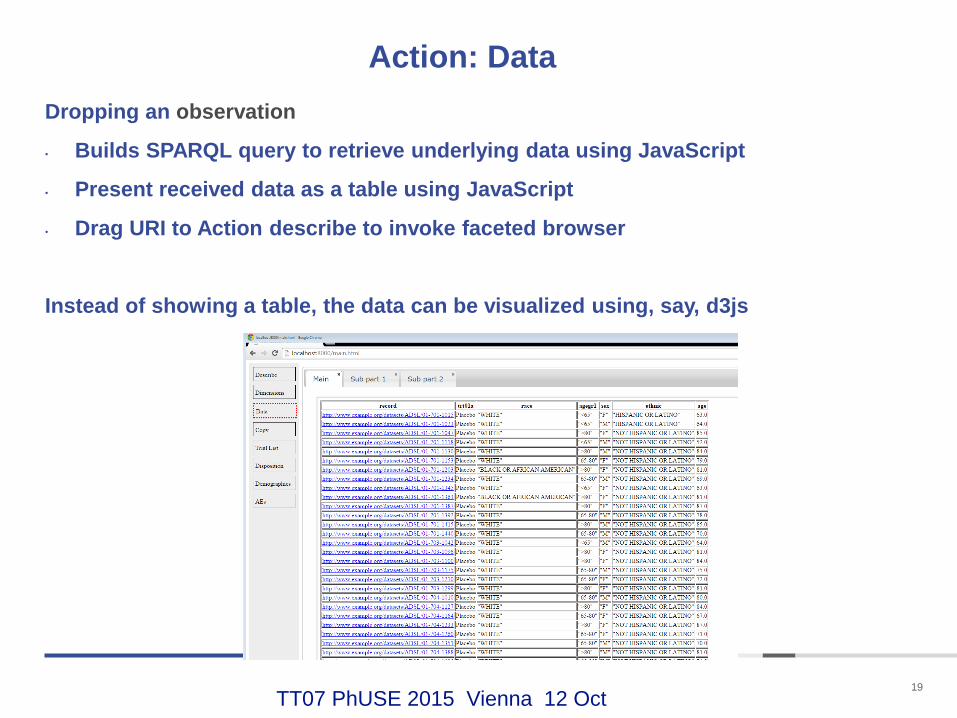
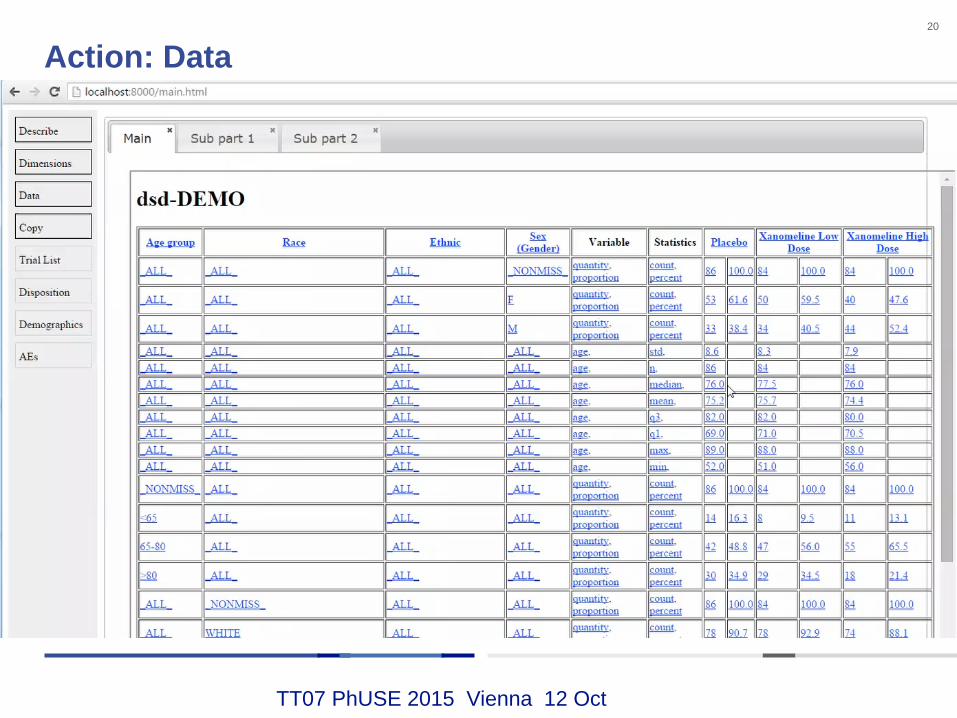
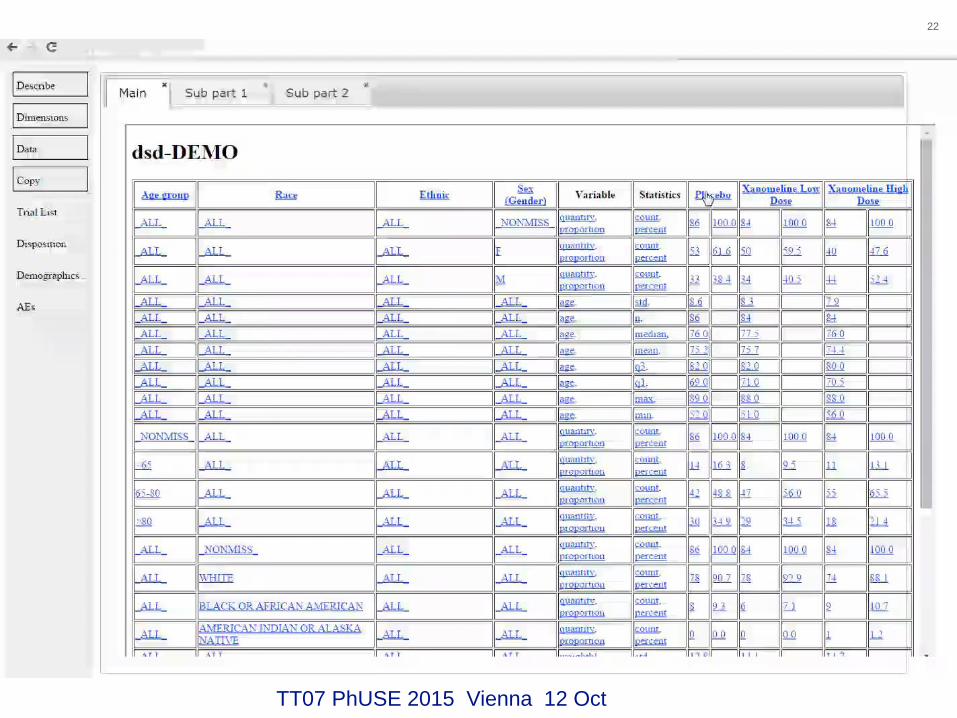
Action: Data
19
Dropping an observation
• Builds SPARQL query to retrieve underlying data using JavaScript
• Present received data as a table using JavaScript
• Drag URI to Action describe to invoke faceted browser
Instead of showing a table, the data can be visualized using, say, d3js
TT07 PhUSE 2015 Vienna 12 Oct
Action: Data
20
TT07 PhUSE 2015 Vienna 12 Oct
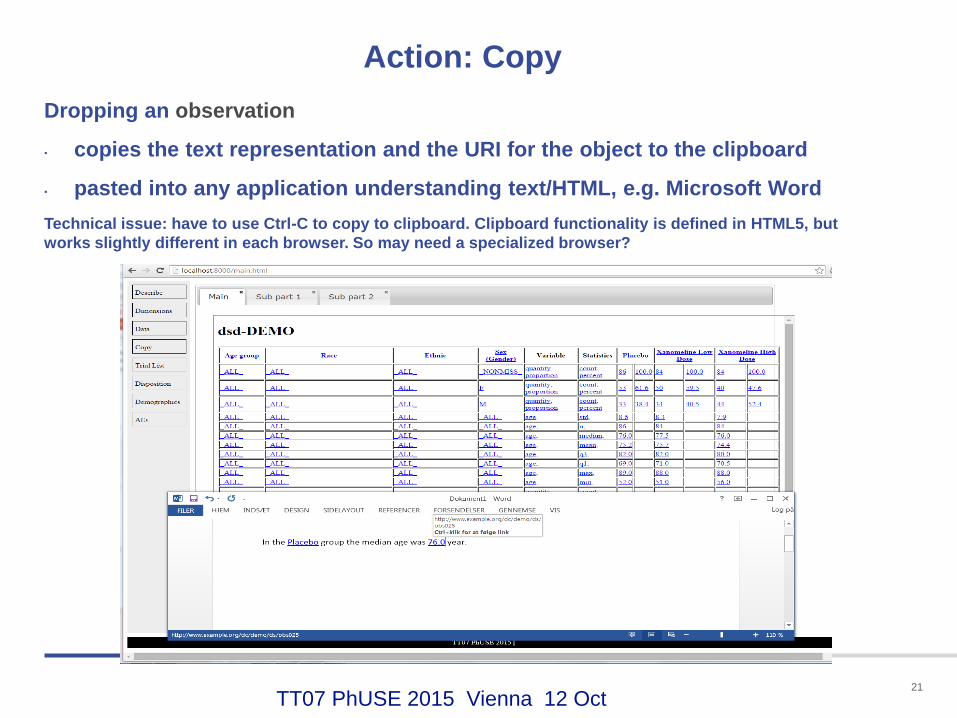
Action: Copy
21
Dropping an observation
• copies the text representation and the URI for the object to the clipboard
• pasted into any application understanding text/HTML, e.g. Microsoft Word
Technical issue: have to use Ctrl-C to copy to clipboard. Clipboard functionality is defined in HTML5, but
works slightly different in each browser. So may need a specialized browser?
TT07 PhUSE 2015 Vienna 12 Oct
Action: Copy
22
TT07 PhUSE 2015 Vienna 12 Oct
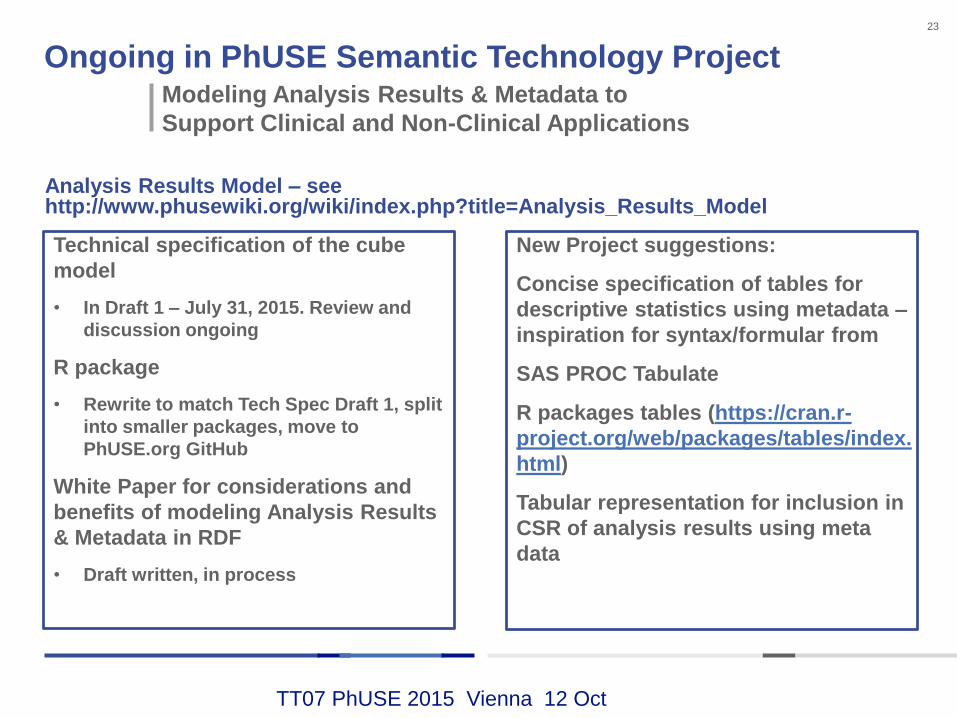
Ongoing in PhUSE Semantic Technology Project
Technical specification of the cube
model
• In Draft 1 – July 31, 2015. Review and
discussion ongoing
R package
• Rewrite to match Tech Spec Draft 1, split
into smaller packages, move to
PhUSE.org GitHub
White Paper for considerations and
benefits of modeling Analysis Results
& Metadata in RDF
• Draft written, in process
23
Analysis Results Model – seehttp://www.phusewiki.org/wiki/index.php?title=Analysis_Results_Model
Modeling Analysis Results & Metadata to
Support Clinical and Non-Clinical Applications
New Project suggestions:
Concise specification of tables for
descriptive statistics using metadata –
inspiration for syntax/formular from
SAS PROC Tabulate
R packages tables (https://cran.r-
project.org/web/packages/tables/index.
html)
Tabular representation for inclusion in
CSR of analysis results using meta
data
TT07 PhUSE 2015 Vienna 12 Oct
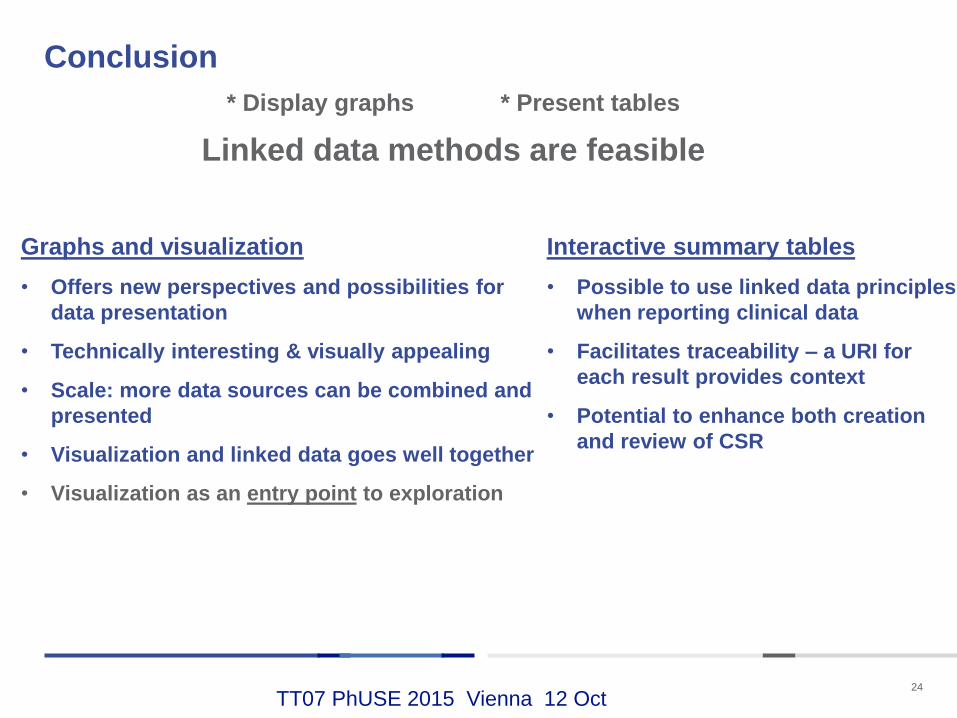
Conclusion
24
* Display graphs * Present tables
Linked data methods are feasible
Interactive summary tables
• Possible to use linked data principles
when reporting clinical data
• Facilitates traceability – a URI for
each result provides context
• Potential to enhance both creation
and review of CSR
Graphs and visualization
• Offers new perspectives and possibilities for
data presentation
• Technically interesting & visually appealing
• Scale: more data sources can be combined and
presented
• Visualization and linked data goes well together
• Visualization as an entry point to exploration
TT07 PhUSE 2015 Vienna 12 Oct 25
Thank you!
Part I: Graphing RDF with D3.js
Tim Williams,
UCB BioSciences Inc, USA
Part 2: Interactive Summary Tables
Marc Andersen
StatGroup ApS, Denmark