
DUCTILE FAILURE ANALYSIS OF API STEEL PIPE USING STRAIN ...
24
DUCTILE FAILURE ANALYSIS OF API STEEL PIPE USING STRAIN BASED FAILURE CRITERIA SITI FIRDAUS BINTI MD SALLEH Report submitted in partial fulfillment of the requirement for the award of the degree of Bachelor of Mechanical Engineering BACHELOR OF MECHANICAL ENGINEERING UNIVERSITI MALAYSIA PAHANG JUNE 2013
Transcript of DUCTILE FAILURE ANALYSIS OF API STEEL PIPE USING STRAIN ...
DUCTILE FAILURE ANALYSIS OF API STEEL PIPE
USING STRAIN BASED FAILURE CRITERIA
SITI FIRDAUS BINTI MD SALLEH
Report submitted in partial fulfillment of
the requirement for the award of the degree of
Bachelor of Mechanical Engineering
BACHELOR OF MECHANICAL ENGINEERING
UNIVERSITI MALAYSIA PAHANG
JUNE 2013
vii
ABSTRACT
This project was performed to propose ductile failure criteria as a function of the
stress triaxiality for the API X42 steel pipes. The objective of this project is to determine
the burst pressure of modeled pipe using strain based failure criteria. In this project,
uniaxial tension test was performed using three types of specimen. The specimen extracted
from API X42 5L steel pipe. The steel pipe was machined to desired dimension and obeys
the international standard of ASTM-E8 specimen. Three type of specimen which is smooth,
notch radius 1.5 mm, 3 mm and 6 mm prepared and undergoes uniaxial tension test. The
engineering stress-stress data retrieved from the test converted to the true stress-strain
curve. The true stress-strain data become as an input data to the simulation analysis. Initial
and final diameter of specimen was taken to calculate the strain fracture of the pipe. Stress
modified critical strain criteria were proposed by using the strain fracture. The findings of
the main parameter which is burst pressure predictions precede by using FEA software.
Finite Element analysis was performed by using MSC Patran/Marc 2008r1 software. In
MSC Patran, the API X 42 steel pipes was modeled. Burst pressure predicted compared to
the available industrial pipe design assessment in order to validate the obtained results.
viii
ABSTRAK
Projek ini telah dilaksanakan untuk mencadangkan kriteria kegagalan mulur sebagai
tekanan fungsi triaxiality untuk paip keluli API X42. Objektif projek ini adalah untuk
menentukan tekanan pecah paip dimodelkan menggunakan kriteria kegagalan berasaskan
ketegangan. Dalam projek ini, ujian ketegangan ekapaksi dilakukan dengan menggunakan
tiga jenis viiipecimen. Spesimen dikeluarkan dari API 5L X42 paip keluli. Ia telah dimesin
untuk menjadi contoh dan menurut standard antarabangsa ASTM-E8. Tiga jenis
viiipecimen yang licin, jejari bertakuk 1.5 mm, 3 mm dan 6 mm disediakan dan menjalani
ujian ketegangan ekapaksi. Data tegasan-terikan kejuruteraan dari ujian, ditukar kepada
graf tegasan-terikan benar. Data telah ditukar dijadikan sebagai input data untuk analisis
simulasi. Diameter awal dan akhir viiipecimen telah diambil untuk mengira patah tekanan
paip. Terikan kriteria tegasan kritikal yang diubahsuai telah dicadangkan dengan
menggunakan tekanan patah. Hasil parameter utama iaitu tekanan ramalan pecah telah
diteruskan dengan menggunakan perisian FEA. Analisis Unsur Terhingga dilakukan
dengan menggunakan MSC Patran / Marc perisian 2008r1. Dalam MSC Patran, API X 42
paip keluli telah dimodelkan. Bagi mengesahkan keputusan yang diperolehi, tekanan letus
yang diramalkan, dibandingkan dengan penilaian reka bentuk paip industry.
ix
TABLE OF CONTENT
Page
EXAMINER’S DECLARATION ii
SUPERVISOR’S DECLARATION iii
STUDENT’S DECLARATION iv
DEDICATION v
ACKNOWLEDGE MENT vi
ABSTRACT vii
ABSTRAK viii
TABLE OF CONTENT ix
LIST OF TABLE xii
LIST OF FIGURES xiii
LIST OF SYMBOLS xvi
LIST OF ABBREVIATIONS xvii
CHAPTER 1 INTRODUCTION
1.1 Research Background 1
1.2 Problem Statements 2
1.3 Objectives 2
1.4 Scopes of Study 3
CHAPTER 2 LITERATURE REVIEW
2.1 Introduction 4
2.2 Fundamental of API Pipe 4
2.3 Pipelines 5
2.3.1 Defects On Pipes 6
x
2.4 Engineering Stress-Strain Curves 9
2.5 True Stress-Strain curve 11
2.6 Finite Element Analysis 15
2.7 Failure Criteria 17
2.7.1 Stress Modified Failure Strain Criteria 17
CHAPTER 3 METHODOLOGY
3.1 Introduction 20
3.2 Research Flow Chart 20
3.3 Specimen Preparation 23
3.4 Machining Process 24
3.5 Uniaxial Tension Test 27
3.6 Simulation 31
3.6.1 Development of failure criteria equation 33
CHAPTER 4 RESULTS AND DISSCUSSION
4.1 Introduction 36
4.2 Uniaxial Tension Test Result 36
4.2.1 Results from Uniaxial Tension Test 36
4.2.2 Engineering Stress-Strain curve 42
4.2.3 Conversion of Engineering stress-strain curve 44
4.3 Materials 45
4.4 Finite Element Analysis 46
4.4.1 Determination of Stress Modified Critical Strain Criteria 47
4.4.2 FE Analysis Results 51
4.5 Effect of Corrosion Defect on Burst Pressure 56
4.5.1 Burst Pressure on Different Depth Defect 57
4.5.2 Burst Pressure on The Different Length Defect 58
4.5.3 Burst Pressure On The Different Width Defect 58
xi
4.6 Comparison of FEA to the Available Code 59
4.6.1Variation of Burst Pressure on the Different Length Defect 60
4.6.2Variation of Burst Pressure on the Different Depth Defect 61
4.6.3Variation of burst pressure on the Different Width Defect 63
CHAPTER 5 CONCLUSION
5.1 Conclusion 65
5.2 Recommendation 66
REFERENCES 67
APPENDICES
Appendix A 68
Appendix B 69
Appendix C 70
Appendix D 71
Appendix E 72
Appendix F 73
xii
LIST OF TABLES
Table No. Page
2.1 Chemical Composition of API X42 steel pipe 5
2.2 Mechanical Properties of API X42 steel pipe 5
3.1 The standard requirement in ASTM E8 procedures for smooth
specimens
23
3.2 The chemical composition of the material selected 29
3.3 Design of pipe defect for FEA 31
4.1 Final area of the specimen 41
4.2 Chemical Composition 45
4.3 Mechanical properties 46
4.4 Failure results CS1 52
4.5 Failure results CS2 52
4.6 Failure results CS3 53
4.7 Failure results CS4 53
4.8 Failure results CS5 54
4.9 Failure results CS6 54
4.10 Failure results CS7 55
4.11 Failure results CS8 55
4.12 Failure results CS9 56
4.13 Burst pressure result for each case 56
4.14 Variation of burst pressure on selected design code 59
xiii
LIST OF FIGURES
Figure No. Pages
2.1 External corrosion defect on pipe 6
2.2 Corrosion on the pipeline 8
2.3 The irregular length, width and depth of a typical corrosion
defect
9
2.4 Stress-strain curve 10
2.5 True stress-strain curve 14
2.6 FE meshes for notched tensile bars, (a) notch = 0.2R
(b) notch = 1.5R (c) notch 3R
15
2.7 Comparison of experimental engineering stress-strain data for
smooth tensile bars with FE results
16
2.8 Equivalent strain and stress triaxiality distribution of smooth
tensile bars
18
2.9 Stress triaxiality distribution 19
3.1 The process flow chart 22
3.2 The standard dimension for notch specimen 23
3.3 API X42 steel pipe 24
3.4 Band saw machine 24
3.5 Raw material of API X42 25
3.6 Conventional Milling machine for facing purpose 25
3.7 Standard specimen 26
3.8 Lathe machine 26
3.9 Cutting tool for notch shaping 27
3.10 Ready specimens 27
3.11 Profile projector machine 28
3.12 Spectrometer machine 28
3.13 Uniaxial tension test machine, INSTRON 29
3.14 Testing of the smooth specimen 30
xiv
3.15 Testing on the notch specimen 30
3.16 Tested specimen 30
3.17 Selecting the analysis type and start to build the pipe
coordinate
32
3.18 (a)The process of curving the coordinate (b) checking the
element of surface to ensure the next solid extrude will have
no element inside out
32
3.19 Meshed one-four pipe with the simulated corrosion defect 33
3.20 Pipe with simulated corrosion defect 34
4.1 Smooth specimen with d = 5.77mm 37
4.2 Smooth specimen with d = 5.82mm 37
4.3 Notched R1.5 with d = 6.41mm 38
4.4 Notched R1.5 with d = 6.09mm 38
4.5 Notched R3 with d = 6.30mm 39
4.6 Notched R3 with d = 6.2mm 39
4.7 Notched R6 with d = 6.24mm 40
4.8 Notched R6 with d = 6.22mm 40
4.9 Notched R6 d = 6.20mm 41
4.10 Engineering stress-strain graph 42
4.11 (a)Engineering stress-strain graph for notched specimen R1.5
(b) R3 (c) R6
43
4.12 Engineering stress-strain graph for notched R1.5, R3,R6 and
smooth specimen
44
4.13 True plastic stress-strain curve for API X42 45
4.14 Comparison of uniaxial tension test results to FE analysis 46
4.15 (a)Fracture strain vs. stress triaxiality for CS1 (b)CS2 (c)CS3
(d)CS4 (e)CS5 (f)CS6 (g)CS7 (h)CS8 (i)CS9
50
4.16 (a) strain deformation of CS1 pipe (b) Stress deformation 52
4.17 (a) strain deformation of CS2 pipe (b) Stress deformation 52
4.18 (a) strain deformation of CS3 pipe (b) Stress deformation 53
xv
4.19 (a) strain deformation of CS4 pipe (b) Stress deformation 53
4.20 (a) strain deformation of CS5 pipe (b) Stress deformation 54
4.21 (a) strain deformation of CS6 pipe (b) Stress deformation 54
4.22 (a) strain deformation of CS7 pipe (b) Stress deformation 55
4.23 (a) strain deformation of CS8 pipe (b) Stress deformation 55
4.24 (a) strain deformation of CS9 pipe (b) Stress deformation 56
4.25 Burst pressure vs. depth of defect 57
4.26 Burst pressure vs. length of defect 58
4.27 Burst pressure vs. width of defect 58
4.28 (a)Burst pressure vs. length of defect d/t = 0.2 (b) d/t = 0.4 (c)
d/t = 0.6
61
4.29 (a)Burst pressure vs. defect depth l = 50mm (b) l = 100mm
(c) l =150mm
63
4.30 Burst pressure vs. defect width for d/t = 0.2 (b) d/t 0.4
(c) d/t =0.6
65
xvi
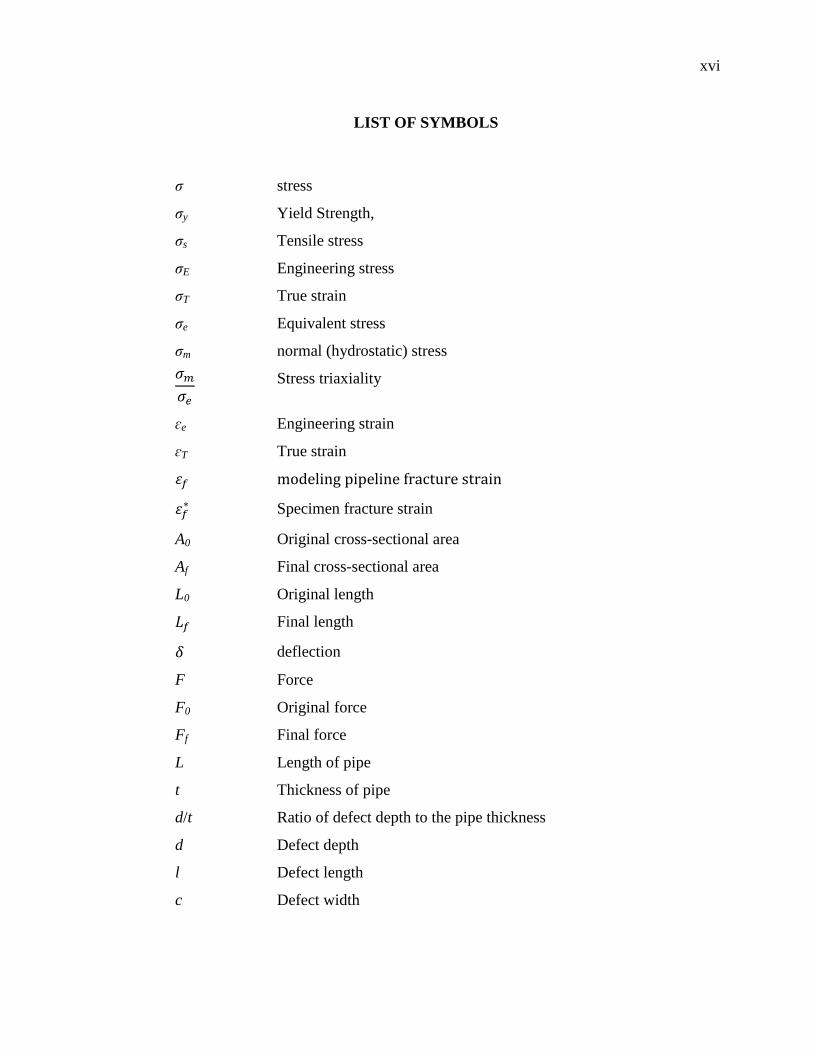
LIST OF SYMBOLS
σ stress
σy Yield Strength,
σs Tensile stress
σE Engineering stress
σT True strain
σe Equivalent stress
σm normal (hydrostatic) stress
Stress triaxiality
ɛe Engineering strain
ɛT True strain
Specimen fracture strain
A0 Original cross-sectional area
Af Final cross-sectional area
L0 Original length
Final length
deflection
F Force
F0 Original force
Ff Final force
L Length of pipe
t Thickness of pipe
d/t Ratio of defect depth to the pipe thickness
d Defect depth
l Defect length
c Defect width
xvii
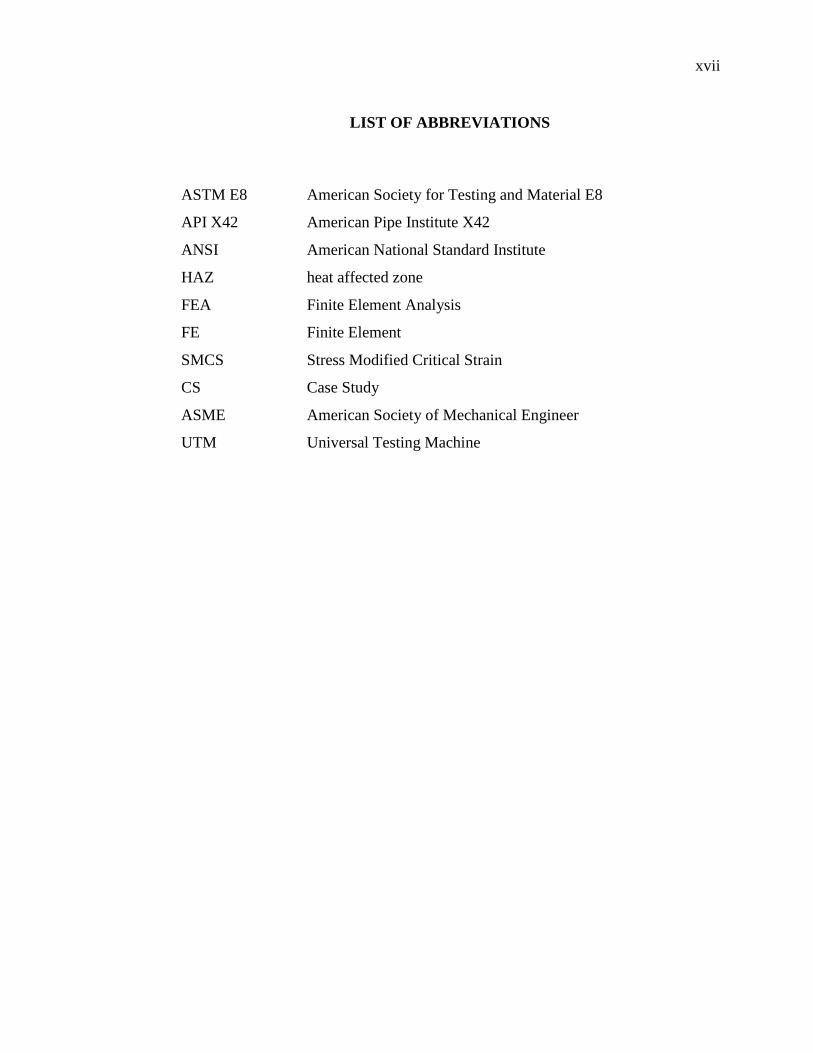
LIST OF ABBREVIATIONS
ASTM E8 American Society for Testing and Material E8
API X42 American Pipe Institute X42
ANSI American National Standard Institute
HAZ heat affected zone
FEA Finite Element Analysis
FE Finite Element
SMCS Stress Modified Critical Strain
CS Case Study
ASME American Society of Mechanical Engineer
UTM Universal Testing Machine
CHAPTER 1
INTRODUCTION
1.1 RESEARCH BACKGROUND
The long-distance pipeline for transportation of the natural gas, one of the green energy
resources, is now under construction in the world wide range, due mainly to the expensive
requirement of the energy resources. One of the major difficulties is that, usually, the
production area is far from the usage area, resulting in higher transportation cost of the
natural gas, although this has been known for many years.
In additions, underground gas pipelines are often subject to damages due to
surroundings environment such as corrosion, and the third party accidents such as dents and
gouges. The negligence by the human factor will cause those defect. The high costs of
maintenance have to be provided to ensure the smooth transportation of the gas.
The installation cost for the thus steel gas pipe higher than the cost of the pipe itself. To
minimize those excessive cost, lots of analysis have been proposed and running over a
decade. Lots of efforts give to ensure the last longer of the gas transportation’s
performance.
The study was focusing on API X42 steel pipe material. Three type of sample specimen
were machine according to the Tensile testing standard requirement. Tensile test has been
performed on the selected material to determine the engineering stress – strain curve. Then,
detailed elastic–plastic, finite element analyses perform to simulate tensile tests specimens
and thus to determine variations of the triaxial stress and strain.
2
1.2 PROBLEM STATEMENT
Nowadays, the fitness-for-service analyses of underground gas pipelines, engineering
assessment methods against possible effects need to be developed, it will prevent such as
corrosion, gouges and dents defects type. Thus possible causes may not distress in a day,
but it will bounce on results in few years which consist of extraordinary maintenance cost.
Nothing that, typical gas pipelines are made of sufficiently ductile materials, the net-
section limit load approach can be used, where a damaged pipe is assumed to fail at the
load when the net section is in the fully plastic state. Meanwhile, design of pipelines is one
of the important processes in developing the engineering structure. During design stage,
few processes were involved such as analysis of deflections, stress analysis, cost reliability
and others.
Stress analysis appears as a crucial process for many engineering structure fail due to
lack of consideration on the analysis. One of the important parameters involve in stress
analysis is uniaxial fracture strain. The failure on engineering structure normally predicted
based on maximum stress that withstand the structure. Unfortunately, the fracture strain
becomes critical to be determined.
1.3 PROJECT OBJECTIVES
The research proposes ductile failure criteria as a function of the stress triaxiality for
the API X42 steel pipes. Smooth and notched tensile rods with three notch radii are tested
to determine parameter of ductile failure criteria. The strain based failure criteria will be
applied for failure prediction of the defective API steel pipes. For this purpose, the strain-
based criterion will be developing in advance. Otherwise, the burst pressure will be
determined for different defect dimension.
3
1.4 SCOPES OF STUDY
The scopes of research are as follows:
i. Preparation of both smooth and notched specimens
ii. Uniaxial Tension test- at room temperature obey the ASTM E8
iii. Finite Element Analysis
MSC PATRAN/MARC
Non-linear
Homogeneous material
iv. Validations - Compare result between equation and available industrial codes
for pipelines defect assessment.
CHAPTER 2
LITERATURE REVIEW
2.1 INTRODUCTION
This chapter will provide the detail descriptions literature review done accordingly
to tittle of ductile failure analysis of API steel pipe on strain-based failure criteria.
Literature regarding any development or experiment about fracture strain and state of stress
is useful in this project. This chapter will explain about the fundamentals of API X42 steel
pipes, pipelines, engineering stress-strain curve, true stress-strain curve, finite element
analysis, and failure criteria that available in this project.
2.2 FUNDAMENTAL OF X 42 API STEEL PIPES
The material used in this study was API X42 steel. Specimens for uniaxial tensile
test were extracted in longitudinal direction from pipe. Table 2.1 and 2.2 shows the
chemical compositions and mechanical properties of API X42
5
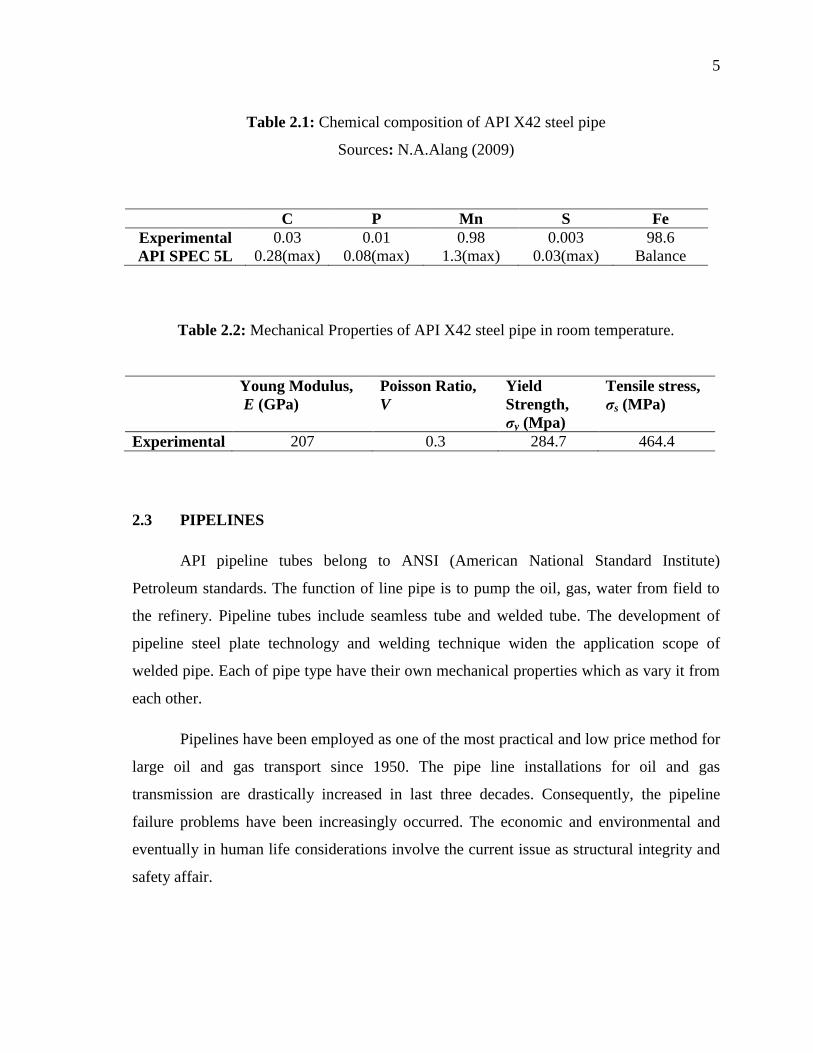
Table 2.1: Chemical composition of API X42 steel pipe
Sources: N.A.Alang (2009)
C P Mn S Fe
Experimental
API SPEC 5L
0.03
0.28(max)
0.01
0.08(max)
0.98
1.3(max)
0.003
0.03(max)
98.6
Balance
Table 2.2: Mechanical Properties of API X42 steel pipe in room temperature.
Young Modulus,
E (GPa)
Poisson Ratio,
V
Yield
Strength,
σy (Mpa)
Tensile stress,
σs (MPa)
Experimental 207 0.3 284.7 464.4
2.3 PIPELINES
API pipeline tubes belong to ANSI (American National Standard Institute)
Petroleum standards. The function of line pipe is to pump the oil, gas, water from field to
the refinery. Pipeline tubes include seamless tube and welded tube. The development of
pipeline steel plate technology and welding technique widen the application scope of
welded pipe. Each of pipe type have their own mechanical properties which as vary it from
each other.
Pipelines have been employed as one of the most practical and low price method for
large oil and gas transport since 1950. The pipe line installations for oil and gas
transmission are drastically increased in last three decades. Consequently, the pipeline
failure problems have been increasingly occurred. The economic and environmental and
eventually in human life considerations involve the current issue as structural integrity and
safety affair.
6
2.3.1 Defects on Pipes
The explosive characteristics of gas provide high wakefulness about the structural
integrity. Therefore, the reliable structural integrity and safety of oil and gas pipelines
under various service conditions including presence of defects should be warily evaluated.
The external defects, corrosion defects, gouge, foreign object scratches, and pipeline
erection activities are major failure reasons of gas pipelines.
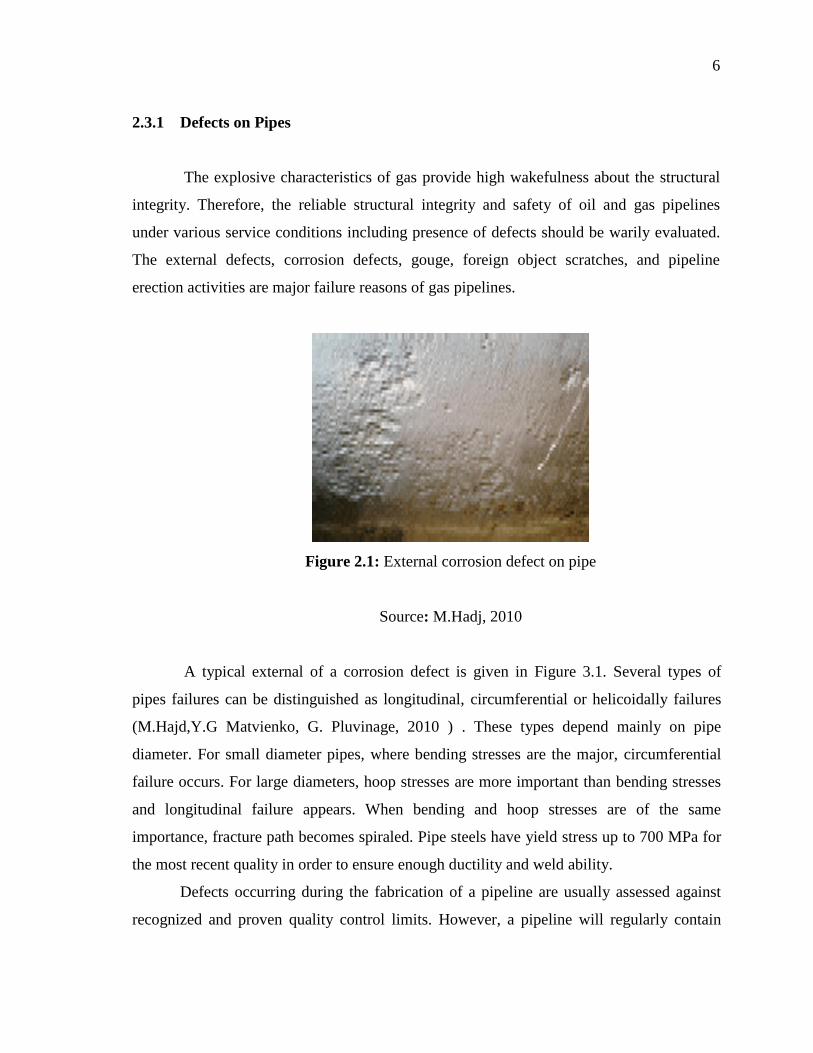
Figure 2.1: External corrosion defect on pipe
Source: M.Hadj, 2010
A typical external of a corrosion defect is given in Figure 3.1. Several types of
pipes failures can be distinguished as longitudinal, circumferential or helicoidally failures
(M.Hajd,Y.G Matvienko, G. Pluvinage, 2010 ) . These types depend mainly on pipe
diameter. For small diameter pipes, where bending stresses are the major, circumferential
failure occurs. For large diameters, hoop stresses are more important than bending stresses
and longitudinal failure appears. When bending and hoop stresses are of the same
importance, fracture path becomes spiraled. Pipe steels have yield stress up to 700 MPa for
the most recent quality in order to ensure enough ductility and weld ability.
Defects occurring during the fabrication of a pipeline are usually assessed against
recognized and proven quality control limits. However, a pipeline will regularly contain
7
larger defects at some stage during its life and these will require a fitness- for-purpose
assessment to determine whether or not to repair the pipeline.
Line pipe steels is generally tough and ductile. Initiation and propagation of a part-
wall flaw through the wall occurs under a ductile fracture mechanism, involving some
combination of plastic flow and crack initiation and ductile tearing, involving a process of
void nucleation, growth and coalescence. The relative importance of plastic flow and crack
initiation and tearing depends on the toughness of the material and the geometry of the
defect.
As the toughness decreases the burst strength of a defect will decrease. As the
toughness increases the burst strength of a defect will increase, but tending towards an
upper limit corresponding to the plastic collapse limit state, where failure occurs due to
plastic flow .Therefore, if the toughness is greater than some minimum value then the
failure of a defect will be controlled by plastic collapse and only knowledge of the tensile
properties of the material is required to predict the burst strength.
Corrosion is an electrochemical process. It is a time dependent mechanism and
depends on the local environment within or adjacent to the pipeline. Corrosion usual
appears as either general corrosion or localized (pitting) corrosion. There are many different
types of corrosion, including galvanic corrosion, microbiologically induced corrosion, AC
corrosion, differential soils, differential aeration and cracking. Corrosion causes metal loss.
It can occur on the internal or external surfaces of the pipe, in the base material, the
seam weld, the girth weld, and or the associated heat affected zone (HAZ). Internal and
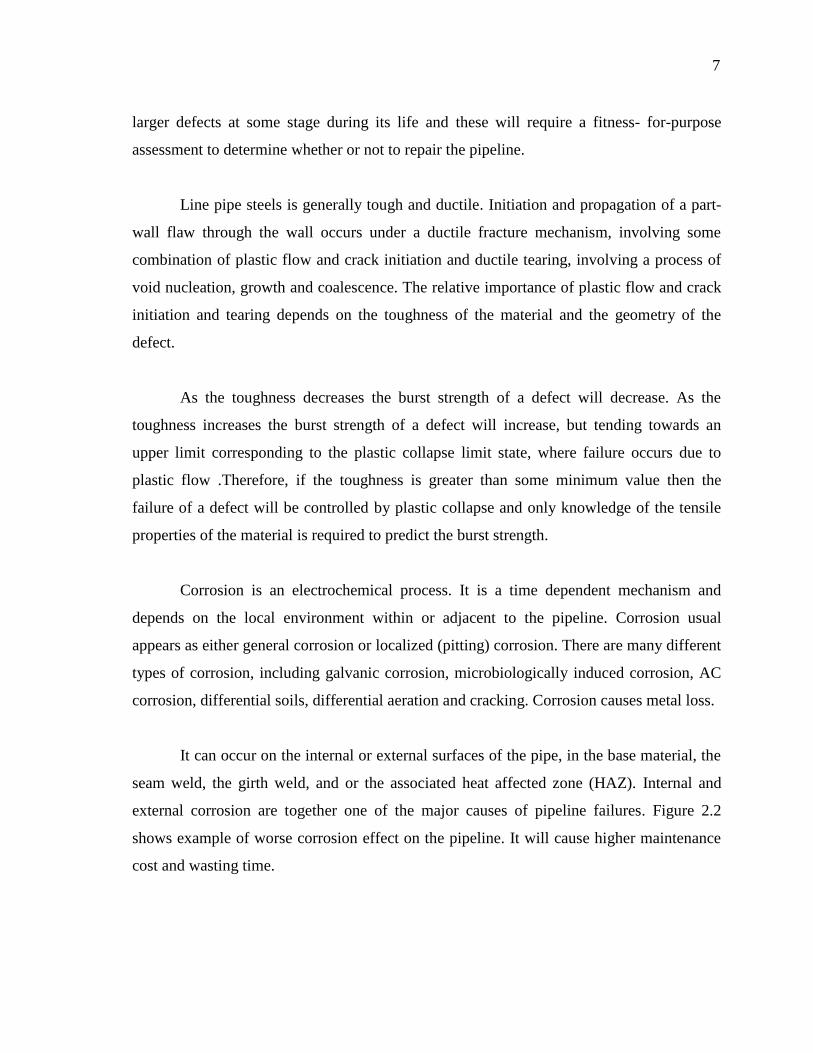
external corrosion are together one of the major causes of pipeline failures. Figure 2.2
shows example of worse corrosion effect on the pipeline. It will cause higher maintenance
cost and wasting time.
8
Figure 2.2: Corrosion on the pipeline
Sources: M.Hajd, 2010
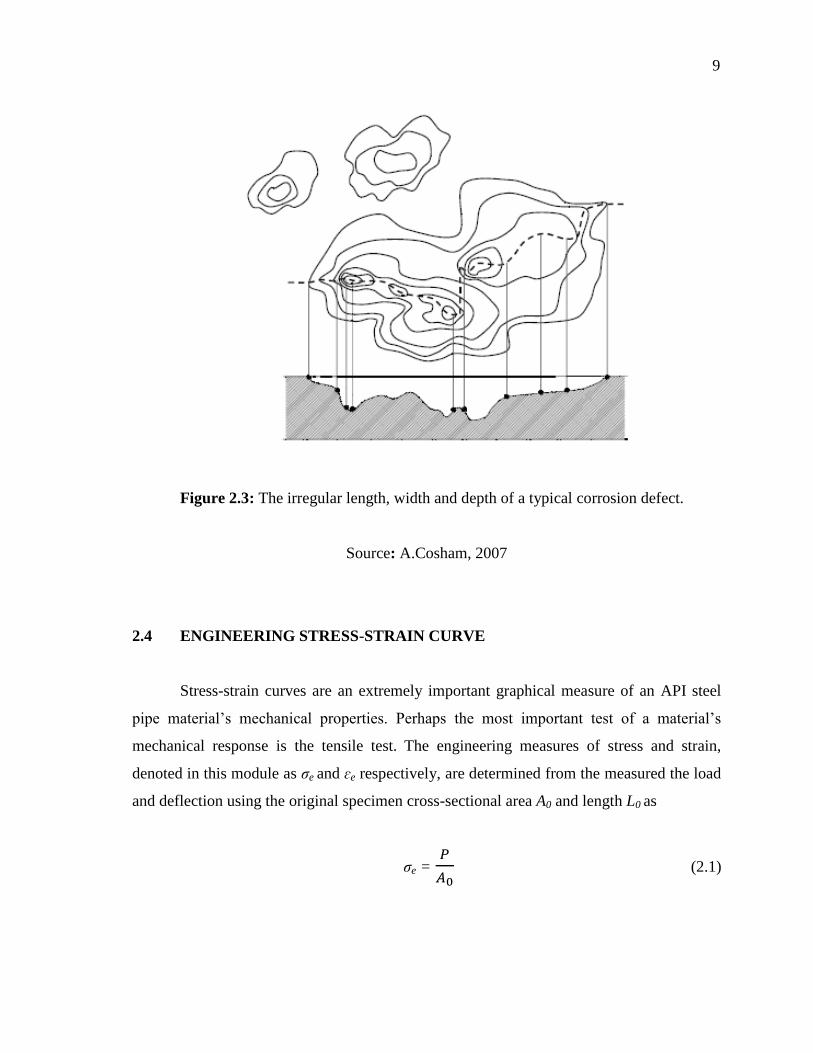
Corrosion in a pipeline may be difficult to characterize. Typically, it will have an
irregular depth profile and extend in irregular pattern in both longitudinal and
circumferential directions it may occur as a single defect or as a cluster of adjacent defects
separated by full thickness (uncorroded) material.
There are no clear definitions of different types of corrosion defects. The simplest
and perhaps most widely recognized definitions are as pitting corrosion. It defined as
corrosion with a length and width less than or equal to three times the uncorroded wall
thickness. While, general corrosion, defined as corrosion with a length and width greater
than three times the uncorroded wall thickness.
9
Figure 2.3: The irregular length, width and depth of a typical corrosion defect.
Source: A.Cosham, 2007
2.4 ENGINEERING STRESS-STRAIN CURVE
Stress-strain curves are an extremely important graphical measure of an API steel
pipe material’s mechanical properties. Perhaps the most important test of a material’s
mechanical response is the tensile test. The engineering measures of stress and strain,
denoted in this module as σe and ɛe respectively, are determined from the measured the load
and deflection using the original specimen cross-sectional area A0 and length L0 as
σe =
(2.1)

10
ɛe =
(2.2)
When the stress σe is plotted against the strain ɛe, a typical engineering stress-strain curve
such as that shown in figure 2.4 is obtained.
Figure 2.4: Stress-strain curve
Sources: David, 2001
As strain is increased, many materials eventually deviate from this linear
proportionality, the point of departure being termed the proportional limit. This nonlinearity
is usually associated with stress-induced “plastic” flow in the specimen. Here the material is
undergoing a rearrangement of its internal molecular or microscopic structure, in which
atoms are being moved to new equilibrium positions. This plasticity requires a mechanism
for molecular mobility, which in crystalline materials can arise from dislocation motion.
Materials lacking this mobility, for instance by having internal microstructures that block
11
dislocation motion, are usually brittle rather than ductile. The stress-strain curves for brittle
materials are typically linear over their full range of strain, eventually terminating in
fracture without appreciable plastic flow. The stress needed to increase the strain beyond
the proportional limit in a ductile material continues to rise beyond the proportional limit;
the material requires an ever-increasing stress to continue straining, a mechanism termed
strain hardening.
These microstructural rearrangements associated with plastic flow are usually not
reversed when the load is removed, so the proportional limit is often the same as or at least
close to the material’s elastic limit. Elasticity is the property of complete and immediate
recovery from an imposed displacement on release of the load, and the elastic limit is the
value of stress at which the material experiences a permanent residual strain that is not lost
on unloading. The residual strain induced by a given stress can be determined by drawing
an unloading line from the highest point reached on the curve at that stress back to the strain
axis.
Until the neck forms, the deformation is essentially uniform throughout the
specimen, but after necking all subsequent deformation takes place in the neck. The neck
becomes smaller and smaller, local true stress increasing all the time, until the specimen
fails. This will be the failure mode for most ductile metals. As the neck shrinks, the
nonuniform geometry there alters the uniaxial stress state to a complex one involving shear
components as well as normal stresses.
2.5 TRUE STRESS STRAIN CURVE
While stress testing, the stress-strain curve is a graphical representation of the
relationship between stress, obtained from measuring the load applied on the sample.
Meanwhile, strain derived from measuring the deformation of the sample. The nature of the
curve varies depends on the type of materials. Strain describes quantitatively the degree of
deformation of a body. It is measured most commonly with extensometers and strain
gauges. For uniaxial deformation strain can be expressed as
12
ɛe =
(2.3)
Where
ɛe = engineering strain
= original length of the undeformed specimen
= final length of the deformed specimen
Based on this definition, if a sample were stretched such that Lf = 2L0, the tensile
engineering strain would be 100%. On the other hand, if a sample were compressed to the
limit such that Lf = 0, the compressive engineering strain would again be 100%. These
extreme examples show that for large strain the definition of equation (2.3) is not
meaningful.
For purely elastic deformation stresses are uniquely defined by the final
configuration of a material, regardless of how this final state is reached. Because of the
presence of irreversible elements in the deformation a plastic analysis has to follow the path
along which the final configuration is reached. So that, the total deformation is generally
divide into small increments.
Considering the uniaxial case, let dL be the incremental change in gauge length and L the
gauge length at the beginning of that increment. Then, the corresponding strain increment
becomes
dɛ =
(2.4)
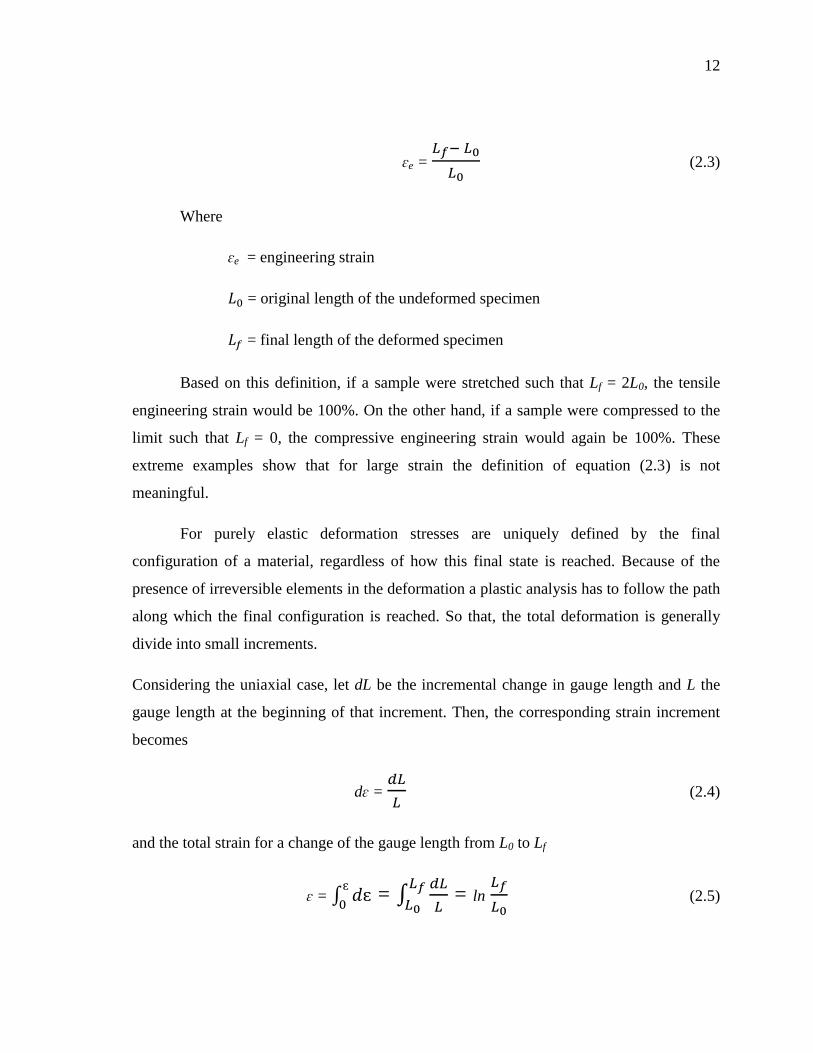
and the total strain for a change of the gauge length from L0 to Lf
ɛ = ∫
= ∫
= ln
(2.5)