Duck lastweek10
13
Duck Last Wind Vane
-
Upload
kafanomsod -
Category
Business
-
view
179 -
download
0
Transcript of Duck lastweek10
Duck Last
Wind Vane
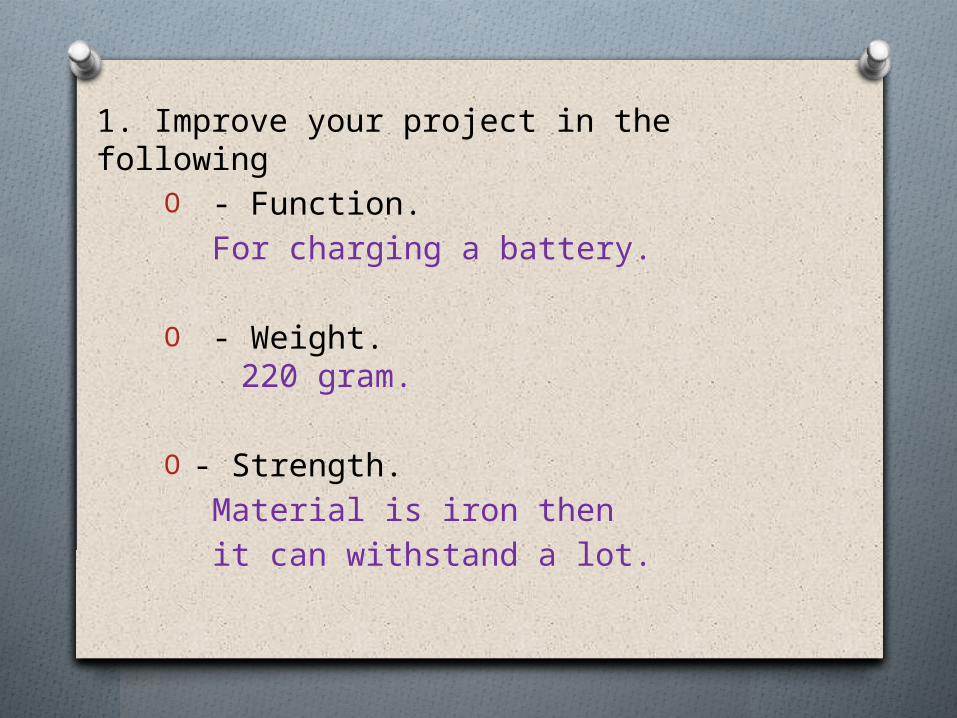
1. Improve your project in the following
O - Function.For charging a battery.
O - Weight.220 gram.
O - Strength.Material is iron thenit can withstand a lot.

O - AppearanceWe paint color.
O - Ease of useActing clamp that can be used
and stored easily.

2. Find out the key features of your product by answering the following questions: O - What are the problems that your
product can solve?We want to take advantage the
winds through us useless while driving.
O - What are the main benefits or advantages that your product has?
The main benefit is charging a battery.

Compare with product with similar products.
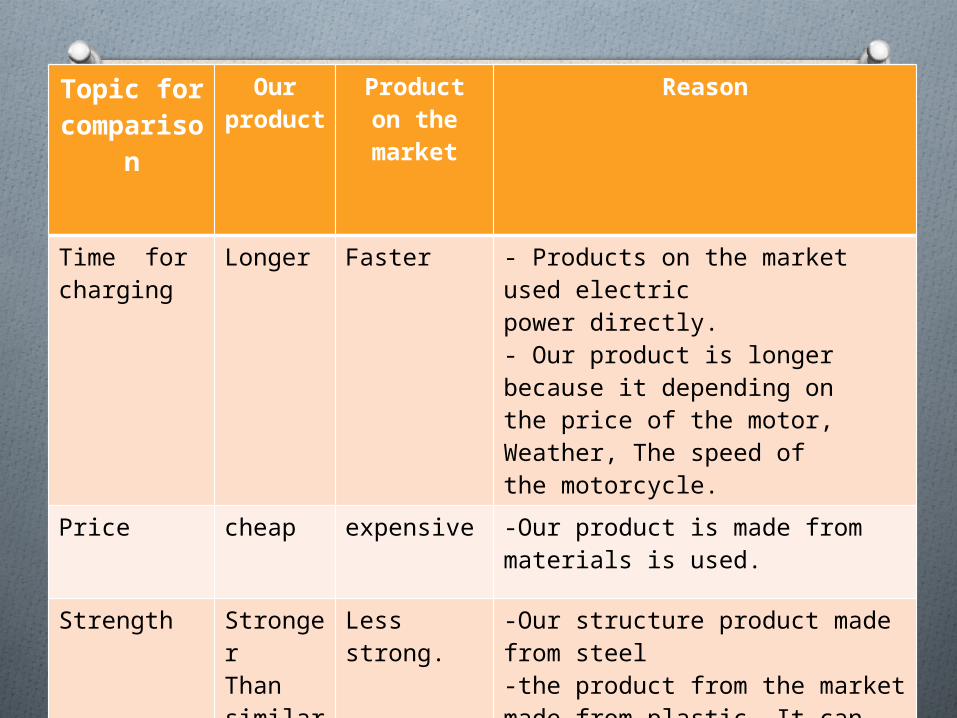
Topic for comparis
on
Our produc
t
Product on the market
Reason
Time for charging
Longer Faster - Products on the market used electric power directly.- Our product is longer because it depending on the price of the motor,Weather, The speed of the motorcycle.
Price cheap expensive -Our product is made from materials is used.
Strength Stronger Than similar product.
Less strong.
-Our structure product made from steel-the product from the market made from plastic. It can impede force is less.

3. For each key feature of your product, carry out the
experiment based on the scientific method:
Our experimental results was completed.It shows appropriate sized blade.

RUN Factor ค่�าค่วามต่�างศักย์�ที่��วดได� (Volt) Avg. Total
มอเตอร์�(A)
ใบพัด(B
)
จำ �นวนใบพัด (C)
1
2 3 4
1 (1) - - - 0.83 0.77 0.87 0.84 0.83 3.31
2 (A) + - - 1.07 1.08 1.05 1.05 1.06 4.25
3 (B) - + - 0.85 0.92 0.81 0.86 0.86 3.44
4 (AB)
+ + - 1.04 1.06 1.09 1.02 1.05 4.21
5 (C) - - + 0.62 0.59 0.63 0.58 0.60 2.42
6 (AC)
+ - + 0.91 0.85 0.89 0.87 0.88 3.52
7 (BC)
- + + 0.37 0.39 0.34 0.35 0.37 1.45
8 (ABC)
+ + + 0.47 0.56 0.53 0.49 0.51 2.05
Record the name of the experimental results 23 factorial

OThe results showed that 1 small propeller blades was the best
performance.

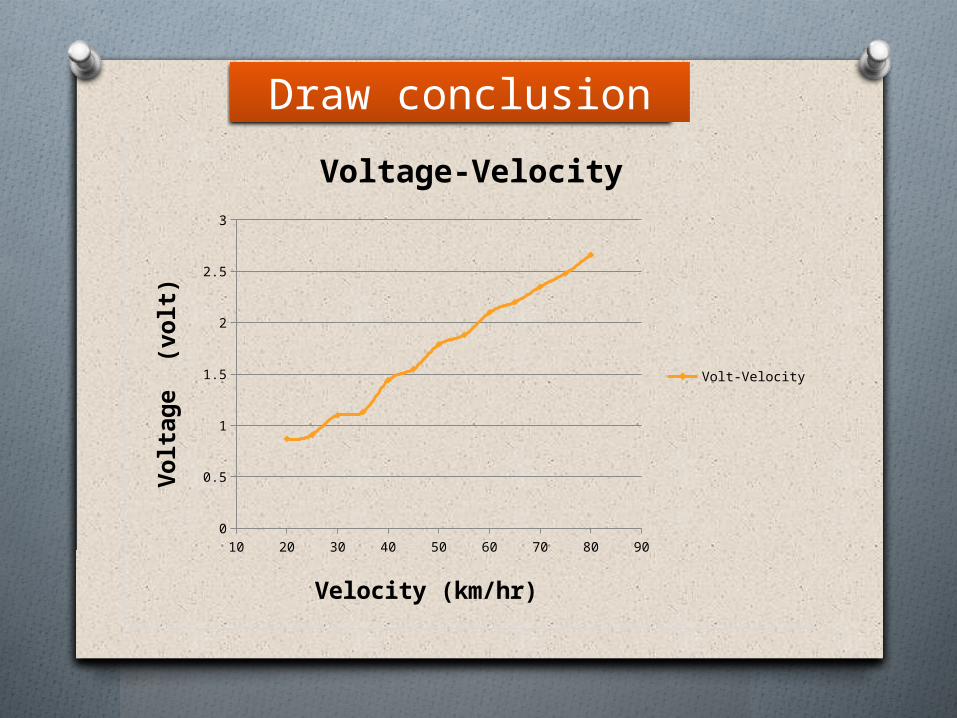
O - Test Test the product with environment and plot graph Velocity and Voltage result.
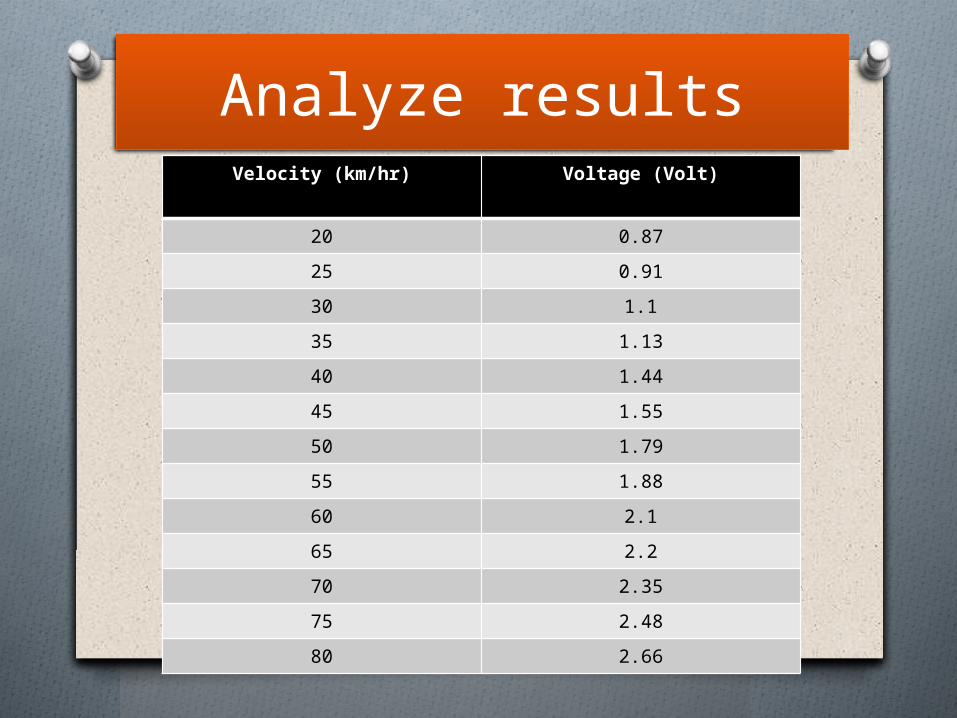
Analyze results Velocity (km/hr) Voltage (Volt)
20 0.87
25 0.91
30 1.1
35 1.13
40 1.44
45 1.55
50 1.79
55 1.88
60 2.1
65 2.2
70 2.35
75 2.48
80 2.66
10 20 30 40 50 60 70 80 900
0.5
1
1.5
2
2.5
3
Voltage-Velocity
Volt-Velocity
Velocity (km/hr)
Volt
ag
e (v
olt
)
Draw conclusion

THANK YOU