€ducation and Finances SIVOA / Het Baken, Almere Netherlands.
32
-
Upload
margaretmargaret-little -
Category
Documents
-
view
213 -
download
0
Transcript of €ducation and Finances SIVOA / Het Baken, Almere Netherlands.


€€ducation and Financesducation and Finances
SIVOA / Het Baken, Almere SIVOA / Het Baken, Almere NetherlandsNetherlands
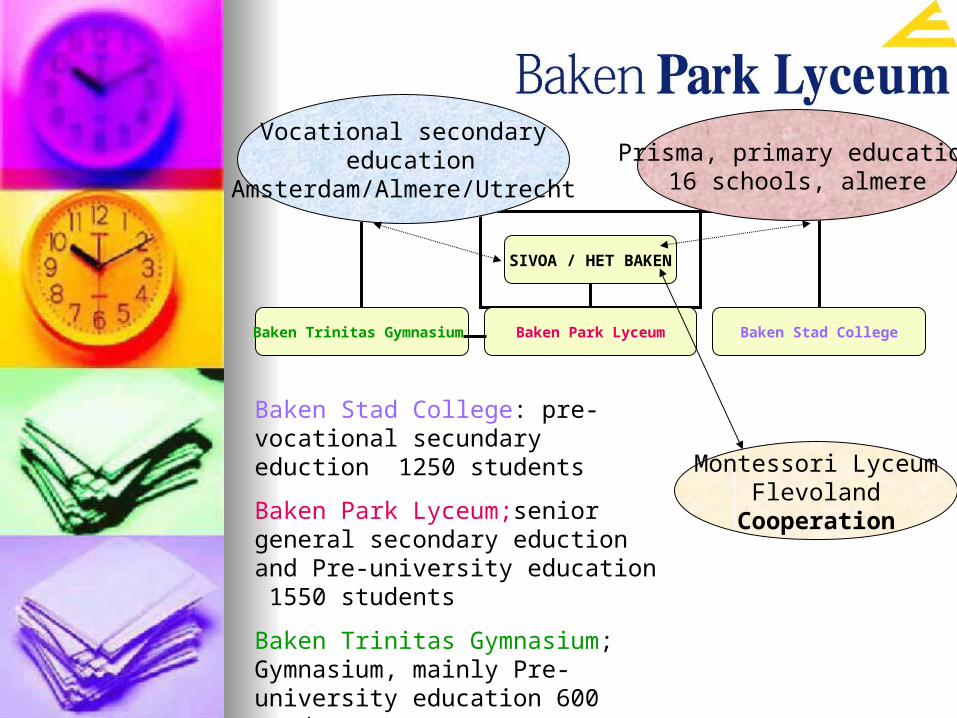
SIVOA / HET BAKEN
Baken Trinitas Gymnasium Baken Park Lyceum Baken Stad College
Prisma, primary education16 schools, almere
Montessori LyceumFlevoland
Cooperation
Vocational secondary education
Amsterdam/Almere/Utrecht
Baken Stad College: pre-vocational secundary eduction 1250 students
Baken Park Lyceum;senior general secondary eduction and Pre-university education 1550 students
Baken Trinitas Gymnasium; Gymnasium, mainly Pre-university education 600 students
SIVOA: School-Foundation

1 supervisory board1 supervisory board
STAFF: 384 peopleSTAFF: 384 people
Management Management Teachers Teachers Supporting (to education) StaffSupporting (to education) Staff

--managementmanagement
1 governor, general director S 161 governor, general director S 16
4 school directors S 144 school directors S 14
1 director operations 1 director operations ** ** S 14S 14
15 team managers S 1215 team managers S 12
S = Salary functions managementS = Salary functions management
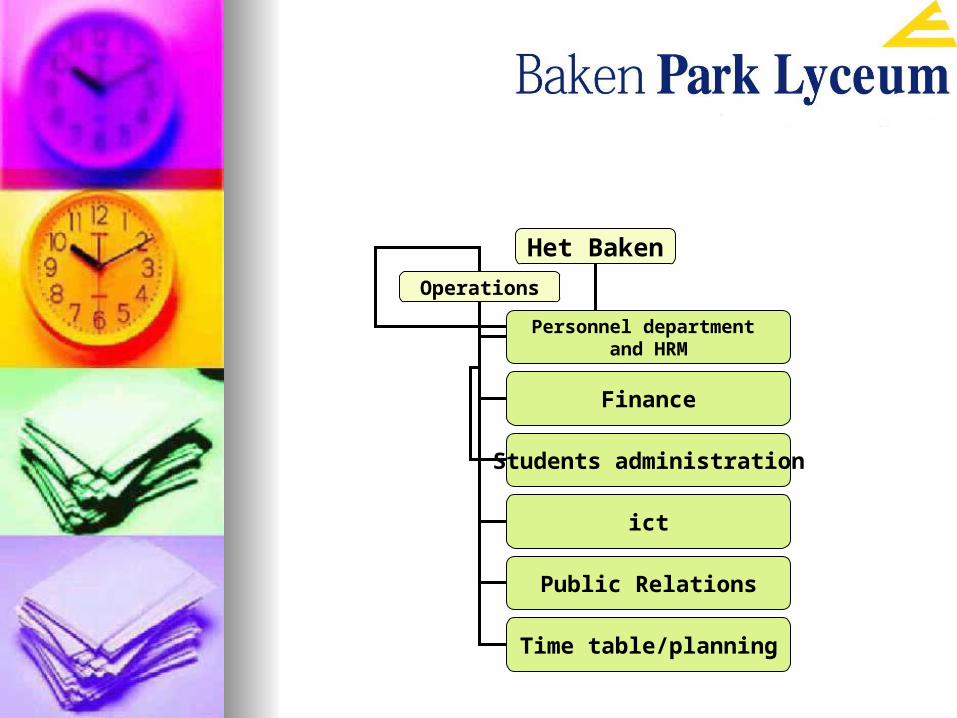
Het Baken
Operations
Personnel department and HRM
Finance
Students administration
ict
Public Relations
Time table/planning

--TeachersTeachers
23 Teachers Ld 12*23 Teachers Ld 12*
27 Teachers Lc 11*27 Teachers Lc 11*
210 Teachers Lb 10*210 Teachers Lb 10*
L= teachers salary functionsL= teachers salary functions
**== depending on competences and responsabilitiesdepending on competences and responsabilities
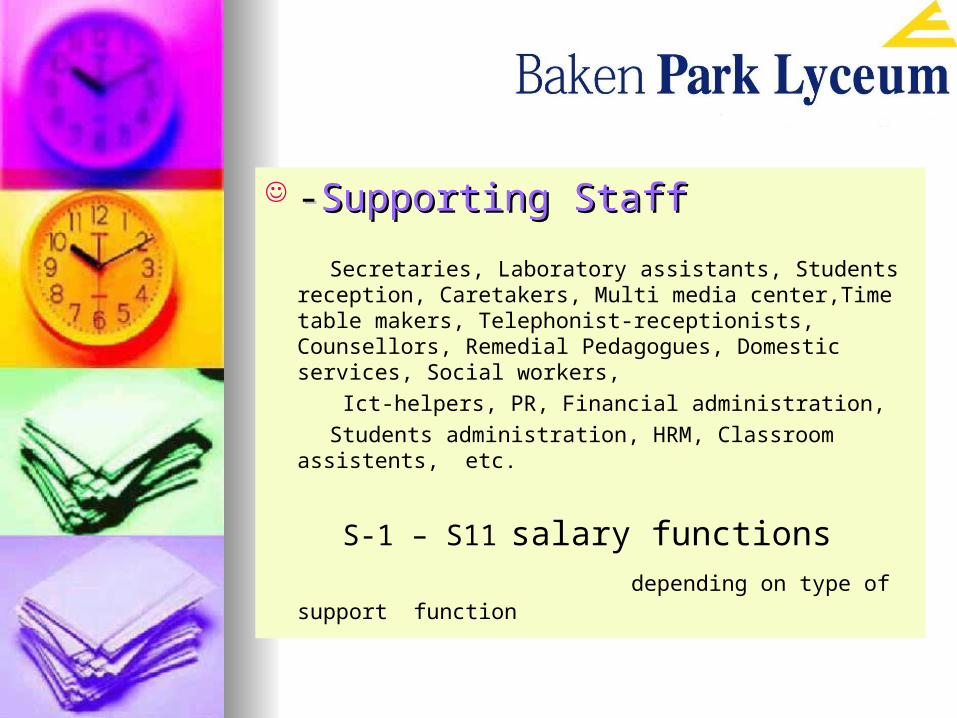
--Supporting Staff Supporting Staff
Secretaries, Laboratory assistants, Students reception, Caretakers, Multi media center,Time table makers, Telephonist-receptionists, Counsellors, Remedial Pedagogues, Domestic services, Social workers,
Ict-helpers, PR, Financial administration,
Students administration, HRM, Classroom assistents, etc.
S-1 – S11 salary functions depending on type of support function

Salaries secundary educationSalaries secundary education
S16 €5021 - €6569 managementS16 €5021 - €6569 managementS14 €4271 - €5443 managementS14 €4271 - €5443 managementS12 €2273 - €4567 managementS12 €2273 - €4567 managementLd €2273 - €4567** teachersLd €2273 - €4567** teachersLc €2264 - €4015** teachersLc €2264 - €4015** teachersLb €2251 - €3441** teachersLb €2251 - €3441** teachersS1-S11 €1354 - €4015# support S1-S11 €1354 - €4015# support
***=*= in 18 annual steps in 18 annual steps# = depending on type of support- function# = depending on type of support- function

School Income School Income Lump Sum amountLump Sum amount Depending on:Depending on: Number of students at school Number of students at school
and the type of studentand the type of studentValid for:Valid for:- salariessalaries- maintenance/cleaning/landingmaintenance/cleaning/landing- all other operating expensesall other operating expenses

Management: ( example)Management: ( example)Ratio number: 0.0591Ratio number: 0.05910,0591 x 3400 students = 200,0591 x 3400 students = 20
20 x €82.960 = € 1.665.38020 x €82.960 = € 1.665.380IncomeIncome
€€82.960 = average management 82.960 = average management Cost (GPL),in the Netherlands.Cost (GPL),in the Netherlands.Full time jobFull time job

Teachers:Teachers:Ratio nr. x nr. students xRatio nr. x nr. students x € € 63.507,81 ( GPL)63.507,81 ( GPL)GPL= average costGPL= average cost Ratio x students x GPLRatio x students x GPL0,05834 x 2991 x 63.507,810,05834 x 2991 x 63.507,810,11274 x 404 x 63.507,810,11274 x 404 x 63.507,81
Total Income : € 14.315.000Total Income : € 14.315.000 ==

Supporting Staff:Supporting Staff:
ratio nr. x nr. students xratio nr. x nr. students x
€ € 37.926,0837.926,08
Total Income: € 1.233.560 =Total Income: € 1.233.560 =

Total IncomeTotal Income (Government) (Government) Management 1.665.380 Management 1.665.380 Teachers 14.315.000Teachers 14.315.000 Supporting staff 1.233.560Supporting staff 1.233.560 Subtotal Subtotal 17.213.94017.213.940 Maintenance etc 1.500.000Maintenance etc 1.500.000 Parents 350.000Parents 350.000 Total Income € Total Income € 19.063.94019.063.940

Total Expenditures: Total Expenditures: Salaries 14.928.418Salaries 14.928.418 Depreciations 443.782Depreciations 443.782 HousingHousing 1.376.605 1.376.605 OthersOthers 1.996.638 1.996.638
Total Expenditures Total Expenditures 18.745.44318.745.443

RESULT 2006:RESULT 2006: Income 19.063.940Income 19.063.940 Costs 18.745.443 Costs 18.745.443 ----------------- ------------------ - Profit / loss 318.497 Profit / loss 318.497 Interest income 62.378Interest income 62.378 ---------------- +---------------- + Result 380.875Result 380.875 Estimated result 64.000Estimated result 64.000 Result partly for provisionsResult partly for provisions

GPL: average salary costGPL: average salary cost
1 full time teacher1 full time teacher € 63.507,81 ( GPL) € 63.507,81 ( GPL) Lb teacherLb teacher 4 years experience4 years experience Salary cost € 50.000.=Salary cost € 50.000.=
Result € 13.507.81 Result € 13.507.81

GPL: average salary costGPL: average salary cost
1 full time teacher1 full time teacher € 63.507,81 ( GPL) € 63.507,81 ( GPL) Ld teacherLd teacher 18+ years experience18+ years experience Salary cost € 67.107,81Salary cost € 67.107,81
Result Result -- € 3.600,= € 3.600,=
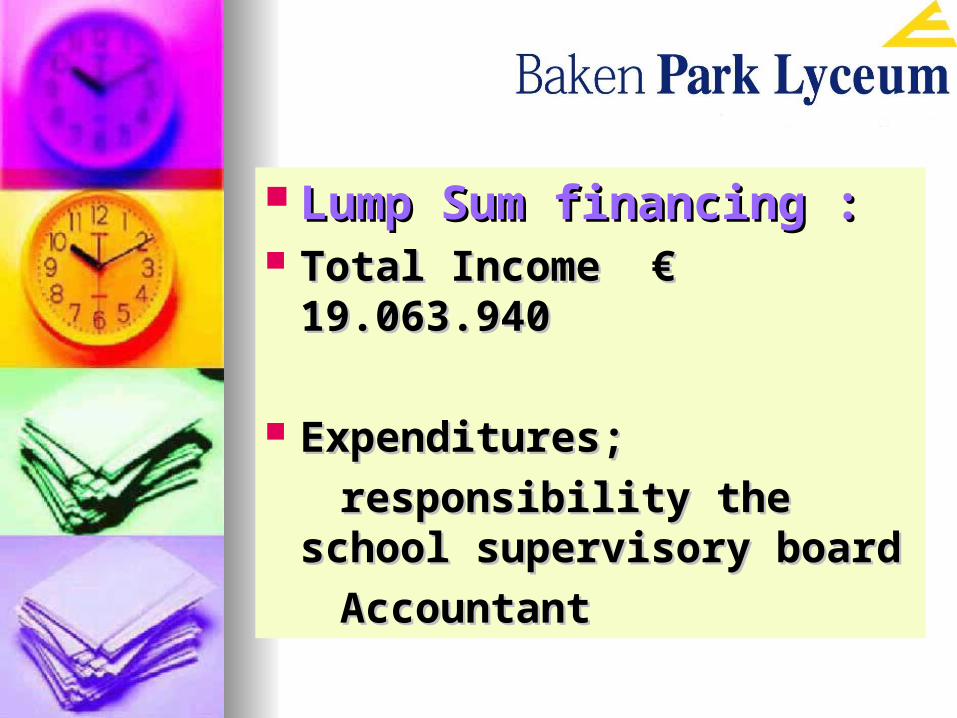
Lump Sum financing :Lump Sum financing : Total Income € 19.063.940Total Income € 19.063.940
Expenditures; Expenditures;
responsibility the school responsibility the school supervisory boardsupervisory board
AccountantAccountant

Financing depends on number students Financing depends on number students (80% salaries)(80% salaries)
Public relations and attracting studentsPublic relations and attracting students Engage and fire staffEngage and fire staff (Temporary / permanent) contracts, salaries(Temporary / permanent) contracts, salaries Job interviews and labour disputesJob interviews and labour disputes Sick leavesSick leaves Function discussions ( salary)Function discussions ( salary) Maintenance / investments in buildingMaintenance / investments in building constructing constructing Engage / refuse / dismiss studentsEngage / refuse / dismiss students Developing and implementing educational programs Developing and implementing educational programs
and educational reformand educational reform Deal with school’s inspectorateDeal with school’s inspectorate ICT projectsICT projects Cleaning and cleaning firmCleaning and cleaning firm
School ResponsibilitiesSchool Responsibilities

Engaging StaffEngaging Staff

5 schools for secundary education5 schools for secundary education Output primary schools 2767Output primary schools 2767 Applications 2006-2007 750Applications 2006-2007 750 limited !!!limited !!! Stad College ( vocational) 300Stad College ( vocational) 300 Park Lyceum (general) 450Park Lyceum (general) 450 Market share 27%Market share 27% Increase ( growth) 14%Increase ( growth) 14% Increase staff 58 persons 20%Increase staff 58 persons 20%
Schools in AlmereSchools in Almere

Division of costs 2005Division of costs 2005
Overig6,28%
L/H mid.1,03%
Adm.beh.3,49%
Huisv.5,79%
Afschr.4,34%
Pers.lst79,06%
labour 79.01
depreciation 4.34
housing 5.79
administration 3.49
others 7.31
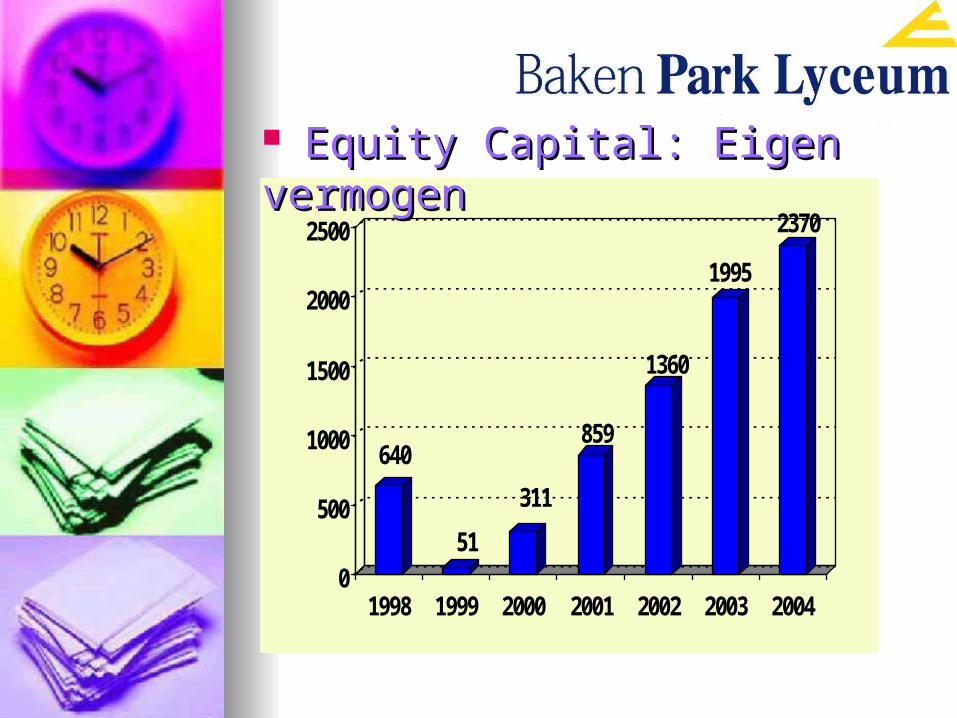
640
51
311
859
1360
1995
2370
0
500
1000
1500
2000
2500
1998 1999 2000 2001 2002 2003 2004
Equity Capital: Eigen vermogenEquity Capital: Eigen vermogen

SolvabilitySolvability
0,650,58
0,51
0,64
0,240,31 0,34
0,57
0,460,510,51
0,490,490,5
0
0,1
0,2
0,3
0,4
0,5
0,6
0,7
Het BakenBranche

Liquidity (current ratio)Liquidity (current ratio)
1,611,53
1,3
1,851,78 1,83
1,34
1,16
1,01
0,83
1,38
1,911,932,06
0
0,5
1
1,5
2
2,5
1998 1999 2000 2001 2002 2003 2004 2005
Het BakenBranche
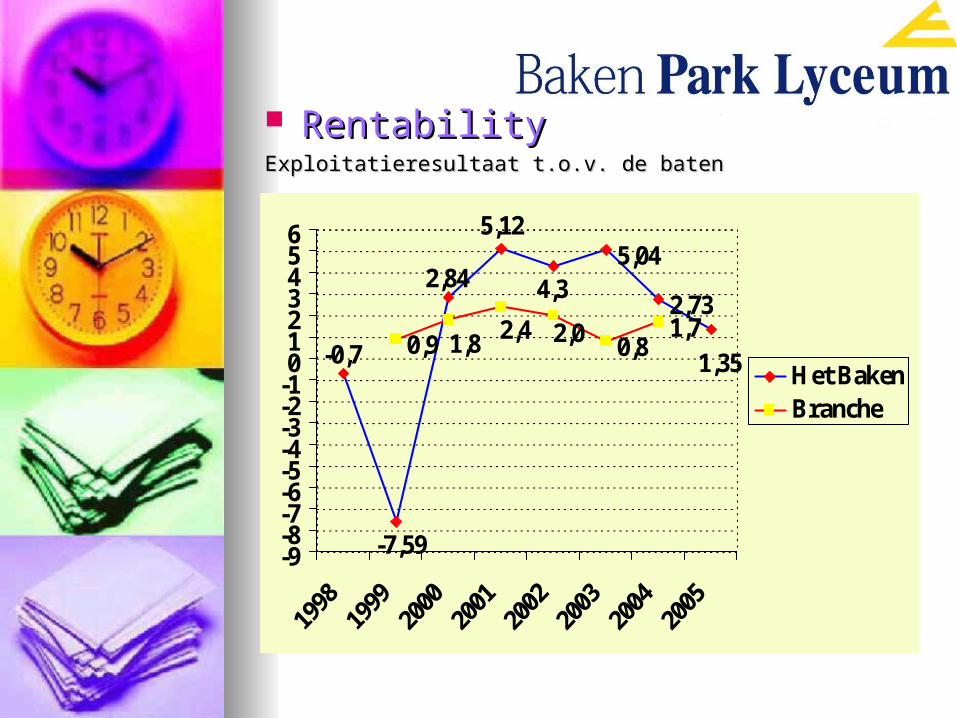
Rentability Rentability Exploitatieresultaat t.o.v. de batenExploitatieresultaat t.o.v. de baten
5,04
2,73
0,9 0,81,7
1,35
4,3
5,12
-0,7
2,84
-7,59
2,01,8 2,4
-9-8-7-6-5-4-3-2-10123456
Het BakenBranche

Salary Cost /Total costSalary Cost /Total cost
84,14
82,59
81,9
83,87
80,5
80,68
80,780,75
80,880,33
80,7
78,3
80,6
79,06
75
76
77
78
79
80
81
82
83
84
85
1998 2000 2002 2004
Het BakenBranche

Total cost per studentTotal cost per student
•
3794
4549
4686
4416
5036 50605398 5331
5843
5317
6153
4951
6179
5127
0
1000
2000
3000
4000
5000
6000
7000
1998 2000 2002 2004
Het BakenBranche

Salary cost per student
3197
3757
3848
3704
40834082
43624456
4727
4269
4974
3876
4985
4053
0500
10001500200025003000
3500400045005000
1998 2000 2002 2004
Het BakenBranche

Housing cost per student
228
244
336
251
366
297
401
362
417
330
442
315
440
297
0
50
100
150
200
250
300
350
400
450
1998 2000 2002 2004
Het BakenBranche