DUBBO CITY PLANNING AND TRANSPORTATION STRATEGY …
98
STAPLETON TRANSPORTATION AND PLANNING Pty Ltd Level 9, 99 Bathurst Street, Sydney 2000 Phone +61 2 9264 stap Email [email protected] www.stap.com.au DUBBO CITY PLANNING AND TRANSPORTATION STRATEGY 2036 NOVEMBER 2009 .7 1.9 .8 .5 1.9 11.9 1.6 1.0 4.1 .6 2.0 4.2 3.8 New ZOne for FRIEGHT TERMOINAL
Transcript of DUBBO CITY PLANNING AND TRANSPORTATION STRATEGY …

STAPLETON TRANSPORTATION AND PLANNING Pty Ltd Level 9, 99 Bathurst Street, Sydney 2000
Phone +61 2 9264 stap Email [email protected] www.stap.com.au
DUBBO CITY PLANNING AND
TRANSPORTATION STRATEGY 2036
NOVEMBER 2009
.71.9
.8
.5 1.9
11.9
1.6
1.04.1
.6
2.0
4.2
3.8
New ZOne for FRIEGHT TERMOINAL
susanb
Typewritten Text
Appendix 2

Context of the Dubbo City Planning and Transportation Strategy 2036
Dubbo City Council advises that this document is the result of an independent review of Council’s “Future Directions and Structure Plan” which forms part of the Urban Development Strategy adopted by Council in 1996. The Strategy reviews the growth of the City and the principles of future development of the City and makes recommendations in respect of its findings. The broad principles of this Strategy are to be considered in future strategic landuse planning decisions, however they do not
represent the adopted Strategic Landuse Policy for the City and its future growth.

Table of Contents 1.0 EXECUTIVE SUMMARY ............................................................................................................... 5
1.1 INTERGENERATIONAL RESILIENCE .......................................................................... 5 1.2 VISIONS ......................................................................................................................... 6 1.3 DATA AND INFORMATION ........................................................................................... 6 1.4 FIVE NEW ELEMENTS .................................................................................................. 7
1.4.1 Extension across and along the Macquarie River Front ................................. 7 1.4.2 The Freightway................................................................................................ 7 1.4.3 The Green Ring ............................................................................................... 8 1.4.4 Regional Business Ring .................................................................................. 9 1.4.5 Places .............................................................................................................. 9
2.0 PLANNING PRINCIPLES ............................................................................................................ 15
2.1 PLACES ........................................................................................................................ 15 2.2 THREE BUILT ENVIRONMENTS ................................................................................ 17 2.3 RESIDENTIAL .............................................................................................................. 18
2.3.1 Residential - Community Business ............................................................... 18 2.3.2 Residential - Small Light Industry.................................................................. 19
2.4 REGIONAL BUSINESS ................................................................................................ 20 2.5 REGIONAL INDUSTRIAL ............................................................................................. 21
3.0 TRANSPORTATION PRINCIPLES ............................................................................................. 25
3.1 THE THREE ALTERNATIVE NETWORKS .................................................................. 25 3.2 PUBLIC TRANSPORT ................................................................................................. 25 3.3 WALKING, BIKING (Biped, Bikes, Boards, Boots and Blades) ................................... 26 3.4 ROAD NETWORKS ..................................................................................................... 26
3.4.1 Road Network 1 The Freightway - outer ring ............................................... 27 3.4.2 Road Network 2 State Highways to the Centre ........................................... 28 3.4.3 Road Network 3 Distribution Grid................................................................. 29
4.0 ROAD SYSTEMS ........................................................................................................................ 32
4.1 MAXIMUM TRAFFIC FLOWS ...................................................................................... 32 4.2 PERFORMANCE OF EXISTING ROADS .................................................................... 32 4.3 ANALYSIS OF EXISTING CONNECTIVITY ................................................................ 34
4.3.1 The North-East .............................................................................................. 34 4.3.2 The South-East ............................................................................................. 34 4.3.3 The South-West ............................................................................................ 35 4.3.4 The Macquarie River ..................................................................................... 35
4.4 FUTURE ROAD FLOWS .............................................................................................. 35 4.4.1 Existing Streets ............................................................................................. 35
4.5 ROAD HIERARCHY ..................................................................................................... 37 4.5.1 Local Streets ................................................................................................. 38 4.5.2 Connectors .................................................................................................... 39 4.5.3 Distributor Avenues ....................................................................................... 41 4.5.4 Sub-Arterial Avenues and Boulevards .......................................................... 41 4.5.5 Arterials ......................................................................................................... 43
4.6 SUMMARY ................................................................................................................... 43 5.0 POPULATION, EMPLOYMENT AND LAND BANK................................................................... 48
5.1 RESIDENTIAL EXPANSION ........................................................................................ 48 5.2 EMPLOYMENT EXPANSION ...................................................................................... 50 5.3 LAND REQUIREMENT ................................................................................................ 52 5.4 LAND BANK ................................................................................................................. 53

6.0 LAND RELEASE STRATEGY .................................................................................................... 54 6.1 FRONTS OF DEVELOPMENT ..................................................................................... 54 6.2 URBAN DESIGN .......................................................................................................... 54
6.2.1 Residential Areas and Schools ..................................................................... 55 6.2.2 Community Business .................................................................................... 56 6.2.3 Retail ............................................................................................................. 58 6.2.4 Tourist Accommodation and Entertainment .................................................. 59 6.2.5 Regional Business Centres ........................................................................... 60 6.2.6 Regional Traffic Generators .......................................................................... 61 6.2.7 Industrial Zones ............................................................................................. 62 6.2.8 Light Industrial Zones .................................................................................... 62
6.3 CONCEPT FOR NORTH WEST SECTOR .................................................................. 63 6.3.1 Guidelines for NW Sector .............................................................................. 63 6.3.2 Interpretation in the NW Sector ..................................................................... 64
6.4 CONCEPT FOR SOUTH WEST SECTOR .................................................................. 65 6.4.1 Guidelines for SW Sector .............................................................................. 65 6.4.2 Interpretation in the SW Sector ..................................................................... 66
6.5 CONCEPT FOR SOUTH EAST SECTOR ................................................................... 67 6.5.1 Guidelines for SE Sector ............................................................................... 67 6.5.2 Interpretation in the SE Sector ...................................................................... 68
7.0 ROAD CONSTRUCTION PROGRAM ........................................................................................ 80
7.1 CONSTRUCTION BY 2016 .......................................................................................... 81 7.2 CONSTRUCTION BY 2026 .......................................................................................... 81 7.3 CONSTRUCTION BY 2036 .......................................................................................... 82 7.4 CONSTRUCTION AFTER 2036 ................................................................................... 82 7.5 SUMMARY ................................................................................................................... 83
8.0 MODELLING................................................................................................................................ 84
8.1 SCOPE OF WORK ....................................................................................................... 84 8.2 THE ROLE OF MODELLING ....................................................................................... 84 8.3 2006 MODEL ................................................................................................................ 85 8.4 FUTURE LAND USES .................................................................................................. 85 8.5 NETWORK BUILDING ................................................................................................. 86 8.6 MODELLING ANALYSIS .............................................................................................. 87
8.6.1 2036 Do Nothing and Road Strategy ............................................................ 88 8.6.2 2016 Network Evaluation .............................................................................. 91 8.6.3 2026 Network Evaluation .............................................................................. 93 8.6.4 2036 Network Evaluation .............................................................................. 95 8.6.5 2046 Network Evaluation .............................................................................. 97

5 STAPLETON TRANSPORTATION AND PLANNING Pty Ltd
1.0 EXECUTIVE SUMMARY
1.1 INTERGENERATIONAL RESILIENCE Strategic Planning is the handing down of intergenerational stewardship to let the next generation thrive and move hitherto in unknown directions. The plan must encompass the social, economic and ecological factors to ensure Dubbo survives and prospers, being attractive to changing styles of investment and changing demographics. Our discussions with Council and Council Staff have endeavoured to identify the soul of Dubbo and goals for its future direction; the ten minute City; the alternative to suburban living and investment; the oasis in the West. There is movement; more regional people are settling in Dubbo to retire; its role in regional freight is growing; it is well known for the Zoo; three primary drivers for economic growth. There are threats: over the last 50 years smaller rural settlements have merged into smaller towns that in turn merged into yet larger towns. Is this continuing? Does the efficiency of centralisation mean Dubbo will cease to expand and offer only the essentials to a retracting region as the coast attracts more economic energy or will surrounding towns continue to merge and as a result Dubbo will grow? Perhaps the guiding directions are: - Being prepared to deliver new, and as yet undefined, lifestyles. - To ensure Dubbo is attractive in times of economic stress. - To expand Dubbo in a holistic, balanced manner. New investors need a place to locate; this means a range of environments suitable for different styles of business; commercial ventures with good street addresses; retirement places connected to the local neighbourhood and to public transport; warehouses and industry that can work through the night or in a global market. These places need individual identities. This will add synergy; the Arab Souks illustrate the positive impact of direct competition and synergy, and, perhaps as important, direct neighbourly support. Mixed architecture is a sign of confusion and uncertainty. Similarly, families from differing backgrounds need suitable communities, shown most recently by the Grangewood Estate. Family size is reducing, partly because of retirees, but also later marriage, high divorce rates and single parent families. And specifically Dubbo is the place to come and settle on a large plot of land, enjoy the space and have everything within reach. Part of the resilience to accommodate changing circumstances is to provide infrastructure that allows viable public transport to be introduced at some time in the future. This will not only bring choice for the young and older residents of Dubbo, it will also keep Dubbo in the global loop of sustainable living.

6 STAPLETON TRANSPORTATION AND PLANNING Pty Ltd
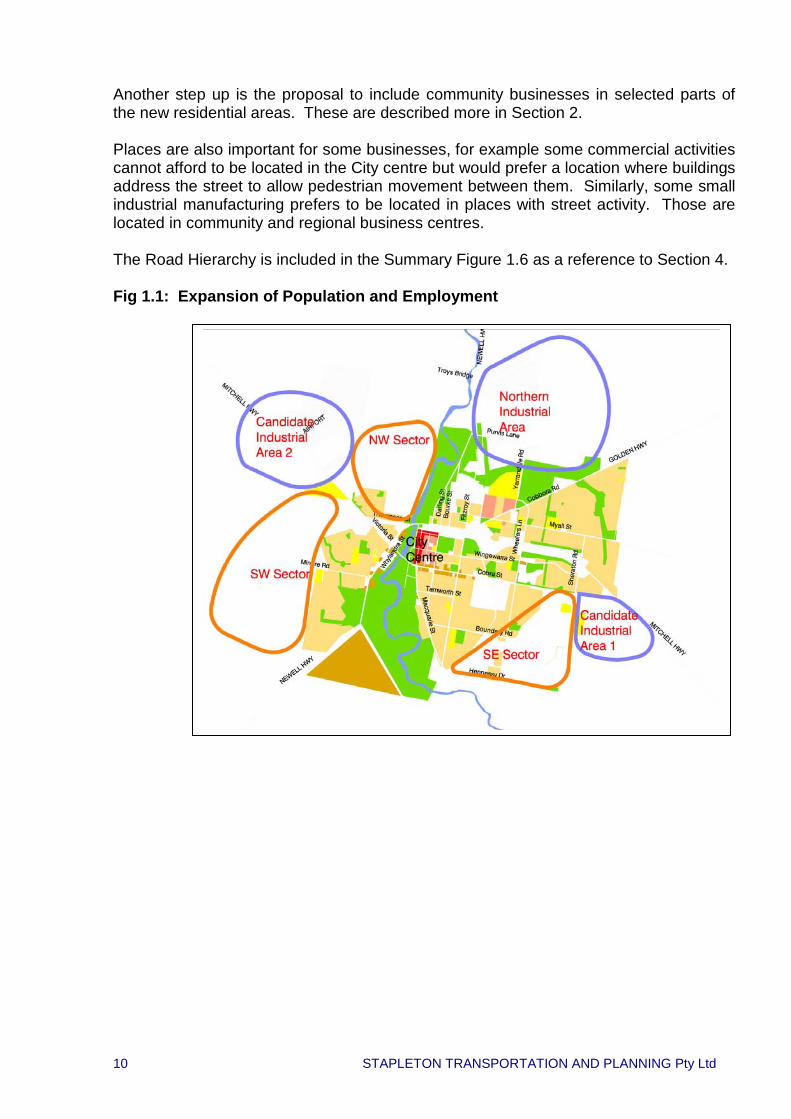
1.2 VISIONS Will Dubbo become a centre for the “slow life” that is now catching on in Europe, relaxed, open, good food, value adding to the rural economy? Isn’t it already? Perhaps one of the most neglected areas of planning in the last 20 or so years throughout the western world has been the lack of provision of places for varying life styles: where does the pub go, and the outdoor restaurant? Where can the tourists walk in the evening? Where are the quiet corners for a sit down, where retirees can mix with the local community, the children? Can the sports fields be reached by bike? Will the ten minute City work in all the new suburbs; for everyone? 1.3 DATA AND INFORMATION This Strategic Plan is based on the completion of 7500 additional dwellings in Dubbo. The population forecast is based on this development occurring over a 30 year period; an additional 250 dwellings per year. This population will be housed in three sectors (Refer to Figure 1.1), the South East Sector [SE], the South West Sector [SW] and the North West Sector [NW]. Refer to Section 5 for Population and Employment. During this period the average size of families is expected to continue to decrease and the number of employees per family will also decrease. The strategy for employment is based on employment projections for this additional population. The increase in regional demand for health, education, governance and services are closely related to the size of the population e.g. one health worker per such and such population. Maintaining the ten minute City is reason enough to maintain governance, commerce and major attractions in, or close to, the City centre. Expansion of the freight, warehousing and distribution industries is related to both the rural economy, which is cyclic, and the growth in the economy; more wealth, more stuff, more movement. There is ample space to accommodate this in the north and in the “Industrial Candidate Areas” (ICAs). There are not enough new jobs in governance, freight and community support to supply jobs to all the new residents. Eg Dubbo needs to be generating wealth in order to sustain this growth of 250 dwellings per annum. Therefore there is a need to consider what attractions can make Dubbo more competitive as a community. Of course there are other scenarios: Dubbo could lose its place as a regional centre to, say, Orange and the Coast; or it could retract by not attracting additional employment and remain smaller than the target population. This plan considers how to manage and create opportunities for growth. Three new strands of additional employment have been considered as part of Dubbo’s future: o Services industry supporting more retirees; o Businesses to increase the value of rural products; and o Increasing the base for tourists.

7 STAPLETON TRANSPORTATION AND PLANNING Pty Ltd
The Dubbo Urban Areas Development Strategy addressed how these activities can be encouraged to set up in Dubbo and in particular the management of land to encourage specialist development. (Refer to Section 6 Land Release Strategy). The Strategy also identified a land bank for unexpected growth for large site employment needs and further expansion of the freight industry. The transport strategy is supported by estimating future travel between the land activities and testing various scenarios for new road connections. (Refer to Section 7). 1.4 FIVE NEW ELEMENTS This Strategy is set around five elements that can be ingeniously worked together so that each element has synergies that add social, economic and ecological benefits. 1.4.1 Extension across and along the Macquarie River Front Refer Figure 1.2. The first element in the plan is the extension of the City centre across the Macquarie River extending controlled activity along the Macquarie River Front. This will be the focus for tourism, recreation; a means of using the space of the flood plain to enhance “the Oasis” function of Dubbo. The demand for Community Businesses (defined as commercial, health, further education and accommodation) will support the expansion of the River Front from Thompson Street north to the former Bunglegumbie Sewage Treatment Plant. The flood plain accommodates the quieter of two parallel pathway systems; the second is developed north from Stonehaven Avenue for pedestrian movement between hotels and accommodation. The concept of the river front is to extend the City to the west bank, opening up the west to Whylandra Street and the redevelopment of properties east of Whylandra Street and extending north. 1.4.2 The Freightway Refer Figure 1.3. The second element in the plan is for a complete ring of truck routes to carry trucks to the warehousing, freight and distribution centres to the north and west of the City. Built over the next 40 years, it is a fundamental part of the social and economic plan for Dubbo. It will avoid the need to widen roads within the City thereby allowing them to operate without complex turn restrictions - there are some minor exceptions to this that are discussed in Section 3.
8 STAPLETON TRANSPORTATION AND PLANNING Pty Ltd
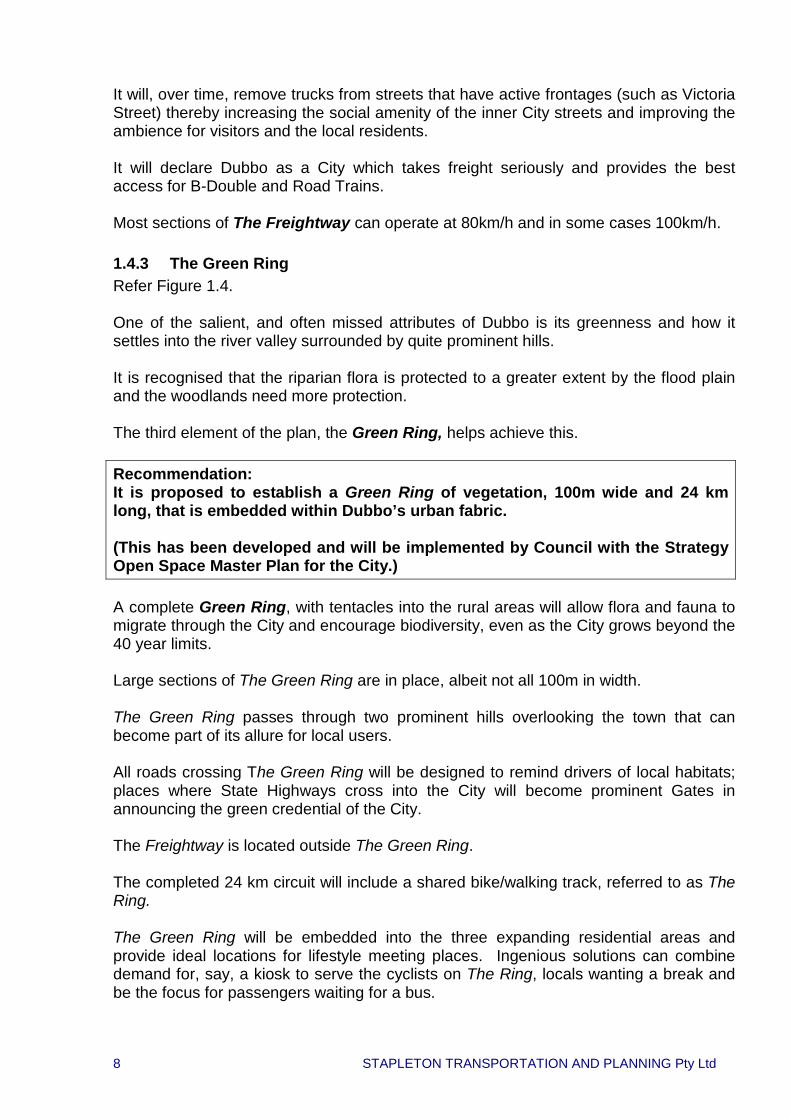
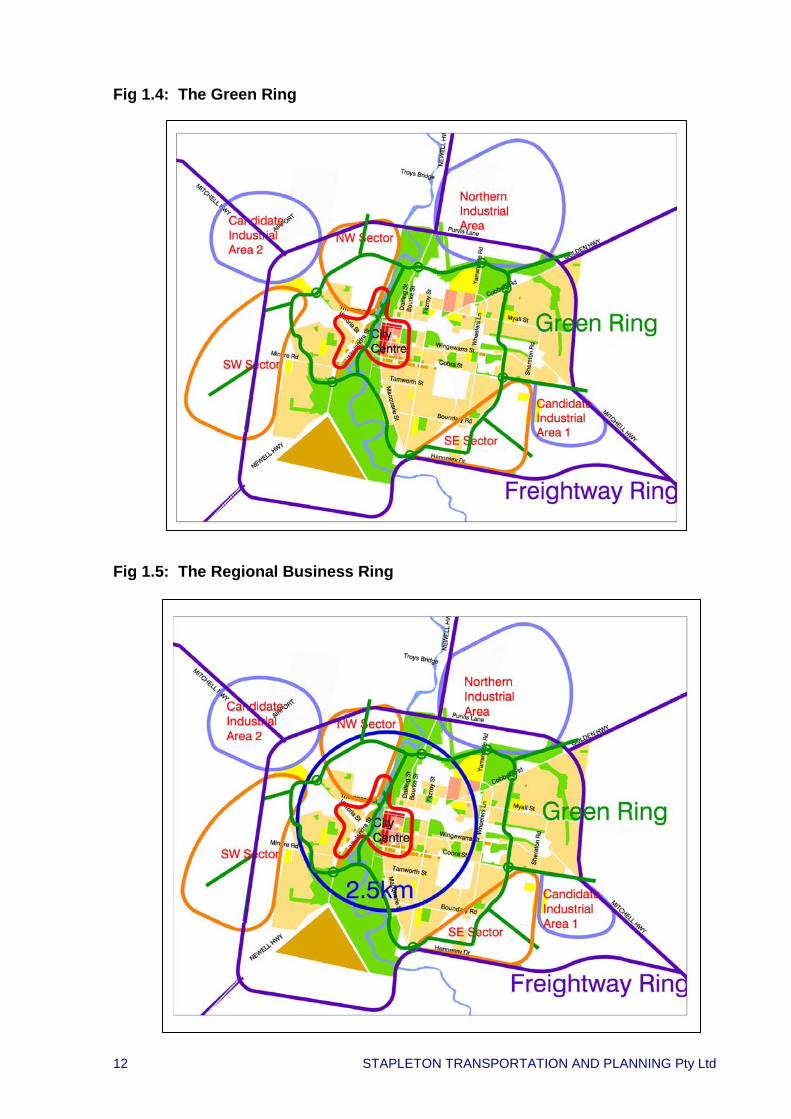
It will, over time, remove trucks from streets that have active frontages (such as Victoria Street) thereby increasing the social amenity of the inner City streets and improving the ambience for visitors and the local residents. It will declare Dubbo as a City which takes freight seriously and provides the best access for B-Double and Road Trains. Most sections of The Freightway can operate at 80km/h and in some cases 100km/h. 1.4.3 The Green Ring Refer Figure 1.4. One of the salient, and often missed attributes of Dubbo is its greenness and how it settles into the river valley surrounded by quite prominent hills. It is recognised that the riparian flora is protected to a greater extent by the flood plain and the woodlands need more protection. The third element of the plan, the Green Ring, helps achieve this. Recommendation: It is proposed to establish a Green Ring of vegetation, 100m wide and 24 km long, that is embedded within Dubbo’s urban fabric. (This has been developed and will be implemented by Council with the Strategy Open Space Master Plan for the City.) A complete Green Ring, with tentacles into the rural areas will allow flora and fauna to migrate through the City and encourage biodiversity, even as the City grows beyond the 40 year limits. Large sections of The Green Ring are in place, albeit not all 100m in width. The Green Ring passes through two prominent hills overlooking the town that can become part of its allure for local users. All roads crossing The Green Ring will be designed to remind drivers of local habitats; places where State Highways cross into the City will become prominent Gates in announcing the green credential of the City. The Freightway is located outside The Green Ring. The completed 24 km circuit will include a shared bike/walking track, referred to as The Ring. The Green Ring will be embedded into the three expanding residential areas and provide ideal locations for lifestyle meeting places. Ingenious solutions can combine demand for, say, a kiosk to serve the cyclists on The Ring, locals wanting a break and be the focus for passengers waiting for a bus.

9 STAPLETON TRANSPORTATION AND PLANNING Pty Ltd
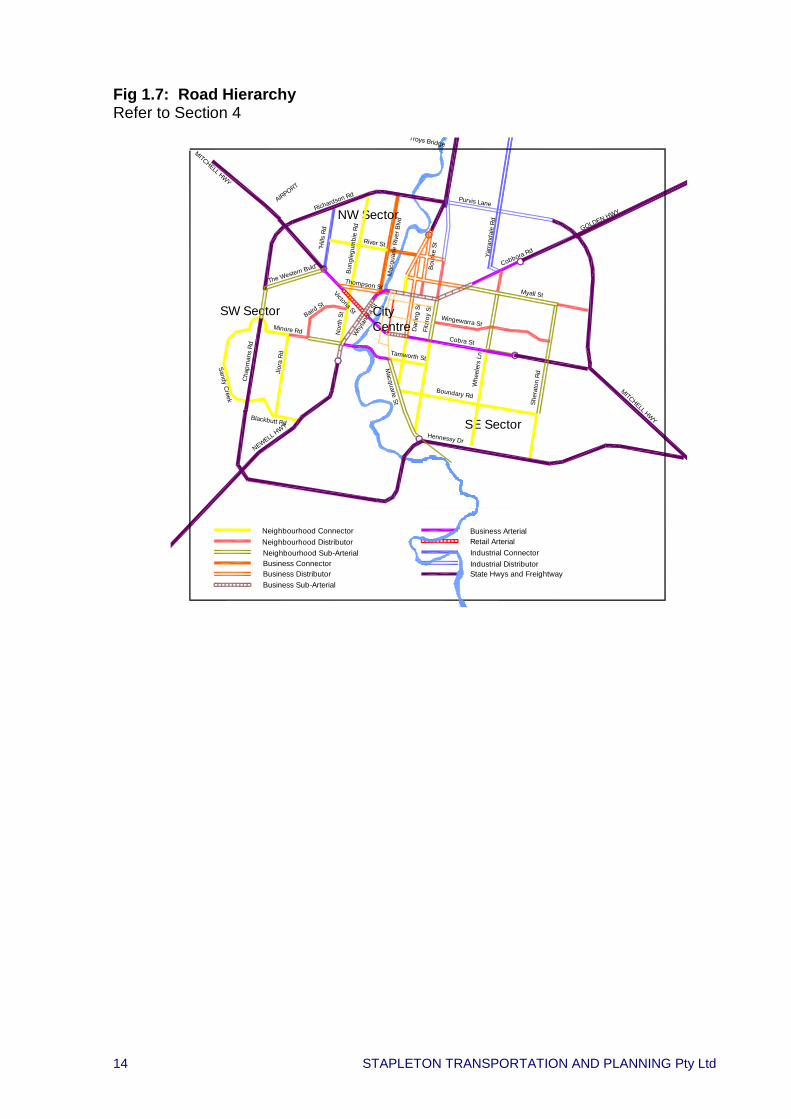
The Green Ring will also link sport fields and schools, providing quick access for cyclists and walkers. 1.4.4 Regional Business Ring Refer Figure 1.5 The fourth element of the plan aims to maintain Dubbo as a “ten minute City” by locating all regional attractions close to the centre of the City. This is a fundamental means of maintaining the ten minute travel time for the majority of trips and thereby reducing the number of kilometres travelled in Dubbo as there will be less traffic on the roads. This control will also reduce the time travelled for local trips. Analysis of the availability of larger sites indicates all future activities that generate major traffic flows; including Shopping Centres, Hospitals, Universities, Colleges and Bulky Goods Stores which can be accommodated within 2.5km of the City centre. More than sufficient land has been identified in the plan to accommodate all other activities requiring major sites outside the City Ring. The Regional Business Ring defines the limit for including customer parking on the development site. Development outside this ring will be restricted to on-site parking for employees and business use (trucks bays etc), and no on-street parking will be permitted on industrial roads. Further details of the activities permitted in each classification of land are contained in Sections 2 and 5. 1.4.5 Places Refer Figure 1.6 As Cities expand residents and businesses are less connected to the centre and conduct more of their lives in their local community. Homogeneous estates further limit the sense of belonging to a larger community. The fifth element of the plan is to structure development around the creation of Places linked easily to the surrounding homes or businesses. The Places will contain small attractors such as; a seat overlooking a view; a play area; a kiosk; or passing through a golf course (Grangewood/Delroy) and occasionally a small local shop or community building. These Places form the focal points for longer walking journeys through the local areas and indeed stopping points for very long journeys by foot or bike along the Green Ring. Noisier activities can also be countenanced where they can be quarantined from the neighbours by, for example, the 100m separation created along The Green Ring. The land use strategy identifies a range of land activities that need to be considered in local neighbourhoods: youth workshops (garages); barbeque areas; outdoor restaurants; pubs; all need space and defined areas. The strategy carefully installs these into the future urban structure now.
10 STAPLETON TRANSPORTATION AND PLANNING Pty Ltd
Another step up is the proposal to include community businesses in selected parts of the new residential areas. These are described more in Section 2. Places are also important for some businesses, for example some commercial activities cannot afford to be located in the City centre but would prefer a location where buildings address the street to allow pedestrian movement between them. Similarly, some small industrial manufacturing prefers to be located in places with street activity. Those are located in community and regional business centres. The Road Hierarchy is included in the Summary Figure 1.6 as a reference to Section 4. Fig 1.1: Expansion of Population and Employment

11 STAPLETON TRANSPORTATION AND PLANNING Pty Ltd
Fig 1.2: Extension across the Macquarie River Fig 1.3: The Freightway Ring
12 STAPLETON TRANSPORTATION AND PLANNING Pty Ltd
Fig 1.4: The Green Ring Fig 1.5: The Regional Business Ring

13 STAPLETON TRANSPORTATION AND PLANNING Pty Ltd
Fig 1.6: Expanding Places
14 STAPLETON TRANSPORTATION AND PLANNING Pty Ltd
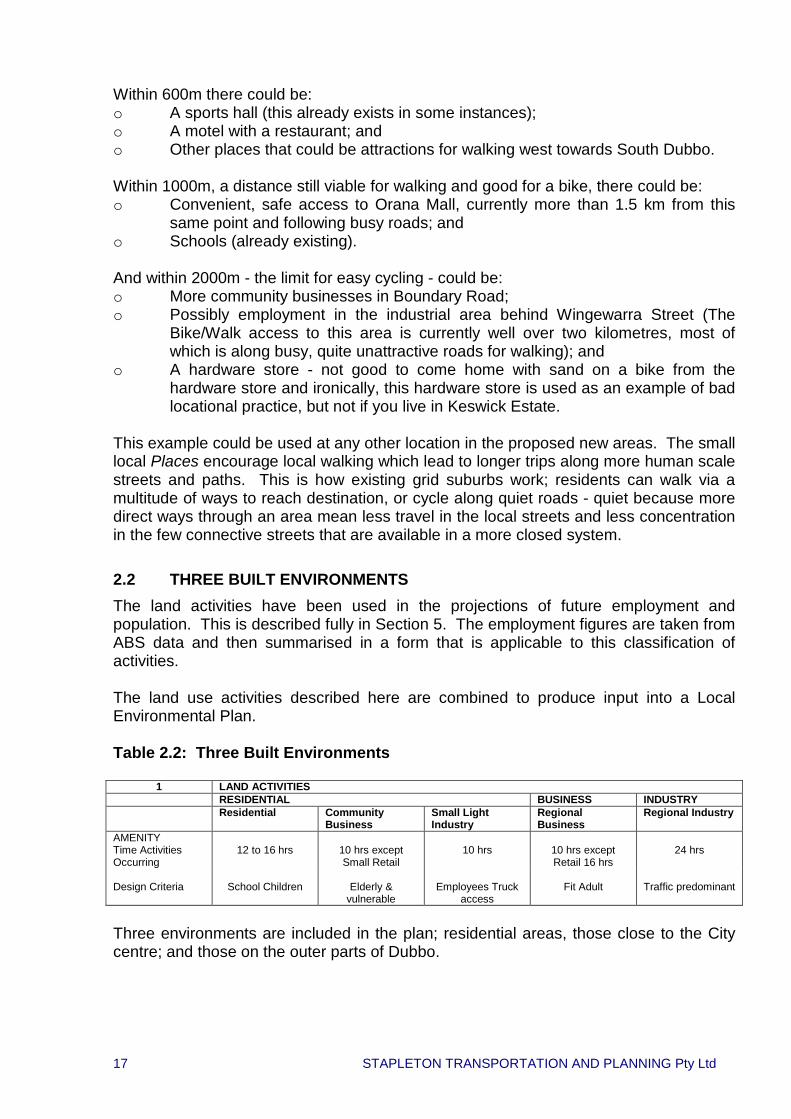
Fig 1.7: Road Hierarchy Refer to Section 4
MITCHELL HWY
AIRPORT
MITCHELL HWY
NEWELL HWY
GOLDEN HWY
Purvis Lane
River St
Myall St
Cobra St
Wingewarra St
Boundary Rd
Hennessy Dr
Minore Rd
Blackbutt Rd
Jior
a Rd
Cha
pman
s Rd
Nor
th S
t
"Hill
s Rd
Dar
ling
StFi
tzro
y St
Whe
eler
s Ln
Macquarie St
Bour
ke S
t
Sher
aton
Rd
Richardson Rd
"The Western Bvld" Cobbora Rd
Yarra
ndal
e Rd
Why
landr
a St
Mac
quar
ie R
iver
Blv
d
SW Sector
SE Sector
NW Sector
Victoria St
Baird St
Sandy Creek
Thompson St
Tamworth St
Bung
legu
mbi
e Rd
CityCentre
Neighbourhood Sub-ArterialBusiness ConnectorBusiness Distributor
Neighbourhood ConnectorNeighbourhood Distributor
Business ArterialRetail Arterial
State Hwys and Freightway
Industrial ConnectorIndustrial Distributor
Business Sub-Arterial

15 STAPLETON TRANSPORTATION AND PLANNING Pty Ltd
2.0 PLANNING PRINCIPLES
Land use planning is about resolving conflicts between different users either as neighbours or by what an activity does down the street. Dubbo can afford to have high ideals; there is space and opportunity to achieve great outcomes. Land use planning is the coming together of activity, amenity and access. o Activity - what is desired to do; o Amenity - the best way to do this activity; and o Access - the movement that achieves the activity and the amenity. The defining elements of this Strategy are: o Land uses that reflect desired amenity - areas with priority to:
(1) residents; (2) day activities; or (3) the 24 hour activities, in particular the freight industry.
o Streets that reflect movement from the land activity - solution with a priority to:
(1) children about; (2) adults pedestrians; or (3) vehicular transport needs.
o Ecological places that reflect the activity occurring - solutions with a preference
to the flora and fauna. The spatial needs for the ecology are defined in this strategy but not the philosophical outcomes which will be developed further through open spaces plans and community plans that adopt ecological priorities. For example; residents in some Cities are now working together to create whole suburbs that can, say; accommodate migrating birds or the movement of a species during times of the year (Ducks, frogs!).
2.1 PLACES There is a tendency to consider the central area as the only focus for activity. In reality people move about their local areas as well as throughout the City. Table 2.1
Place Range of Attraction
Alternative ways to travel Walk Bike Bus Car
Comer 120m W Local 600m W B C District 2km B PT C City 5km B PT C

16 STAPLETON TRANSPORTATION AND PLANNING Pty Ltd
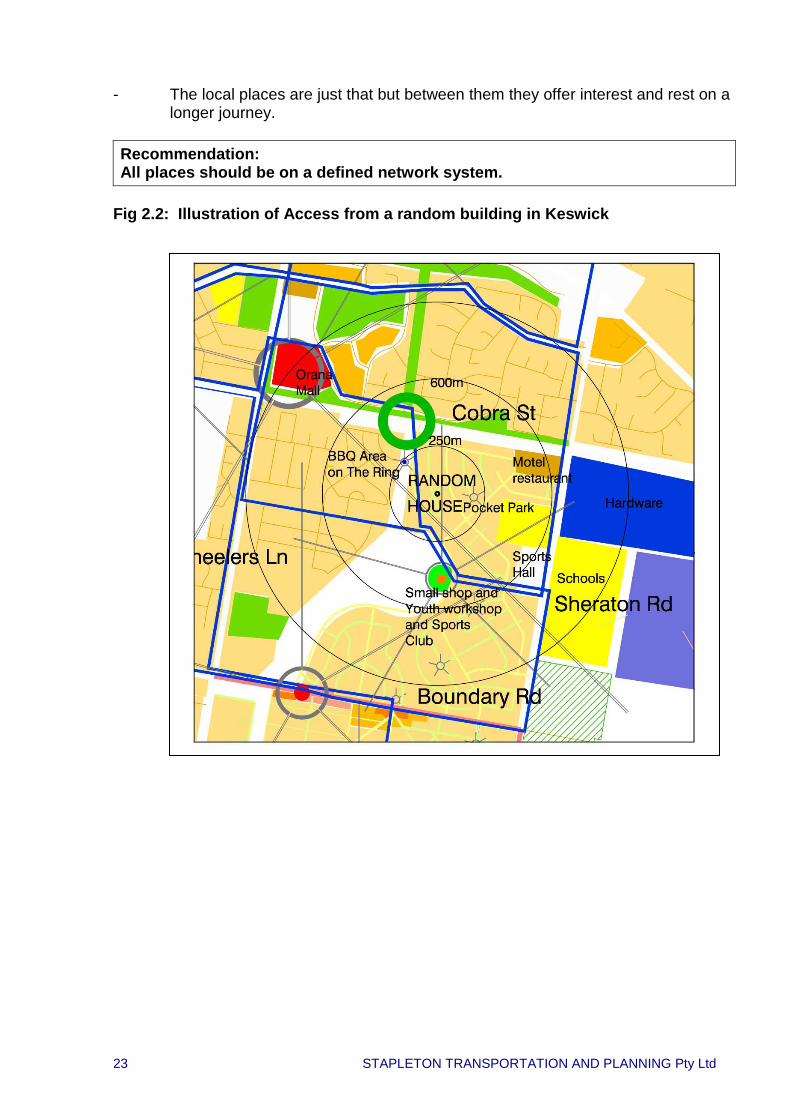
The closer the attraction the more choice of how to travel. This is summarised in Table 2.1 showing most people will walk 120m to a local corner, have the choice of car, bike or walk for slightly longer journeys and that bus travel is seldom used for less than 2 kilometres, except for some mobility impaired who will use the bus for almost all trips. Few walk by choice for non recreational journeys greater than about 1.5m km. Figure 2.1 is a representation of how places can join the City together with small places that are almost private local spaces to the large more extrovert centres (Not all of the smaller places are marked in the existing areas). Residents of course also travel City wide; such as, to the City centre, to major places of employment, or activity such as sport centres, and the Orana Mall. The analysis of existing and future road hierarchy finds that walking and bike routes can be provided successfully throughout the central part of Dubbo using existing streets both now and in the future. The benefit of the increased local accessibility is illustrated in Figure 2.2 in which a random house has been selected in the future part of Keswick Estate - shown as a dot in the centre of circles that show the straight line distance from the selected house. The design of Keswick Estate has been interpreted from guidelines in this Strategy including Local Places, District Places and a new road connecting to Cobra Street. Within 250m of the random house there could be: o A pocket park, o A BBQ Area, o A bus route that will stop anywhere in the nearest residential street outside peak
hours - this bus would not take this route without the proposed new road access to Cobra Street.
o Access to the Shared Walking Bike Route with direct access throughout Dubbo. This is an example of the synergy in the combined strategy.
The Green Ring provides the incentive for a safe pedestrian/bike crossing for Cobra Street thereby linking two residential areas that would otherwise be separated by up to two kilometres. And because of the proposal for Park Streets along the Green Ring which slow traffic, an extra road access can be added to Keswick. This can be achieved because The Freightway offers an alterative for trucks seeking access to the Industrial areas and passing through Dubbo.
Within 350m there could be: o A bus stop served by two bus routes, one of which would not go there if it were
not for the new road link to Cobra Street; o Vehicular access points to Cobra Street, previously there was more than 1km to
travel to the nearest distributor road; o A youth workshop; o A sports club; and o A small shop that would not exist without the Workshop, club and the bus stop.
17 STAPLETON TRANSPORTATION AND PLANNING Pty Ltd
Within 600m there could be: o A sports hall (this already exists in some instances); o A motel with a restaurant; and o Other places that could be attractions for walking west towards South Dubbo. Within 1000m, a distance still viable for walking and good for a bike, there could be: o Convenient, safe access to Orana Mall, currently more than 1.5 km from this
same point and following busy roads; and o Schools (already existing). And within 2000m - the limit for easy cycling - could be: o More community businesses in Boundary Road; o Possibly employment in the industrial area behind Wingewarra Street (The
Bike/Walk access to this area is currently well over two kilometres, most of which is along busy, quite unattractive roads for walking); and
o A hardware store - not good to come home with sand on a bike from the hardware store and ironically, this hardware store is used as an example of bad locational practice, but not if you live in Keswick Estate.
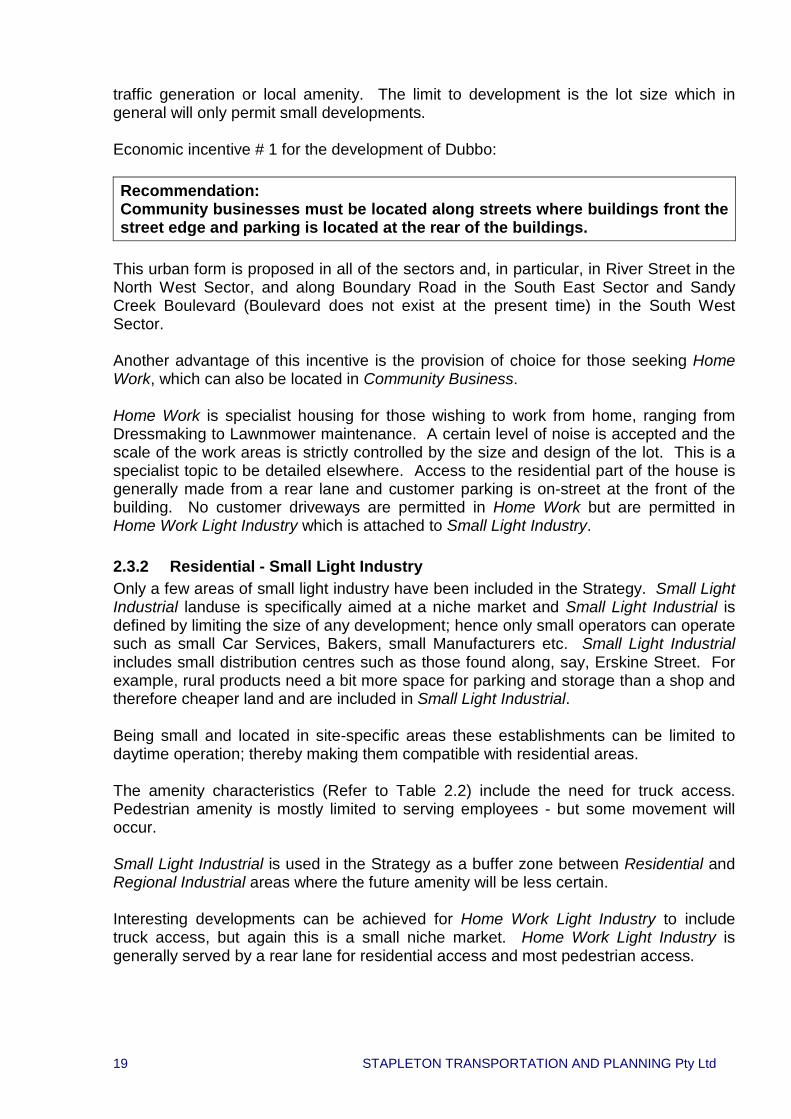
This example could be used at any other location in the proposed new areas. The small local Places encourage local walking which lead to longer trips along more human scale streets and paths. This is how existing grid suburbs work; residents can walk via a multitude of ways to reach destination, or cycle along quiet roads - quiet because more direct ways through an area mean less travel in the local streets and less concentration in the few connective streets that are available in a more closed system. 2.2 THREE BUILT ENVIRONMENTS The land activities have been used in the projections of future employment and population. This is described fully in Section 5. The employment figures are taken from ABS data and then summarised in a form that is applicable to this classification of activities. The land use activities described here are combined to produce input into a Local Environmental Plan. Table 2.2: Three Built Environments
1 LAND ACTIVITIES RESIDENTIAL BUSINESS INDUSTRY Residential Community
Business Small Light Industry
Regional Business
Regional Industry
AMENITY Time Activities Occurring
12 to 16 hrs
10 hrs except Small Retail
10 hrs
10 hrs except Retail 16 hrs
24 hrs
Design Criteria
School Children
Elderly &
vulnerable
Employees Truck
access
Fit Adult
Traffic predominant
Three environments are included in the plan; residential areas, those close to the City centre; and those on the outer parts of Dubbo.

18 STAPLETON TRANSPORTATION AND PLANNING Pty Ltd
2.3 RESIDENTIAL The two primary points in the amenity of a residential area are quietness; particularly at night; and safe streets so people can move about freely. There is a range of expectation and acceptance of these conditions but the underlying facts are absolute safety and the provision of choice of amenity to suit the different markets; not everyone wants the same housing. Previous design attempts so that all residents lived with super quiet background noises even during the day have been disregarded. Vehicle flows of up to 20,000 are now accepted in the Sydney Metropolitan Strategy. Even in quiet Dubbo there are roads with high traffic flows at night, mostly through traffic. However it is easy for Dubbo to set the bar high for residential amenity and choice. Road standards are described in Section 3, housing choice is discussed later. Residential areas can tolerate activity from small businesses and some activities that attract traffic during the day. These are grouped into community businesses and small light industries. 2.3.1 Residential - Community Business The term Community Business is an all encompassing name for activities that are compatible with residential activities and that generate pedestrian activity. These activities attract pedestrians, and not trucks, operate only during the day and are therefore quiet at night. Limiting the size of a development in this category limits the scale of traffic generation and therefore the impact on local streets. It is proposed that a proportion of all residential areas are set aside for Community Businesses, expressed perhaps as so many hectares per say 100 hectares, this is similar to defining open space requirements (or 20m2 per single dwelling lot). Some of the Community Businesses will be of direct benefit to locals, such as doctors, Kindergartens, small offices, and local services; others will offer local employment. The most compatible commercial activities embedded in residential areas are health centres, community buildings, schools, (which have a higher traffic generation for short periods), corner shops and other small shops - (see Residential Section 6). Education is included in this list because of its high pedestrian generation. Primary and High Schools have a low evening use and can therefore be mixed into residential areas. Higher education has more evening activities and more activity throughout the day and is allocated in the Regional Businesses category described shortly. Hotels, open air restaurants and pubs/taverns are also included in the category but defined as Curtilage Activities because they require a curtilage between the activity and the nearest residential housing. In summary; an area defined as Community Business could be used as a small business, small hospital, medial centre or shop without any major difference in either
19 STAPLETON TRANSPORTATION AND PLANNING Pty Ltd
traffic generation or local amenity. The limit to development is the lot size which in general will only permit small developments. Economic incentive # 1 for the development of Dubbo: Recommendation: Community businesses must be located along streets where buildings front the street edge and parking is located at the rear of the buildings.
This urban form is proposed in all of the sectors and, in particular, in River Street in the North West Sector, and along Boundary Road in the South East Sector and Sandy Creek Boulevard (Boulevard does not exist at the present time) in the South West Sector. Another advantage of this incentive is the provision of choice for those seeking Home Work, which can also be located in Community Business. Home Work is specialist housing for those wishing to work from home, ranging from Dressmaking to Lawnmower maintenance. A certain level of noise is accepted and the scale of the work areas is strictly controlled by the size and design of the lot. This is a specialist topic to be detailed elsewhere. Access to the residential part of the house is generally made from a rear lane and customer parking is on-street at the front of the building. No customer driveways are permitted in Home Work but are permitted in Home Work Light Industry which is attached to Small Light Industry. 2.3.2 Residential - Small Light Industry Only a few areas of small light industry have been included in the Strategy. Small Light Industrial landuse is specifically aimed at a niche market and Small Light Industrial is defined by limiting the size of any development; hence only small operators can operate such as small Car Services, Bakers, small Manufacturers etc. Small Light Industrial includes small distribution centres such as those found along, say, Erskine Street. For example, rural products need a bit more space for parking and storage than a shop and therefore cheaper land and are included in Small Light Industrial. Being small and located in site-specific areas these establishments can be limited to daytime operation; thereby making them compatible with residential areas. The amenity characteristics (Refer to Table 2.2) include the need for truck access. Pedestrian amenity is mostly limited to serving employees - but some movement will occur. Small Light Industrial is used in the Strategy as a buffer zone between Residential and Regional Industrial areas where the future amenity will be less certain. Interesting developments can be achieved for Home Work Light Industry to include truck access, but again this is a small niche market. Home Work Light Industry is generally served by a rear lane for residential access and most pedestrian access.
20 STAPLETON TRANSPORTATION AND PLANNING Pty Ltd
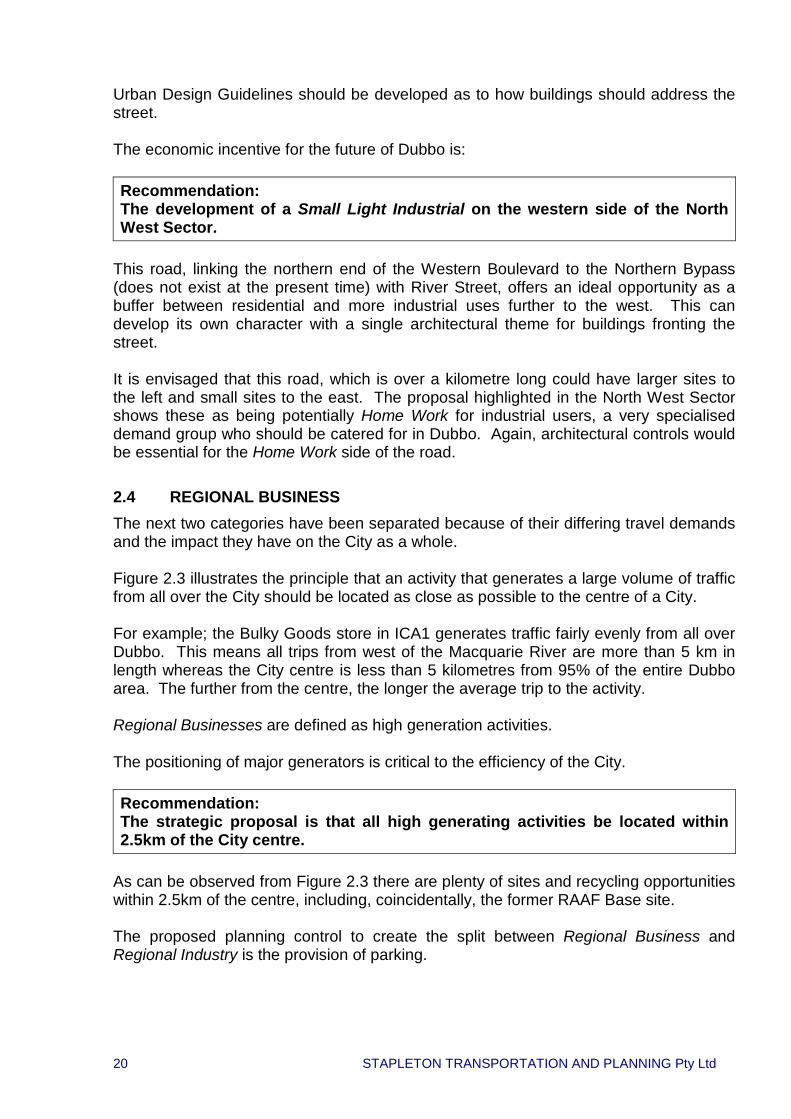
Urban Design Guidelines should be developed as to how buildings should address the street. The economic incentive for the future of Dubbo is: Recommendation: The development of a Small Light Industrial on the western side of the North West Sector.
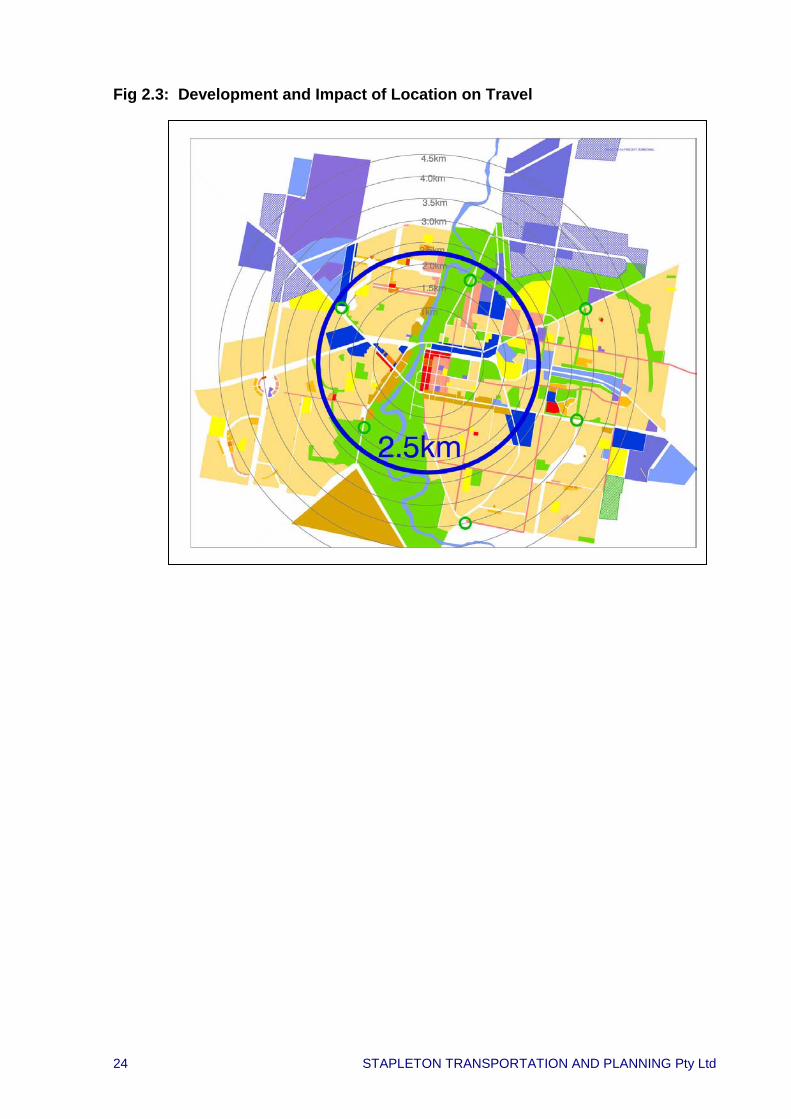
This road, linking the northern end of the Western Boulevard to the Northern Bypass (does not exist at the present time) with River Street, offers an ideal opportunity as a buffer between residential and more industrial uses further to the west. This can develop its own character with a single architectural theme for buildings fronting the street. It is envisaged that this road, which is over a kilometre long could have larger sites to the left and small sites to the east. The proposal highlighted in the North West Sector shows these as being potentially Home Work for industrial users, a very specialised demand group who should be catered for in Dubbo. Again, architectural controls would be essential for the Home Work side of the road. 2.4 REGIONAL BUSINESS The next two categories have been separated because of their differing travel demands and the impact they have on the City as a whole. Figure 2.3 illustrates the principle that an activity that generates a large volume of traffic from all over the City should be located as close as possible to the centre of a City. For example; the Bulky Goods store in ICA1 generates traffic fairly evenly from all over Dubbo. This means all trips from west of the Macquarie River are more than 5 km in length whereas the City centre is less than 5 kilometres from 95% of the entire Dubbo area. The further from the centre, the longer the average trip to the activity. Regional Businesses are defined as high generation activities. The positioning of major generators is critical to the efficiency of the City. Recommendation: The strategic proposal is that all high generating activities be located within 2.5km of the City centre.
As can be observed from Figure 2.3 there are plenty of sites and recycling opportunities within 2.5km of the centre, including, coincidentally, the former RAAF Base site. The proposed planning control to create the split between Regional Business and Regional Industry is the provision of parking.

21 STAPLETON TRANSPORTATION AND PLANNING Pty Ltd
o Sites within 2.5km of the City centre are defined as Regional Businesses and must provide parking for employees and customers; and
o Sites more than 2.5km from the City centre are defined as Regional Industry and must provide parking for employees and trucks only, with customer parking limited to, say, ten car spaces (unlimited truck spaces). Also on-street parking will be restricted on Industrial Roads thereby limiting the development of major traffic generators.
Regional Business includes Hospitals, Higher Education, Major Shopping Centres, including Bulky Good Stores, and Government and Major Commercial Buildings. Accommodation is also included as a regional business; although there are instances where accommodation can be included in community business. This is defined as accommodation and not hotel to differentiate between simple motels that are generally quite quiet and operate similar hours to that of a residential area and hotels that have evening activity. Regional Business also includes Hotels and Pubs and Places of Entertainment, including footpath seating - which are likely to be located in the City centre. An economic incentive for the development of Dubbo is: Recommendation: The extension of Whylandra Street north of the Serisier Bridge into the North West Sector is a highly desirable location that can be developed as a joint venture by Council and other local landholders.
This is an incentive for attracting new businesses into Dubbo for those seeking special places. 2.5 REGIONAL INDUSTRIAL The final category of land activities includes the transport, warehousing and distribution industries and large site industrial activities. Freight handling is strategically located to the north and west of Dubbo and plenty of land has been set aside with 24 hours access to the Freightway. There is sufficient land to cater for large scale industrial uses together with Transport, Distribution and Warehousing. The Regional Industrial areas all have 24 hour access and are mostly located in ICA 1 and 2 located at either end of the City along the Mitchell Highway. This is not so relevant for industrial activities that may not require 24 hour operation but may have the occasional delivery during the night periods. Details of the land take of each of these activities are contained in Section 5 together with details of the land banking for these activities.

22 STAPLETON TRANSPORTATION AND PLANNING Pty Ltd
Table 2.3 summarises the activities contained in each of the land use classifications. Table 2.3: Land Uses in the Built Environments
1 LAND ACTIVITIES RESIDENTIAL BUSINESS INDUSTRY Residential Community
Business Small Light Industry
Regional Business
Regional Industry
AMENITY Time Activities Occurring
12 to 16 hrs
10 hrs except Small Retail
10 hrs
10 hrs except Retail 16 hrs
24 hrs
Design Criteria
School Children
Elderly &
vulnerable
Employees Truck
access
Fit Adult
Traffic predominant
2 LAND USES GROUP Residential Community
Business Small Light Industry
Regional Business Regional Industry
Housing Residential Home Work Home Work Mixed Use No Pedestrian Small Commrcl
Community Blds Health Centres School Motel Small Retail
Rural Distribution [A]
Major Commrcl Government Hospitals TAFE University Motel Major Retail
Noise Curtilage
Open Restaurant Hotel
Pubs Hotel
Truck Light Ind Sml Site Bulky Goods Light Ind Lge Site Warehousing Distribution Truck Stop
Fig 2.1: Illustration of the Catchment from Places - The larger circles indicate places that draw demand from a wide area of over
2km. - The District Places attract demand from just over a kilometre.
23 STAPLETON TRANSPORTATION AND PLANNING Pty Ltd
- The local places are just that but between them they offer interest and rest on a longer journey.
Recommendation: All places should be on a defined network system.
Fig 2.2: Illustration of Access from a random building in Keswick
24 STAPLETON TRANSPORTATION AND PLANNING Pty Ltd
Fig 2.3: Development and Impact of Location on Travel

25 STAPLETON TRANSPORTATION AND PLANNING Pty Ltd
3.0 TRANSPORTATION PRINCIPLES
3.1 THE THREE ALTERNATIVE NETWORKS The underlying principle for the provision of transport networks in Dubbo is to maintain the easy access currently enjoyed by the residents of Dubbo. This can be achieved without changing the amenity of the streets themselves; the main principle is to spread demand to additional low key links. Movement in Dubbo has been structured around the provision of three alternate networks, a road network; a public transport network; and a bike/walk network. This reinforces the principle that the City is providing for alternative lifestyles. Each network will have a strong presence: o The presence of public transport being strengthened by a strong central
transfer, stops that include community facilities and the opportunity to allow buses to stop at any point along residential streets outside peak periods;
o The bike/walk network will be strengthened by segregated paths passing Throughout the neighbourhoods; and
o The roads will be strengthened by a consistency of style for different driving environments.
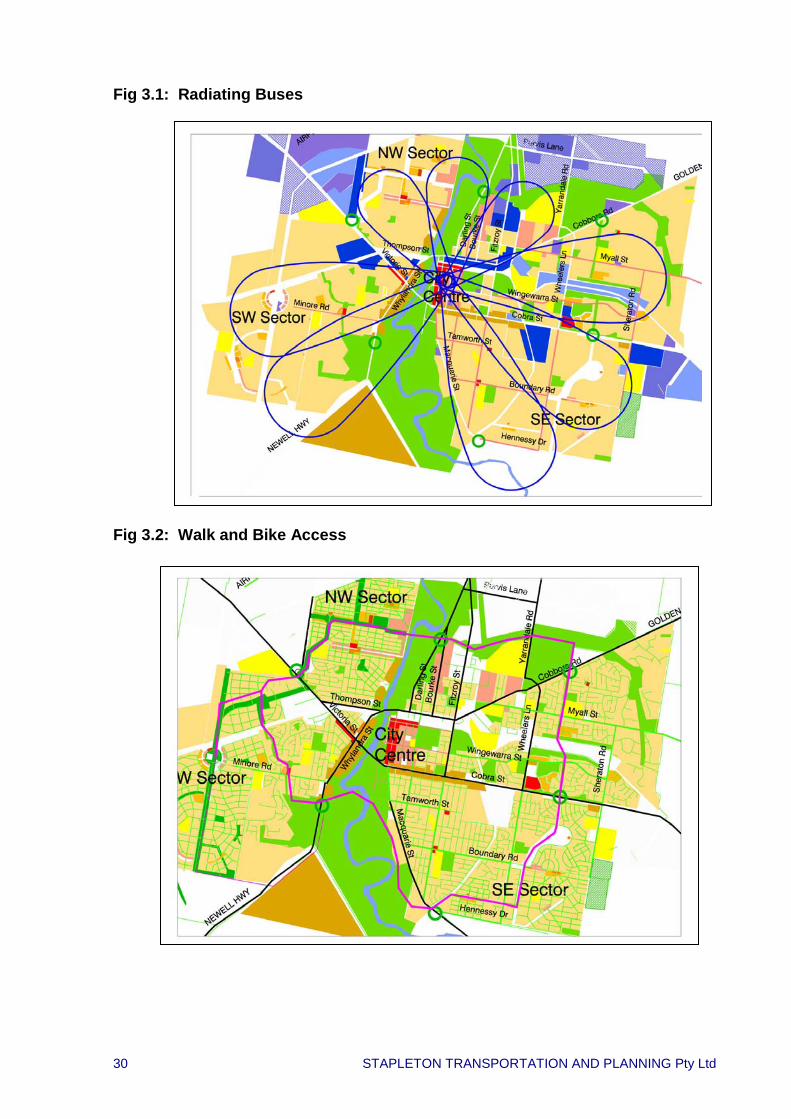
The three networks are part of the City’s strategy for sustainability, providing the City with the resilience to survive economic changes, helping to reduce carbon emissions and being a major attraction for new residents seeking alternative lifestyles. 3.2 PUBLIC TRANSPORT The guiding principles for public transport are to create connective road systems that can accommodate buses that pass within 500m of most households in the existing and new areas of Dubbo. The concept is to allow bus routes to circulate throughout the City every half hour. These would fan out from the City centre to all suburbs and make a loop returning to the City. Hence by catching a local bus into the City and changing onto one of the other bus routes residents will be able to reach any part of the City by pubic transport every half hour. Figure 3.1 describes this system and a more detailed plan is contained in Section 6 which indicates how 12 or so bus routes (one bus on each route) could create this service. During parts of the day buses will stop when hailed along the residential streets. A synergy is created between the lifestyle communities and public transport strategy; each stop becomes a small centre for the community, be it a kiosk, a place for local commerce or retirement housing, a few apartments or a shop. The local streets are designed to focus on these places further emphasising their role in the local community. Residents choosing a quieter lifestyle would live at the edges of the catchment. This has some implication on land use planning described shortly.

26 STAPLETON TRANSPORTATION AND PLANNING Pty Ltd
A fundamental part of successful bus operations is efficient direct services. Bus routes will need to cross through new residential areas and the road connective must be designed to allow for direct services. Every turn is an inconvenience to bus passengers as much as bus operators. Hence an illustrative route network has been produced to indicate the level of connectivity required for each suburb. This will need to be finalised with bus operators. The objective of the outcome from this agreement will be a connective system through new areas that may, but not necessarily will, become bus routes at some time in the future. 3.3 WALKING, BIKING (Biped, Bikes, Boards, Boots and Blades) The focus for local communities is described above and varies according to circumstances. Movement through the City on foot and by bike is structured around three systems o The design of Local Residential Streets to accommodate cyclists and allow the
movement of pedestrians across the street at any random point. This is achieved through performance standards for local streets, described below in section 3.4;
o The design of busier streets to accommodate cyclists along the street and allow the movement of pedestrians across the street in areas that generate pedestrian and cycle movement. These areas include all residential areas and streets through Community Business areas. This is achieved through performance standards for Distributor Street, described below in section 3.4; and
o The design of a shared bike-walking system to provide safe, convenient crossings of all streets and highways and linking to all living area of the City.
The main element of the Shared Bike-Walking Network is to utilise the Green Ring as The Ring. The Ring crosses all roads including State Highways providing a framework of regional connectivity. Combined with the existing bikes routes along the Macquarie Riverside and other links through green wedges this will provide the bases for a “soft mode” movement system throughout Dubbo. Further work will be required to complete the network in a few existing areas in order to provide a complete system. Figure 3.2 illustrates how the three walk networks provide a matrix of options. 3.4 ROAD NETWORKS The road designs are based on the principles that Dubbo; • Is and should remain a ten minute city, • That it is and should develop as a freight distribution truck city, and • That it should continue and expand as a living city offering different
opportunities for the residents and attracting new residents.
27 STAPLETON TRANSPORTATION AND PLANNING Pty Ltd
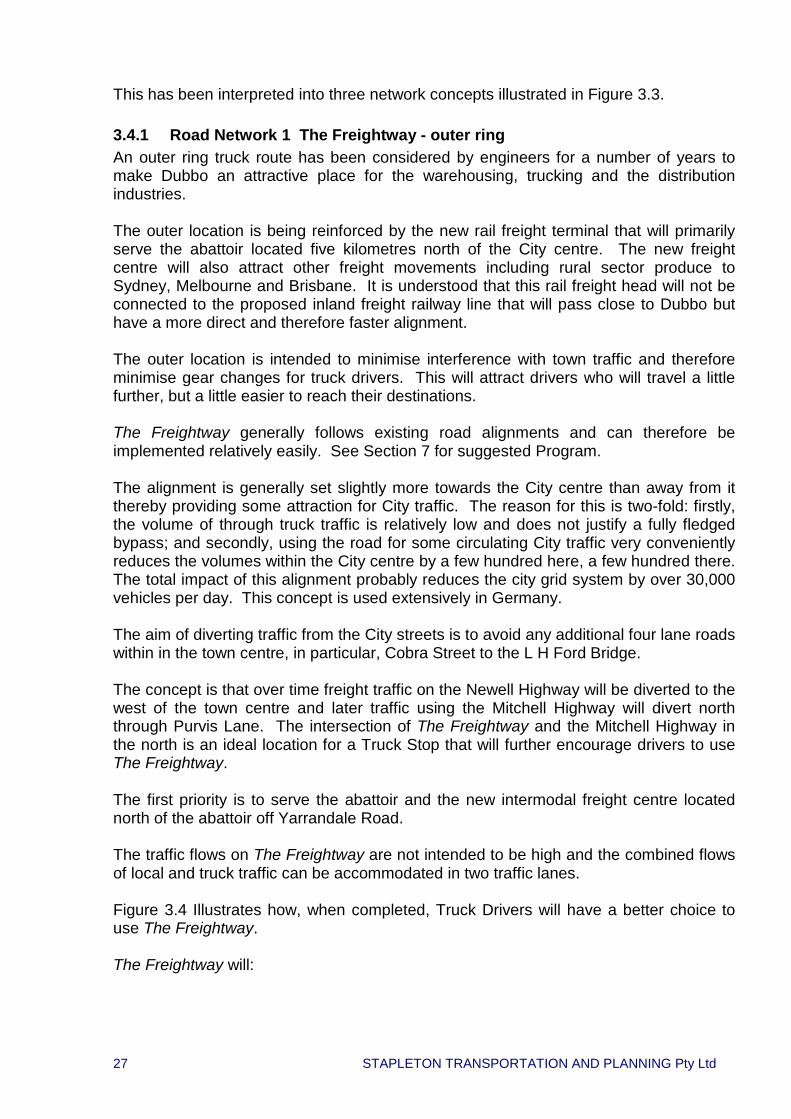
This has been interpreted into three network concepts illustrated in Figure 3.3. 3.4.1 Road Network 1 The Freightway - outer ring An outer ring truck route has been considered by engineers for a number of years to make Dubbo an attractive place for the warehousing, trucking and the distribution industries. The outer location is being reinforced by the new rail freight terminal that will primarily serve the abattoir located five kilometres north of the City centre. The new freight centre will also attract other freight movements including rural sector produce to Sydney, Melbourne and Brisbane. It is understood that this rail freight head will not be connected to the proposed inland freight railway line that will pass close to Dubbo but have a more direct and therefore faster alignment. The outer location is intended to minimise interference with town traffic and therefore minimise gear changes for truck drivers. This will attract drivers who will travel a little further, but a little easier to reach their destinations. The Freightway generally follows existing road alignments and can therefore be implemented relatively easily. See Section 7 for suggested Program. The alignment is generally set slightly more towards the City centre than away from it thereby providing some attraction for City traffic. The reason for this is two-fold: firstly, the volume of through truck traffic is relatively low and does not justify a fully fledged bypass; and secondly, using the road for some circulating City traffic very conveniently reduces the volumes within the City centre by a few hundred here, a few hundred there. The total impact of this alignment probably reduces the city grid system by over 30,000 vehicles per day. This concept is used extensively in Germany. The aim of diverting traffic from the City streets is to avoid any additional four lane roads within in the town centre, in particular, Cobra Street to the L H Ford Bridge. The concept is that over time freight traffic on the Newell Highway will be diverted to the west of the town centre and later traffic using the Mitchell Highway will divert north through Purvis Lane. The intersection of The Freightway and the Mitchell Highway in the north is an ideal location for a Truck Stop that will further encourage drivers to use The Freightway. The first priority is to serve the abattoir and the new intermodal freight centre located north of the abattoir off Yarrandale Road. The traffic flows on The Freightway are not intended to be high and the combined flows of local and truck traffic can be accommodated in two traffic lanes. Figure 3.4 Illustrates how, when completed, Truck Drivers will have a better choice to use The Freightway. The Freightway will:
28 STAPLETON TRANSPORTATION AND PLANNING Pty Ltd
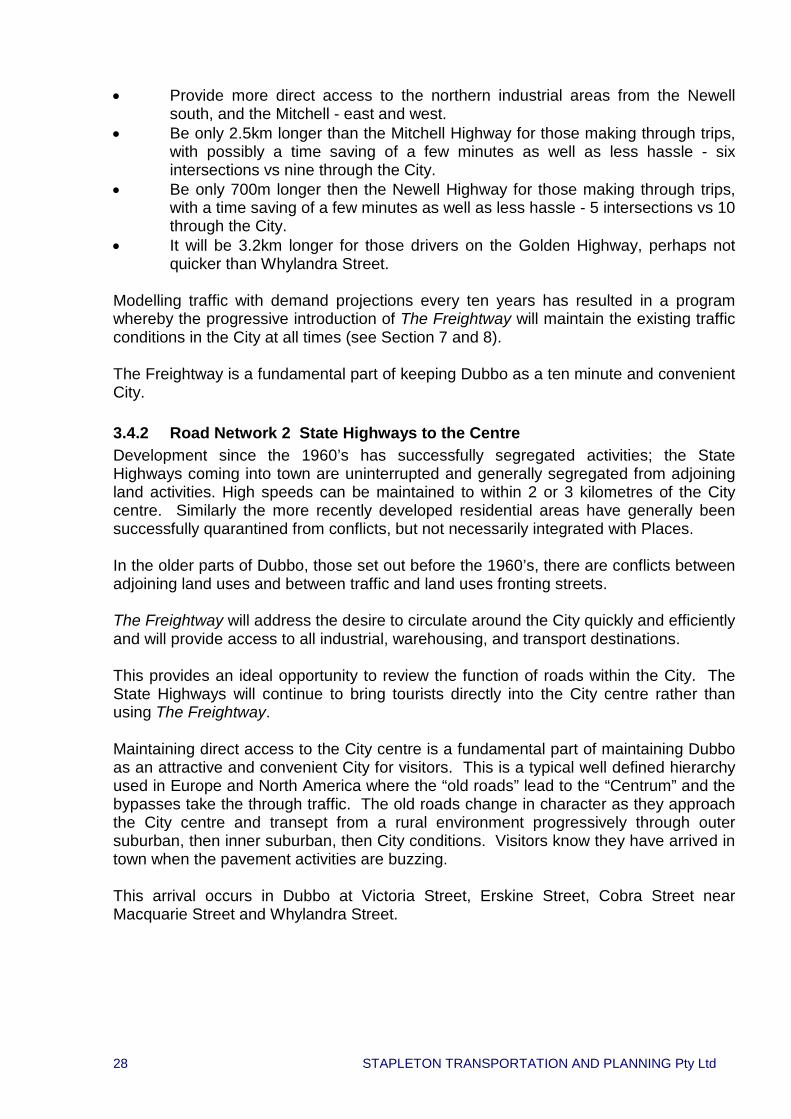
• Provide more direct access to the northern industrial areas from the Newell south, and the Mitchell - east and west.
• Be only 2.5km longer than the Mitchell Highway for those making through trips, with possibly a time saving of a few minutes as well as less hassle - six intersections vs nine through the City.
• Be only 700m longer then the Newell Highway for those making through trips, with a time saving of a few minutes as well as less hassle - 5 intersections vs 10 through the City.
• It will be 3.2km longer for those drivers on the Golden Highway, perhaps not quicker than Whylandra Street.
Modelling traffic with demand projections every ten years has resulted in a program whereby the progressive introduction of The Freightway will maintain the existing traffic conditions in the City at all times (see Section 7 and 8). The Freightway is a fundamental part of keeping Dubbo as a ten minute and convenient City. 3.4.2 Road Network 2 State Highways to the Centre Development since the 1960’s has successfully segregated activities; the State Highways coming into town are uninterrupted and generally segregated from adjoining land activities. High speeds can be maintained to within 2 or 3 kilometres of the City centre. Similarly the more recently developed residential areas have generally been successfully quarantined from conflicts, but not necessarily integrated with Places. In the older parts of Dubbo, those set out before the 1960’s, there are conflicts between adjoining land uses and between traffic and land uses fronting streets. The Freightway will address the desire to circulate around the City quickly and efficiently and will provide access to all industrial, warehousing, and transport destinations. This provides an ideal opportunity to review the function of roads within the City. The State Highways will continue to bring tourists directly into the City centre rather than using The Freightway. Maintaining direct access to the City centre is a fundamental part of maintaining Dubbo as an attractive and convenient City for visitors. This is a typical well defined hierarchy used in Europe and North America where the “old roads” lead to the “Centrum” and the bypasses take the through traffic. The old roads change in character as they approach the City centre and transept from a rural environment progressively through outer suburban, then inner suburban, then City conditions. Visitors know they have arrived in town when the pavement activities are buzzing. This arrival occurs in Dubbo at Victoria Street, Erskine Street, Cobra Street near Macquarie Street and Whylandra Street.

29 STAPLETON TRANSPORTATION AND PLANNING Pty Ltd
Recommendation: The urban design of these locations needs to stress the arrival in the City and attract tourists to think they will have a look around.
3.4.3 Road Network 3 Distribution Grid It is proposed that the distribution of City traffic will be accommodated using a grid of roads that will serve cross City and City movement. These roads are intended to move residents quickly and safely around town whilst not offering an attractive way for trucks who will use the Freightway. The purpose of The Distribution Grid is two fold: (i) To spread traffic and have no major concentrations of traffic. Concentrations
tend to result in large intersection designs which not only create delays for traffic in terms of longer signal phasing but also become barriers to pedestrian movement both as a source of noise and possibility of difficulty of crossing the streets; and
(ii) To limit traffic flows so they are consistent with adjoining land activities, creating both economic opportunities, for say, activities requiring some level of exposure to passing traffic; and traffic environments that are consistent with those activities. Another synergy, bring a little more traffic along a road in a residential area and then locate some activities that are consistent with residential living but happy to be located on a slightly busier street. (See community business in Section 2).
Hence, The Distribution Grid is one of the key design elements of the City. There is another urban model, develop major generators outside the City, do not provide alternatives to the central strategies, create very busy streets and chase away the customers to the edge of the city; this is not recommended. Increases in traffic demand will be accommodated by The Freightway and additional links in the The Distribution Grid that will progressively and significantly reduce traffic that would otherwise be to the detriment of the City centre. In this way tourists and residents will be continuing to travel in the central area with no appreciable change in conditions over the years and this will allow the street environments to compliment tourist activities.
30 STAPLETON TRANSPORTATION AND PLANNING Pty Ltd
Fig 3.1: Radiating Buses Fig 3.2: Walk and Bike Access

31 STAPLETON TRANSPORTATION AND PLANNING Pty Ltd
Fig 3.3: Three Road Networks Fig 3.4: Travel times along Freightway
MITCHELL HWY
AIRPORT
MITCHELL HWY
NEWELL HWY
GOLDEN HWY
Purvis Lane
Myall St
Cobra St
Wingewarra St
Tamworth St
Boundary Rd
Hennessy Dr
Minore Rd
Dar
ling
St
Fitz
roy
St
Whe
eler
s Ln
Macquarie St
Bour
ke S
t
Sher
aton
Rd
Thompson St
Cobbora RdYarra
ndal
e Rd
Why
landr
a St
Victoria St
SouthDubbo
CityCentre
100km/h
100km/h 100km/h
100km/h
80km
/h
80km/h
80km/h
30km
/h
80km
/h
40km
/h
30kmh 50kmh
10.4
km
9.9km
30km/h
80km
/h
further2.5km12.4 km
divert east Mitchell
Newell divertwest andnorth11.1km 700m further
and north

32 STAPLETON TRANSPORTATION AND PLANNING Pty Ltd
4.0 ROAD SYSTEMS
4.1 MAXIMUM TRAFFIC FLOWS There is a certain amount of the “chicken and egg” scenario about designing a road system suitable for local environments. Traffic in Dubbo operates well and flows relatively easily. There are few major issues and these are being addressed as and when the need arises. This analysis follows the course of what street environments could be achieved given the future traffic flows and then describes street profiles that could achieve these environments. The analysis uses the modelling results and considers a range of three traffic flows. The traffic ranges measure how streets could function and how it might change in the future, in effect to give a warning of changes along the existing roads in Dubbo that might or might not be acceptable. Streets with a flow of less than 6,000 vehicles per day [vpd] are easily adaptable to pedestrians and turning traffic and are described as a Connector. Flows of 6,000 - 11,000 vpd require some form of management, such as a median island, to provide the optimum conditions for turning traffic and pedestrians and are described as a Distributor. Flows of greater than 11,000 - 15,000 vpd, can be accommodated in one lane per direction turning lanes but pedestrian movement must be channelled to specific crossings. These are described as Sub-Arterial Roads. There are few streets in Dubbo with flows in excess of 15,000 vpd and they are generally segregated Arterial Roads with no access to buildings. Section 4.4 illustrates which streets currently fall within the three ranges. Section 4.6 examines which of these will change in the future. 4.2 PERFORMANCE OF EXISTING ROADS The performance of existing roads and future roads has been reviewed as a measure of the opportunity for the management of the function of Streets. Figure 4.1 illustrates the ranges in traffic flow for 2006 that are described below. Considering firstly the State Highways, parts of each have volumes in the range of 11,000 to 5,000 vpd therefore being defined as Sub-Arterial Roads. o The Mitchell Highway (Cobra Street) is one of the busier roads in Dubbo
operating as a Sub-Arterial Road except for a small section near the former RAAF Base and across the L H Ford Bridge where it is busier.

33 STAPLETON TRANSPORTATION AND PLANNING Pty Ltd
o The Newell Highway is operating as a Sub-Arterial Road from Minore Road in the south to Fitzroy Street.
o The Golden Highway (Cobbora Road) is operating as a Sub-Arterial Road north
to Wheelers Lane. Streets operating in this volume range indicate that pedestrian access across the street maybe an issue. In the case off Cobra Street the pedestrian access is managed well by partial median. The other sections of State Highway generally do not pass through areas requiring high pedestrian amenity. The sections of streets in Residential Neighbourhoods that are also operating as Sub-Arterial Roads with more than 11,000 vpd include: o Parts of Wheelers Lane, north of the Mitchell Highway; o Myall Street; and o A short section of Fitzroy Street. These results highlight the lack of north south connectivity discussed in Section 4.3. There is a small anomaly in the graduation of streets with Sheraton Road south of the Mitchell Highway showing up as having a flow in excess of 11,000 vpd. This section of Sheraton Road is essentially a cul-de-sac serving three large schools and a quarry and therefore carrying a large volume of traffic during two short periods of the day. The result of amalgamating these peak period flows describes Sheraton Road as Sub-Arterial with issues of pedestrian access and this is a good reminder of the issues on this section of Sheraton Road. Sections of street in residential areas operating in the range of 6,000 - 11,000 vpd (Distributor Roads) include: o Wingewarra Street in a short section directly north of the RAAF site - again this
is because of the lack of connectivity in this area which is restricted to two east west routes;
o Sheraton Road, north of the Mitchell Highway; and o Parts of North Dubbo. The residential composition of North Dubbo is generally unaffected by these higher flows which are mostly in sections of streets with warehousing, distribution and car sale uses. The future of North Dubbo is under consideration by Council and the concept of a Regional Business Centre is included in this Strategy. This will not address the protection of, or future of the historic precinct north of Erskine Street. The majority of streets in Dubbo carry less than 6,000 vpd with traffic operating very smoothly and pedestrian movement unconstrained by the traffic. All roads south of Cobra Street (with the exception of Sheraton Road at the school sites) and in the western part of Dubbo are operating with less than 6,000 vpd and can be defined as Connectors.

34 STAPLETON TRANSPORTATION AND PLANNING Pty Ltd
In conclusion, the streets of Dubbo are well managed and the flows can be managed to suit local conditions. 4.3 ANALYSIS OF EXISTING CONNECTIVITY The connectivity of the existing road network is summarised in Figure 4.2 which shows some of the barriers to traffic movement that exist in Dubbo and the analysis considers whether these have any impact on the existing traffic conditions. 4.3.1 The North-East An evaluation of an existing grid highlights the value of such a grid. Traffic delays are currently experienced along Cobbora Road and, to a lesser extent, crossing the Macquarie River. In the north east, traffic is funnelled into Cobbora Road via three rail crossings over three kilometres, including Fitzroy Street, Wheelers Lane and Sheraton Road (see figure 4.2). This is an important movement between the residential areas and the industrial areas to the north of the City. The limited alternatives are exacerbated by the termination of Sheraton Road at Cobbora Road which, in effect, reduces traffic to two north south routes crossing through the existing town. This reduction to two crossings forces more traffic along Fitzroy Street and even this is exacerbated further by the 2.3 kilometre barrier created by the Institutions Precinct, including the hospital, TAFE and University. Many drivers must use Cobbora Road to cut across to, say, Bourke Street, and hence there is additional traffic in the area which is now being addressed by new road improvements. There are no easy answers to the barriers in the North East. o The Eastern Section of the Outer Ring Road is too far east to be of much use
by local traffic. o One more crossing of the railway line near Welchman Street will lead to more
traffic to the constraint of Cobbora Road but would reduce traffic slightly in Wheelers Lane.
o Unfortunately an agreement between the major players in the Institutions Precinct a few years ago precludes the extension of River Street through to Cobbora Road which would offer one more link through the area.
o The extension of Myall Street is included in the plan adding one street through this barrier. Whilst this is shown to work for the next 40 years, it does raise an interesting point about the needs for the next generation.
4.3.2 The South-East In the South East a barrier has been created by the Molong Railway line south of Cobra Street. This 1.5 kilometre barrier is less important today but will become more noticeable with the development in the SE sector, as will the Wheelers Lane and Fitzroy Street links from the south east to the industrial area. One further crossing has been included south of Boundary Road. This will connect one new residential area of 400 lots and there is the possibility that the rail line will be re-established as a freight line.

35 STAPLETON TRANSPORTATION AND PLANNING Pty Ltd
4.3.3 The South-West Of more concern are the two long barriers already created to confine access to the South West. Currently Minore Road is the only access to this area and its existing residential frontage adjacent to Whylandra Street limits its future use as a Sub-Arterial Road. These two gaps consist of 2.3 kilometres south of Minore Road, practically to the edge of urban development, and another 1.7 kilometres between Minore Road and Joira Road. Ideally traffic is distributed by roads every 800 or so metres and there should be three roads in four kilometres not one. This has been addressed, to some extent by the linking of the western areas across the railway line to the Mitchell Highway north of Jannali Road along the “Western Boulevard”. This is not ideal and will lead to some difficulties in the early stages of development when the cost of the bigger road will not be appreciated. (See further Section 6). 4.3.4 The Macquarie River The more obvious barrier to movement in Dubbo has traditionally been the river which has two crossings to the City centre. Some movement is made at the Troy Gully Bridge north of the City towards the abattoir but this is limited to lighter vehicles and not part of the proposed truck route. The issue of limited river crossings can at least be addressed by making additional crossings, albeit they may be expensive. However, the other barriers which are described above are more permanent because they go through urban infrastructure which is very difficult to open up once closed. Two elements of the Strategic Plan address connectivity and spreading traffic. o The Freightway will remove trucks from the City centre; o The Distribution Grid is designed specifically to spread traffic away from focal
points creating the opportunity for the Functional Road Hierarchy to work throughout Dubbo.
The Road Network has been described in Section 3, a summary of the operating conditions on existing roads is described below using the same terminology as that used to describe the existing traffic conditions in Section 4.2 above. 4.4 FUTURE ROAD FLOWS 4.4.1 Existing Streets The modelling for 2036 has been used to compare future with existing traffic. This is to indicate the sections where traffic flows are likely to vary. The following difference in road operations will occur by 2036 (Refer to Figure 4.3 for numbering):
1. Baird Street will change from a Neighbourhood Connector to a
Neighbourhood Distributor. This is a serious downgrading of a residential

36 STAPLETON TRANSPORTATION AND PLANNING Pty Ltd
street and is a direct result of the lack of connectivity built into the local road network. Further traffic management will be required in Baird Drive.
2. Minore Road east of Joira Road will change to a Neighbourhood Distributor
and to a Sub-Arterial as it approaches the Newell Highway (see Figure 4.3.) This is the result of the lack of connectivity to serve the western part of Dubbo.
It should also be noted that the new “Western Boulevard” from the Mitchell Highway to the railway bridge at Chapmans Road will need to be designed as a Sub-Arterial. This can be designed accordingly but is likely to be costly during the early stages of residential development from the Mitchell Highway.
3. Macquarie Street, south of Tamworth Street, is currently carrying less than
6,000 vpd including rural traffic to the south of the city and hence local residents are not cut off from the River Front. The volume in Macquarie Street is expected to increase to Sub-Arterial volumes north of Boundary Road and to a Neighbourhood Distributor north of Hennessy Drive. This is the result of development in the South East Sector.
4. In the North East:
o Myall Street changes in its character to the west of Cobbora Road extending as a Sub-Arterial to east of Sheraton Road.
o Similarly Sheraton Road north of Cobra Street changes from a Neighbourhood Distributor to a Sub-Arterial.
o Part of Wheelers Lane north of Wingewarra Street will also change in character from a Neighbourhood Distributor to Sub-Arterial.
All three streets are designed to accommodate this sort of volume of traffic. However, it does indicate that the argument for putting too little connectivity, which cannot be changed in this case will show up in the future. It also puts a good case forward for the construction of the Eastern Bypass to allow some traffic to avoid these streets.
5. The only street in Dubbo South, apart from Macquarie Street, to change status
is Boundary Road where the flow is predicted to exceed 6,000 vpd a short section approaching Fitzroy Street. This is not a particularly serious volume deficiency and can be managed, but this anomaly highlights how the potential connection across the former RAAF Base would have avoided such a hiccup.
It also indicates how further connectivity to Boundary Road further east could have a detrimental effect on the environment in South Dubbo. No such connections are proposed in the Strategy.
6. Cobra Street is already carrying 11,000 to 15,000 vpd along most of its length
with parts of it exceeding this Sub-Arterial limit. It is generally designed to accommodate this flow, including upgrading of the intersection with Fitzroy
37 STAPLETON TRANSPORTATION AND PLANNING Pty Ltd
Street. Pedestrian movement is also well accommodated. More management of pedestrian accessibility will be required between Darling Street and Wheelers Lane. The important point of this analysis is that the section near the City centre between Darling Street and Macquarie Street does not increase over the Distributor status and, thus, is suitable for the location of motels and the increased pedestrian activity that is expected in this section. The results of the traffic modelling strongly support the argument that Cobra Street should not be upgraded.
Handling the pedestrian activity in this heavy traffic is quite satisfactory with median treatments which can be extended the length of the street to the Orana Mall.
7. The Mitchell Highway continuing west of Thompson Street is also extending as
a high capacity link but this runs through a suitable environment to support such a road and is not of any concern.
8. Victoria Street through West Dubbo is also expected to exceed the Sub-
Arterial limit but this can be handled by median treatments that will be very suitable for this retail area.
In some ways this will be the only “busy” main street, very similar to roads in Orange and Sydney.
9. Thompson Street will change to a Business Distributor by 2036 but this is not
of concern as the road is designed for these volumes.
Again the interesting point about this analysis is that the areas of South Dubbo do not change from their current status by 2036. One of the concerns of connecting Minore Road to the extension of Tamworth Street as a bridge link was the possibility that traffic would filter through South Dubbo. This is shown not to occur at all and is not a concern for the future. In summary, the new roads can all be designed as low-key connector roads (as one exception) and the condition of some existing streets will deteriorate. 4.5 ROAD HIERARCHY Using a grid follows very traditional transport concepts, indeed from Roman times, that have recently been adopted in the development of the SW and NW Sectors in Sydney, the development of Perth and recent developments in Brisbane. The Road Hierarchy is an interpretation of standards used in WA, SA, QLD and VIC and applied in planning the SW Sector and the NW Sector of urban expansion in Sydney. The principle for the proposed Road Hierarchy is to adopt road profiles that meet the amenity of users in the different land activities.
38 STAPLETON TRANSPORTATION AND PLANNING Pty Ltd
The maximum traffic flows in the proposed Road Hierarchy are set to let traffic operate at a convenient level of service and to create suitable permeability for pedestrian movement. The success of the new roads in distributing traffic across central Dubbo simplifies the Road Hierarchy. In effect, nearly all new streets can be built in the same manner with two traffic lanes and two parking lanes and access to properties that vary with the volume of traffic using the street. In practice, developers and future Councils will wish to vary the street designs. This Strategic Plan should therefore define the Hierarchy in such a way as to offer that flexibility whilst maintaining the safety and convenience of all users. The principles for determining suitable street profiles are the combination of access and amenity; convenience for all users. Two levels of decision-making are proposed: (i) choosing the width of the right of way; and (ii) choosing the profile of the street in the right of way. The width of the right of way is required for planning purposes: o 20m for Connectors; o 25m for Distributors and Sub-Arterials; o 30m for Arterial Road; o The right of way for local streets will vary with conditions. The following sections discuss the Road Hierarchy in more detail. 4.5.1 Local Streets Local Streets will often carry less than 500 vpd and generally less than 1,000 vpd. Flows of greater than 3,500 vpd require two traffic lanes and two parking lanes and are referred to as Connectors. Local Streets are intended for use by local traffic, bikes, pedestrians moving about the neighbourhood, the occasional delivery vehicle and parking which occasionally is intensive. The location of Local Streets has not been defined in the Strategy except for the requirement to link a bus route across residential areas between Connectors. This is defined in the Strategy (see Section 6.) The lower order Local Streets need only be 7.5m wide to accommodate these demands; these are referred to as Option 2 in Table 4.5.1. Some developers prefer to use a more traditional street 12.6m in width. The speed in such streets needs to be restrained either by the length of the block or other means. Placing landscape, trees and bushes in small blocks in the parking lane can reduce speed in local streets.
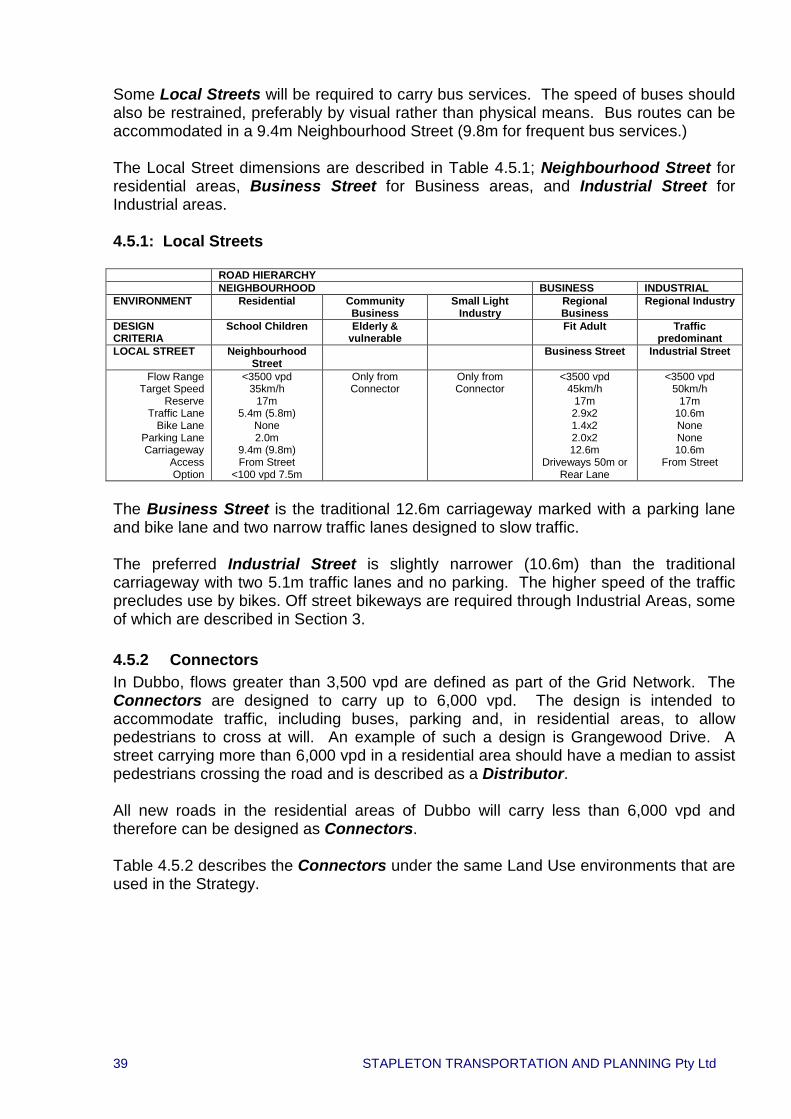
39 STAPLETON TRANSPORTATION AND PLANNING Pty Ltd
Some Local Streets will be required to carry bus services. The speed of buses should also be restrained, preferably by visual rather than physical means. Bus routes can be accommodated in a 9.4m Neighbourhood Street (9.8m for frequent bus services.) The Local Street dimensions are described in Table 4.5.1; Neighbourhood Street for residential areas, Business Street for Business areas, and Industrial Street for Industrial areas. 4.5.1: Local Streets ROAD HIERARCHY NEIGHBOURHOOD BUSINESS INDUSTRIAL ENVIRONMENT Residential Community
Business Small Light
Industry Regional Business
Regional Industry
DESIGN CRITERIA
School Children Elderly & vulnerable
Fit Adult Traffic predominant
LOCAL STREET Neighbourhood Street
Business Street Industrial Street
Flow Range Target Speed
Reserve Traffic Lane
Bike Lane Parking Lane Carriageway
Access Option
<3500 vpd 35km/h
17m 5.4m (5.8m)
None 2.0m
9.4m (9.8m) From Street
<100 vpd 7.5m
Only from Connector
Only from Connector
<3500 vpd 45km/h
17m 2.9x2 1.4x2 2.0x2 12.6m
Driveways 50m or Rear Lane
<3500 vpd 50km/h
17m 10.6m None None 10.6m
From Street
The Business Street is the traditional 12.6m carriageway marked with a parking lane and bike lane and two narrow traffic lanes designed to slow traffic. The preferred Industrial Street is slightly narrower (10.6m) than the traditional carriageway with two 5.1m traffic lanes and no parking. The higher speed of the traffic precludes use by bikes. Off street bikeways are required through Industrial Areas, some of which are described in Section 3. 4.5.2 Connectors In Dubbo, flows greater than 3,500 vpd are defined as part of the Grid Network. The Connectors are designed to carry up to 6,000 vpd. The design is intended to accommodate traffic, including buses, parking and, in residential areas, to allow pedestrians to cross at will. An example of such a design is Grangewood Drive. A street carrying more than 6,000 vpd in a residential area should have a median to assist pedestrians crossing the road and is described as a Distributor. All new roads in the residential areas of Dubbo will carry less than 6,000 vpd and therefore can be designed as Connectors. Table 4.5.2 describes the Connectors under the same Land Use environments that are used in the Strategy.

40 STAPLETON TRANSPORTATION AND PLANNING Pty Ltd
4.5.2: Connectors ROAD HIERARCHY NEIGHBOURHOOD BUSINESS INDUSTRIAL ENVIRONMENT Residential Community
Business Small Light
Industry Regional Business
Regional Industry
DESIGN CRITERIA
School Children Elderly & vulnerable
Fit Adult Traffic predominant
LOCAL STREET Neighbourhood Street
Business Street Industrial Street
Flow Range Target Speed
Reserve Traffic Lane
Bike Lane Parking Lane Carriageway
Access Option
3500-6000 vpd 45km/h
20m 2.9x2 1.4x2 2.0x2 12.6m
From Street or
See Business 35km/h
Rear Lane
See Industrial 45km/h
Street or Rear Ln
3500-6000 vpd 35km/h
20m 2.9x2 1.4x2 2.0x2 12.6m
Rear Lane
3500-6000 vpd 50km/h
20m 4.9x2 1.4x2 None 12.6m
From Street
The Neighbourhood Connector includes a parking lane (2.0m), bike lane (1.4m) and traffic lane 2.9m) in each direction (12.6m overall bitumen). Occasional planting is desirable in the parking lane. This Neighbourhood Connector can be accommodated in a 20m reserve. Provided that properties are served by a rear lane then the same road profile can be used to serve a Community Business or Home Work. The rear lane is required to serve residential parking and the street parking is used by customers (and may require time restrictions). The same road profile can also be used for the (Regional) Business Connector. There are no new Business Connectors in the Dubbo Strategic Plan, if there were they would require rear lane access thereby allowing space for customer parking on the Connector. The Industrial Connector varies from Business and Neighbourhood Connectors because they are used by trucks that need more space for manoeuvring. Hence, parking is excluded from Industrial Connectors and the Industrial Distributor. Since speed and pedestrian safety for children is less of a priority in industrial areas, there is no need for physical means of speed controls. The Industrial Connector is also 12.6m in width with two wide traffic lanes and, since no parking is required two bike lanes can be included by the kerb. Some developers may wish to build more luxurious roads, such as Grangewood Drive, and any design is suitable provided that the needs of pedestrians, bikes and buses are all met. Grangewood Drive is built to standards similar to a Neighbourhood Distributor, which that is described next.

41 STAPLETON TRANSPORTATION AND PLANNING Pty Ltd
4.5.3 Distributor Avenues The flow range for Distributors is 6,000 - 11,000 vpd. No roads are projected to operate in the flow range in the new areas of Dubbo and therefore no distributors are required in Dubbo. However, the design of an “Avenue” may be preferred for streets with lesser volumes. 4.5.3: Distributor ROAD HIERARCHY NEIGHBOURHOOD BUSINESS INDUSTRIAL ENVIRONMENT Residential Community
Business Small Light
Industry Regional Business
Regional Industry
DESIGN CRITERIA
School Children Elderly & vulnerable
Fit Adult Traffic predominant
Distributor Neighbourhood Distributor
Business Distributor
Industrial Distributor
Flow Range Target Speed
Reserve
Traffic Lane Bike Lane
Parking Lane Carriageway
Median Access
6000-11000 vpd 45km/h
20m (Avenue)
2.9x2 1.4x2 2.0x2
2x6.3m Min 3.1m
<9000 vpd Street
See Business
Not Compatible 6000-11000 vpd 45km/h
25m (Avenue)
2.9x2 1.4x2 2.0x2
2x6.3m Min 3.1m
50m min/Rear Ln
6000,11000 vpd 50km/h
25m Turning lane
4x3 1.4x2 None 14.8m
Turning lane From Street
The “Avenue” profile has the same parking (2.0m), bike (1.4m) and traffic (2.9m) lanes as a Connector; this will maintain the operating speed to 45km/h. The Distributors have a central median to use as a pedestrian refuge. The Neighbourhood Distributor is the same as the Business Distributor with the exception that the Business Distributor requires access from a rear lane or driveways at intervals of not less than 50m to enhance the pedestrian environment. Median crossings are not desirable and hence driveways can only be entered as left in left out, except for access to major carparks. The Neighbourhood Distributor should also include rear lane or service road access when the flow exceeds 9,000 vpd because it is difficult to reverse out of a small residential driveway into a higher flow of traffic. The Industrial Distributor is similar to parts of Cobra Street - two traffic lanes and a wide turning lane allowing access into adjacent industrial properties. 4.5.4 Sub-Arterial Avenues and Boulevards The only new street which will attract more than 11,000 vpd is the proposed “Western Boulevard” between the Mitchell Highway and the “Western Freightway”. This demand is unsuited for simple pedestrian access and pedestrians should be restricted to fixed crossings (similar to Sheraton Road.) Two design profiles are available in this range, the “Avenue”, as described for a Distributor and the Boulevard.
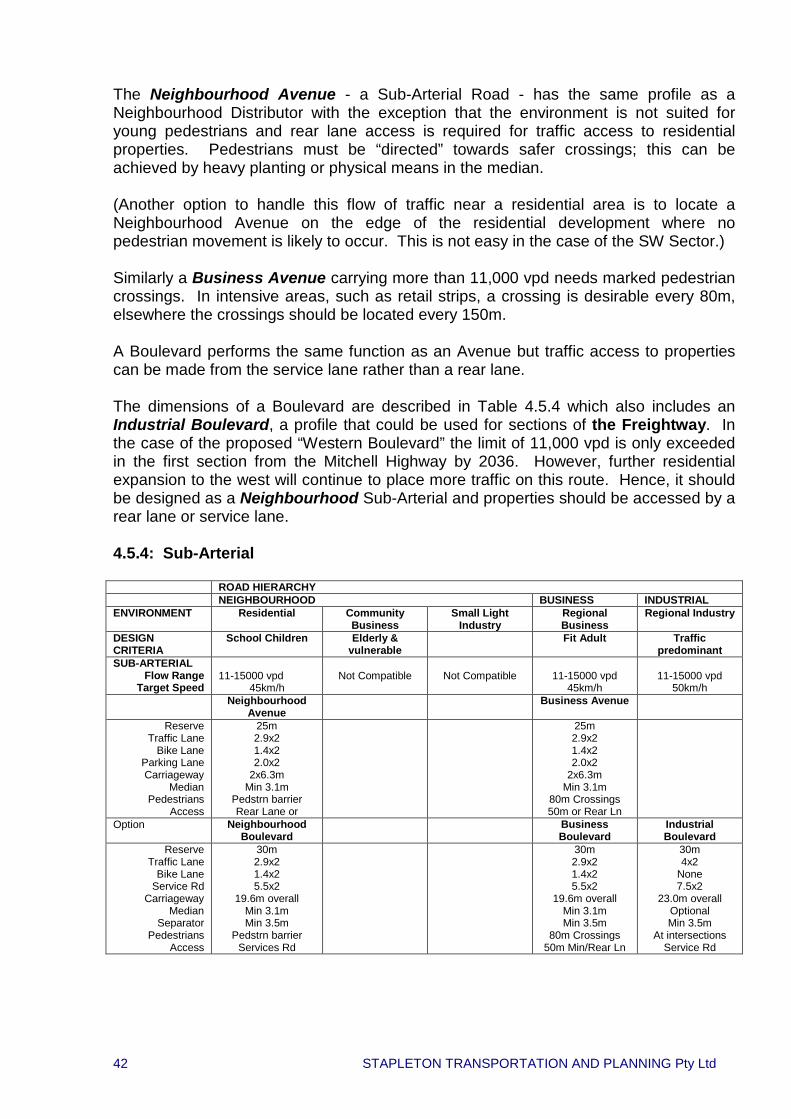
42 STAPLETON TRANSPORTATION AND PLANNING Pty Ltd
The Neighbourhood Avenue - a Sub-Arterial Road - has the same profile as a Neighbourhood Distributor with the exception that the environment is not suited for young pedestrians and rear lane access is required for traffic access to residential properties. Pedestrians must be “directed” towards safer crossings; this can be achieved by heavy planting or physical means in the median. (Another option to handle this flow of traffic near a residential area is to locate a Neighbourhood Avenue on the edge of the residential development where no pedestrian movement is likely to occur. This is not easy in the case of the SW Sector.) Similarly a Business Avenue carrying more than 11,000 vpd needs marked pedestrian crossings. In intensive areas, such as retail strips, a crossing is desirable every 80m, elsewhere the crossings should be located every 150m. A Boulevard performs the same function as an Avenue but traffic access to properties can be made from the service lane rather than a rear lane. The dimensions of a Boulevard are described in Table 4.5.4 which also includes an Industrial Boulevard, a profile that could be used for sections of the Freightway. In the case of the proposed “Western Boulevard” the limit of 11,000 vpd is only exceeded in the first section from the Mitchell Highway by 2036. However, further residential expansion to the west will continue to place more traffic on this route. Hence, it should be designed as a Neighbourhood Sub-Arterial and properties should be accessed by a rear lane or service lane. 4.5.4: Sub-Arterial ROAD HIERARCHY NEIGHBOURHOOD BUSINESS INDUSTRIAL ENVIRONMENT Residential Community
Business Small Light
Industry Regional Business
Regional Industry
DESIGN CRITERIA
School Children Elderly & vulnerable
Fit Adult Traffic predominant
SUB-ARTERIAL Flow Range
Target Speed
11-15000 vpd
45km/h
Not Compatible
Not Compatible
11-15000 vpd
45km/h
11-15000 vpd
50km/h Neighbourhood
Avenue Business Avenue
Reserve Traffic Lane
Bike Lane Parking Lane Carriageway
Median Pedestrians
Access
25m 2.9x2 1.4x2 2.0x2
2x6.3m Min 3.1m
Pedstrn barrier Rear Lane or
25m 2.9x2 1.4x2 2.0x2
2x6.3m Min 3.1m
80m Crossings 50m or Rear Ln
Option Neighbourhood Boulevard
Business Boulevard
Industrial Boulevard
Reserve Traffic Lane
Bike Lane Service Rd
Carriageway Median
Separator Pedestrians
Access
30m 2.9x2 1.4x2 5.5x2
19.6m overall Min 3.1m Min 3.5m
Pedstrn barrier Services Rd
30m 2.9x2 1.4x2 5.5x2
19.6m overall Min 3.1m Min 3.5m
80m Crossings 50m Min/Rear Ln
30m 4x2
None 7.5x2
23.0m overall Optional Min 3.5m
At intersections Service Rd

43 STAPLETON TRANSPORTATION AND PLANNING Pty Ltd
The design of the Neighbourhood Boulevard is similar to the Distributor with a parking lane (2.0m), bike lane (1.4m), traffic lane (2.9m) and median for through traffic. Residents facing the proposed “Western Boulevard” will have driveways to Service Roads. The service road (5.5m) will be separated from the through road by a 3.5m separator. The Industrial Boulevard is designed to allow trucks to access properties from the Service Road; the two through lanes do not need to be separated by a median. 4.5.5 Arterials The range of flow for Arterial Roads for application in Dubbo is 15,000 - 21,000 vpd. State Highways are also Arterial Roads with rural characteristics and flows in the range of 3,500 to 8,000. These roads conform to RTA standards. Traffic will exceed 15,000 vpd on Victoria Street in West Dubbo by 2036. This is defined as a Retail Arterial and the profile is described in Table 4.5.5. The design combines a wide bike lane with a parking lane allowing vehicles to manoeuvre into a parking space without blocking passing traffic. 4.5.5: Arterial ROAD HIERARCHY NEIGHBOURHOOD BUSINESS INDUSTRIAL ENVIRONMENT Residential Community
Business Small Light
Industry Regional Business
Regional Industry
DESIGN CRITERIA
School Children Elderly & vulnerable
Fit Adult Traffic predominant
ARTERIAL Flow Range
Target Speed
11-21000 vpd
15-21000 vpd
35km/h
15-21000 vpd
50km/h
3500-8000 vpd 80 to 100km/h
Not Compatible Retail Arterial Business Arterial Arterial Road Reserve
Traffic Lane Bike Lane
Parking Lane Carriageway
Median Footpaths
Pedestrians Access
33m 2.9mx2 2.4mx2 2.1mx2 14.8m
Min 4.5m Min 5.0m
80m Crossings Rear Lane
30m 3.1mx2
Separate 4.1mx2 14.4m
Min 4.5m Min 5.5m incl Bike
80m Crossings Rear Lane
30n See RTA Separate
Signalised No access
Option Neighbourhood
Boulevard Business
Boulevard Industrial Boulevard
Other Arterial Roads operating with more than 15,000 vpd can be designed either as Business Arterials with a wide parking lane (4.1m) and traffic lane (3.1m) and separated bike tracks or, in the case of busier State Highways, as two-lane through road with no parking designed in accordance with RTA standards. 4.6 SUMMARY In summary, with the exception of the proposed “Western Boulevard”, all new streets in Dubbo can be built as: (i) Local Streets – see profiles;
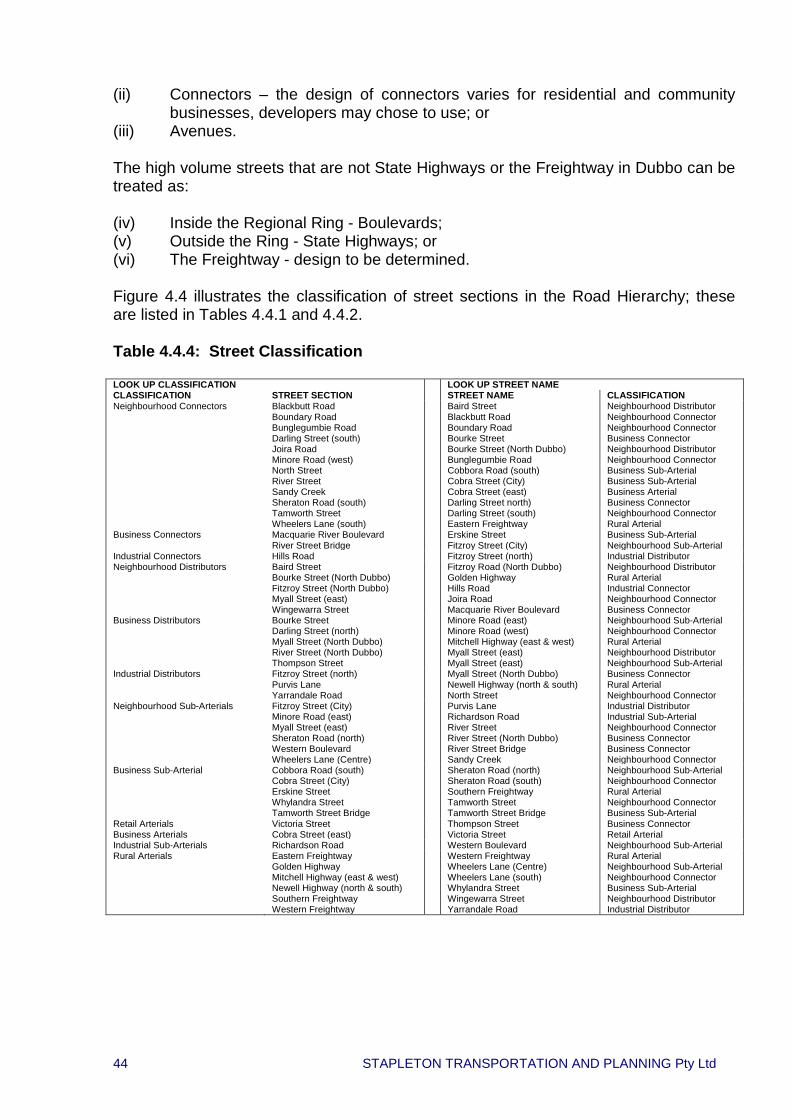
44 STAPLETON TRANSPORTATION AND PLANNING Pty Ltd
(ii) Connectors – the design of connectors varies for residential and community businesses, developers may chose to use; or
(iii) Avenues. The high volume streets that are not State Highways or the Freightway in Dubbo can be treated as: (iv) Inside the Regional Ring - Boulevards; (v) Outside the Ring - State Highways; or (vi) The Freightway - design to be determined. Figure 4.4 illustrates the classification of street sections in the Road Hierarchy; these are listed in Tables 4.4.1 and 4.4.2. Table 4.4.4: Street Classification LOOK UP CLASSIFICATION LOOK UP STREET NAME CLASSIFICATION STREET SECTION STREET NAME CLASSIFICATION Neighbourhood Connectors Blackbutt Road
Boundary Road Bunglegumbie Road Darling Street (south) Joira Road Minore Road (west) North Street River Street Sandy Creek Sheraton Road (south) Tamworth Street Wheelers Lane (south)
Baird Street Blackbutt Road Boundary Road Bourke Street Bourke Street (North Dubbo) Bunglegumbie Road Cobbora Road (south) Cobra Street (City) Cobra Street (east) Darling Street north) Darling Street (south) Eastern Freightway
Neighbourhood Distributor Neighbourhood Connector Neighbourhood Connector Business Connector Neighbourhood Distributor Neighbourhood Connector Business Sub-Arterial Business Sub-Arterial Business Arterial Business Connector Neighbourhood Connector Rural Arterial
Business Connectors Macquarie River Boulevard River Street Bridge
Erskine Street Fitzroy Street (City)
Business Sub-Arterial Neighbourhood Sub-Arterial
Industrial Connectors Hills Road Fitzroy Street (north) Industrial Distributor Neighbourhood Distributors Baird Street
Bourke Street (North Dubbo) Fitzroy Street (North Dubbo) Myall Street (east) Wingewarra Street
Fitzroy Road (North Dubbo) Golden Highway Hills Road Joira Road Macquarie River Boulevard
Neighbourhood Distributor Rural Arterial Industrial Connector Neighbourhood Connector Business Connector
Business Distributors Bourke Street Darling Street (north) Myall Street (North Dubbo) River Street (North Dubbo) Thompson Street
Minore Road (east) Minore Road (west) Mitchell Highway (east & west) Myall Street (east) Myall Street (east)
Neighbourhood Sub-Arterial Neighbourhood Connector Rural Arterial Neighbourhood Distributor Neighbourhood Sub-Arterial
Industrial Distributors Fitzroy Street (north) Purvis Lane Yarrandale Road
Myall Street (North Dubbo) Newell Highway (north & south) North Street
Business Connector Rural Arterial Neighbourhood Connector
Neighbourhood Sub-Arterials Fitzroy Street (City) Minore Road (east) Myall Street (east) Sheraton Road (north) Western Boulevard Wheelers Lane (Centre)
Purvis Lane Richardson Road River Street River Street (North Dubbo) River Street Bridge Sandy Creek
Industrial Distributor Industrial Sub-Arterial Neighbourhood Connector Business Connector Business Connector Neighbourhood Connector
Business Sub-Arterial Cobbora Road (south) Cobra Street (City) Erskine Street Whylandra Street Tamworth Street Bridge
Sheraton Road (north) Sheraton Road (south) Southern Freightway Tamworth Street Tamworth Street Bridge
Neighbourhood Sub-Arterial Neighbourhood Connector Rural Arterial Neighbourhood Connector Business Sub-Arterial
Retail Arterials Victoria Street Thompson Street Business Connector Business Arterials Cobra Street (east) Victoria Street Retail Arterial Industrial Sub-Arterials Richardson Road Western Boulevard Neighbourhood Sub-Arterial Rural Arterials Eastern Freightway
Golden Highway Mitchell Highway (east & west) Newell Highway (north & south) Southern Freightway Western Freightway
Western Freightway Wheelers Lane (Centre) Wheelers Lane (south) Whylandra Street Wingewarra Street Yarrandale Road
Rural Arterial Neighbourhood Sub-Arterial Neighbourhood Connector Business Sub-Arterial Neighbourhood Distributor Industrial Distributor

45 STAPLETON TRANSPORTATION AND PLANNING Pty Ltd
Fig 4.1: Traffic flows in 2006

46 STAPLETON TRANSPORTATION AND PLANNING Pty Ltd
Fig 4.2: Connectivity and Discontinuity Fig 4.3: 2036 projected flows
AIRPORT
NEWELL HWY
GOLDEN HWY
1.04.1
.71.9
.8
.5 1.9
11.9
1.6
.6
2.0
4.2
3.8
Purvis Lane
River St
Myall St
Cobra St
Wingewarra St
Tamworth St
Boundary Rd
Hennessy Dr
Minore Rd
Blackbutt Rd
Jior
a Rd
Cha
pman
s Rd
Nor
th S
tBu
ngle
gum
bie
Rd
"Hill
s Rd
Dar
ling
St
Fitz
roy
St
Whe
eler
s Ln
Macquarie St
Bour
ke S
t
Sher
aton
Rd
Richardson Rd
Jannali Rd"The Western Bvld"
Thompson St
Cobbora RdYarra
ndal
e Rd
Why
landr
a St
Victoria StM
acqu
arie
Riv
er B
lvd
SW Sector
SE Sector
CityCentre
NW Sector
1.5km
1.5km 1.6km1.7km
2.3km
1.1km
2.3km

47 STAPLETON TRANSPORTATION AND PLANNING Pty Ltd
Fig 4.4: Road Hierarchy
MITCHELL HWY
AIRPORT
MITCHELL HWY
NEWELL HWY
GOLDEN HWY
Purvis Lane
River St
Myall St
Cobra St
Wingewarra St
Boundary Rd
Hennessy Dr
Minore Rd
Blackbutt Rd
Jior
a Rd
Cha
pman
s Rd
Nor
th S
t
"Hill
s Rd
Dar
ling
StFi
tzro
y St
Whe
eler
s Ln
Macquarie St
Bour
ke S
t
Sher
aton
Rd
Richardson Rd
"The Western Bvld" Cobbora Rd
Yarra
ndal
e Rd
Why
landr
a St
Mac
quar
ie R
iver
Blv
d
SW Sector
SE Sector
NW Sector
Victoria St
Baird St
Sandy Creek
Thompson St
Tamworth StBu
ngle
gum
bie
Rd
CityCentre
Neighbourhood Sub-ArterialBusiness ConnectorBusiness Distributor
Neighbourhood ConnectorNeighbourhood Distributor
Business ArterialRetail Arterial
State Hwys and Freightway
Industrial ConnectorIndustrial Distributor
Business Sub-Arterial
48 STAPLETON TRANSPORTATION AND PLANNING Pty Ltd
5.0 POPULATION, EMPLOYMENT AND LAND BANK
The current population of Dubbo City is 37,800; employment is 17,000. The workforce is supported by a rural regional population of 120,000. The housing stock is currently increasing at a rate of 250 dwellings per annum. Some of this growth is occurring as a result of the residents of inner Dubbo, where the average lot is 400m2, moving to larger lots on the outskirts of town (average closer to 800m2). The strategic plan looks at the shape of the City when an additional 7500 dwellings have been completed. At that time further land releases will be established. The current rate of construction in Dubbo is varying and has slowed down in recent years. The Strategy is based on being maintained at 250 dwellings per year and therefore the 7,500 additional dwellings will be completed by 2036. The estimates of employment are based on that date. The current household size in Dubbo is surprisingly low at 2.7 persons per household in 2006 (ABS) (presumably influenced by itinerant workers, seconded workers and retirees). The average household size is expected to continue to decrease to 2.3 persons per household by 2036. The population will need to increase by 18,200 to fill the housing stock; total population in 2036 56,000. [Eg on average only 1.6 more people will move to Dubbo for every new dwelling built]. These figures are summarised in Table 5.1. [Note: The transport analysis has been extended to 2046 using lot projections through to 2046 together with extended projections of future employment]. The number of employed persons per household is also expected to decrease over time with the additional 7,500 households generating 9,000 new employed persons to a total of 24,000 employed persons. The analysis assumes this will happen. 5.1 RESIDENTIAL EXPANSION Residential development in Dubbo is planned in three sectors, the South East Sector, the North West Sector and the South West Sector. The density of existing residential areas is approximately 7.8 dwellings per hectare; this is a gross figure including roads, schools and local community facilities including open space. Should development continue at this density, the three sectors could accommodate 10,500 dwellings, sufficient until about 2050. The scheduling for the three sectors is described in Table 2.1 and the location is described in Figure 5.1.
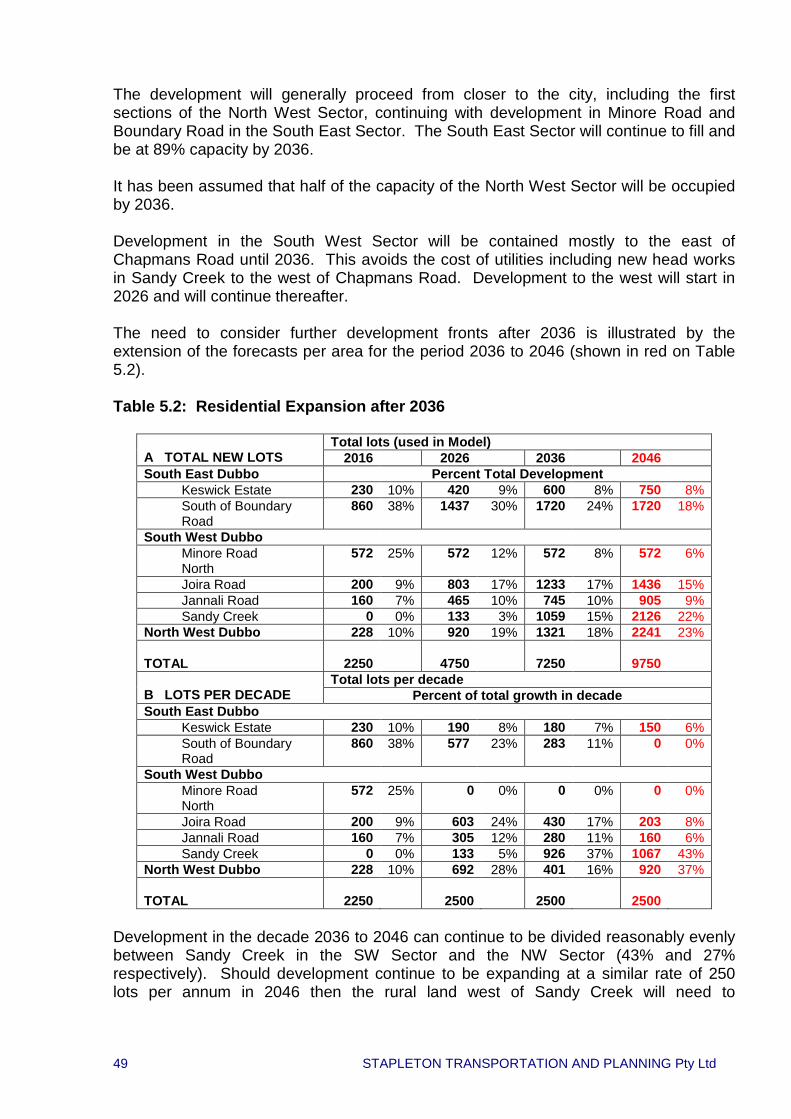
49 STAPLETON TRANSPORTATION AND PLANNING Pty Ltd
The development will generally proceed from closer to the city, including the first sections of the North West Sector, continuing with development in Minore Road and Boundary Road in the South East Sector. The South East Sector will continue to fill and be at 89% capacity by 2036. It has been assumed that half of the capacity of the North West Sector will be occupied by 2036. Development in the South West Sector will be contained mostly to the east of Chapmans Road until 2036. This avoids the cost of utilities including new head works in Sandy Creek to the west of Chapmans Road. Development to the west will start in 2026 and will continue thereafter. The need to consider further development fronts after 2036 is illustrated by the extension of the forecasts per area for the period 2036 to 2046 (shown in red on Table 5.2). Table 5.2: Residential Expansion after 2036
A TOTAL NEW LOTS
Total lots (used in Model) 2016 2026 2036 2046
South East Dubbo Percent Total Development Keswick Estate 230 10% 420 9% 600 8% 750 8% South of Boundary Road
860 38% 1437 30% 1720 24% 1720 18%
South West Dubbo Minore Road North
572 25% 572 12% 572 8% 572 6%
Joira Road 200 9% 803 17% 1233 17% 1436 15% Jannali Road 160 7% 465 10% 745 10% 905 9% Sandy Creek 0 0% 133 3% 1059 15% 2126 22% North West Dubbo 228 10% 920 19% 1321 18% 2241 23% TOTAL
2250
4750
7250
9750
B LOTS PER DECADE
Total lots per decade Percent of total growth in decade
South East Dubbo Keswick Estate 230 10% 190 8% 180 7% 150 6% South of Boundary Road
860 38% 577 23% 283 11% 0 0%
South West Dubbo Minore Road North
572 25% 0 0% 0 0% 0 0%
Joira Road 200 9% 603 24% 430 17% 203 8% Jannali Road 160 7% 305 12% 280 11% 160 6% Sandy Creek 0 0% 133 5% 926 37% 1067 43% North West Dubbo 228 10% 692 28% 401 16% 920 37% TOTAL
2250
2500
2500
2500
Development in the decade 2036 to 2046 can continue to be divided reasonably evenly between Sandy Creek in the SW Sector and the NW Sector (43% and 27% respectively). Should development continue to be expanding at a similar rate of 250 lots per annum in 2046 then the rural land west of Sandy Creek will need to

50 STAPLETON TRANSPORTATION AND PLANNING Pty Ltd
accommodate a growing proportion of demand. This will have implications on access to the City and the City is likely to look in other directions for continuing growth. 5.2 EMPLOYMENT EXPANSION The ABS figures are used as a starting point for the expansion of employment. These are reduced to groups for the purposes of estimating land requirements, allocating employment to workplaces and to forecasting future employment. For the purposes of predicting the potential land take for different types of employment it has been assumed that: o Health, education, utilities, government and business services will grow in
proportion to the population; o Agricultural services will remain static; and o Personal services, mostly located in residential areas, are assumed to increase
with the demographic change. The economic sustainability of Dubbo will depend on producing income earning employment. This is supported by growth for: o Warehousing, transport and distribution; o Small businesses in value adding for local products; and o Tourism, which is predicted to grow generally throughout the world. Recommendation: Develop a strategy to consider tourism. Here it is assumed that the growth will come from (a) making the City centre more attractive to visitors to stay an extra night - through more street life and simple value added local products; and (b) broadening the tourist base to more backpackers - again through more street life and a broader market than the Zoo.
Tourism is therefore expected to grow but only if the City centre and other prime locations, such as the River Front, become more active. The employment strategy is summarised in Table 5.3. The workforce has been separated into those: o Working throughout the City, where there is no relationship with a specific land
activity, and it is assumed to spread throughout the city; o Work that is generally located in residential areas, that is education, o Community Business (local and regional) and retailing; o Light industrial; and o Transport and manufacturing. The proportion working in each sector changes slightly by 2036.
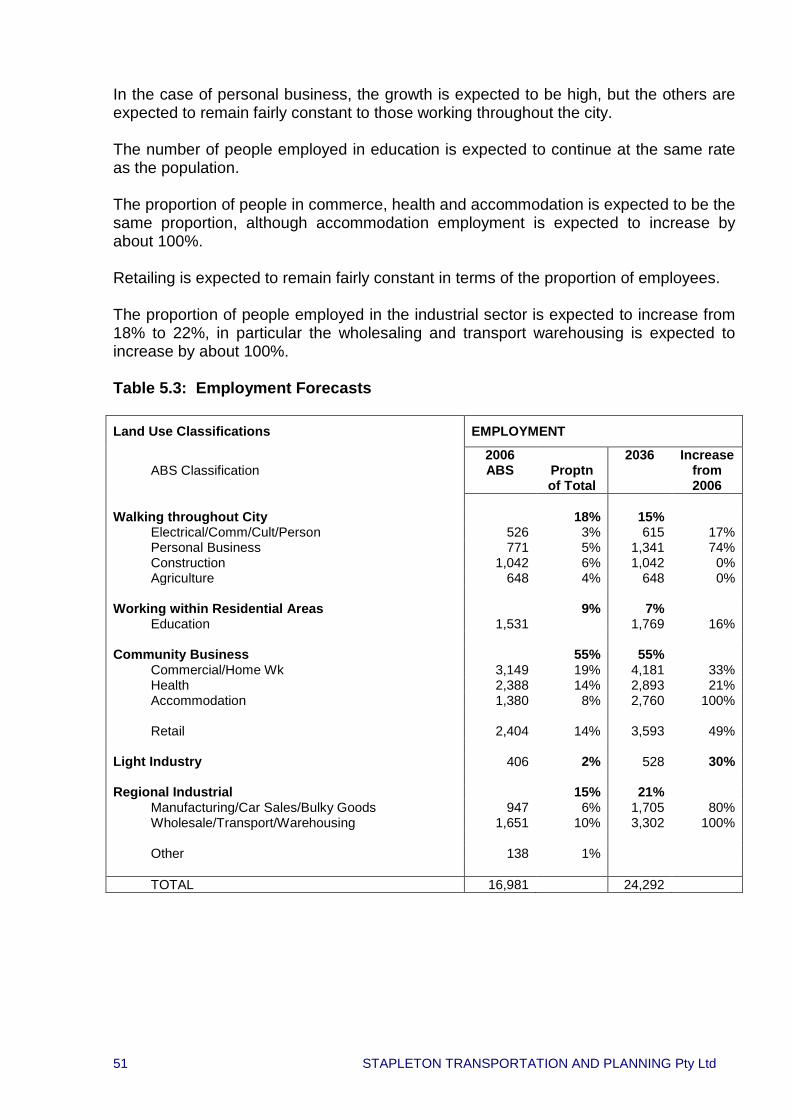
51 STAPLETON TRANSPORTATION AND PLANNING Pty Ltd
In the case of personal business, the growth is expected to be high, but the others are expected to remain fairly constant to those working throughout the city. The number of people employed in education is expected to continue at the same rate as the population. The proportion of people in commerce, health and accommodation is expected to be the same proportion, although accommodation employment is expected to increase by about 100%. Retailing is expected to remain fairly constant in terms of the proportion of employees. The proportion of people employed in the industrial sector is expected to increase from 18% to 22%, in particular the wholesaling and transport warehousing is expected to increase by about 100%. Table 5.3: Employment Forecasts Land Use Classifications EMPLOYMENT
ABS Classification 2006 ABS
Proptn of Total
2036 Increase from 2006
Walking throughout City
Electrical/Comm/Cult/Person Personal Business Construction Agriculture
18% 15% 526 3% 615 17% 771 5% 1,341 74%
1,042 6% 1,042 0% 648 4% 648 0%
Working within Residential Areas
Education 9% 7%
1,531 1,769 16% Community Business
Commercial/Home Wk Health Accommodation
55% 55% 3,149 19% 4,181 33% 2,388 14% 2,893 21% 1,380 8% 2,760 100%
Retail 2,404 14% 3,593 49%
Light Industry 406 2% 528 30% Regional Industrial
Manufacturing/Car Sales/Bulky Goods Wholesale/Transport/Warehousing
15% 21% 947 6% 1,705 80%
1,651 10% 3,302 100%
Other 138 1% TOTAL 16,981 24,292
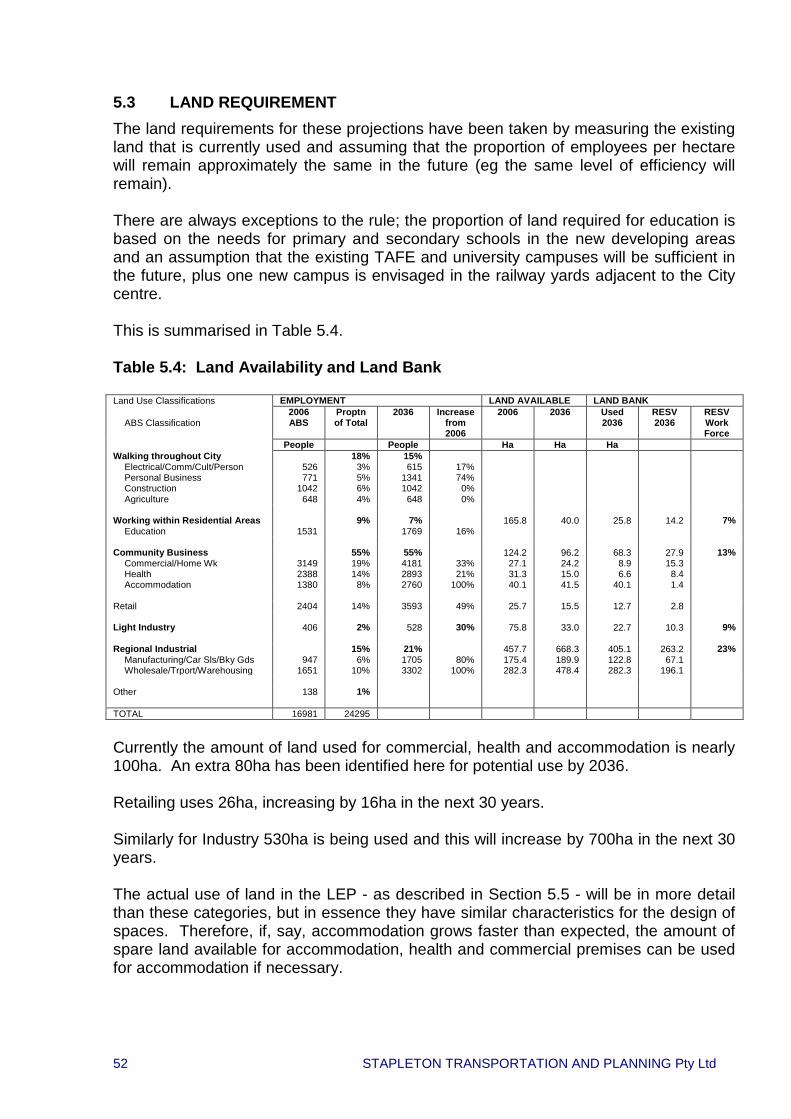
52 STAPLETON TRANSPORTATION AND PLANNING Pty Ltd
5.3 LAND REQUIREMENT The land requirements for these projections have been taken by measuring the existing land that is currently used and assuming that the proportion of employees per hectare will remain approximately the same in the future (eg the same level of efficiency will remain). There are always exceptions to the rule; the proportion of land required for education is based on the needs for primary and secondary schools in the new developing areas and an assumption that the existing TAFE and university campuses will be sufficient in the future, plus one new campus is envisaged in the railway yards adjacent to the City centre. This is summarised in Table 5.4. Table 5.4: Land Availability and Land Bank Land Use Classifications EMPLOYMENT LAND AVAILABLE LAND BANK
ABS Classification
2006 ABS
Proptn of Total
2036 Increase from 2006
2006 2036 Used 2036
RESV 2036
RESV Work Force
People People Ha Ha Ha Walking throughout City
Electrical/Comm/Cult/Person Personal Business Construction Agriculture
526 771
1042 648
18% 3% 5% 6% 4%
15% 615
1341 1042
648
17% 74%
0% 0%
Working within Residential Areas
Education
1531 9% 7%
1769
16% 165.8 40.0 25.8 14.2 7%
Community Business
Commercial/Home Wk Health Accommodation
3149 2388 1380
55% 19% 14%
8%
55% 4181 2893 2760
33% 21%
100%
124.2 27.1 31.3 40.1
96.2 24.2 15.0 41.5
68.3 8.9 6.6
40.1
27.9 15.3
8.4 1.4
13%
Retail 2404 14% 3593 49% 25.7 15.5 12.7 2.8 Light Industry 406 2% 528 30% 75.8 33.0 22.7 10.3 9% Regional Industrial
Manufacturing/Car Sls/Bky Gds Wholesale/Trport/Warehousing
947
1651
15% 6%
10%
21% 1705 3302
80%
100%
457.7 175.4 282.3
668.3 189.9 478.4
405.1 122.8 282.3
263.2 67.1
196.1
23%
Other 138 1% TOTAL 16981 24295
Currently the amount of land used for commercial, health and accommodation is nearly 100ha. An extra 80ha has been identified here for potential use by 2036. Retailing uses 26ha, increasing by 16ha in the next 30 years. Similarly for Industry 530ha is being used and this will increase by 700ha in the next 30 years. The actual use of land in the LEP - as described in Section 5.5 - will be in more detail than these categories, but in essence they have similar characteristics for the design of spaces. Therefore, if, say, accommodation grows faster than expected, the amount of spare land available for accommodation, health and commercial premises can be used for accommodation if necessary.

53 STAPLETON TRANSPORTATION AND PLANNING Pty Ltd
5.4 LAND BANK The amount of land identified/zoned in the LEP allows for flexibility in the way the City might grow. 13% of additional land is available in the LEP for Community Businesses, 7% for Education, 9% for Light industry and 23% for Regional Industry. This means any one of those can grow by that proportion before it will require further land take of any form. The flexibility of the land bank to variations in future demands is explained more in Section 6.

54 STAPLETON TRANSPORTATION AND PLANNING Pty Ltd
6.0 LAND RELEASE STRATEGY
6.1 FRONTS OF DEVELOPMENT When this work commenced in mid 2007, the thinking was that development would occur firstly on two fronts, the SE Sector and SW Sector, and later extend to a third front in the NW Sector. Work during this study has shown that the NW Sector should be brought forward as soon as possible. The reasons for this are: o The NW Sector is closer to the City centre and therefore will generate less
traffic than more distant development; this will be more efficient in reducing the cost of all infrastructures.
o The City needs some land that is attractive to Active Street Front Development,
such as, hotels and commercial activities. This is ideally located along the Macquarie River and the Council owns some of this land and can lead by example.
o Development in the SW sector will generate demand to the industrial, health
and education areas in the north. This demand will require a new River Crossing north of the Serisier Bridge before 2036. This crossing cannot be built without the adjoining land being developed and therefore the development should be brought forward. Doing this will also slow down the development of Sandy Creek west of Chapman Road thereby reducing the cost of the infrastructure for Water and Sewer in the SW.
o Opening development along the river is attractive for pedestrian access to the
City and should bring forward work on the open space strategy. o The development of the NW in preference to the SW will reduce the need for
additional retailing in the SW which can be served by the retailing at Minore Road until at least 2036. After 2026 an “alternative life” on the other side of the hill will lead to another centre.
6.2 URBAN DESIGN The estimates of employment are of necessity derived from the extensive classifications used by the ABS. The allocation of land is grouped for the synergies and conflicts that occur between activities; for example a small office can be integrated with a residential area but an office block cannot. The broader definition of these groupings have been described earlier as residential, business and industrial and broadly allocated as central business, outer industrial and separate residential. The future success of Dubbo as a place to attract people comes down to the opportunities available for investment and the attraction and suitable diversity of housing.
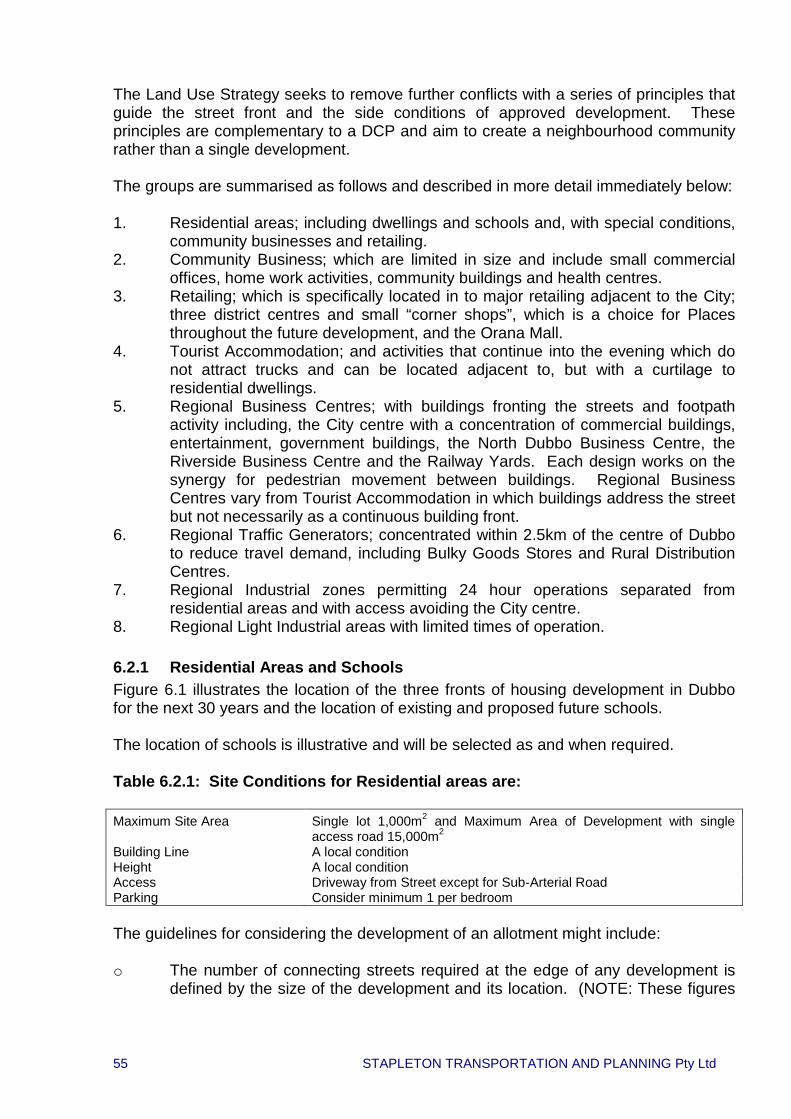
55 STAPLETON TRANSPORTATION AND PLANNING Pty Ltd
The Land Use Strategy seeks to remove further conflicts with a series of principles that guide the street front and the side conditions of approved development. These principles are complementary to a DCP and aim to create a neighbourhood community rather than a single development. The groups are summarised as follows and described in more detail immediately below: 1. Residential areas; including dwellings and schools and, with special conditions,
community businesses and retailing. 2. Community Business; which are limited in size and include small commercial
offices, home work activities, community buildings and health centres. 3. Retailing; which is specifically located in to major retailing adjacent to the City;
three district centres and small “corner shops”, which is a choice for Places throughout the future development, and the Orana Mall.
4. Tourist Accommodation; and activities that continue into the evening which do not attract trucks and can be located adjacent to, but with a curtilage to residential dwellings.
5. Regional Business Centres; with buildings fronting the streets and footpath activity including, the City centre with a concentration of commercial buildings, entertainment, government buildings, the North Dubbo Business Centre, the Riverside Business Centre and the Railway Yards. Each design works on the synergy for pedestrian movement between buildings. Regional Business Centres vary from Tourist Accommodation in which buildings address the street but not necessarily as a continuous building front.
6. Regional Traffic Generators; concentrated within 2.5km of the centre of Dubbo to reduce travel demand, including Bulky Goods Stores and Rural Distribution Centres.
7. Regional Industrial zones permitting 24 hour operations separated from residential areas and with access avoiding the City centre.
8. Regional Light Industrial areas with limited times of operation. 6.2.1 Residential Areas and Schools Figure 6.1 illustrates the location of the three fronts of housing development in Dubbo for the next 30 years and the location of existing and proposed future schools. The location of schools is illustrative and will be selected as and when required. Table 6.2.1: Site Conditions for Residential areas are: Maximum Site Area Single lot 1,000m2 and Maximum Area of Development with single
access road 15,000m2 Building Line A local condition Height A local condition Access Driveway from Street except for Sub-Arterial Road Parking Consider minimum 1 per bedroom The guidelines for considering the development of an allotment might include: o The number of connecting streets required at the edge of any development is
defined by the size of the development and its location. (NOTE: These figures

56 STAPLETON TRANSPORTATION AND PLANNING Pty Ltd
are NOT definitive but are taken from existing areas in Dubbo; Minimum 5 access points to serve 5 hectares; 8 points for 10 hectares; 11 for 20 hectares etc).
o Length of a single developed block in a residential area cannot to exceed 160m
for 500m residential lots and 200m for 800m residential lots (Exceptions for urban edges).
o All connections outlined in the Strategy for Future Bus Operations and future
places for bus stops to be provided as direct connections. o Connectivity is to illustrate how small places can be networked to create local
focuses to attract walking and biking between local places. o No rear fences to open space. o Changes between land uses generally to occur at rear fences meaning the
same land uses occur in any street. o Part of every 64 hectares is to be dedicated to long term social use; local
places, community buildings, community/retirement housing, “pocket” retail, and noisy activities with appropriate curtilages.
o Home Work development can be established in residential areas. Home Work
for light industrial activity can be established on edges of residential areas abutting industrial areas.
The strategic design of the three residential areas is discussed in Sections 6.3 to 6.5. 6.2.2 Community Business Community Businesses should be embedded into residential areas. The intent is to provide some local services close to home thereby offering local residents the choice to use a local facility and reduce their travel either by the distance travelled by car or by journeys by bike or foot. Community business areas will also provide local employment; the first job helping out at the vets, the retirement job doing a bit of book-keeping. Most importantly Community Business streets will offer a place to locate local business that avoid crossing Dubbo to get to work thereby keeping the street clearer for those that do need to travel. Community Businesses are a mix of residential housing and small commercial activities, home work activities, community buildings, health centres and small shops. The mixed use development allows a small office or service industry to operate with housing above. This has been included into health centres and community buildings as a means to generating activity and street security. (Large community halls are not part of this group).
57 STAPLETON TRANSPORTATION AND PLANNING Pty Ltd
Home Work is a specific use in which the occupier operates a business from home. There are specific designs available for this style of accommodation, the basics being the front of the buildings are for the customers and the backs are served by a rear lane for the residents. The size of the lot combined with the requirement that no customer parking is to be provided on the site will limit the application of the Community Business option. Community Businesses are located either as part of a local Place; which would be defined as the DCP is developed, or as a Community Business Centre located along a Neighbourhood Connector. The interpretations of development discussed in Section 6.3 to 6.5 are based on the provision of 20m2 of Community Business or medium density housing per single dwelling. Since the intent is to create footpath activity then medium density housing can be interchanged with Community Business provided they are on a Connector. Table 6.2.2: Site Conditions for Community Businesses in residential areas should consider: Maximum Site Area Single 600m2 lot, Home Work 450m2 (except District Retail see 6.2.3).
No amalgamation of sites Land Uses To include 50% residential occupation Building Line To the Footpath Height 3 storey max Access Connector for Community Business Centre and Home Work, plus Rear
Lane; local street for Place Business not greater than 600m2 Parking Customer parking on the street Figure 6.2 illustrates the potential location of Community Business Centres and community businesses in Places. Four locations have been considered in the analysis:
River Street on the NW Sector; Sandy Creek in the SW Sector; Minore Hill in the SW Sector; and Boundary Road in the SE Sector.
Other potential locations include further streets facing the Green Ring in the NW Sector and the SE Sector.
Home Work Light Industry
One further level of flexibility is recommended with the inclusion of Home-Work with light industrial needs, e.g. the need for the occasional truck to access the property. Again there are specific designs available for this style of accommodation the basics being the front of the buildings can accommodate truck access and the backs are served by a rear lane for the residents.

58 STAPLETON TRANSPORTATION AND PLANNING Pty Ltd
Home Work Light Industry must be served by an Industrial Connector Road which is not suited to general pedestrian access by children. Home Work Light Industry should therefore generally be located on the edge of a residential area. Restricting Home Work Light Industry dwellings to 600m2 with 12 hour operation limits the size of the operation to be compatible with residential living. One location is identified in Figure 6.2 at the western side of the NW Sector that provides a buffer to the more intense industrial development near the airport. 6.2.3 Retail Figure 6.3 illustrates the location of retail centres. The City centre will absorb most additional retail activity in the City of Dubbo. This will include strengthening Victoria Street in West Dubbo as part of the strategy to expand the City centre. Retailing in Victoria Street should be a vibrant affair with heavy and local traffic supporting the shops, street management to accommodate cross pedestrian movement and access from rear lanes. Whylandra Street will be more orientated to tourist accommodation and possibly restaurants filtering through to the river front. Whylandra Street will also need management to make it more pedestrian friendly. Three new neighbourhood centres have been identified: 1. Minore Road, which has already commenced. 2. The North West Sector. 3. The South West Sector towards Sandy Creek. These three centres would include a supermarket of 2,500m2, plus 2,000m2 of additional support retailing. The development of the South East Sector is unlikely to support a supermarket due to the proximity of the Orana Mall. However, should the request arise then a site along Boundary Road would be acceptable as a means of reducing the overall travel distances travelled for the purpose of shopping. (A small centre would have little effect on Orana Mall). Table 6.2.3: Site Conditions for Retailing in residential areas should consider: Maximum Site Area Single 200m2 and maximum area of development for district centre
4000m2 Land Uses To include 50% residential dwellings Building Line To the Footpath Height 3 storey max Access Rear Lane Parking No off street customer parking for small centres, 1/100m2 for District
Centres
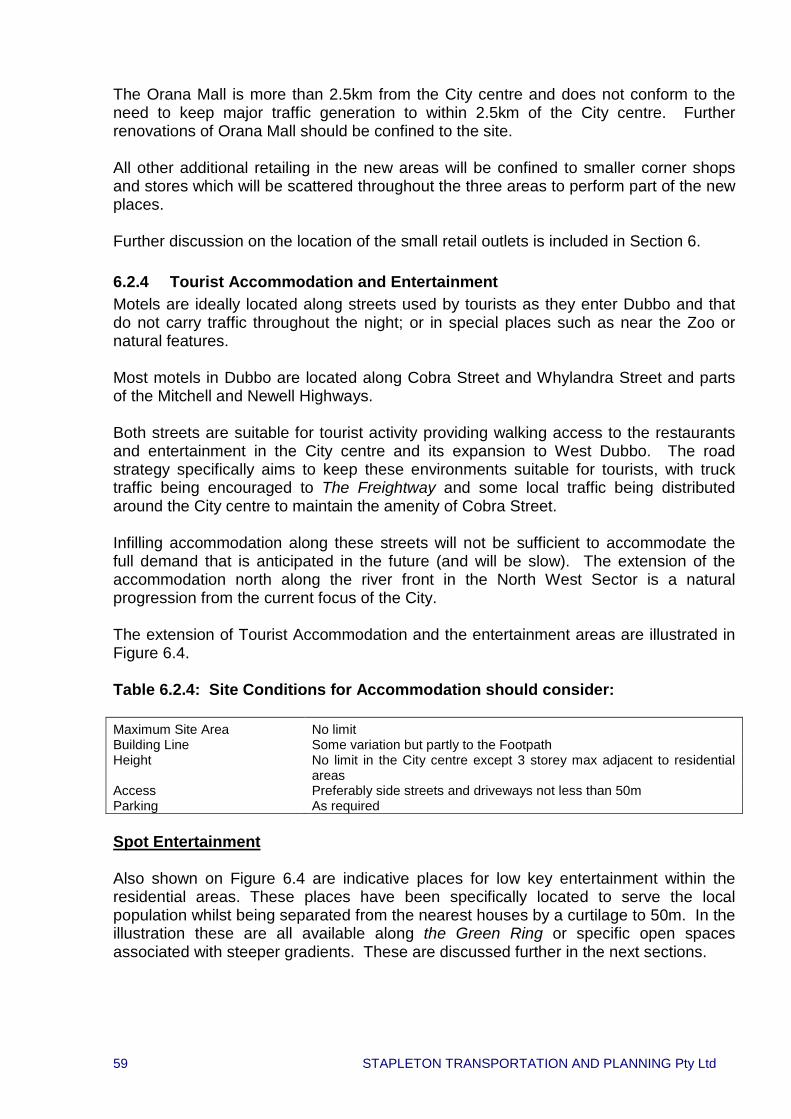
59 STAPLETON TRANSPORTATION AND PLANNING Pty Ltd
The Orana Mall is more than 2.5km from the City centre and does not conform to the need to keep major traffic generation to within 2.5km of the City centre. Further renovations of Orana Mall should be confined to the site. All other additional retailing in the new areas will be confined to smaller corner shops and stores which will be scattered throughout the three areas to perform part of the new places. Further discussion on the location of the small retail outlets is included in Section 6. 6.2.4 Tourist Accommodation and Entertainment Motels are ideally located along streets used by tourists as they enter Dubbo and that do not carry traffic throughout the night; or in special places such as near the Zoo or natural features. Most motels in Dubbo are located along Cobra Street and Whylandra Street and parts of the Mitchell and Newell Highways. Both streets are suitable for tourist activity providing walking access to the restaurants and entertainment in the City centre and its expansion to West Dubbo. The road strategy specifically aims to keep these environments suitable for tourists, with truck traffic being encouraged to The Freightway and some local traffic being distributed around the City centre to maintain the amenity of Cobra Street. Infilling accommodation along these streets will not be sufficient to accommodate the full demand that is anticipated in the future (and will be slow). The extension of the accommodation north along the river front in the North West Sector is a natural progression from the current focus of the City. The extension of Tourist Accommodation and the entertainment areas are illustrated in Figure 6.4. Table 6.2.4: Site Conditions for Accommodation should consider: Maximum Site Area No limit Building Line Some variation but partly to the Footpath Height No limit in the City centre except 3 storey max adjacent to residential
areas Access Preferably side streets and driveways not less than 50m Parking As required
Spot Entertainment
Also shown on Figure 6.4 are indicative places for low key entertainment within the residential areas. These places have been specifically located to serve the local population whilst being separated from the nearest houses by a curtilage to 50m. In the illustration these are all available along the Green Ring or specific open spaces associated with steeper gradients. These are discussed further in the next sections.

60 STAPLETON TRANSPORTATION AND PLANNING Pty Ltd
6.2.5 Regional Business Centres The Land Use Strategy will locate all traffic generating development within 2.5km of the City centre. This will be a major contributor to maintaining Dubbo as a ten minute City not only because these major generators will be within ten minutes for most residents but also the reduction of distance travelled to these attractions will provide more “capacity” for other travellers. Dubbo will be more sustainable with this policy. A large proportion of additional commercial, entertainment and government development will occur within the City centre forming an ever more active Business District. (This strategy is not addressing the form of the City centre). Two forms of high traffic generating development are considered, Regional Business Centres, which are stylised to attract businesses requiring urban amenity including footpath activity, and Regional Traffic Generators which do not attract pedestrian activity. Regional Business Centres are part of the strategy to attract new, more diverse, businesses to Dubbo. The primary function of the City to serve the rural hinterland will not diminish; rather the new businesses will attract more activity to the City thereby enhancing its role as a regional centre. This development is essential in providing additional employment that will go with the population target for the City. No employment opportunity, no additional population; no population no new facilities; and the City of Dubbo will become less competitive to its coastal rivals and depopulate. The concept of Regional Business Centres is to create some further regional business centres that are designed for footpath activity with buildings fronting the street. Three precincts have been identified: o Bourke Street in North Dubbo. o The River Front of the North West Sector. o The Railway Yards east of the Station (marked on the illustration as New
TAFE?) Figure 6.5 illustrates the location of centres; it also locates the City centre and the Hospital Precinct which also has the opportunity to develop street amenity and a sense of place. The Bourke Street precinct could be a gradual replacement and intensification of the Regional Traffic Generators that currently existing in the area. Over time this centre could expand to the Heath and Education precinct of Yarrandale Road. The River Front Precinct could be an extension of the Tourist Accommodation along the river front subject to resolution of flooding issues and can therefore adopt similar site conditions and not necessarily including full street front buildings. This might suit a hospital or higher education use. The Rail Yards are a potential location for a new TAFE College immediately east of the City centre. This has a great potential for becoming part of an active education centre with access through the parks and through Church Street to the western side of the

61 STAPLETON TRANSPORTATION AND PLANNING Pty Ltd
Macquarie River. Alternatively, this new TAFE site could be part of a Regional Business Centre designed to achieve a similar active pedestrian area. Concerning sites for additional Heath and Education facilities, the current sites along Yarrandale Road will intensify and are likely to be sufficient to serve demand through to 2036. Other potential Regional Business Centres include Jannali Road and the extension of the Railway Yards to Wheelers Lane. These light industry areas inside the Regional Business area are more likely to be required for other less creative designs included as Regional Traffic Generators. Table 6.2.5: Site Conditions for Regional Business Centres should consider: Maximum Site Area 6,000m2 Land Uses Offices, Government, Hospitals, Health, Education Building Line To the Footpath Height 3 storey max except variable in City centre Access Driveways not less than 50m2 or Rear Lane Parking Off street customer parking as required 6.2.6 Regional Traffic Generators The Regional Traffic Generators are within 2.5km of the City centre and intended for use by developments that generate high volumes of customer traffic from all over Dubbo and the greater region. They are differentiated from the Regional Industrial Sites by permitting customer parking to be located on the site. Future uses are intended to include Large Rural Suppliers, Bulky Goods Centres, and Car Sales Yards. Currently these sites include Light Industrial uses and smaller manufacturing plants. These will remain but might be replaced with more intensive uses, should the need arise. It should be noted that the area of land defined as Regional Traffic Generators is well in excess of the predicted demand and therefore allows plenty of flexibility for acquiring sites. Figure 6.6 illustrates the location of Regional Traffic Generators. This category also includes the recently approved Bulky Good Retail Development in ICA1. The design nemesis of the Regional Business Centres is the Regional Traffic Generator that has no design principles for addressing the street. It could be argued that every new building should have some architectural control over its address to the street but there are many variations (service stations, fast food) which would complicate such controls. Building design has “improved” over time, or, to be more precise, has reflected the prevailing architectural mores, currently still the triangular roof treatment. This is fine for Regional Traffic Generators, but something more is sought for Regional Business Centres.
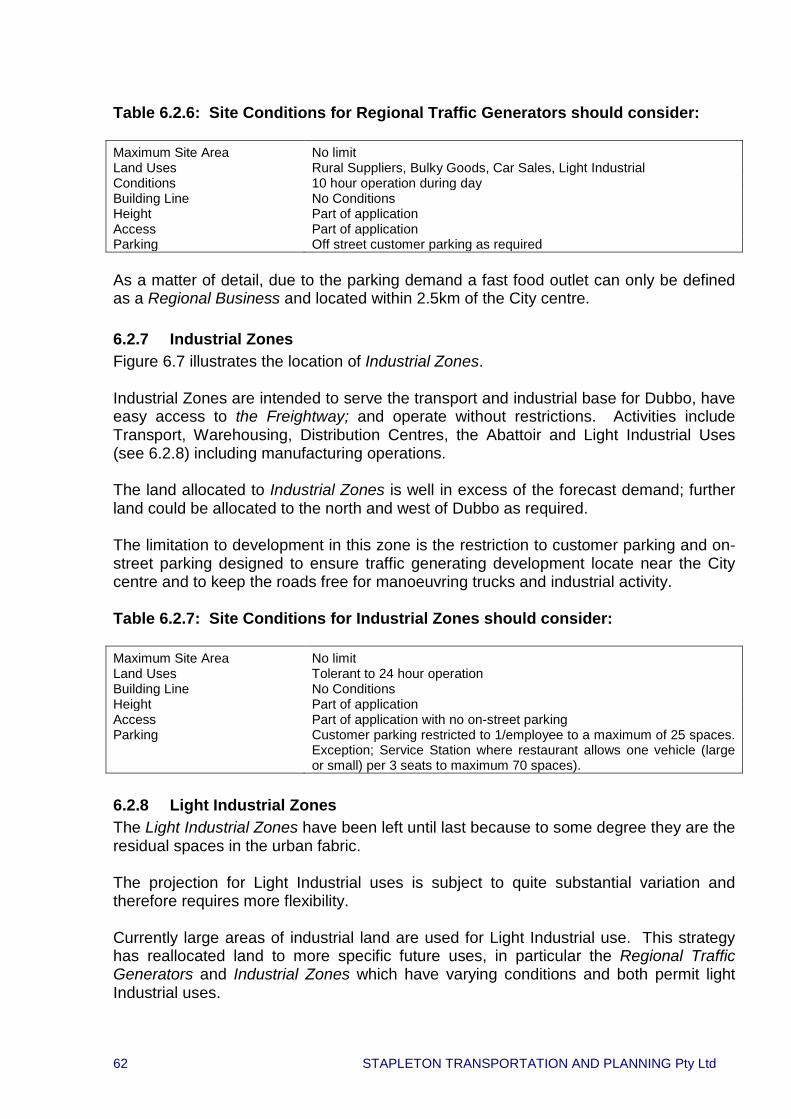
62 STAPLETON TRANSPORTATION AND PLANNING Pty Ltd
Table 6.2.6: Site Conditions for Regional Traffic Generators should consider: Maximum Site Area No limit Land Uses Rural Suppliers, Bulky Goods, Car Sales, Light Industrial Conditions 10 hour operation during day Building Line No Conditions Height Part of application Access Part of application Parking Off street customer parking as required As a matter of detail, due to the parking demand a fast food outlet can only be defined as a Regional Business and located within 2.5km of the City centre. 6.2.7 Industrial Zones Figure 6.7 illustrates the location of Industrial Zones. Industrial Zones are intended to serve the transport and industrial base for Dubbo, have easy access to the Freightway; and operate without restrictions. Activities include Transport, Warehousing, Distribution Centres, the Abattoir and Light Industrial Uses (see 6.2.8) including manufacturing operations. The land allocated to Industrial Zones is well in excess of the forecast demand; further land could be allocated to the north and west of Dubbo as required. The limitation to development in this zone is the restriction to customer parking and on-street parking designed to ensure traffic generating development locate near the City centre and to keep the roads free for manoeuvring trucks and industrial activity. Table 6.2.7: Site Conditions for Industrial Zones should consider: Maximum Site Area No limit Land Uses Tolerant to 24 hour operation Building Line No Conditions Height Part of application Access Part of application with no on-street parking Parking Customer parking restricted to 1/employee to a maximum of 25 spaces.
Exception; Service Station where restaurant allows one vehicle (large or small) per 3 seats to maximum 70 spaces).
6.2.8 Light Industrial Zones The Light Industrial Zones have been left until last because to some degree they are the residual spaces in the urban fabric. The projection for Light Industrial uses is subject to quite substantial variation and therefore requires more flexibility. Currently large areas of industrial land are used for Light Industrial use. This strategy has reallocated land to more specific future uses, in particular the Regional Traffic Generators and Industrial Zones which have varying conditions and both permit light Industrial uses.
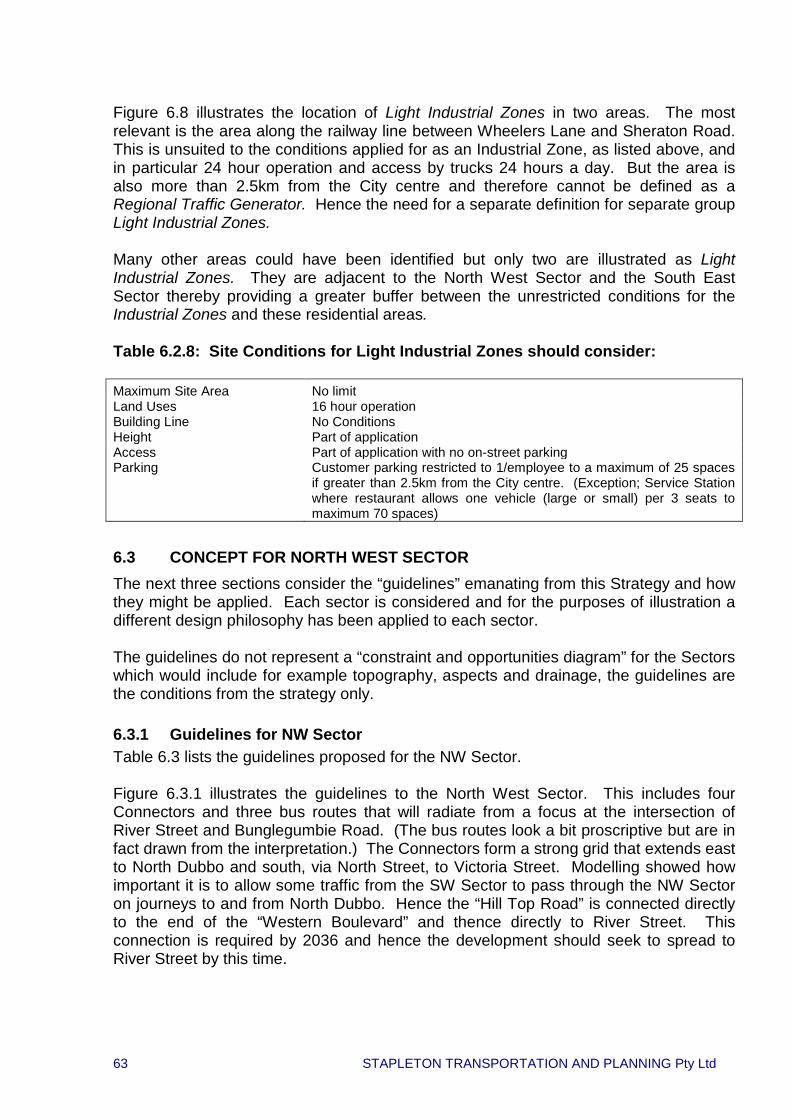
63 STAPLETON TRANSPORTATION AND PLANNING Pty Ltd
Figure 6.8 illustrates the location of Light Industrial Zones in two areas. The most relevant is the area along the railway line between Wheelers Lane and Sheraton Road. This is unsuited to the conditions applied for as an Industrial Zone, as listed above, and in particular 24 hour operation and access by trucks 24 hours a day. But the area is also more than 2.5km from the City centre and therefore cannot be defined as a Regional Traffic Generator. Hence the need for a separate definition for separate group Light Industrial Zones. Many other areas could have been identified but only two are illustrated as Light Industrial Zones. They are adjacent to the North West Sector and the South East Sector thereby providing a greater buffer between the unrestricted conditions for the Industrial Zones and these residential areas. Table 6.2.8: Site Conditions for Light Industrial Zones should consider: Maximum Site Area No limit Land Uses 16 hour operation Building Line No Conditions Height Part of application Access Part of application with no on-street parking Parking Customer parking restricted to 1/employee to a maximum of 25 spaces
if greater than 2.5km from the City centre. (Exception; Service Station where restaurant allows one vehicle (large or small) per 3 seats to maximum 70 spaces)
6.3 CONCEPT FOR NORTH WEST SECTOR The next three sections consider the “guidelines” emanating from this Strategy and how they might be applied. Each sector is considered and for the purposes of illustration a different design philosophy has been applied to each sector. The guidelines do not represent a “constraint and opportunities diagram” for the Sectors which would include for example topography, aspects and drainage, the guidelines are the conditions from the strategy only. 6.3.1 Guidelines for NW Sector Table 6.3 lists the guidelines proposed for the NW Sector. Figure 6.3.1 illustrates the guidelines to the North West Sector. This includes four Connectors and three bus routes that will radiate from a focus at the intersection of River Street and Bunglegumbie Road. (The bus routes look a bit proscriptive but are in fact drawn from the interpretation.) The Connectors form a strong grid that extends east to North Dubbo and south, via North Street, to Victoria Street. Modelling showed how important it is to allow some traffic from the SW Sector to pass through the NW Sector on journeys to and from North Dubbo. Hence the “Hill Top Road” is connected directly to the end of the “Western Boulevard” and thence directly to River Street. This connection is required by 2036 and hence the development should seek to spread to River Street by this time.

64 STAPLETON TRANSPORTATION AND PLANNING Pty Ltd
The rate of development in the NW Sector may be faster than the estimated figures, leading to more development in the NW and less in the SW Sector. This would not affect the Road Network Strategy, in fact it might help spread the infrastructure expenditure. The Green Ring passes through the NW Sector and provides a new opportunity to link pedestrians and bikes to the SW Sector but raises complications at the intersection of the Hills Road, the proposed “Western Boulevard” and the Mitchell Highway. The aim of the Strategy come together at this point and must be addressed shortly. Table 6.3: Guidelines for the North West Sector Lots ~2,700 Community Business 20x2,700 = 54000m2, 770m of Community Street (two sided @ 35m
depth) Schools Primary School;
High School Open Space Green Ring and ridge tops, traffic must be slowed at the Green Ring Bike and Walk Use the Green Ring for shared bikeway and footpath also connecting to
River walkway system Utilities Connects to Town System Approximate Program 2016 2,016 River Front from Thomson Street;
226 Lots and Regional Business 2026 Bunglegumbie Road Connector progressing north;
900 Lots, Community Business expanding 2036 River Street Connector and River Crossing;
1,300 Lots Primary School Post 2036
High School; Second access to Northern Freightway from Light Industrial zone; Third access to Northern Freightway from River Front
Bus Routes First Loop across from Thompson Street to extending later to Community Centre and High School; Second Loop across from Hills Road and passing Primary School and later the Community Centre and across Macquarie River; Third Loop across from Richardson Road to Community Centre and North Street
6.3.2 Interpretation in the NW Sector The illustrative master plan (see Figure 6.3.2) for the North West Sector is modelled on a grid network with cross links. The two main ridges have been celebrated by the location of parks, and small restaurants or hotels could be located overlooking the town with a curtilage to residential properties. The Green Ring has been taken through one ridge and thence connected to the south west. One corridor along Bunglegumbie Road links to the rural areas. The community structure is based on two bus stops north of River Street and a spine leading to the “Macquarie River Boulevard” at the southern end of the Sector. This could form the basis for the first stage of development.

65 STAPLETON TRANSPORTATION AND PLANNING Pty Ltd
The former Gordon Estate is currently undergoing a restructure and whilst no new connections are shown into the Estate it would be desirable to make some more direct connections between the estates. The location of the Primary School just north of the former Gordon Estate is based on the number of lots likely to trigger a new school. A second School site in the north could be a High School (but is a little small for a High School). This school links to the Green Ring and the bus routes could divert passed the front entrance. Note how all the roads crossing the Green Ring are configured to illustrate the narrowing of lanes to slow traffic. The concept of bringing accommodation and regional businesses along the “Macquarie River Boulevard” is illustrated in Figure 6.3.2 showing various opportunities for sites. The Community Business requirement is located along River Street with additional Home Work Industry fronting “Hill Top Road”. The forecast used in the analysis leaves the development north of River Street until after 2036 but the proximity to the City centre, combined with the costs of developing the western parts of the SW Sector, suggests this area could develop quicker. And since Council owns much of this land the entire area could be Master Planned and started as an exemplary design for the future of Dubbo. 6.4 CONCEPT FOR SOUTH WEST SECTOR 6.4.1 Guidelines for SW Sector Table 6.4 lists the proposed guidelines for the North West Sector. Figure 6.4.1 illustrates the guidelines to the North West Sector. These include four Connectors and two bus routes that come together at the Minore Shopping Centre and Minore Hill. (The bus routes look a bit proscriptive but are in fact drawn from the interpretation). The Connectors bring traffic to Minore Road and “The Western Boulevard”, a back entrance is served by Blackbutt Road. Modelling showed how important it is to bring traffic from the SW Sector across the rail line and into the Mitchell Highway to accommodate journeys to and from North Dubbo. Hence the “Sandy Creek Boulevard” is connected directly to the end of the “Western Boulevard” rather than directly to Minore Road. This connection is required by 2036. The rate of development in the SW Sector may be slower than the estimated figures, leading to more development in the NW. This would not affect the Road Network Strategy, in fact it might help spread the infrastructure expenditure.
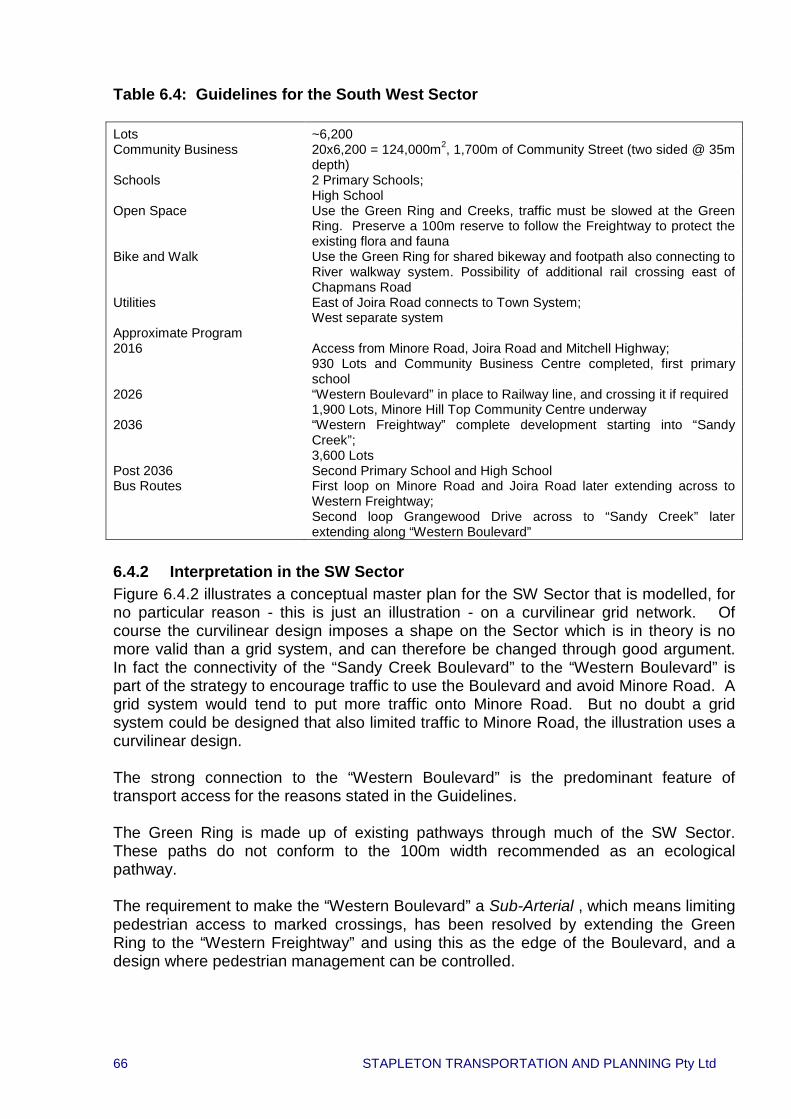
66 STAPLETON TRANSPORTATION AND PLANNING Pty Ltd
Table 6.4: Guidelines for the South West Sector Lots ~6,200 Community Business 20x6,200 = 124,000m2, 1,700m of Community Street (two sided @ 35m
depth) Schools 2 Primary Schools;
High School Open Space Use the Green Ring and Creeks, traffic must be slowed at the Green
Ring. Preserve a 100m reserve to follow the Freightway to protect the existing flora and fauna
Bike and Walk Use the Green Ring for shared bikeway and footpath also connecting to River walkway system. Possibility of additional rail crossing east of Chapmans Road
Utilities East of Joira Road connects to Town System; West separate system
Approximate Program 2016 Access from Minore Road, Joira Road and Mitchell Highway;
930 Lots and Community Business Centre completed, first primary school
2026 “Western Boulevard” in place to Railway line, and crossing it if required 1,900 Lots, Minore Hill Top Community Centre underway
2036 “Western Freightway” complete development starting into “Sandy Creek”; 3,600 Lots
Post 2036 Second Primary School and High School Bus Routes First loop on Minore Road and Joira Road later extending across to
Western Freightway; Second loop Grangewood Drive across to “Sandy Creek” later extending along “Western Boulevard”
6.4.2 Interpretation in the SW Sector Figure 6.4.2 illustrates a conceptual master plan for the SW Sector that is modelled, for no particular reason - this is just an illustration - on a curvilinear grid network. Of course the curvilinear design imposes a shape on the Sector which is in theory is no more valid than a grid system, and can therefore be changed through good argument. In fact the connectivity of the “Sandy Creek Boulevard” to the “Western Boulevard” is part of the strategy to encourage traffic to use the Boulevard and avoid Minore Road. A grid system would tend to put more traffic onto Minore Road. But no doubt a grid system could be designed that also limited traffic to Minore Road, the illustration uses a curvilinear design. The strong connection to the “Western Boulevard” is the predominant feature of transport access for the reasons stated in the Guidelines. The Green Ring is made up of existing pathways through much of the SW Sector. These paths do not conform to the 100m width recommended as an ecological pathway. The requirement to make the “Western Boulevard” a Sub-Arterial , which means limiting pedestrian access to marked crossings, has been resolved by extending the Green Ring to the “Western Freightway” and using this as the edge of the Boulevard, and a design where pedestrian management can be controlled.
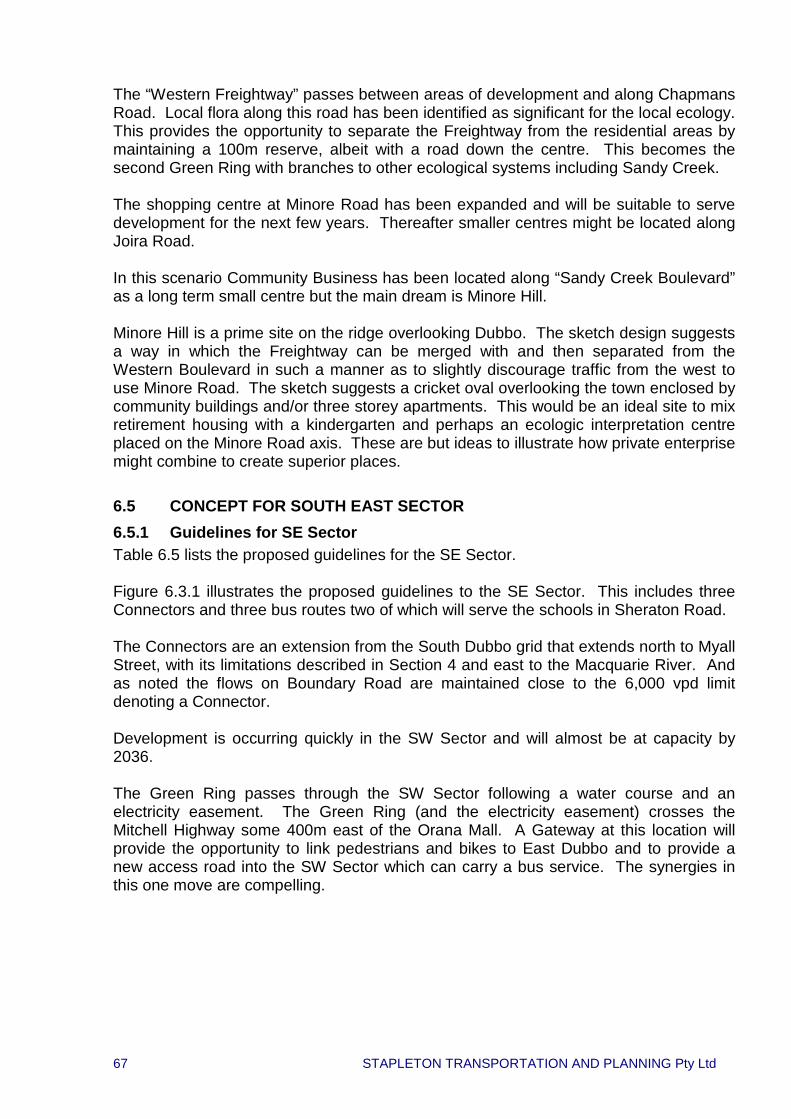
67 STAPLETON TRANSPORTATION AND PLANNING Pty Ltd
The “Western Freightway” passes between areas of development and along Chapmans Road. Local flora along this road has been identified as significant for the local ecology. This provides the opportunity to separate the Freightway from the residential areas by maintaining a 100m reserve, albeit with a road down the centre. This becomes the second Green Ring with branches to other ecological systems including Sandy Creek. The shopping centre at Minore Road has been expanded and will be suitable to serve development for the next few years. Thereafter smaller centres might be located along Joira Road. In this scenario Community Business has been located along “Sandy Creek Boulevard” as a long term small centre but the main dream is Minore Hill. Minore Hill is a prime site on the ridge overlooking Dubbo. The sketch design suggests a way in which the Freightway can be merged with and then separated from the Western Boulevard in such a manner as to slightly discourage traffic from the west to use Minore Road. The sketch suggests a cricket oval overlooking the town enclosed by community buildings and/or three storey apartments. This would be an ideal site to mix retirement housing with a kindergarten and perhaps an ecologic interpretation centre placed on the Minore Road axis. These are but ideas to illustrate how private enterprise might combine to create superior places. 6.5 CONCEPT FOR SOUTH EAST SECTOR 6.5.1 Guidelines for SE Sector Table 6.5 lists the proposed guidelines for the SE Sector. Figure 6.3.1 illustrates the proposed guidelines to the SE Sector. This includes three Connectors and three bus routes two of which will serve the schools in Sheraton Road. The Connectors are an extension from the South Dubbo grid that extends north to Myall Street, with its limitations described in Section 4 and east to the Macquarie River. And as noted the flows on Boundary Road are maintained close to the 6,000 vpd limit denoting a Connector. Development is occurring quickly in the SW Sector and will almost be at capacity by 2036. The Green Ring passes through the SW Sector following a water course and an electricity easement. The Green Ring (and the electricity easement) crosses the Mitchell Highway some 400m east of the Orana Mall. A Gateway at this location will provide the opportunity to link pedestrians and bikes to East Dubbo and to provide a new access road into the SW Sector which can carry a bus service. The synergies in this one move are compelling.

68 STAPLETON TRANSPORTATION AND PLANNING Pty Ltd
Table 6.5: Guidelines for the South East Sector Lots ~2,500 Community Business 20x2,500 = 50,000m2, 720m of Community Street (two sided @ 35m
depth); Some existing in Sheraton Road, and planned in Keswick, remainder south of Boundary ~360m
Schools Primary School Open Space Use the Green Ring and Creeks, traffic must be slowed at the Green
Ring. Make connections to additional open space across the Southern Freightway
Bike and Walk Use the Green Ring for shared bikeway and footpath also connecting to River walkway system at Hennessy Drive
Utilities Head works to be completed Approximate Program 2016 Boundary Road to Sheraton Road and Keswick Connector;
1,090 Lots and small Community Business Centre 2026 New Primary school;
Sheraton Road extended to cul-de-sac at future location of Southern Freightway, residential traffic continues through local streets; Gate for Green Ring completed at Mitchell Highway with additional access to Keswick
2036 Stage 1 of Southern Freightway complete and development almost complete
Bus Routes First Loop from Boundary Road across to Wheelers Lane south of Boundary Road; Second Loop across Keswick to Sheraton Road Third Loop from Mitchell Highway across to Sheraton Road
The number of lots to be developed in the SW Sector suggest some 50,000m2 of Community Business or about 720m of mixed use development along both side of Connector Roads. Some of this Community Business has already been outlined in the Keswick plan, in particular the use of the retention basin as a sports areas served by a community shop and other facilities. This is similar but smaller in scale to the proposal for “Minore Hill” in the SW Sector. Some Community Business activity has occurred on Sheraton Road, not ideally but with utility. It is suggested that only a 360m length of Community Business are required for development south of Boundary Road. The development program is moving ahead quickly and will increase traffic along Macquarie Street towards the City centre. This can be accommodated by local streets serving Wheelers Lane and thence Hennessy Drive. The Southern Freightway is not expected to be in place until 2031 or 2036. 6.5.2 Interpretation in the SE Sector The illustrative master plan, see Figure 6.5.2, for the SE Sector is modelled on a grid network with strong cross links to bring the definitive “edges” of the urban areas back to the community of Boundary Road. The two minor water courses have been celebrated by the location of parks and Places. The design for Keswick has been retained with further access to the Mitchell Highway at the Gateway, mentioned above, and to Boundary Road which will operate as a Connector with flows more reminiscent of a local street at Sheraton Road. Boundary Road though the SW Sector will carry less traffic than it does currently in South Dubbo
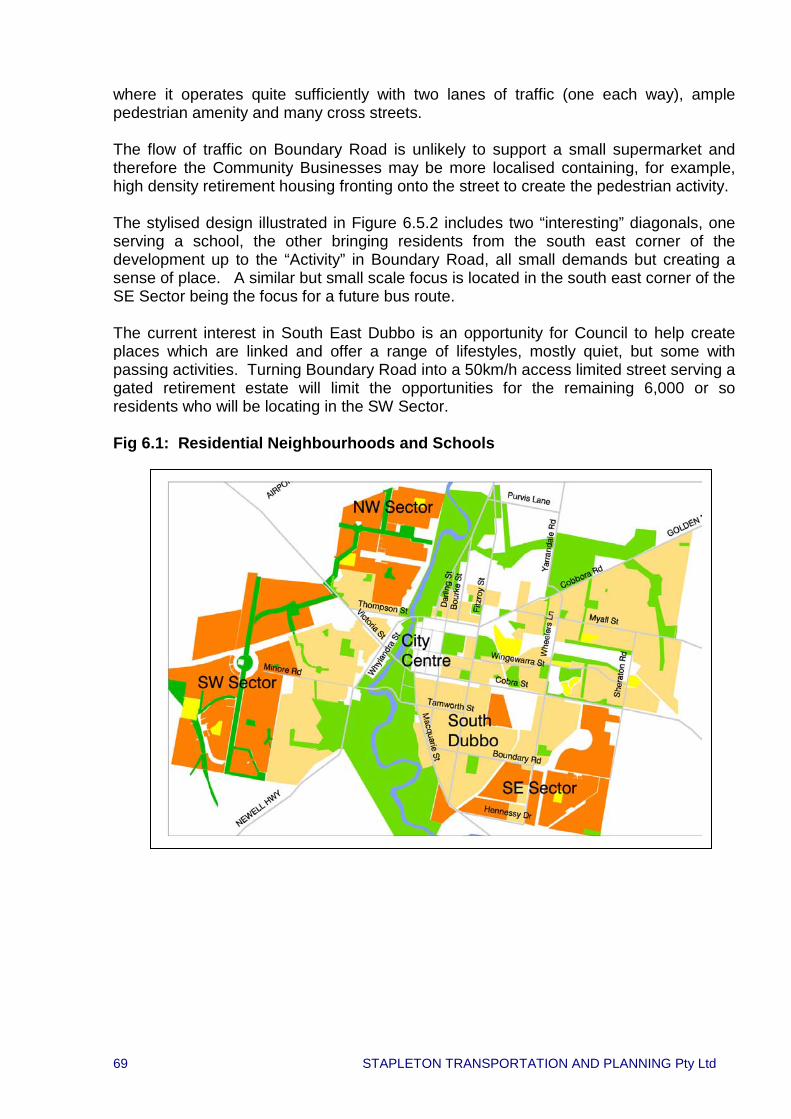
69 STAPLETON TRANSPORTATION AND PLANNING Pty Ltd
where it operates quite sufficiently with two lanes of traffic (one each way), ample pedestrian amenity and many cross streets. The flow of traffic on Boundary Road is unlikely to support a small supermarket and therefore the Community Businesses may be more localised containing, for example, high density retirement housing fronting onto the street to create the pedestrian activity. The stylised design illustrated in Figure 6.5.2 includes two “interesting” diagonals, one serving a school, the other bringing residents from the south east corner of the development up to the “Activity” in Boundary Road, all small demands but creating a sense of place. A similar but small scale focus is located in the south east corner of the SE Sector being the focus for a future bus route. The current interest in South East Dubbo is an opportunity for Council to help create places which are linked and offer a range of lifestyles, mostly quiet, but some with passing activities. Turning Boundary Road into a 50km/h access limited street serving a gated retirement estate will limit the opportunities for the remaining 6,000 or so residents who will be locating in the SW Sector. Fig 6.1: Residential Neighbourhoods and Schools

70 STAPLETON TRANSPORTATION AND PLANNING Pty Ltd
Fig 6.2: Community Business and Medium Density Fig 6.3: Retail Areas

71 STAPLETON TRANSPORTATION AND PLANNING Pty Ltd
Fig 6.4: Tourist Accommodation and Curtilage Spaces Fig 6.5: City Centre and Regional Business Precincts
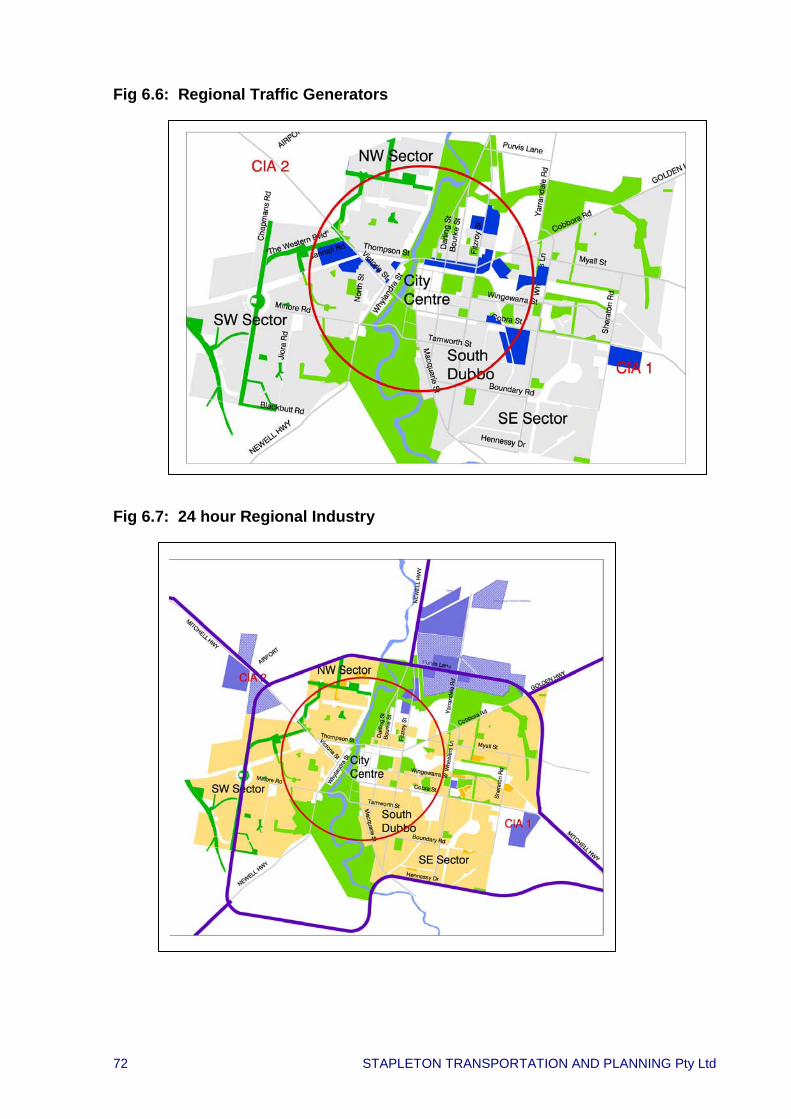
72 STAPLETON TRANSPORTATION AND PLANNING Pty Ltd
Fig 6.6: Regional Traffic Generators Fig 6.7: 24 hour Regional Industry

73 STAPLETON TRANSPORTATION AND PLANNING Pty Ltd
Fig 6.8: Light Industrial-Model

74 STAPLETON TRANSPORTATION AND PLANNING Pty Ltd
Fig 6.3.1: NW Strategic Context
River St
Bung
legu
mbi
e Rd
Richardson Rd
annali Rd
Mac
quar
ie R
iver
Blv
d
"Hill
Top
Road
"
GordonEstate
AIRPORT
Erskine St
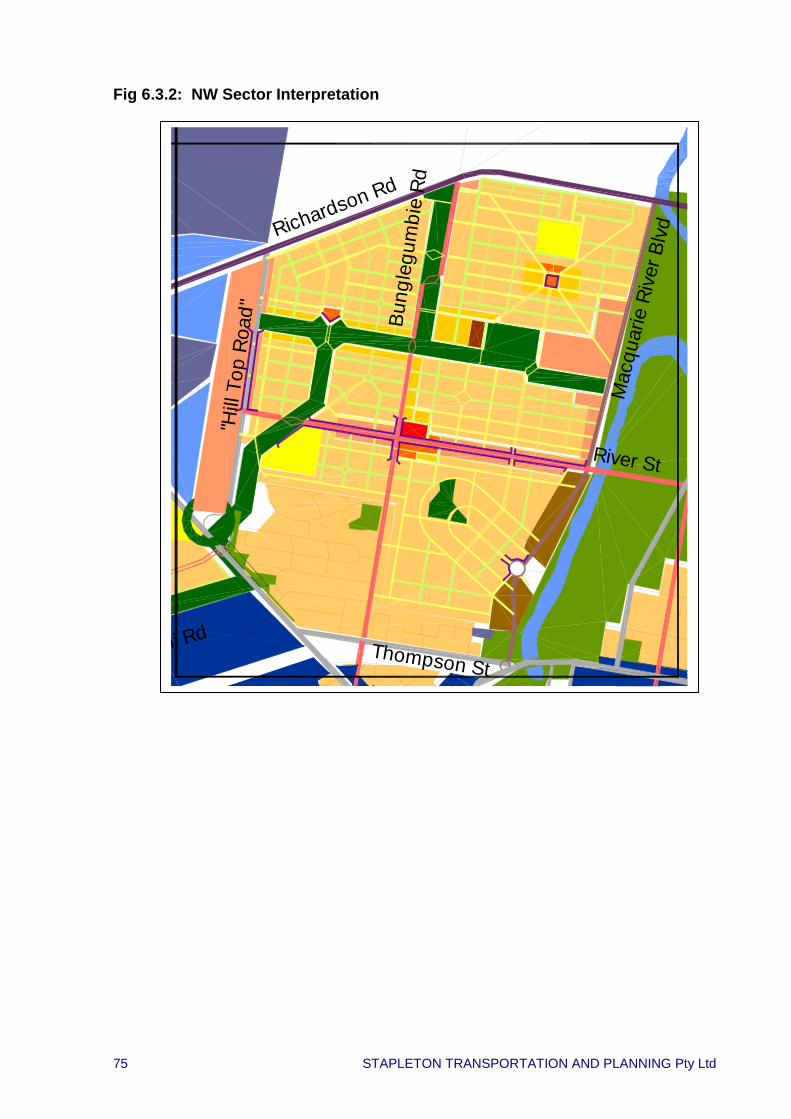
75 STAPLETON TRANSPORTATION AND PLANNING Pty Ltd
Fig 6.3.2: NW Sector Interpretation
Bung
legu
mbi
e Rd
Richardson Rd
li Rd
Thompson St
Mac
quar
ie R
iver
Blv
d
"Hill
Top
Roa
d"
River St

76 STAPLETON TRANSPORTATION AND PLANNING Pty Ltd
Fig 6.3.3: SW Sector Strategic Context
1.04.1
.71.9
.8
.5 1.9
4.2
Blackbutt Rd
Jior
a Rd
Cha
pman
s Rd
Nor
th S
t
Jannali Rd"The Western Bvld"
Thompson St
Sandy Creek
Minore Road
MinoreHill
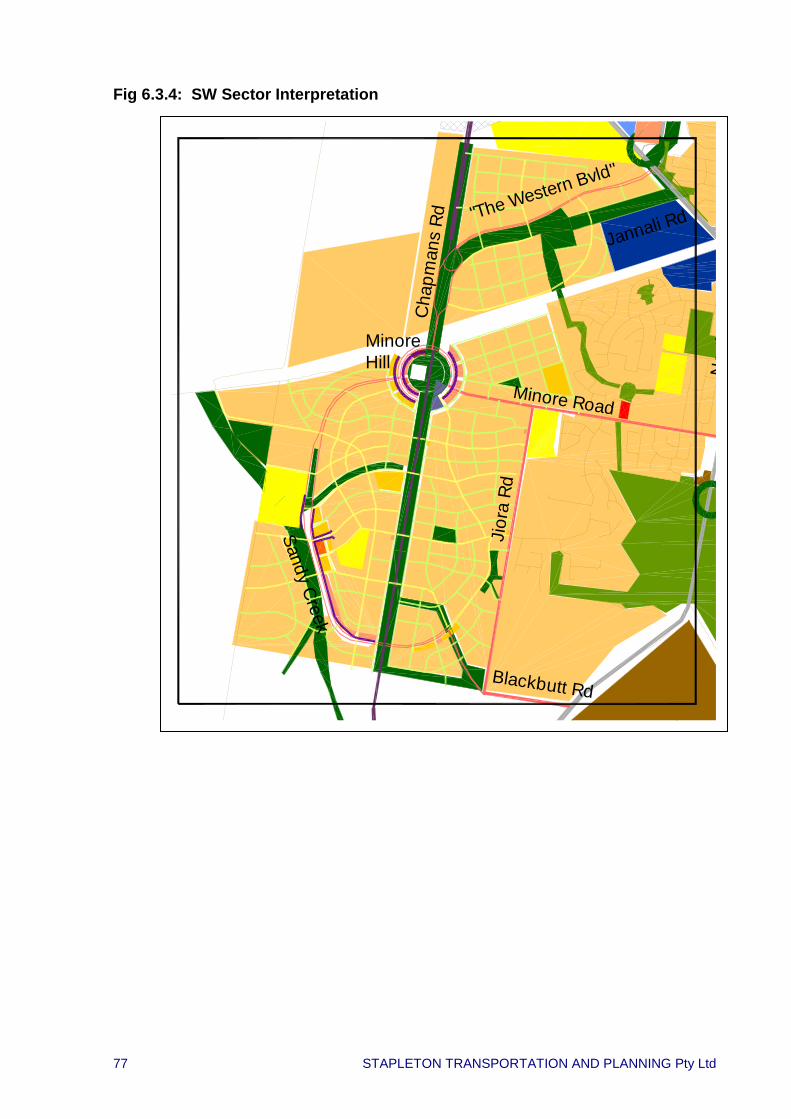
77 STAPLETON TRANSPORTATION AND PLANNING Pty Ltd
Fig 6.3.4: SW Sector Interpretation
1.0
Blackbutt Rd
Jior
a Rd
Cha
pman
s Rd
No
th
Jannali Rd"The Western Bvld"
Sandy Creek
Minore Road
MinoreHill

78 STAPLETON TRANSPORTATION AND PLANNING Pty Ltd
Fig 6.3.5: SE Sector Strategic Context
Cobra StTamworth St
Boundary Rd
Hennessy Dr
Whe
eler
s Ln
Sher
aton
Rd

79 STAPLETON TRANSPORTATION AND PLANNING Pty Ltd
Fig 6.3.6: SE Sector Interpretation
Cobra StTamworth St
Boundary Rd
Hennessy Dr
Whe
eler
s Ln
Sher
aton
Rd

80 STAPLETON TRANSPORTATION AND PLANNING Pty Ltd
7.0 ROAD CONSTRUCTION PROGRAM
Road Strategy is focused on maintaining the same level of service for drivers in Dubbo as they experience today to 2036 and beyond. This is an ambitious objective and one of the conditions that will set aside Dubbo as having different a lifestyle to other Regional Cities. The program is based on the results of modelling future traffic demand described in Section 8, and maintaining free flowing traffic on all major streets. The Road Construction Program will maintain traffic at Level of Service C or better in all parts of the network, meaning delays will be unnoticeable to visitors and acceptable to local residents. The Road Construction Program is achievable because the additional road network relies on using roads that are built as part of local development. The main costs that are not part of local development are parts of The Freightway and, in particular, the new crossings of the Macquarie River. Ideally the entire Freightway should be built as a State Highway. Apart from the fact that the Freightway will be a highly legible efficient means of moving freight and commerce, the construction of it will be offset by the alternative which would be to upgrade the State Highways passing through the City. The Road Construction Program is summarised in Table 7.1.
TABLE 7.1 ROAD PROGRAM
YEAR STREET NAME CLASSIFICATION FUNDING 2016 Boundary Road Neighbourhood Connector Development 2016 Joira Road Neighbourhood Connector Development 2016 Macquarie River Boulevard Business Connector Development 2016 Northern Freightway Industrial Sub-Arterial 2 lane + Bridge (RTA) 2026 Bunglegumbie Road Neighbourhood Connector Development 2026 Minore Road (West) Neighbourhood Connector Development 2026 North Street Neighbourhood Connector Rail Crossing 2026 River Street Neighbourhood Connector Development 2026 Sheraton Road (South) Neighbourhood Connector Development 2026 Tamworth Street Bridge Business Sub-Arterial 2 lane + Bridge 2026 Western Boulevard Neighbourhood Sub-Arterial Development 2036 Blackbutt Road Neighbourhood Connector 2 Lane 2036 Eastern Freightway Rural Arterial 2 Lane 2036 Hills Road Industrial Connector Development 2036 Myall Street (East) Neighbourhood Distributor Rail Crossing 2036 River Street Bridge Business Connector Bridge 2036 Sandy Creek Neighbourhood Connector Development 2036 Southern Freightway Stage 1 Rural Arterial 2 Lane 2036 Western Freightway Rural Arterial 2 Lane
81 STAPLETON TRANSPORTATION AND PLANNING Pty Ltd
7.1 CONSTRUCTION BY 2016 The Road Construction Program for 2016 is illustrated in Figure 7.1 and includes two existing road alignments and one new alignment that must be built as part of local development. If the development is delayed the roads will not be built. These roads are: - o Upgrade of Joira Road in the SW Sector; o The construction of Boundary Road in the SE Sector; and o The commencement of the “Macquarie River Boulevard” opening up
development in the NW Sector. The Freightway should be commenced by 2016 with the Northern Freightway providing direct access to the abattoir and including a new bridge on the alignment of Purvis Lane. The Northern Freightway consists of the extension of Richardson Road to the alignment of Purvis Lane. This can be built as a two lane road with set backs to allow Regional Industrial development to occur at a later date. 7.2 CONSTRUCTION BY 2026 The Road Construction Program for 2026 is illustrated in Figure 7.2. The projected residential development by 2026 will include the construction of four Neighbourhood Connectors as part of development. These include: o The start of upgrading Bunglegumbie Road in the NW Sector; o River Street extended from Bunglegumbie Road in the NW Sector; o Minore Road extended to Minore Hill in the SW Sector; and o Sheraton Road extended to Hennessy Drive in the SE Sector.
The linking of North Street across the rail line at West Dubbo is also included in the 2026 program as a connection between the NW Sector and Victoria Street. Another road constructed as part of local development during this period will be the Western Boulevard from Mitchell Street to Chapmans Road. Whilst its status as a Neighbourhood Sub-Arterial is rather onerous on the developer, the actual design is not overwhelming and can form an integral part of the residential environment. The main cost item included in the 2026 schedule is the Tamworth Street Bridge. This will relieve pressure to widen the Ford Bridge which, if widened would in turn require upgrading of the Whylandra/Victoria intersection. This which would be contrary to the urban design outcomes sought for West Dubbo. Whilst the Tamworth Street Bridge is not in the long term going to be part of the State Highway network, because Stage 2 of the Southern Freightway will take traffic out of the City centre, it will provide an alterative to a State Highway for over 20 years.

82 STAPLETON TRANSPORTATION AND PLANNING Pty Ltd
7.3 CONSTRUCTION BY 2036 The Road Construction Program for 2036 is illustrated in Figure 7.3. The projected residential development by 2036 will include the extension of a number of Neighbourhood Connectors and the construction of two Neighbourhood Connectors as part of development. o The “Sandy Creek” Boulevard will be part of development in the SW Sector. o The “Hills Road” in the NW Sector which is intended to serve light Industrial
mixed use development. An essential part of residential development will be the completion of the River Street extension across the Macquarie River. This low level bridge will take pressure off Erskine Street and reduce the distance travelled between the employment areas of North Dubbo, the NW Sector and even the SW Sector. This is a fundamental part of the City grid - the source of funding is less obvious than other roads. Also included in the program is the reconnection of Myall Street between Fitzroy Street and Cobbora Road beside the hospital. This section of the network should be connected at the convenience of the Base Hospital possibly during some upgrading and is needed by 2036. The completion of the back road from the SW Sector to the Newell Highway via Blackbutt Road rates a mention in the 2036 program but may be required earlier. The main need for road construction in 20 to 30 years will be completing the Freightway. These sections include: o The Eastern Freightway - the alignment of which has been reserved and can be
completed at a reasonably low cost. This could be brought forward in the program.
o The Western Freightway which also has an alignment reserved (Chapmans Road). The major cost item will be the bridge across the Railway. This will be an essential part of the road network required to serve the SW Sector by 2036. This will be part of a strategic State road network.
o The Southern Freightway Stage 1 from the Mitchell Highway to Hennessy Drive will provide some relief to Cobra Street by offering an alternate access to the SW Sector and South Dubbo. With the completion of Stage 2 to the Newell Highway some time after 2026, this will become part of the State Highway.
7.4 CONSTRUCTION AFTER 2036 The Strategic Road Network not included for construction prior to 2036 is illustrated in Figure 7.4. This includes Stage 2 of the Southern Freightway linking Hennessy Drive to the Newell Highway south of the Zoo - the modelling suggests this is not required until after 2036; the residents of Macquarie Street between the Tamworth Street Bridge and Hennessy

83 STAPLETON TRANSPORTATION AND PLANNING Pty Ltd
Drive will demand its construction when truck drivers start diverting from Cobra Street in noticeable numbers. This may not occur for decades. Also in the 2036+ plan is the completion of the grid network in the NW Sector with “Hill Road” and the “Macquarie River Boulevard” linking through to the Northern Freightway. The programming of these links will be dictated by the development program, which it has been noted, could be faster in the NW Sector than the figures used in this analysis. 7.5 SUMMARY The Road Construction Program will be subject to further debate; this analysis summarises how Dubbo could maintain its good travel conditions into the future. This seems eminently possible and desirable in spite of peak oil. Dubbo is a trading City and needs its Freightways brought out of the City. The other two new bridges at Tamworth Street and River Street will be part of a transportation network with or without the use of cars as we know them.

84 STAPLETON TRANSPORTATION AND PLANNING Pty Ltd
8.0 MODELLING
8.1 SCOPE OF WORK The transport strategy consisted of the following analysis: • To prepare a road strategy for Dubbo to meet the demand generated by a
growing economy and a growing population into the year 2036. • Estimate the travel demand. • To model traffic flows using a traffic model called TRACKS. TRACKS is owned
and was operated by Gabites Porter of Christchurch, New Zealand. • To prepare a strategy for building new infrastructure in ten year periods starting
in 2016 with subsequent staging in 2026 and 2036. The underlying assumptions of the analysis are that Dubbo will grow at a rate that has been predicted by Council and which was discussed in detail in Section 2. It is also assumed that public transport will become more effective in Dubbo as demand allows more services to operate; this was discussed in Section 3. Nevertheless it is assumed that car travel will continue to be the mode of choice irrespective of the price of fuel. 8.2 THE ROLE OF MODELLING Modelling is used to evaluate how roads will perform in the future. The same modelling can be used for evaluating public transport impacts and other more detailed analysis. For the case of Dubbo, the model has been used solely to look at road transport, freight and private vehicles. The model calculates the trips made between generators, which are generally houses, and attractors, which are generally work places. There is also movement between work places where, for example, somebody will travel from a shop to another shop or from a warehouse to a shop. These are also included in the model and are described as non-home based trips. The base year travel was taken as 2006. The reason for this is that it complies with the Bureau of Statistics’ census data which is a good starting point for any form of modelling analysis. This is also the reason the years 2016, 2026 and 2036 were selected for future analysis. Traffic for the base year was first estimated using typical traffic generation figures taken from similar situations. TRACKS has plenty of data and has been used in the Illawarra Region, in Coffs Harbour, throughout New Zealand and in parts of Sydney. The modellers did find some surprises from their office in New Zealand when they found a large volume of midday traffic on the traffic counts that was not explained easily by the normal trip generation that they had used in their first estimates. This of course comes as one of the benefits of Dubbo where people drive home for lunch. This is one of the reasons why the trip generation rate per household in Dubbo is higher than that on the coast.

85 STAPLETON TRANSPORTATION AND PLANNING Pty Ltd
The first estimate of travel generated for the base year 2006 was then compared with actual travel data, the number of vehicles counted travelling along various roads in Dubbo. These counts were conducted by Dubbo City Council. Adjustments were made to the trip generations and to the movement between places until the model calibrates with, is the same as) measured conditions. Once this calibration is complete, the model can then be used confidently to project future demands based on future population and employment. The model is used to estimate traffic in the morning peak hour, the evening peak hour and the midday travel. 8.3 2006 MODEL The model started with assumed trip generations for 2006 and these were used to simulate existing conditions and then reviewed against the reality of actual counts. The 2006 model correctly identified that Cobbora Road is close to capacity, as is the L H Ford Bridge. This analysis is verified by the fact that work is currently underway at the intersection of Yarrandale Road and Cobbora Road to resolve issues of traffic congestion near to the University. Most other sections of road were found to be operating below the standard level of congestion which has been selected for Dubbo. The standard adopted for Dubbo is described in the transport analysis as “Level of Service C”. This is a very high standard of service creating minor delays at intersections, in the range to 22 seconds. Other coastal towns are now designed to lower standards, Level of Service D or even E being acceptable in the centre of towns. 8.4 FUTURE LAND USES The future land uses are described in Section 5. In summary, the planning strategy is based on an assumption that the number of households will rise by 250 dwellings per year for the foreseeable future. Employment forecasts have been prepared to meet the demand from the number of workers that will be generated from these additional households. Suitable figures have been applied to the average household size, which is decreasing over time and the number of employees per household, which is also decreasing. The employment is distributed to existing and future employment areas. These are fully described in Section 5. For the purposes of modelling, it is assumed that each of the assigned areas for each type of employment will grow pro rata to the population growth. This assumption is made based on the need for flexibility to develop Dubbo over time. The details of how each area will develop cannot and should not be defined at this point. The future housing has been allocated to three development areas: the South East, from Keswick continuing south across Boundary Road; the South West, continuing south and west from Minore Road; and the North West, continuing north and east of the
86 STAPLETON TRANSPORTATION AND PLANNING Pty Ltd
Gordon Estate on the western side of the Macquarie River (described further in Sections 5 and 6). It is assumed that housing will be available on all of these fronts, providing a range of housing opportunities for both newcomers and those moving to new accommodation within Dubbo. It should be noted that currently a significant proportion of new housing on the south western part of Dubbo is being generated by those moving from the inner parts of Dubbo. This is having the effect of reducing the household size in the inner area of Dubbo, in the same way as many other areas such as communities in New South Wales. Early Modelling In the first set of modelling, the distribution of future housing demand prior to 2036 was focused on the south east and the south west. This analysis concluded that some of the Connectors required in the North West Sector to carry traffic between the south west and the north would be required before the development had occurred along them; in particular the extension of River Street through the North West Sector. This is not a practical solution, it is better to build roads as part of development and to use the roads to service development. Final Modelling A second set of modelling was authorised by Council to look at bringing forward development in the North West Sector. This is logical for a number of reasons, not least the fact that the North West Sector is much closer to the Town Centre and therefore development in this area minimises travel. The North West Sector is also well located to bring forward new upmarket employment and serve it with the new residential development adjacent to the employment. This synergy is described more in Section 2. The modelling results which are used in this report are based on this adjusted planning scenario. 8.5 NETWORK BUILDING The principle in choosing the Road Network was “load” the future travel demand (trips between places) onto a road network, see which sections incurred delays and add new roads until the traffic conditions were acceptable. Then move to the next decade. The worst case scenario of future travel was created by “loading” the 2036 travel demand onto the 2006 road network. This gives a picture of what conditions would be like if nothing was done and development continued as predicted. This is not a realistic scenario since if delays became the normal in Dubbo then businesses and people would not be attracted to Dubbo and the forecasted demand would not be realised. Nevertheless, the Do Nothing analysis shows where traffic demand would be if the roads were good enough to take the load. The basic concept for the Freightway had been laid down before this study commenced and had merit as a strategic move to reinforce Dubbo as a regional freight centre. The expansion of the Abattoir and new Freight Centre near the Abattoir where major factors

87 STAPLETON TRANSPORTATION AND PLANNING Pty Ltd
in the establishment of the Northern Freightway. The centre for freight on the Mitchell Highway at Richardson Road was the logic behind the Western Freightway. The Eastern Freightway was a logical means of crossing from the Mitchell Highway to the trucking and freight industries in North Dubbo without the constant need to increase capacity on existing roads running though the existing City and therefore with limited capacity for change. The second logic for the future road network for Dubbo was mending and extending the Grid and this includes two new crossings of the Macquarie River: o River Street, connecting existing and future development in the north, and o Tamworth Street, connecting existing and future development in the south. The logic was that both these connections would take some traffic out of the City centre thereby maintaining it as the urban centre and allowing expansion to the west of the river. Here modelling proves in valuable; answering such questions as what will be the impact of a new bridge to Tamworth Street and will this lead to a flood of traffic though South Dubbo? (No, the traffic using the new Bridge mostly turns into Macquarie Street or the City centre). Adding new roads causes small changes in demand throughout the existing streets and does not generally lead to major changes on any one street. The modelling process was therefore: 1. Load the 2016 traffic demand onto the 2006 Network. 2. Note places where congestion would occur and add roads to remove that
congestion to create a 2016 Network. 3. Load the 2026 traffic demand onto the 2016 Network. 4. Note places where congestion would occur and add roads to remove that
congestion to create a 2026 Network. 5. Load the 2036 traffic demand onto the 2026 Network. 6. Note places where congestion would occur and add roads to remove that
congestion to create a 2036 Network. 7. One further iteration was conducted of loading an estimated 2046 traffic
demand onto the 2036 Network. The conclusions continuously referred back to Cobra Street as is discussed below. 8.6 MODELLING ANALYSIS The analysis is reported in two forms; Table 8.1 lists the traffic flows reported from the model summarised into screen lines, cuts across the map; Appendix A contains diagrams showing where Level of Service C is reported for each of the modelled years.

88 STAPLETON TRANSPORTATION AND PLANNING Pty Ltd
8.6.1 2036 Do Nothing and Road Strategy Table 8.1 lists daily traffic flows on three screen lines in 2006, 2036, with no improvements to roads, and 2036, with the recommended strategy. The existing traffic flows and conditions have been described in Sections 3 and 4. Screen Line 1 River Crossings Currently some 31,500 vpd cross the Macquarie River at the two crossings. Traffic is expected to increase by 96% by 2036. The Do Nothing modelling shows the increase would be predominantly at Serisier Bridge, this partly reflecting the difference in the capacity of the Serisier Bridge and the L H Ford Bridge. The 2036 Strategy accommodates the increased flow with the three new crossings - little increase in the flow using Serisier Bridge and an equal flow on the Ford Bridge. The flow on the Ford Bridge can be handled but only by limiting access to Macquarie Street to left in - left out. These flows will vary and can possibly be more balanced with the capacity of the bridges by rearrangements in the City centre. Screen Line 2 Eastern Screen Line The Eastern Screen Line cuts a north south line from the University to Hennessy Drive. Traffic on this Screen Line is expected to increase by 58%. The highest increases are expected at the northern and southern ends of the screen line indicating that proposals to spread traffic have been very successful. Nevertheless, traffic on the main roads in the City will rise by between 26% and 37%. The road strategy still results in the pedestrian amenity decreasing in most streets but, as has been stated earlier, this can be handled because of the generous design of the existing carriageways. Screen Line 3 East West Screen Line The East West screen line follow the rail line from Minore Hill to south Buninyong Road. Traffic on this Screen Line is expected to increase by 60%. The proposed connectivity maintains most streets at the present amenity, indeed the flow on Whylandra Street near Thomson Street is expected to reduce a little and this is consistent with the plan to improve pedestrian amenity through West Dubbo. In the Do Nothing case, the traffic on Whylandra Street would be twice as much as the proposed strategy requiring major upgrading of the intersection with Victoria Street which would be contrary to the proposed improvement of pedestrian amenity in West Dubbo. Flows in the City centre are slightly higher than existing flows indicating the increased demand for the City is not mixed with additional through traffic and the strategy has been successful. Further work on the City centre can proceed with an aim to improving and extending pedestrian amenity.

89 STAPLETON TRANSPORTATION AND PLANNING Pty Ltd
The lack of connectivity in east Dubbo shows up by the increase in traffic on Wheelers Lane and Sheraton Road and pedestrian amenity will decrease in both streets. Street management can, however, support the traffic safely. Note how the flow of traffic using North Street in West Dubbo will allow it to be designed as a Connector with full pedestrian access even with its connection to Bunglegumbie Road.

90 STAPLETON TRANSPORTATION AND PLANNING Pty Ltd
Table 8.1: Screen Lines 2006, 2036 Do Nothing and Strategy
2026 Base
Vpd
2036 Do Nothing
Vpd
2036 Strategy
Vpd
1 River Crossings Northern Freightway 7,290 River Street 2,890 Serisier Bridge 16,080 34,170 213% 19,840 LH Ford Bridge 15,610 27,890 179% 20,290 Tamworth Bridge 11,750 196% 2 Eastern Screen Line Purvis Lane 2,550 7,670 301% 8,620 Yarrandale Road 2,630 8,260 314% 8,210 Cobbora Road 9,640 12,310 128% 11,580 Myall Street 10,450 13,750 132% 13,810 Wingewarra Street 8,030 10,120 126% 8,950 Cobra Street 14,730 20,120 137% 17,380 Boundary @ Fitzroy 3,550 8,040 226% 7,860 Hennessy Drive 530 2,230 5,850 158% 3 East West Screen Line Chapmans St Rail Bridge 5,580 8,230 Victoria Street 9,630 17,110 178% 17,600 North Street 0 4,410 Whylandra @ Thompson 10,380 18,900 182% 9,720 Bligh Street (City) 5,080 9,520 187% 6,850 Macquarie Street (City) 4,450 4,780 5,050 Darling Street 5,130 8,430 164% 7,100 Fitzroy Street 11,490 13,330 116% 11,790 Wheelers Lane 9,770 13,350 137% 12,750 Sheraton Road 8,010 10,440 130% 11,100 Eastern Freightway 160% LEGEND Connector 3,500 – 6,000 vpd Distributor 6,000 – 11,000 vpd Sub-Arterial 11,000 – 15,000 vpd Arterial 15,000 – 21,000 vpd Arterial >21,000 vpd

91 STAPLETON TRANSPORTATION AND PLANNING Pty Ltd
8.6.2 2016 Network Evaluation Table 8.2 lists daily traffic flows on three screen lines in 2006 and 2016. The Level of Service analysis also shows that without amendments Cobra Street will be operating at over Level of Service C for part of its length. The Road Strategy reduces the Level of Service in Cobra Street to close to Level of Service C. This process is repeated in the analysis of each decade. New roads included in the network are the Northern Freightway and the rail bridge at Chapmans Road. It is unlikely that the Western Boulevard will be completed from the Mitchell Highway to Chapmans Road by 2016. If it were completed, then the model suggests it would be used by 2,500, a reasonable flow but not one that requires the construction of a road which is not part of residential development. The 2,500 vpd will continue to use Minore Road. It is estimated that the Northern Freightway will be carrying just over 4,000 vpd by 2016, a reasonable flow that keeps traffic out of the City centre. The most noticeable feature of the 2016 traffic figures is the change in pedestrian amenity on many existing roads; Myall Street, Cobra Street, Victoria Street, Whylandra Street and Wheelers Lane, will each need remedial measures to maintain pedestrian and bike accessibility over the next few years. The only good message coming out of this message is that the conditions do not get much harder through to 2026.
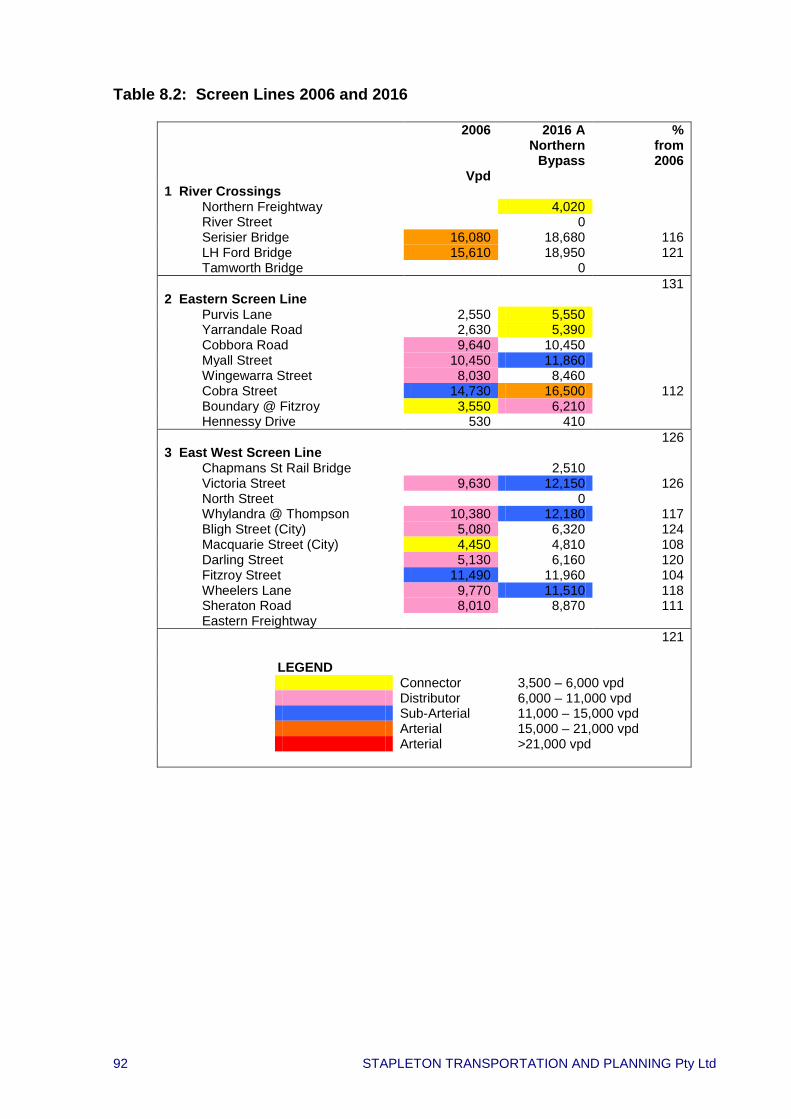
92 STAPLETON TRANSPORTATION AND PLANNING Pty Ltd
Table 8.2: Screen Lines 2006 and 2016
2006
Vpd
2016 A Northern
Bypass
% from 2006
1 River Crossings Northern Freightway 4,020 River Street 0 Serisier Bridge 16,080 18,680 116 LH Ford Bridge 15,610 18,950 121 Tamworth Bridge 0
131 2 Eastern Screen Line Purvis Lane 2,550 5,550 Yarrandale Road 2,630 5,390 Cobbora Road 9,640 10,450 Myall Street 10,450 11,860 Wingewarra Street 8,030 8,460 Cobra Street 14,730 16,500 112 Boundary @ Fitzroy 3,550 6,210 Hennessy Drive 530 410
126 3 East West Screen Line Chapmans St Rail Bridge 2,510 Victoria Street 9,630 12,150 126 North Street 0 Whylandra @ Thompson 10,380 12,180 117 Bligh Street (City) 5,080 6,320 124 Macquarie Street (City) 4,450 4,810 108 Darling Street 5,130 6,160 120 Fitzroy Street 11,490 11,960 104 Wheelers Lane 9,770 11,510 118 Sheraton Road 8,010 8,870 111 Eastern Freightway
121 LEGEND Connector 3,500 – 6,000 vpd Distributor 6,000 – 11,000 vpd Sub-Arterial 11,000 – 15,000 vpd Arterial 15,000 – 21,000 vpd Arterial >21,000 vpd
93 STAPLETON TRANSPORTATION AND PLANNING Pty Ltd
8.6.3 2026 Network Evaluation Table 8.3 lists daily traffic flows on three screen lines in 2016 and 2026. Again the Road Strategy maintains Cobra Street at Level of Service C. The major new road in the network is the Tamworth Street Bridge which opens with a flow of nearly 10,000 vpd. The positive impact of this road can be noted by the reduction of traffic in the vicinity, including Victoria Street, Whylandra Street at Thompson Street, Bligh Street and Darling Street and the two crossings to the City. Following on from the comment for 2016, there are no further reductions in pedestrian amenity on any Neighbourhood or Business streets between 2016 and 2026. Traffic in Purvis Lane and Yarrandale Road is estimated to increase by 32% between 2016 and 2026.

94 STAPLETON TRANSPORTATION AND PLANNING Pty Ltd
Table 8.3: Screen Lines 2016 and 2026
2016
2026 on
2016
2026 Tamworth
Bridge
% from 2016
1 River Crossings Northern Freightway 4,020 5,870 5,920 147 River Street 0 0 0 Serisier Bridge 18,680 22,010 20,440 109 LH Ford Bridge 18,950 25,180 17,220 91 Tamworth Bridge 0 0 9,850
128 2 Eastern Screen Line Purvis Lane 5,550 7,130 7,310 132 Yarrandale Road 5,390 6,890 7,110 132 Cobbora Road 10,450 10,790 11,040 106 Myall Street 11,860 13,100 12,640 107 Wingewarra Street 8,460 9,460 8,890 105 Cobra Street 16,500 18,070 18,260 111 Boundary @ Fitzroy 6,210 7,760 7,650 123 Hennessy Drive 410 510 830 202
113 3 East West Screen Line Chapmans St Rail Bridge 2,510 5,430 5,710 227 Victoria Street 12,150 17,680 14,780 122 North Street 0 0 0 Whylandra @ Thompson 12,180 13,170 11,700 96 Bligh Street (City) 6,320 8,060 6,320 100 Macquarie Street (City) 4,810 4,960 4,790 100 Darling Street 6,160 7,090 6,640 108 Fitzroy Street 11,960 11,880 11,930 100 Wheelers Lane 11,510 12,110 12,440 108 Sheraton Road 8,870 10,110 10,160 115 Eastern Freightway
111 LEGEND Connector 3,500 – 6,000 vpd Distributor 6,000 – 11,000 vpd Sub-Arterial 11,000 – 15,000 vpd Arterial 15,000 – 21,000 vpd Arterial >21,000 vpd

95 STAPLETON TRANSPORTATION AND PLANNING Pty Ltd
8.6.4 2036 Network Evaluation Table 8.4 lists daily traffic flows on three screen lines in 2026 and 2036. And once again the Road Strategy brings down the Level of Service along Cobra Street to Level of Service C and without the Strategy the Level of Service drops below C. The major new road in the network in 2036 is the new bridge across the Macquarie River at River Street, this opens with a flow of about 2,900 vpd with a corresponding reduction in the traffic using the Serisier Bridge. Rapid development in the SW Sector will increase the use of the Rail Bridge at Chapmans Road by 44% and some of this traffic will still use Victoria Street, 1,800 vpd less with the River Street crossing completed. And the Northern Freightway will also carry 23% more traffic in the decade between 2026 and 2036, complementing the River Street crossing.

96 STAPLETON TRANSPORTATION AND PLANNING Pty Ltd
Table 8.4: Screen Lines 2026 and 2036
2026
Vpd
2036 on
2026 Vpd
2036 Strategy
Vpd
% from 2026
1 River Crossings Northern Freightway 5,920 7,900 7,290 123 River Street 0 0 2,890 Serisier Bridge 20,440 22,250 19,840 97 LH Ford Bridge 17,220 20,100 20,290 118 Tamworth Bridge 9,850 11,800 11,750 119
116 2 Eastern Screen Line Purvis Lane 7,310 8,630 8,620 118 Yarrandale Road 7,110 8,230 8,210 115 Cobbora Road 11,040 11,510 11,580 105 Myall Street 12,640 13,760 13,810 109 Wingewarra Street 8,890 8,950 8,950 101 Cobra Street 18,260 17,370 17,380 95 Boundary @ Fitzroy 7,650 7,850 7,860 103 Hennessy Drive 830 5,850 5,850 705
112 3 East West Screen Line Chapmans St Rail Bridge 5,710 8,330 8,230 144 Victoria Street 14,780 19,290 17,600 119 North Street 0 0 4,410 Whylandra @ Thompson 11,700 12,030 9,720 83 Bligh Street (City) 6,320 6,960 6,850 108 Macquarie Street (City) 4,790 4,840 5,050 105 Darling Street 6,640 7,210 7,100 107 Fitzroy Street 11,930 11,890 11,790 99 Wheelers Lane 12,440 12,780 12,750 102 Sheraton Road 10,160 11,100 11,100 109 Eastern Freightway
112 LEGEND Connector 3,500 – 6,000 vpd Distributor 6,000 – 11,000 vpd Sub-Arterial 11,000 – 15,000 vpd Arterial 15,000 – 21,000 vpd Arterial >21,000 vpd
97 STAPLETON TRANSPORTATION AND PLANNING Pty Ltd
8.6.5 2046 Network Evaluation The traffic estimates for 2046 are not made with the detailed land use patterns that have been used for the earlier decades. Additional population has been allocated in line with the discussion in Section 5 but employment has been spread as a simple pro-rata increase to the numbers allocated in 2036 figures (No estimates were made of the land take or likely direction of employment in 2046.) The traffic figures are nevertheless of interest and listed in Table 8.5. The river crossings continue to increase with the River Street crossing taking the highest precent of growth and the Serisier Bridge passing the 21,000 vpd mark, which it can carry but which may not be suited to the needs of the City centre. Purvis Lane increases by 48% in the decade, the Chapmans Road Rail Bridge by 86% (resulting from the intensive development of Sandy Creek). The results of the modelling on other streets listed in the screen lines are quite flat in the period, indeed some flows are shown to decrease slightly. These figures tend to show the inaccuracies that creep into modelling if it is not done carefully rather than the hope that flows will reduce in key places such as Victoria Street. The overall impression for 2046 is that the grid system will continue to serve Dubbo well and there will be no surprises in the next 50 years of growth. Cars? Well they will still be around in some form, perhaps the MG midget will be back on hydrogen.
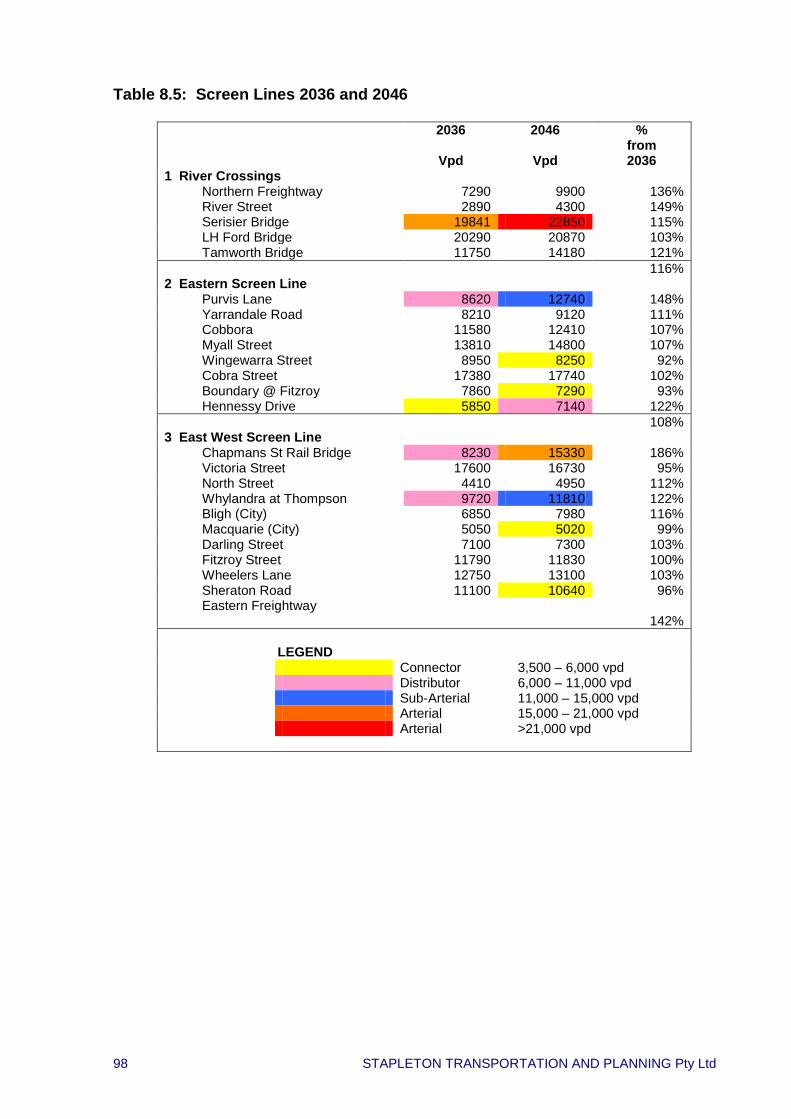
98 STAPLETON TRANSPORTATION AND PLANNING Pty Ltd
Table 8.5: Screen Lines 2036 and 2046
2036
Vpd
2046
Vpd
% from 2036
1 River Crossings Northern Freightway 7290 9900 136% River Street 2890 4300 149% Serisier Bridge 19841 22850 115% LH Ford Bridge 20290 20870 103% Tamworth Bridge 11750 14180 121%
116% 2 Eastern Screen Line Purvis Lane 8620 12740 148% Yarrandale Road 8210 9120 111% Cobbora 11580 12410 107% Myall Street 13810 14800 107% Wingewarra Street 8950 8250 92% Cobra Street 17380 17740 102% Boundary @ Fitzroy 7860 7290 93% Hennessy Drive 5850 7140 122%
108% 3 East West Screen Line Chapmans St Rail Bridge 8230 15330 186% Victoria Street 17600 16730 95% North Street 4410 4950 112% Whylandra at Thompson 9720 11810 122% Bligh (City) 6850 7980 116% Macquarie (City) 5050 5020 99% Darling Street 7100 7300 103% Fitzroy Street 11790 11830 100% Wheelers Lane 12750 13100 103% Sheraton Road 11100 10640 96% Eastern Freightway
142% LEGEND Connector 3,500 – 6,000 vpd Distributor 6,000 – 11,000 vpd Sub-Arterial 11,000 – 15,000 vpd Arterial 15,000 – 21,000 vpd Arterial >21,000 vpd