![Untitled document []€¦ · —Norma i C.W —Meteor scatter CW c. -sse -AM QRSS Cid TEST I=SOVNDCARD TEST MODE -ANALOG HARDWARE TUNE -RADAR —Init moon tpacking and EME —Network](https://static.fdocuments.us/doc/165x107/5eacd8b4f4ef996d3a284107/untitled-document-anorma-i-cw-ameteor-scatter-cw-c-sse-am-qrss-cid-test.jpg)
DTIC · Illustrations 1. Location of the Phillips Laboratory Meteor Scatter Test Bed in Greenland....
25
PL-TR-91-2026 Environmental Research Papers, No.1078 AD-A257 771 INVESTIGATION OF FREQUENCY DIVERSITY EFFECTS ON METEOR SCATTER LINKS J. C. Ostergaard A. D. Bailey S. W. LI 9 January 1991 DTIC • OCT23 199A U FE APPROVED FOR PUBLIC RELEASE, DISTRIBUTION UNLIMITED. 92-27741 PHILLIPS LABORATORY DIRECTORATE OF GEOPHYSICS AIR FORCE SYSTEMS COMMAND HANSCOM AIR FORCE BASE, MA 01731-5000
Transcript of DTIC · Illustrations 1. Location of the Phillips Laboratory Meteor Scatter Test Bed in Greenland....

PL-TR-91-2026Environmental Research Papers, No.1078 AD-A257 771
INVESTIGATION OF FREQUENCY DIVERSITYEFFECTS ON METEOR SCATTER LINKS
J. C. OstergaardA. D. BaileyS. W. LI
9 January 1991
DTIC
• OCT23 199A UFE
APPROVED FOR PUBLIC RELEASE, DISTRIBUTION UNLIMITED.
92-27741
PHILLIPS LABORATORYDIRECTORATE OF GEOPHYSICSAIR FORCE SYSTEMS COMMANDHANSCOM AIR FORCE BASE, MA 01731-5000
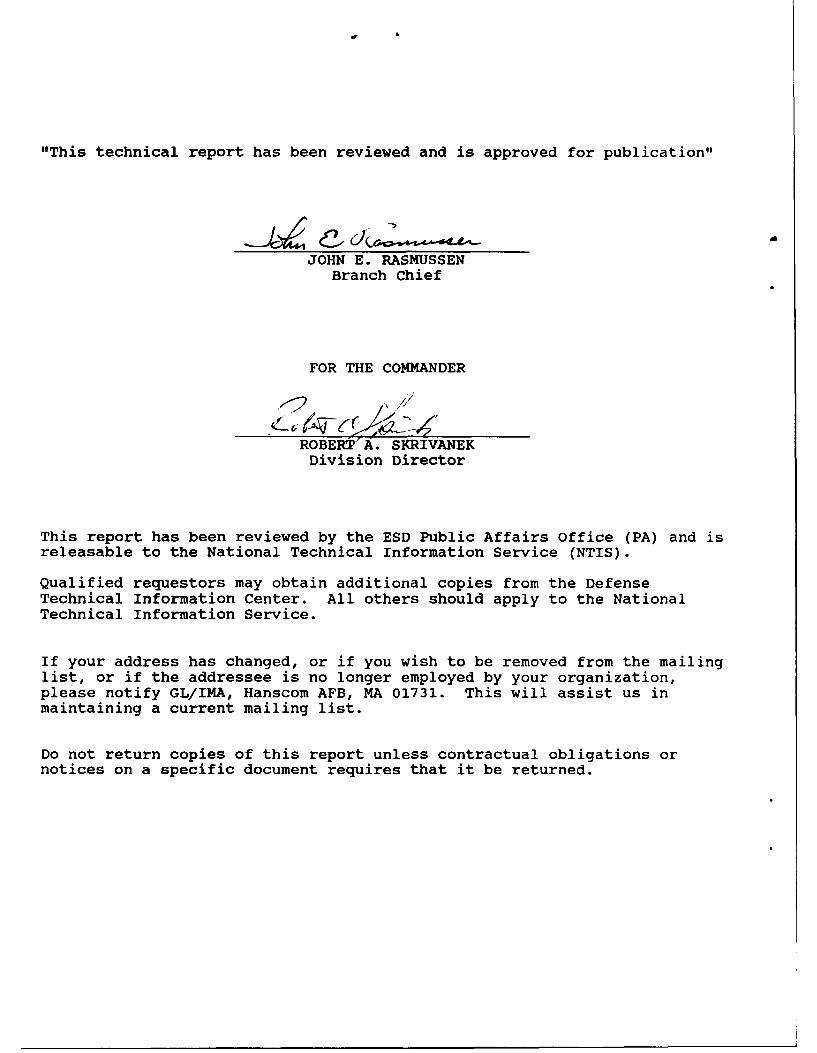
"This technical report has been reviewed and is approved for publication"
JOHN E. RASMUSSENBranch Chief
FOR THE COMMANDER
ROBERT' A. SKRIVANEKDivision Director
This report has been reviewed by the ESD Public Affairs Office (PA) and isreleasable to the National Technical Information Service (NTIS).
Qualified requestors may obtain additional copies from the DefenseTechnical Information Center. All others should apply to the NationalTechnical Information Service.
If your address has changed, or if you wish to be removed from the mailinglist, or if the addressee is no longer employed by your organization,please notify GL/IMA, Hanscom AFB, MA 01731. This will assist us inmaintaining a current mailing list.
Do not return copies of this report unless contractual obligations ornotices on a specific document requires that it be returned.

REPORT DOCUMENTATION PAGE Form ApprovedOMB No. 0704-0188
Public reporting for INi* collection of bnormation Is etineta4ed to average I hotw per response. blukgk Vie t eno for reviewing iructi esrchkng exising data e*owcee,gafirn and maintaking Owe data needed. and conresting end revewing the collecion of Informadon Sen oonvniret reWeding fiN* burden estimte or aty otth aspect of tiiecollection of inionnallon, Inciinig muggeetione fr redudng VIle burden. to WeM W Hadquwrters Services. Directorate for Itormaetion Operaione id Reporte. 1215 Jefferson
Davis Highway, Suite 1204, hkngton. VA 22202-4302. and to the Ofice of Management and Budget. Paperword Reduction Project (0704-018U). Washington. DC 20503.
1. AGENCY USE ONLY (Leave blank) 2. REPORT DATE 3. REPORT TYPE AND DATES COVERED
9 January 1991 Scientific Interim4. TITLE AND SUBTITLE 5. FUNDING NUMBERS
Investigation of Frequency Diversity Effects on Meteor Scatter PE 62101FLinks PR 4643
TA 106. AUTHOR(S) U 08
J.C. Ostergaard*, A.D. Bailey, S.W. IA*
7. PERFORMING ORGANIZATION NAME(S) AND ADDRESS(ES) &. PERFORMING ORGANIZATIONREPORT NUMBER
Phillips Laboratory (LID) PL-TR-91-2026Hanscom AFB, MA 01731-5000 ERP, No. 1078
9. SPONSORING/MONITORING AGENCY NAME(S) AND ADDRESS(ES) 10. SPONSORING/MONITORINGAGENCY REPORT NUMBER
11. SUPPLEMENTARY NOTES
a Center for Atmospheric Research, University of Lowell. Lowell, MA 01854
Prepared in cooperation with BMO/MGEC, Norton AFB, CA12a DISTRIBUTION/AVAILABILITY STATEMENT 12b. DISTRIBUTION CODE
Approved for public release, distribution unlimited.
13. ABSTRACT (Malxmum 200 words)
Results of measurements of frequency diversity effects on the USAF Geophysics Laboratory meteorscatter bed test in Greenland are reported. The Investigation included three field campaigns over twotest links to acquire meteor scatter signal data and a series of special purpose statistical analysisprocedures were developed. Diversity effects have been evaluated for frequency separations between0.3 and 4 MHz at path lengths of 1200 and 700 km. The morphology of the results are described.Dual close-spaced frequency diversity seems to offer a limited improvement of channel propertiesand no frequency separation dependence was found. The apparent lack of monotonic frequencydependence leaves questions as to physical causes of variability. It is speculated that day to daychanges in the neutral atmospheric density, high altitude winds and sporadic E-layer ionizationshould be investigated as candidate mechanisms.
14. SU&JECT TERMS IS. NUMBER OF PAGES
Meteor scatter Diversity 26Communication Frequency 16. PRICE CODE
Propagation17. SECURITY CLASSIFICATION 1. SECURITY CLASSIFICATION 10. SECURITY CLASSIFICATION 20. UMrTATION OF ABSTRACT
OF REPORT OF THIS PAGE OF ABST:ACTUnclassified Unclassified Unclassified SAR
NSN 7540-01-280-5600 Standard Form 296 (rev. 2-09)Pre" -.- ,d by ANSI Sid Z39-AS299-102

Accesion For
NTIS CRA&IDLIC TABU:I otcd ]
"Go '~t~cton... .......... .. ..............
Ey
D ti. b i----- o- -
,v la• ,ity Codes
Avail ar,dior t.
D t SpecialdI.
- 0-
Contents
1. INTRODUCTION 1
2. DIVERSITY IN METEOR SCATTER PROPAGATION 3
3. FREQUENCY DIVERSITY INSTRUMENTATION 8
4. THE MEASUREMENT CAMPAIGNS 8
5. DATA PROCESSING 9
6. THE STATISTICS 9
6.1 Duty Cycles 96.2 Durations 136.3 Duty Cycles Since the Start of Meteor Trail Signals 17
7. CONCLUSIONS 19
REFERENCES 21
.ii

Illustrations
1. Location of the Phillips Laboratory Meteor Scatter Test Bed in Greenland. 2
2. Meteor Trail Signals Recorded Simultaneously at 45.113 MHz and 45.413 MHz. 6
3. Meteor Trail Signals Recorded Simultaneously at 45.113 MHz and 46.113 MHz. 6
4. Examples of Meteor Trail Signals Recorded Simultaneously at 45.113 MHz and 7104.113 MHz.
5.a Duty Cycle Improvement as a Function of Signal Level With a Frequency Spacing 10of 0.3 MHz. MLB and MHB signify duty cycle for both frequencies/duty cycle forlow frequency and both frequencies/duty cycle for high frequency respectively.
5b. Duty Cycle for the Low. the High and Both Frequencies as a Function of Signal 10Level. 0.3 MHz frequency separation.
6a. Duty Cycle Improvement as a Function of Signal Level for the Various Frequency 12Separations at Thule.
6b. Duty Cycle Improvement as a Function of Signal Level for the Various Frequency 12Separations at Narsarsuaq.
7. Distributions of Signal Durations at Signal Levels of -126 dBm and -116 dBm 14for the Low, the High and Both Frequencies at Narsarsuaq.
8. Distributions of Signal Durations at Signal Levels of -126 dBm and - 116 dBm 15for the Low, the High and Both Frequencies at Thule.
9. Distributions of Signal Durations at Frequency Separations of 0.3. 0.7, 1.0. and 164.0 MHz at Narsarsuaq. The signal level was -116 dBm.
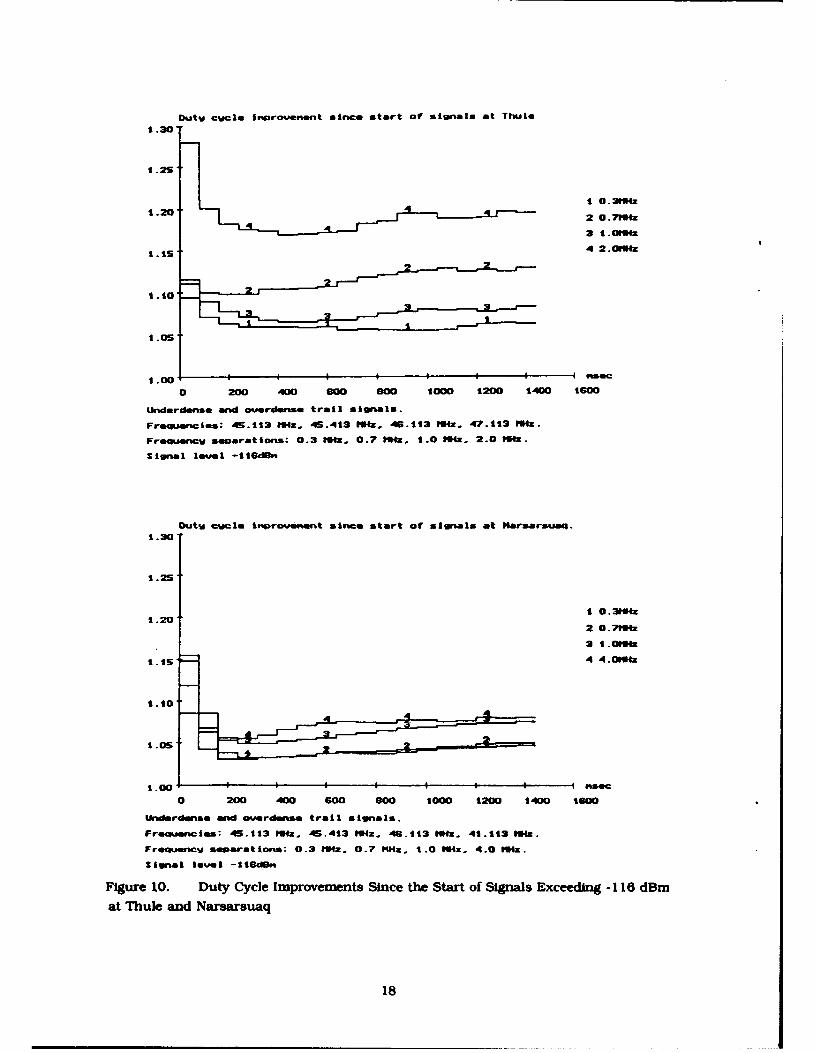
10. Duty Cycle Improvements Since the Start of Signals Exceeding - 116 dBm at Thule 18and Narsarsuaq for the Various Frequency Separations.
iv

Investigation of Frequency Diversity Effectson Meteor Scatter Links
1. INTRODUCTION
This report presents results of measurements of frequency diversity effects performed with
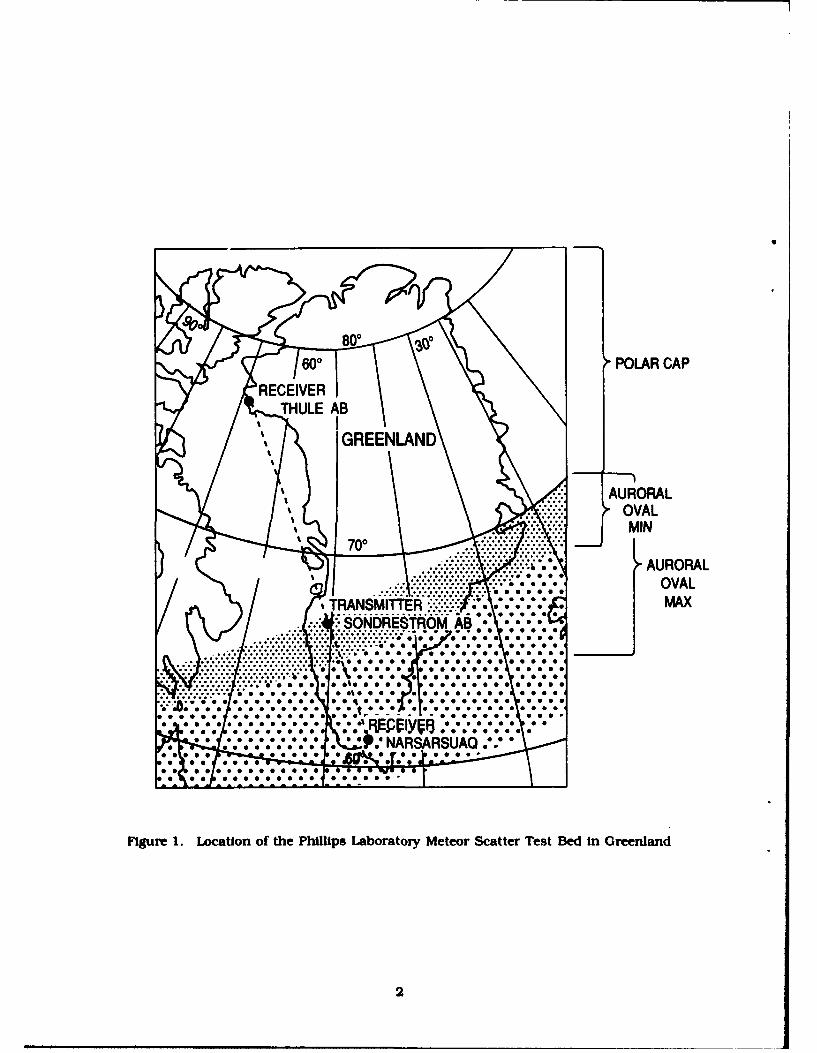
the USAF Phillips Laboratory's (formerly Geophysics Laboratory) meteor scatter test bed inGreenland. The test bed consists of two diagnostic links. One link situated between
Sondrestrom AB and Thule AB is 1210 km long, entirely within the polar cap, while the other.situated between Sondrestrom AB and Narsarsuaq, Is 690 km long. traversing the auroral
oval. The location of the test bed is shown in Figure 1. The links are intended for the study ofmeteor scatter propagation and communication at high latitudes. This study includes diurnal.
day-to-day, and seasonal variability of the channel properties as well as the effects ofionospheric disturbances. The links operate at 45. 65. 85, and 104 MHz. Five element,horizontally polarized Yagi antennas and 1 kW of transmitter power are used fortransmission. Crossed five-element Yagis in conjunction with dual channel, phase locked loopreceivers are used for reception of the horizontally and vertically polarized signalcomponents. In addition, measurements at 35 MHz are performed on the Thule link.Previously, measurements have been performed at 147 MHz on the Thule link as well. butthese were concluded after two years of successful data collection. The signals received by thetest bed receivers are digitized with a time resolution of 10 msec and stored for analysis at GL.A range of propagation and communication statistics are routinely produced. A detailed
Received for Publication 7 January 1991
1... ...
60POLAR CAP
AURORALOVAL
MIN
700 0
F~gre1. octio o th PilisLaoraor Meeo Sattr estBe inGrenAnd
2

description of the Greenland test bed and results obtained with it are found in References 1. 2,3, 4, 5, and 6.
The results in this report were obtained with the test bed during a series of specialinvestigations of fading and frequency diversity effects with a time resolution of 0.5 msec. Theinvestigations have included two field campaigns to acquire meteor scatter signal data, and aseries of special purpose statistical analyses of the data. The results of the fadingInvestigations are presented in Reference 7.
2. DIVERSITY IN METEOR SCATTER PROPAGATION
Fading radio channels that are sufficiently separated in space, frequency, time, orpolarization can be more or less statistically uncorrelated. This fact is utilized in diversity
reception techniques often used with fading radio circuits. The objective of diversitytechniques is to make use of several received signals that constitute closely similar copies of
some desired signal, to realize an improved signal level without resorting to highertransmitter powers or higher gain antennas. The increased reliability of a given radio circuitusing diversity is only realized statistically, as it relies on the statistical nature of the fadingprocesses of the propagation mechanism. To gain significant advantage, a sufficient degree ofstatistical independence of the fading must exist between the different signals in a diversitysystem. At least two channels are needed to obtain diversity gain, but higher order diversityutilizing more than two channels is commonly used with line-of-sight circuits.
A range of techniques exist for combining the signals from different channels in adiversity scheme. The simplest scheme consists of selecting the channel with the highest
I Ostergaard, J.C.. Bailey, A.D., and Bench, P.M. (1989) Experimental determination ofwaiting times for meteor trail returns of specified duration, February, March, June.September, December. PL-TR-91-2040, AFGL/UD, Hanscom AFB, MA 01731.2 Sowa. M.J., Quinn, J.M., Rasmussen, J.E., Kossey, PA., and Ostergaard, J.C. (1986) Astatistical analysis of polar meteor scatter propagation in the 45 - 104 MHz band.AGARD conf. on scattering in random media, CP.419, Rome.
3 Ostergaard, J.C., Rasmussen, J.E., Sowa, M.J., Quinn, J.M., and Kossey, P.A. (1985)Characteristics of high latitude meteor scatter propagation parameters over the 45 - 104 MHzband. AGARD conf. on propagation effects on military systems in the high latitude region.CP.382, Fairbanks. AK.
4 Ostergaard, J.C., Weitzen, JA., Kossey, P.A., Bailey, P.M., UA, S.W., Corlaty, A.J., andRasmussen, J.E. (1991) Effects of absorption on high latitude meteor scatter communicationsystems, Radio Science, Aug.
5 Weltzen, J.A. (1989) USAF/GL meteor scatter data analysis program. A user's guide.Geophysics Laboratory GL-TR-89-0154, ADA 214988.6 U, S.W. and Bailey, A.D. (1990) Antenna pattern description Geophysics Laboratory highlatitude meteor scatter test-bed. Geophysics Laboratory.
7 Weltzen, J.A., and Ostergaard, J.C., and LU, S.W. (1990) A high resolution statisticalcharacterization of fading on meteor communication channels. GL-TR-90-0329. Univ. ofLowell. Center for Atmospheric Research, Contract No. F19628-88-K-0004, ADA235548.
3

signal to noise ratio at any given moment. If the signals are coherent, as they are when space
diversity is used, combination may be performed at a suitable IF frequency, and post detection
combination can be used with both coherent and non-coherent signals. Frequency and space
diversity is traditionally used with microwave line-of-sight paths and troposcatter paths to
combat fading and increase the availability of such channels from in excess of 90 percent to
the 99.99 percent required for telephone trunk operation. The meteor scatter channel is
inherently a very low duty cycle channel with a typical availability of 1 percent to 5 percent.
The classical evaluation of diversity aimed at very high duty cycle channels that can be
described as continuous processes, are therefore of limited use for discussions of diversity in
meteor scatter propagation. The diversity improvement obtainable in meteor scatter
propagation must be evaluated on a trail by trail basis. Some, but not all, meteor scatter
signals fade within their short lifetime, and diversity Improvement can be obtained within the
lifetime of the individual meteor trail signals only if fades for different frequencies or
different antenna spacings are sufficiently uncorrelated.
Four types of diversity are of interest in meteor scatter propagation:
"* Space diversity with closely spaced receivers.
" Space diversity with widely spaced receivers." Frequency diversity with closely spaced frequencies.
"* Frequency diversity with widely spaced frequencies.
The existence of close spaced diversity improvement for fading meteor trail signals was
demonstrated and exploited with the COMET system in Europe, with four fold space diversity
and antennas spaced several wavelengths. It was suggested in the theory presented by the Janetgroup in Canada in the late 1950's. that fading on long lasting meteor scatter signals can be
due to warping of the trails by high altitude winds. This could produce more than one
scattering portion of a given trail for a pair of communication terminals. Thus, the fading
mechanism is essentially a multipath phenomenon. It follows from this that space diversity
improvement potential should mainly be expected at the end of long lasting trail signals.
whereas the start of the signals right after formation of the trails should exhibit less diversity
improvement potential, as high altitude winds have not yet been able to warp the trail. Long
lasting meteor trail signals often originate from overdense trails, and it is indeed known that
these signals fade more often than do the Usually shorter underdense trail signals .7.8
Meteor scatter links using space diversity with widely spaced receivers rely on the
directional properties of meteor scatter propagation. Meteor scatter links with sufficientspatial separation do not utilize exactly the same meteor trails for communication. Rather,
the number of meteor trails used by both links in common decrease as the separation
increases, until no trails are used by both links. In this situation the capacity of the system
will be doubled, and a large increase in throughput is feasible if more than two receivers can
be spaced enough to utilize essentially independent meteor trails. The necessary spacing islarge, in the order of tens of miles, and the receivers must have a high reliability
8 Welitzen. J.A. (1990) Study of the ground illumination foot print of meteor scatter
communication. IEEE Trans. Corn. TC-38:4. April.
4

communication network such as wire or line-of-sight links to merge the information from theindependent receivers. This diversity scheme is therefore not diversity In the classical sense,but rather a networking scheme. A detailed treatment of this approach can be found inReference 8.
Frequency diversity with closely spaced frequencies rely on the fading mechanism beingsensitive enough to produce uncorrelated fading at frequencies separated by a few percent.Again, diversity improvement potential can only be expected if the trail signals fade. Themeteor scatter process is very aspect sensitive, and the scattering portion of a given meteortrail can move very rapidly, like a glint from a spiderweb thread, even if the displacement ofthe trail itself is rather slow. Thus, it takes little trail warping by high altitude winds toproduce the multipath geometry leading to fading. Figure 2 shows meteor trail signals receivedsimultaneously at 45.1 and 45.4 MHz. The signals fade and differences in signal amplitude upto 30 dB are seen. This may seem surprising for a frequency spacing of only 0.7 percent. Thus,even very closely spaced frequencies can exhibit diversity improvement potential If the signalsfade. Intuitively, frequency diversity effects should be expected at the end of the lifetime oftrail signals where high altitude wind distortion will have had time to develop. But frequencydiversity effects might also occur at the formation of the trail if other, low level scatter signalsare already present in the channel. An example of meteor trail signals receivedsimultaneously at 45.1 and 46.1 MHz exhibiting diversity effects during trail formation as wellas decay are shown in Figure 3.
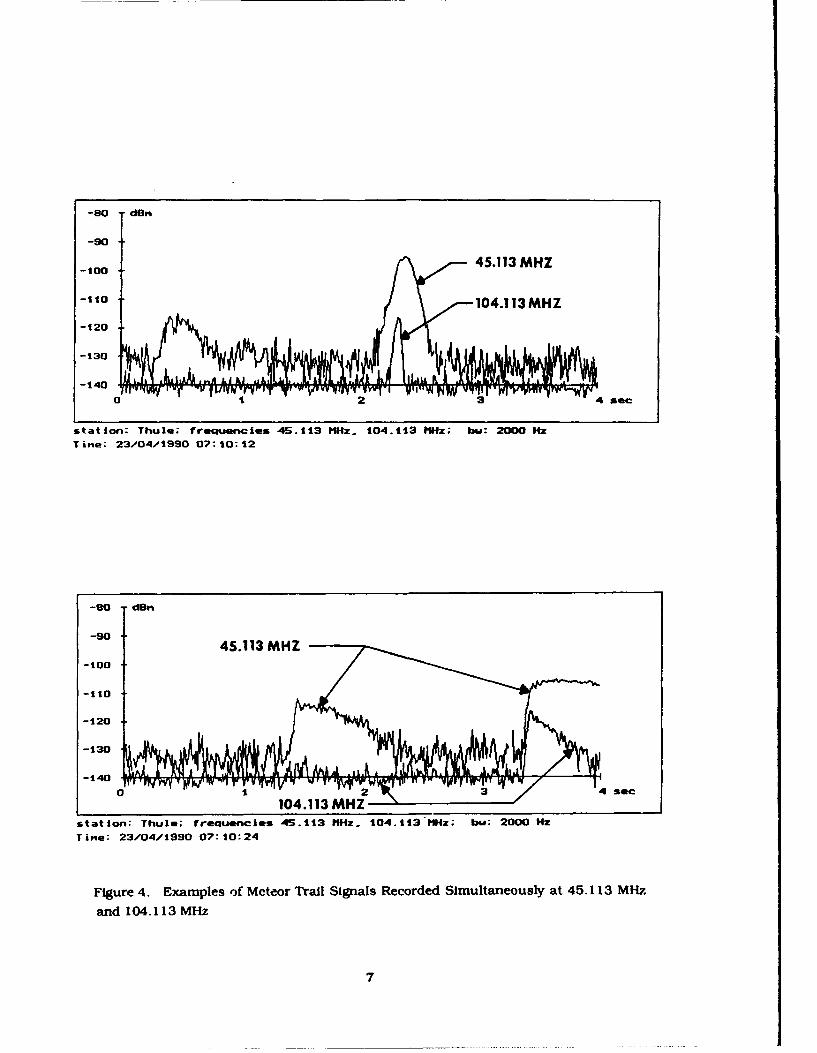
Frequency diversity with large frequency spacing, such as 20 to 60 MHz, does not offermuch potential for diversity improvement in the classical sense. The scattering efficiency andsignal endurance decrease rapidly with an increase in frequency. so many more signals areobserved on the lower frequency of a widely spaced pair. Figure 4 presents examples of meteortrail signals received simultaneously at 45.1 and 104.1 MHz. A variety of ratios of peakreceived power Is observed, and It Is seen that the signal decay time Is much faster at thehigher frequency. Still, a combination of low and high frequencies can be useful to mitigatepropagation effects other than frequency selective fading. These effects include elimination ofexcessive interference propagated through ionospheric reflections at the lower frequencies: andelimination of sporadlc-E layer propagation at the lower frequencies If privacy and thedirectional properties of meteor scatter propagation are of importance. Also, the higherfrequencies are less susceptible to ionospheric absorption, so frequency agility or high/lowfrequency diversity are of importance for survivable/enduring communication systems. Thistopic has been discussed in Reference 4.
5

-80 d On Horizontal
-100.
-130
-140
0 1 2 3 4 see
Figure 2. Meteor Trail Signals Recorded Simultaneously at 45.113 MHz and 45.413 MHz
-80 On Horizontal
-90
-100-
-110-
-120
-130
-1400
0 1 2 3 4 see
Figure 3. Meteor Trail Signals Recorded Simultaneously at 45.113 MHz and 46.113 MHz
6
-80 dBm
-90
-100 45.113 MHZ
-110 104.113 MHZ
-130
-140
r ls
station: Thule; f'requencies 45.113 M1Hz-. 104.113 11Hz; b..: 2000 Hz
T i me: 23.,04/1990 07:10:12
-80 -d~ui
-90 -4.1 H
-100
-110
-120
-130
station: Thule: frequencies 45A113 M1Hz. 104.113 M1Hz; bw: 2000 Hz
Time: 23/04/1990 07: 10:24
Figure 4. Examples of Meteor Trail Signals Recorded Simultaneously at 45.113 MR7z
and 104.113 MHz
7
3. FREQUENCY DIVERSITY INSTRUMENTATION
Two independent transmitters, one for each frequency, were used for the frequency
diversity measurements. They consisted of signal synthesizers driving 1 kW power amplifiers
and five-element horizontally polarized Yagi antennas. The transmitted signals were
continuous wave carriers without modulation. Separate antennas spaced one wavelength were
used for transmission. The antennas were mounted approximately 1.5 wavelengths above the
ground following computations of the radiation properties of the antennas including the
influence of the foreground. 6 Although the existence of space diversity effects in meteor scatter
propagation has been demonstrated, 9 very little, if any, space diversity effect exists with
antennas this closely spaced.
Separate. phase locked receivers were used for the measurements at the two frequencies.
The received signals were sampled at a rate of 2000 samples/sec. and the synchronous detector
bandwidth was 1000 Hz. The resulting noise bandwidth of the receivers was thus 2000 Hz. Both
receivers were fed from a single, horizontally polarized Yagi antenna through a power splitter.
The calibration of the receivers was performed at the antenna port, such that the power
splitter losses and the loading of the system by the receiver not being calibrated was included
in the calibrations. The received power levels given in this report thus represent the received
power at the antenna feed point.
4. THE MEASUREMENT CAMPAIGNS
Two measurement campaigns collected data for the investigation of fading and frequency
d'versity effects. The first campaign took place in April 1990 using the link between
Sondrestrom AB and Thule AB. Measurements were performed at four different frequency
spacings of 0.3. 0.7, 1.0. and 2.0 MHz in the 45 to 47 MHz frequency range. Each measurement
lasted between 36 and 48 hours. The measurements took place during a low level polar cap
absorption event. The 30 MHz zenith absorption as measured with the PL riometer at Thule
was 0.2 to 0.9 dB throughout the period. Very few sporadic-E layer signals were observed except
for a short period towards the end of the campaign. The signal sample collected is essentially a
clean meteor scatter signal sample. a rare occurrence at 45 MHz during years of high solar
activity.
The second campaign took place in July 1990 using the Sondrestrom AB to Narsarsuaq
link. Measurements were taken in the 41 to 46 MHz frequency range at four different
frequency spacings of 0.3, 0.7, 1.0 and 4.0 MHz. Each measurement lasted between 40 and 48
hours. However, the dominant mode of propagation during all but the hours between midnight
and 0900 UT was sporadic E-layer reflection. Often these signals saturated the receiver for
periods of up to 40 minutes. Such signal samples were discarded as they contained no fading or
frequency diversity information and required excessive data storage. Data from other
measurement periods, dominated by sporadic E-layer signals not saturating the receiver, were
q Bartholome. P.J. and Vogt. I.M. (1968) Comet - A new meteor-burst system incorporatingARQ and diversity reception. IEEE Trans. Corn. Com-16 (No.2) April.
8

kept. Thus, meteor signals were predominantly collected during a few night hours, but still a
substantial number of signals were captured. Approximately 800 Mbytes of raw data were
collected and stored on removable hard disks during the two campaigns.
5. DATA PROCESSING
The above discussion demonstrates the existence of frequency diversity effects, and in
viewing a large number of meteor trail signals it is easy to find many examples of signals with
rather spectacular frequency diversity effects. However, a large part of the total population of
received signals do not fade and have no diversity improvement potential. Thus, statistical
analysis is needed to quantify the frequency diversity improvement potential. Correlation
analysis often used to characterize diversity effects for quasistationary channels may not be
suited for analysis of meteor scatter propagation, which inherently exhibits a low duty cycle
(1-5 percent) and other strategies described below have been employed in this study.
The raw data collected in Thule and Narsarsuaq was classified into meteoric and sporadic
E-layer signal categories. Meteor trail signals have not been separated into underdense and
overdense classes for this investigation, as these signal types occur at random and cannot be
separated by a communication system. A data base program was then constructed and used to
determine duty cycle and duration distributions for the low and the high frequency, and for
both frequencies if the best frequency of operation was selected at any time. Also. duty cycle.
since the start of a meteor trail signal have been computed for the low and the high
frequencies individually, and for both frequencies if best frequency of operation was selected
at any given moment. The statistics are determined as a function of time and received signal
power. The time resolution is 10 msec for the duty cycle statistics. The distributions of
duration and duty cycle since start of a meteor signal are sorted in 20 bins of 80 msec each.
The received signal power has a resolution of 2 dB in the range from -90 dBm to - 140 dBm.
Selected statistics showing the findings for the meteor trail signals are presented and
discussed below.
6. THE STATISTICS
6.1 Duty cycles
The term: 'Duty cycle' denotes channel availability, that is, the percentage of the
total time the signal level exceeded a selected threshold. When the best frequency of operation
at any given moment Is selected, the duty cycle must be greater than or equal to the duty cycle
of the individual frequencies. Thus, the improvement in duty cycle can be computed as: Duty
cycle with frequency selection/duty cycle for individual frequency. This ratio can be computed
for both frequencies. The ratios can range from I if one of the frequencies dominates, to 2 ifthe two frequencies provide equal duty cycles without correlation. If one ratio is close to 1.
then the other ratio may also be close to I If both frequencies fade at the same time, but It may
9
-%40 -11W -190) -125 -120 -21S -110 -105 -t00 -95 -90Lir,*: Sandrestron - Thule.LO- frG~aWicW: 45.113 M~z.Nish freausinnow: 45.4t3 M~z.Frequencl saparation: 0.3 Mft.lkuftrdmima and Owerdmnaa ~neteor trail sI znals.
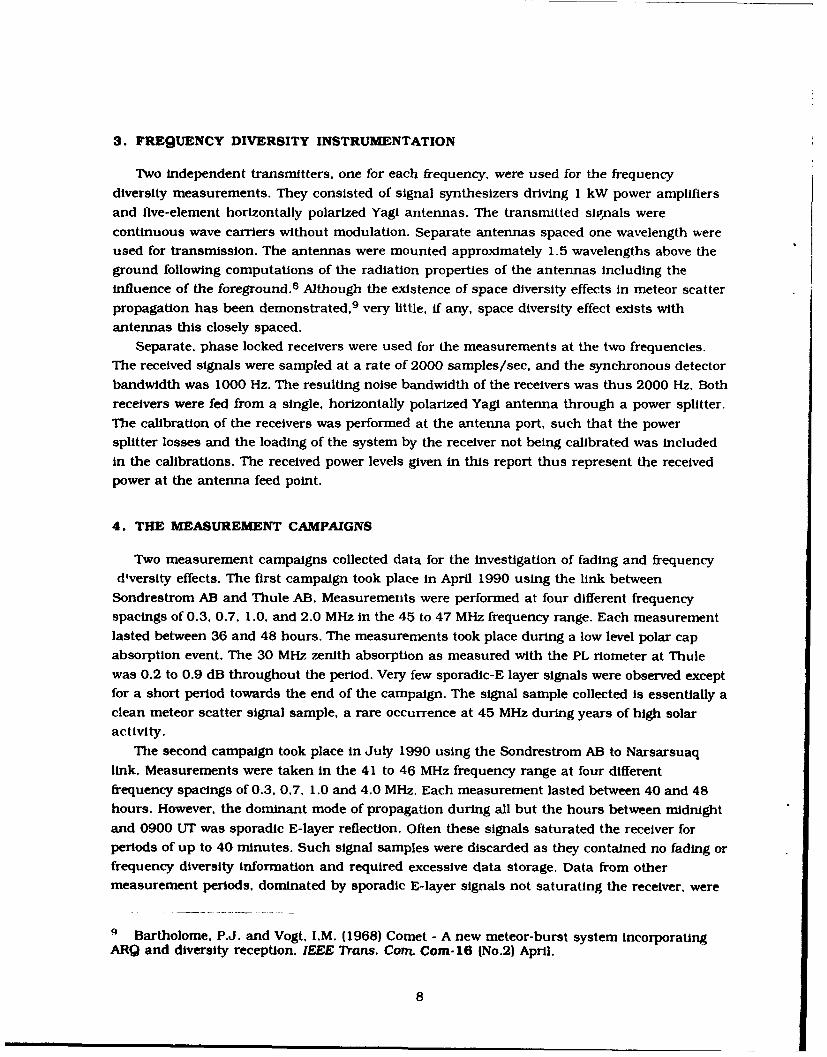
Figure 5a. Duty Cycle Improvement as a Function of Signal Level Withi a FrequencySpacing of 0.3 MHz. MLB and MHB signify duty cycle for both frequencies/duty cycle forlow frequency and both frequencies/duty cycle for high frequency respectively.
[Outwewle. ws. received signal level.0.10
0.03
SAW 1 LOW"t
0.063 UathN
0.10
attain a high value if one frequency for some reason is vastly superior to the other. That is notexpected to happen for closely spaced frequencies. It can still be envisioned, though, at veryhigh received power levels, where the number of signals is small, and a few, uncorrelated fadescan determine which frequency is superior even for a closely spaced frequency pair. Thedistribution of duty cycle for signals exceeding a received signal level at Thule is shown in
Figure 5, for a 0.3 MHz frequency separation. It is seen that the duty cycle is largest for the
combination of frequencies, and smallest for the high frequency. This fits the expectations
well. The difference between the high and the low frequency duty cycles vary somewhat with
frequency separation, but is in the order of a few percent of the duty cycle values. The ratios of
the duty cycle obtained with frequency selection and the duty cycles for the individual
frequencies are also presented in Figure 5. The diversity improvement obtainable by adding
the high frequency to the low frequency is in the order of 3 to 15 percent, whereas theimprovement obtainable by adding the low frequency to the high is on the order of 11 to 20
percent. The real diversity improvement is defined by the lower of the two ratios, as it is
meaningless to start with the inferior frequency and add the superior to obtain diversity
improvement.
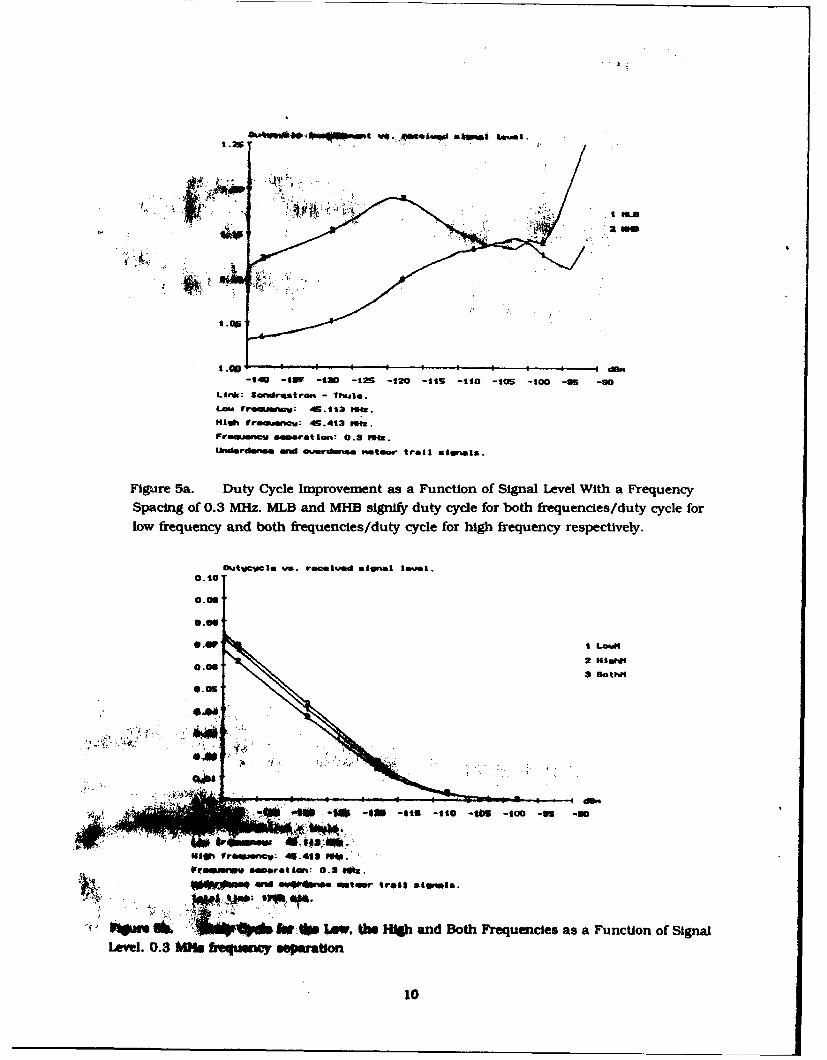
The diversity improvement computed as described above is presented in Figure 6 for both
Greenland links and for the frequency separations used during the campaigns. The diversityimprovement is found to range from 3 to 20 percent regardless of frequency separation for the
Thule link, and the improvement is not a monotonic function of frequency separation. The
smallest improvement is found for the smallest frequency separation, and the largestimprovement is found for the largest frequency separation at low signal levels. Theintermediate frequency separations show the inverse relationship, that is, more diversityimprovement was found at 0.7 MHz frequency separation than at 1.0 MHz frequencyseparation. At high signal levels, the largest diversity improvement is found for the smallestand the largest frequency separations, and the diversity improvement decreases toinsignificant values for the intermediate frequencies.
The diversity improvement found on the Narsarsuaq link shows a small, but consistentmonotonic frequency separation dependence at signal levels less than -110 dBm, and widefluctuations above this level. In contrast to the Thule link, the largest diversity improvementsshow at the intermediate frequency separations. These unexpected findings illustrate some ofthe difficulties in determining meteor scatter propagation properties. In Figure 5 the total timeof observation at a frequency separation of 0.3 MHz was 1700 minutes and during this timethousands of signals were acquired. However, at signal levels exceeding -110 dBm the dutycycle was found to be less than 0.5 percent or less than 8.5 minutes. This amount of data maynot be enough to enable the determination of the diversity improvement magnitude or trendwith suitable accuracy, when day-to-day variations in the meteor influx and upper atmosphereconditions cannot be accounted for. Thus, It takes very little data to demonstrate the existenceof some feature in meteor scatter propagation, but very long term measurements are requiredto quantify these features. It must be concluded that the statistics generated for signalsexceeding -110 dBm are most likely unreliable, and further discussions will be limited tosignal levels of -116 dBm and -126 dBm. It should, however, be noted that the magnitude of the
diversity improvement regardless of frequency separation did not exceed 15 to 20 percent for
11

Oiatucvch irwrouervan qws* received sisnal lowe..
1 .45
1.40
t.351 1 0.211Hz
2 0.7MfI. 30,
.*I
1.25'4 2.OHM
1.205
1. 00 -,b-140 -135 -130 -125 -120 -11S -110 -105 -100 -U9S -30
Link. Sondrestran - Thule.
Frequencies: 46.l12 P34=. 45.412 MMH. 46.112 11Hz. 47.213 11Hz.Fraeummmcu samoart ions: 0.3 M6z. 0.7 Wft. 1.0 #34=, 2.0 f1Hz.SWndardmw- and owerdanse .,ataer trail signal..
Figure 6a. Duty Cycle Improvement as a Function of Signal Level for the VariousFrequency Separations at Thule
Dutwowila inarosmnant us. reacwe1ud signal lausi.
t1.25 I 0.210k
2 0.7134=1.202 1.0131.
1.2s 4 4.010ft
1 .05
-140 -125 -120 -125 -120 -115 -110 -105 -100 -95 -00
Linki: SoAdrest ran - Narsarsuag.Fregusalces: 45.112 Mix.. 4S.412 11Hz. 46.212 taft. 41A112 11z.Frequencw soeprations: 0.2 raft. 0.7 M34z. t.0 #1Hz. 4 .0 #1Hz.Inierdonee and owardense trail stgnals.
Figure 6b. Duty Cycle Improvement as a Function of Signal Level for the VariousFrequency Separations at Narsarsuaq
12

signal levels less than -110 dBm. Thus, the measurements indicate that the long term average
capacity of a meteor scatter communication channel increases little if closely spaced dualfrequency selection diversity is used for reception.' 0
6.2 Durations
The term 'Signal duration' denotes a continuous period of time during which thereceived signal exceeds a given level. Meteor trail signals without fades will present onechannel opening at any given power level not exceeding the maximum level for the event.
Signals with fades will present a succession of openings separated by the fades. The
distribution of durations thus describe the statistical properties of the length of channelopenings. Diversity reception can increase the durations if the fades of the individual signalsin the diversity scheme are uncorrelated to some degree.
Normalized distributions of duration for a frequency separation of 0.7 MHz measured inNarsarsuaq in July 1990 are presented in Figure 7 for received power levels of - 126 and - 116
dBm respectively. The duration distribution covers the range 0 to 1.6 sec In bins of 80 mseceach. The high frequency has shorter durations than the low frequency for both power levelsshown, and the longest durations are, as expected, obtained when frequency selection is used.The largest differences are seen for the lowest power level, -126 dBm. However, very little if
any difference is seen for duratione less than 160 msec. This interval contains 70 to 80 percentof the total durations. Thus, little improvement seems possible for shorter durations, but some
diversity improvement may be obtained for the signals that exhibit long durations. These arenot necessarily the same as the long lasting signals, which often exhibit a number of fades
separating them into a string of signals with short durations.Normalized distributions of duration when frequency selection is used are presented in
Figures 8 and 9 for received power levels of -126 and -1 16 dBm as measured in Thule andNarsarsuaq at the various frequency separations. It could have been expected that the largerfrequency separations would exhibit longer durations than the smaller frequency separations.That is seen not to happen. Very little if any difference is seen at durations less than 160 msec.the interval that accounts for the majority of signals, and no consistent frequency dependenceis seen at longer durations. It may seem confusing that the normalization factors are larger
for the high power level, -116 dBm distributions than for the low level, -126 dBmdistributions. This is due to the fact that fading will create a number of separate channel
openings for a given high level signal. but the fading may not be deep enough to affect lowerpower levels. Thus, the number of channel openings, regardless of duration, will increase withreceived power level until a power level is reached where the decreasing arrival rate begins to
limit the number of channel openings.
10 Weltzen, J.A.. and Ostergaard, J.C. (1990) A statistical characterization of fading on meteorcommunication channels, GL-TR-90-0362. ADA235148.
13

Distribution of durations at Narsarsuaq.
IOE 0
I Lou
2 High
3 Both
2OCE-1
1 -2, I I I I " e
0 200 400 GOO 900 1000 t200 1400 1600
Underlmr.se and ovardense oseteor trail signals.
Frequencies: 45.4t3"IHz 46.21• Iz.
freiuimeW smearation: 0.7 11Hz.
Level -12Gdsm.
Nornalizing factors: Low: 16723 High: 19046 Both: ,4850
Distribution of durations at Harsarsusq.
I LOW
2 High
S Both
IGE-2
a 200 400 600 B00 1000 1200 1400 lo00
tsderdlsia and ovrardense nystaor trail signals.
Frequencies: 45.413514z 46.11311Hz.
Frecujec sdbparation: 0.7 1z.
Level -ItIdUm.
toroalizins factors: Low: 14213 High: 13247 Both: 13925
FIgure 7. Distributions of Signal Durations at Signal Levels of -126 dBm and -116 dBm
for the Low, the High, and Both Frequencies at Narsarsauq
14

Distribution of durations at ThuleW0E 0:
1 0.3
20.7
3 1.0
4 2.0
IOEE-2
0 200 400 600 800 1000 2200 1400 1600
Undardensa and Overdemnme ,'.teor trail signals
Frequencies: 45.t311Hz. 45.41311•f. 46.1131Hz. 47.1139Hz.
FraquencV separations: 0.-39Hz. 0.711Hz. 1.011Hz. 2.011Hz.
Level -t26dWn
Hornalizing factors: 0.3: 3277. 0.7: 403S. 2.0: 2697, 2.0: 3095
Distribution of durations at ThuleWOE 0
1 0.3
2 0.7
3 t.0
1OE-I 4 2.0
1OE-2I I I I I I "sac
0 200 400 600 800 1000 1200 1400 1900
Underdense and Ouvrdenae noteor trail signals
Fraeuencies: 45.11t39f. 4S.4131Hfz. 46.11311Hz. 47.11311Hz.
Freauanmcw separations: 0.311Hz. 0.711Hz. I.OIHz. 2.01Hz.
Lavel -1tiden
Nor,•laizin factors: 0.3: 9527 0.7: t17S1 1.0: 8127 2.0: 8210
Figure 8. Distributions of Signal Durations at Signal Levels of -126 dBm and -116 dBm
for the Low. the High. and Both Frequencies at Thule
15

Distribution of durations at Narsarsusq.IE Or.
1 0.3
2 0.7
3 1.0
IOE-24 4.0
IOE-1 V qA*c
0 200 400 SO0 am0 '1000 1200 1400 1600
Ihidirdemse and Owardensa ninteor trail sallna Is
Froquanoins: 96.1121Hz. 45.4123M~. 46.12t11Hz. 4t.I1311Hz.
Frnqumicoe saparat ions: 0.301Hz. 0.711Hz. I.Omitz. 4.GOlb.
LeAlUM -126d@".1Hbormalizing factors: 0.3: 9624 0.7: 14650 1.0: 17363 4.0: 9330
Distribution of durations at Harmarsuaq.IOE C
1 0.32 0.7a 1.0
IOE-1. 4 4.0
I10E-2 me na0 200 400 S00 600 1000 1200 1400 1600
thidsrdanse and overdwwnsa ,tsor trail signals.
Freepuuncies: 45.11311Hz. 45.41311Hz. 46.11311z. 41A.1311Hz.
F stouncu baparations.: 0.311Ha. 0.711Hz. 1.011Hz. 4.94z.
Lawai -216d~m.
"forwaliting factors: 0.3: 6554 0.7: 13925 1.0: 15057 4.0: 7494
Figure 9. DistrIbutions of Signal Durations at Frequency Separations of 0.3, 0.7.1 .0.and4.0 MHz at Narsarsuaq. The signal level was -116 dBin.
16

6.3 Duty Cycles Since the Start of Meteor Trail Signals
Visual examination of a large number of meteor trail signals gives the impressionthat some diversity effects are found at low signal levels during the formation of the meteortrails, and substantial diversity effects may be found for larger signal levels towards the end oflong signals, when high altitude winds may warp the trails. Most signals are short though. andthe diversity improvement as measured over the total population of trails as a function oftime since the start of the signals will show where in time during the existence of the trails themost important diversity improvement occur.
The duty cycle improvement since the start of meteor trail signals for frequencyseparations of 0.3, 0.7. 1.0. and 2.0 MHz measured at Thule in April 1990 and for frequencyseparations of 0.3, 0.7. 1.0. and 4.0 MHz measured at Narsarsuaq in July 1990 are presented inFigure 10 for a received power level of -116 dBm. The duration distributions cover the range 0to 1.6 sec in bins of 80 msec each.
Improvements are seen, especially within the first 200 msec since the beginning of thesignals. Minimum improvement is found at approximately 200 msec, and a slight overallincrease with time expresses the improvement for long-enduring signals. Observations of rawtrail signal data suggests substantial diversity improvements for long enduring signals. Suchsignals, however, only account for a small fraction of the total population of trail signals, andthe overall diversity improvement is determined to a large extent by the many shorter lastingsignals with few fades. This is not in conflict with the fact that the long lasting signalsprovide a major part of the connectivity, as the duty cycle improvement is a ratio. Thesubstantial improvements found at less than 200 msec after the start of signals merely signifythat the small fraction of the total connectivity found in this time interval can be improvedby using frequency diversity. Also, no monotonic frequency dependence of the duty cycleimprovement is found, although the largest improvements are found for the largest frequencyseparations.
The apparent overall lack of a frequency dependence of the diversity Improvement raisesspeculation as to the causes of the variability of the fading mechanism. If a substantial day-to-day variation is present, then a much smaller frequency dependence may easily be masked.Excluding experimental errors, a number of mechanisms can conceivably contribute to a day-to-day variation. These include variations of the neutral atmospheric density at meteor trailheights, varying high altitude winds and the presence of varying densities of sporadic E-layerionization. These could cause day-to-day variations of the diffusion of meteor trails as well asthe formation of glints by trail warping.
17
Dutyw cycle inprovenent since start of signals at Thule
1.30
t.2S
1 0. 31Hzt.20
2 0.7Mft
3 1. 01Hz
1.1S 4 2.0M1Hz
t.to,
1 .05-
0 200 400 600 900 1000 120O 1400 1600
Underdense and cuerdense trail signals.
Frequencies: 45.213 11Hz. 45.413 11Hz. 46.113 M1Hz. 47.t13 M1Hz.
Frequency separations: 0.3 1Hz.. 0.7 11Hz, t.0 M1Hz. 2.0 M1Hz.
Signal level -116dBa
Outd cyc-le in9roverent since start of signals at Narsarsu.aq.1.30
1.2S
1 0.311Hz1 .20
2 0.731Hz
3 t.01lHz
1.1S 4 4.011Hz
t .tO
t.oo .
0 200 400 600 Go0 t000 1200 1400 t1o0
Mulderdnvse and ouerdemns trail signals.
Frequencies: 45.A13 114z. 45.4t3 M1Hz. 46.t13 1Hz. 41.tt3 11Hz.
Freqecbthy separations: 0.3 "Hz. 0.7 MHz, t.0 11Hz. 4.0 "1Hz.
Signal level -It~dOn
Figure 10. Duty Cycle Improvements Since the Start of Signals Exceeding -116 dBm
at Thule and Narsarsuaq
18

7. CONCLUSIONS
The data presented in this report describe results of frequency diversity measurements
performed with the USAF Phillips Laboratory's Geophysics Directorate's meteor scatter test
bed in Greenland. Frequency diversity effects have been evaluated for frequency separations
between 0.3 and 4 MHz at two different paths of 1200 and 700 km. The morphology of the
results are described, but little effort has at this time been devoted to possible explanations of
some rather unexpected relationships.
The immediate impression when viewing a large number of meteor trail signals is that the
frequency diversity effects occur during formation of the trails, that is, during the first 50
msec at low signal levels, and especially during the final decay of long-enduring signals.
However, the statistics describing the diversity improvement as a function of the time since
the formation of trails show this not to be the case for the total population of trail signals.
The major improvements are found within the first few hundred milliseconds after the
formation of the trails. This most probably reflects the fact that the endurance of the majority
of the signals is less than 500 msec, and the rather spectacular examples of large differences
between high and low frequency signals found in the data sample for long-enduring signals are
not descriptive of the full sample. The magnitude of the duty cycle and duration improvements
range approximately from 5 to 20 percent.
No consistent frequency separation dependence of the diversity improvement was found in
our measurements of duty cycle and durations, and the apparent lack of a monotonic
frequency spacing dependence of the diversity improvement leaves questions as to the physical
causes of the variability of the signal endurance and the fading mechanisms. It is speculated
that day-to-day changes in the neutral atmospheric density, the high altitude winds, and the
sporadic E-layer ionization should be investigated as candidate mechanisms. It has again been
found that very long term measurements are needed to quantify meteor scatter propagationfeatures, whereas little data is usually required to prove the existence of such features. Also,
repeated measurements of frequency diversity effects should be performed simultaneously at
all frequency spacings to eliminate the day-to-day variability of the propagation mechanism.
19
References
1. Ostergaard. J.C., Bailey, A.D., and Bench, P.M. (1989) Experimental determination ofwaiting times for meteor trail returns of specified duration. February, March, June,September, December. PL-TR-91-2040, AFGL/UD Hanscom AFB. MA 01731.
2. Sowa, M.J., Quinn J.M., Rasmussen, J.E., Kossey. P.A., and Ostergaard, J.C. (1986) Astatistical analysis of polar meteor scatter propagation in the 45 - 104 MHz band.AGARD conf. on scattering in random media, CP.419, Rome.
3. Ostergaard, J.C.. Rasmussen, J.E., Sowa, M.J., Quinn, J.M., and Kossey, P.A. (1985)Characteristics of high latitude meteor scatter propagation parameters over the45 - 104 MHz band. AGARD conf. on propagation effects on military systems in thehigh latitude region. CP.382. Fairbanks , AK.
4. Ostergaard, J.C., Weitzen, J.A., Kossey, P.A., Bailey,A.D.. Bench,P.M., UIS.W., Coriaty.A.J., Rasmussen, J.E. (1991) Effects of absorption on high latitude meteor scattercommunication systems. Radio Science Aug.
5. Weitzen, J.A. (1989) USAF/GL meteor scatter data analysis program. A users guide.Geophysics Laboratory GL-TR-89-0154, ADA 214988.
6. U. S.W., and Bailey, A.D. (1990)Antenna pattern description Geophysics Laboratory highlatitude meteor scatter test-bed. Geophysics Laboratory.
7. Weltzen, J.A., Ostergaard. J.C.. and UA. S.W. (1990) A high resolution statisticalcharacterization of fading on meteor communication channels. GL-TR-90-0329.Univ. of Lowell, Center for Atmospheric Research, Contract No. F19628-88-K-0004.ADA235548.
8. Weitzen, J.A. (1990) Study of the ground illumination foot print of meteor scattercommunication. IEEE Trans Corn. TC-38:4. April.
9. Bartholome, P.J., and I.M. Vogt, (1968) Comet - A new meteor-burst system incorporatingARQ and diversity reception. IEEE Trans. Corn. Com-16 (No. 2.) April.
10. Weitzen, J.A., and Gstergaard, J.C. (1990) A statistical characterization of fading onmeteor communication channels. GL-TR-90-0362, ADA235148.
21