DSS Application (Ria Formosa Lagoon) · 2019. 6. 25. · (DITTY Project) EVK3-CT-2002-00084 DSS...
26
Development of an information technology tool for the management of Southern European lagoons under the influence of river-basin runoff (DITTY Project) EVK3-CT-2002-00084 DSS Application (Ria Formosa Lagoon) António Pereira, Pedro Duarte CEMAS - Centre for Modelling and Analysis of Environmental Systems University Fernando Pessoa, Porto, Portugal
Transcript of DSS Application (Ria Formosa Lagoon) · 2019. 6. 25. · (DITTY Project) EVK3-CT-2002-00084 DSS...

Development of an information technology tool for the management of Southern European lagoons under the
influence of river-basin runoff
(DITTY Project) EVK3-CT-2002-00084
DSS Application (Ria Formosa Lagoon)
António Pereira, Pedro Duarte
CEMAS - Centre for Modelling and Analysis of Environmental Systems
University Fernando Pessoa, Porto, Portugal

DSS Application – Ria Formosa Lagoon 2
June 2006
Contents Index Abstract............................................................................................................3 Introduction ......................................................................................................4 System Conceptualisation ...............................................................................5 EcoDynamo .....................................................................................................7 ECOLANG .....................................................................................................10 Development Agent .......................................................................................11 Scenarios definition........................................................................................17 DSS Integration..............................................................................................19 Ria Formosa results.......................................................................................22 Conclusions ...................................................................................................25 References ....................................................................................................26
Figures Index Figure 1 - Ria Formosa location.......................................................................4 Figure 2 - System Architecture (adapted from Pereira et al. 2004) ..................5 Figure 3 - Experimental system for the different pieces of software (Pereira et al. 2005)...........................................................................................................6 Figure 4 - EcoDynamo main window (Pereira & Duarte, 2005) .......................7 Figure 5 - 2D window of the development agent with farming areas visible...11 Figure 6 - Farming areas and benthic species visible ....................................12 Figure 7 - Zoom option in the first level..........................................................12 Figure 8 - Farming areas and benthic species zoomed .................................13 Figure 9 - Available commands from development agent ..............................13 Figure 10 - Classes Available from model .....................................................14 Figure 11 - Get Variables from TRiaF2DPhytoplankton class........................15 Figure 12 - Get variable value........................................................................15 Figure 13 - Set variable value ........................................................................16 Figure 14 - Get parameters from one class ...................................................16 Figure 15 - Select variables from model ........................................................18 Figure 16 - Selecting variables (second phase) .............................................18 Figure 17 - DSS module menus.....................................................................19 Figure 18 - Save scenario dialog ...................................................................19 Figure 19 - Pairwise Comparison Matrix ........................................................20 Figure 20 - Pairwise Comparison Matrix (another view) ................................21 Figure 21 - PCM File Example .......................................................................21 Figure 22 - Run DSS dialog ...........................................................................21 Figure 23 - Pairwise comparison matrices .....................................................23
Tables Index Table 1 – Some objects in EcoDynamo and corresponding variables .............8 Table 2 - Simulation results for different bivalves density ..............................22 Table 3 - Indicators' values with fixed price....................................................23 Table 4 - Indicators' values with elastic price .................................................23 Table 5 - AHP scores under fixed price .........................................................23 Table 6 - AHP scores under elastic price.......................................................23
DSS Application – Ria Formosa Lagoon 3
June 2006
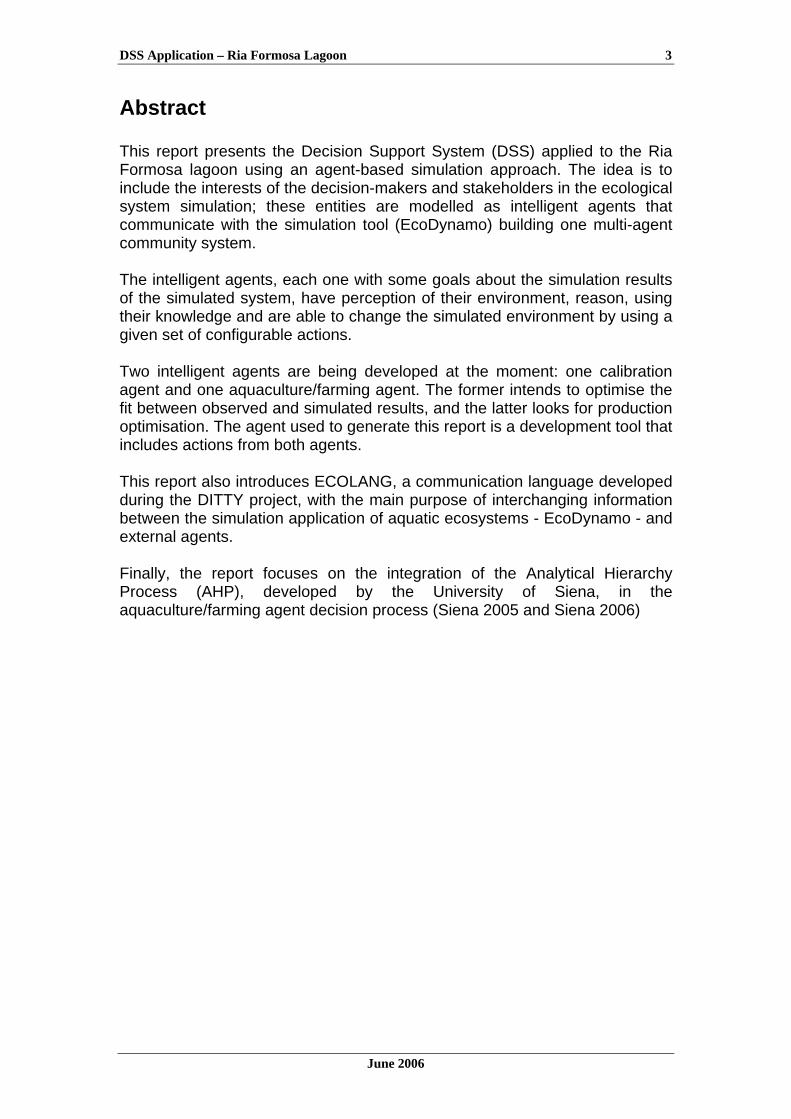
Abstract This report presents the Decision Support System (DSS) applied to the Ria Formosa lagoon using an agent-based simulation approach. The idea is to include the interests of the decision-makers and stakeholders in the ecological system simulation; these entities are modelled as intelligent agents that communicate with the simulation tool (EcoDynamo) building one multi-agent community system. The intelligent agents, each one with some goals about the simulation results of the simulated system, have perception of their environment, reason, using their knowledge and are able to change the simulated environment by using a given set of configurable actions. Two intelligent agents are being developed at the moment: one calibration agent and one aquaculture/farming agent. The former intends to optimise the fit between observed and simulated results, and the latter looks for production optimisation. The agent used to generate this report is a development tool that includes actions from both agents. This report also introduces ECOLANG, a communication language developed during the DITTY project, with the main purpose of interchanging information between the simulation application of aquatic ecosystems - EcoDynamo - and external agents. Finally, the report focuses on the integration of the Analytical Hierarchy Process (AHP), developed by the University of Siena, in the aquaculture/farming agent decision process (Siena 2005 and Siena 2006)

DSS Application – Ria Formosa Lagoon 4
June 2006
Introduction Ria Formosa Lagoon is located in the south region of Portugal, in the Algarve province (Figure 1). It is the largest Portuguese lagoon.
Figure 1 - Ria Formosa location
The management of this coastal ecosystem is a very complex task but it is an essential part for the sustainable development strategy. The ecosystem receives fresh water inputs, rich in organic and mineral nutrients derived from urban, agricultural and industrial effluents and domestic sewage and is subject to strong anthropogenic pressures due to tourism and shellfish/fish farming. Management decisions are very difficult to take and their consequences very hard to predict. Contradictory interests influence lagoon daily management. Especially important are the decisions made related to aquaculture / farming areas, because those decisions directly affect the life of hundreds of families that depend on that resource for living.

DSS Application – Ria Formosa Lagoon 5
June 2006
System Conceptualisation The architecture proposed here for the simulation system (Figure 2) is based on the “intelligent agents” approach (Norvig and Russel 2003; Weiss 1999; Wooldridge 2002). Each intelligent entity involved with the ecological system is included in the simulation system as an agent (Natural Park Directorate Agent, Shellfish Farmer Agent, Official Tourism Manager Agent, City Council Agent, Navy Command Agent …). Any action planned by the agents that influences the ecosystem is previously communicated to the model database; the simulation system runs and the results are presented to a decision support system to help managers’ decisions (Pereira et al. 2004).
Figure 2 - System Architecture (adapted from Pereira et al. 2004)
All the communications between entities are done using ECOLANG (Pereira et al. 2005) - a communication language developed especially for this project and acting as a common framework to exchange information between the software applications. Although each application has its own user interface, the user can access the different components’ information via the visualisation system, a common entry for the system.
DSS Application – Ria Formosa Lagoon 6
June 2006
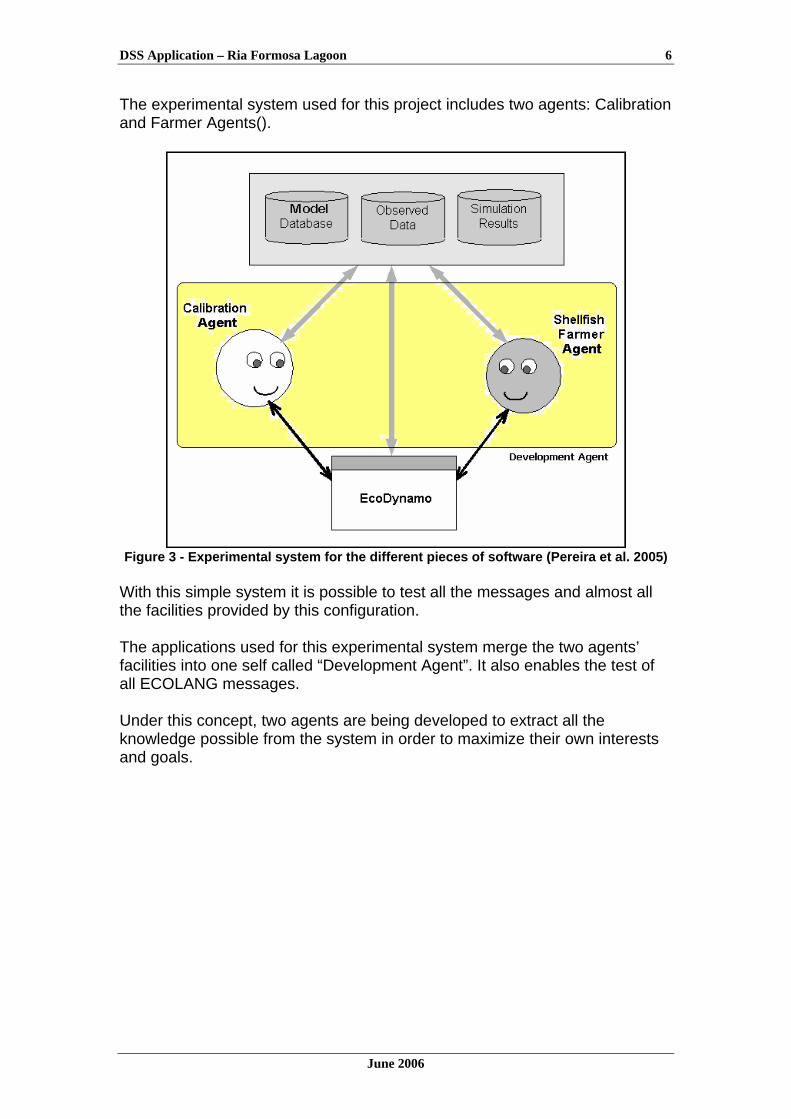
The experimental system used for this project includes two agents: Calibration and Farmer Agents().
Figure 3 - Experimental system for the different pieces of sof tware (Pereira et al. 2005)
With this simple system it is possible to test all the messages and almost all the facilities provided by this configuration. The applications used for this experimental system merge the two agents’ facilities into one self called “Development Agent”. It also enables the test of all ECOLANG messages. Under this concept, two agents are being developed to extract all the knowledge possible from the system in order to maximize their own interests and goals.
DSS Application – Ria Formosa Lagoon 7
June 2006
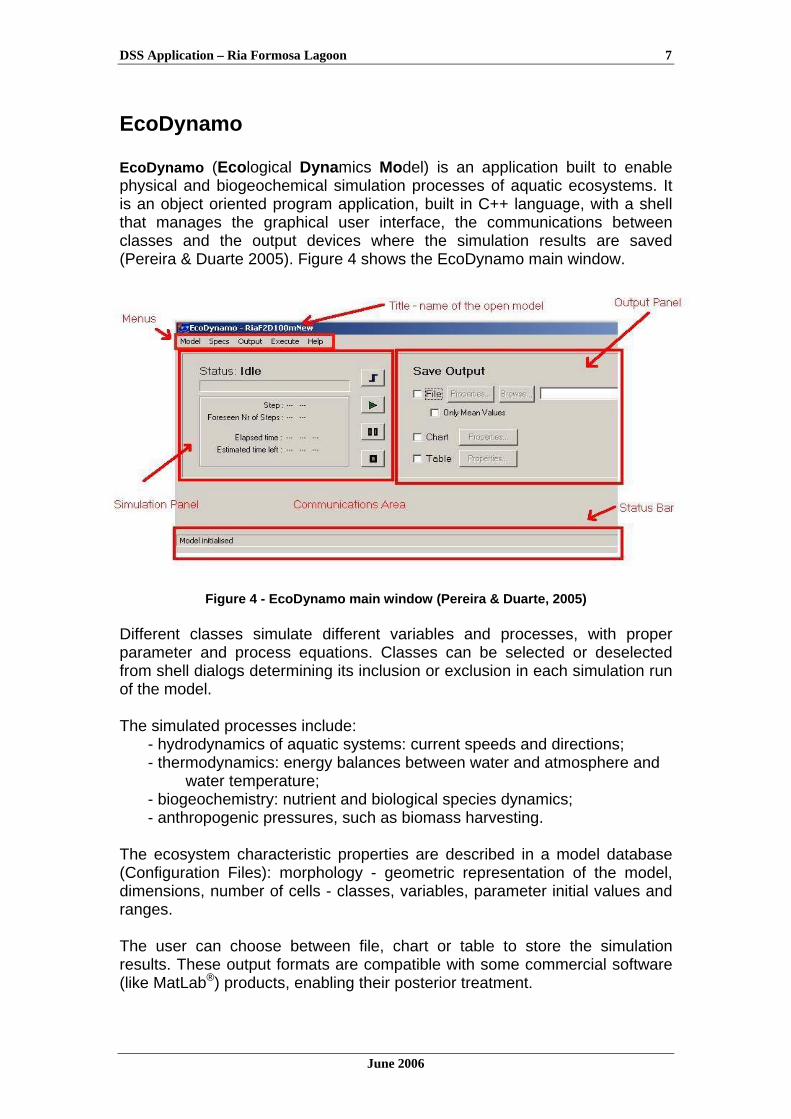
EcoDynamo EcoDynamo (Eco logical Dynamics Model) is an application built to enable physical and biogeochemical simulation processes of aquatic ecosystems. It is an object oriented program application, built in C++ language, with a shell that manages the graphical user interface, the communications between classes and the output devices where the simulation results are saved (Pereira & Duarte 2005). Figure 4 shows the EcoDynamo main window.
Figure 4 - EcoDynamo main window (Pereira & Duarte, 2005) Different classes simulate different variables and processes, with proper parameter and process equations. Classes can be selected or deselected from shell dialogs determining its inclusion or exclusion in each simulation run of the model. The simulated processes include:
- hydrodynamics of aquatic systems: current speeds and directions; - thermodynamics: energy balances between water and atmosphere and
water temperature; - biogeochemistry: nutrient and biological species dynamics; - anthropogenic pressures, such as biomass harvesting.
The ecosystem characteristic properties are described in a model database (Configuration Files): morphology - geometric representation of the model, dimensions, number of cells - classes, variables, parameter initial values and ranges. The user can choose between file, chart or table to store the simulation results. These output formats are compatible with some commercial software (like MatLab®) products, enabling their posterior treatment.

DSS Application – Ria Formosa Lagoon 8
June 2006
This application has an interface module (implementing the EcoDynamo Protocol) that enables communications with other programs for external control. For example, the simulation runs can be controlled by commands like start / stop / pause / restart / step simulation. Simulation activity can be followed with the help of log files, activated previously before each simulation run. Table 1 describes some objects integrated in EcoDynamo and the corresponding variables.
Object name Object outputs
Wind Wind speed Air temperature Air temperature Water temperature Radiative fluxes and balance between water
and atmosphere and water temperature Light intensity Total and photosynthetically active radiation
(PAR) Tide object Tidal height Hydrodynamic 2D Sea level, current speed and direction Sediment biogeochemistry
Inorganic nitrogen, phosphorus and oxygen, sediment adsorbed inorganic phosphorus, organic phosphorus, nitrogen and carbon
Dissolved substances Ammonia, nitrate and nitrite, inorganic phosphorus and oxygen
Suspended matter TPM, POM, POC, PON, POP and extinction coefficient
Phytoplankton Phytoplankton biomass, productivity and cell nutrient quotas
Enteromorpha sp.and Ulva sp.
Macroalgal biomass, productivity and cell nutrient quotas
Zostera noltii Macrophyte biomass and numbers, cell nutrient quotas and demographic fluxes
Clams (Ruditapes decussatus)
Clam size, biomass, density, filtration, feeding, assimilation and scope for growth
Table 1 – Some objects in EcoDynamo and corresponding variables Each class is contained in one DLL (Dynamic Link Library) that is included in the application package. This approach enables the inclusion of new classes without the need of rebuilding all the software. Some of the output options provided by EcoDynamo are implemented with MatLab® functions. EcoDynamo project has two DLLs to interface with MatLab®:
- one to integrate the graphics output feature; - one to implement the HDF file format.

DSS Application – Ria Formosa Lagoon 9
June 2006
EcoDynamo code is ready to be linked with Coherens (software built in Fortran code) in order to enable bidirectional code reutilisation. Experiments have been done with Sacca di Goro application. Some classes are completely ready to integrate (light object, for instance) and work is in progress to integrate the remaining (Pereira et al. submitted.

DSS Application – Ria Formosa Lagoon 10
June 2006
ECOLANG ECOLANG (Pereira et al. 2005) was developed with the purpose of exchange information between one simulation application of aquatic ecosystems and external agents. It is a high-level language capable of describing ecological systems in terms of regional characteristics, living agent’s perceptions and actions and is independent from any hardware or software platform. This language, along with a specific communication protocol, will enable the agents in the multi-agent system to understand each other in the ecological domain. Some pre-requisites were enounced before its development:
- It must be a high-level language understood by software agents and by humans;
- It must have simple syntax validation; - Its ontology must be oriented to aquatic systems; - It must be easily adaptable to new actors included in the system; - It must be independent from any hardware or software platform,
including operating system or programming language. ECOLANG messages describe regional characteristics of the ecological systems, translate agents’ actions and perceptions and enable different levels of communication:
- Execution: commands over the simulation model (run, stop, pause…);
- Configuration: select sub-domain, select classes, change variables and parameters’ initial values, choose which variables output, simulation period and time step before the model runs;
- Definitions: aggregate cells into named regions according to some common properties, define sub-domains based in the named regions;
- Statistics: collect results from simulation experiments, either online or offline operation, compare results with previous simulation experiments or observed data and advise the configuration module the expected actions to take;
- Events: spontaneous messages that agents generate to inform some important events or results.
A complete description of the language’s syntax and examples is done in Pereira et al. (2005).

DSS Application – Ria Formosa Lagoon 11
June 2006
Development Agent The Development Agent integrated in the experimental system (has some graphical facilities that are also available in the visualisation application. This is done to facilitate the work for the DSS development. With this agent the user can test all the messages defined in the EcoDynamo protocol following the ECOLANG specification. Its manipulation is very intuitive. The user must select the desired model enabling the “World View” window. The morphology of the modelled system and the configured bivalves and benthic species’ implantation areas are read. The user can see one 2D image of the model’s domain with the areas of bivalves and benthic species implantation represented in different colours (Figure 5 and Figure 6).
Figure 5 - 2D window of the development agent with farming areas visible

DSS Application – Ria Formosa Lagoon 12
June 2006
Figure 6 - Farming areas and benthic species visible
When the domain of the model is large (like Ria Formosa) it is difficult for the user to see clearly individual cells and to define particular regions. One zoom option was included in the application (Figure 7) for readability of the model domain. This option can be applied consecutively to produce a better visualization of the model domain.
Figure 7 - Zoom option in the first level
Zooming in several times can produce a display like the one showed in Figure 8. With this image the user can interact more accurately with the simulation model.

DSS Application – Ria Formosa Lagoon 13
June 2006
Figure 8 - Farming areas and benthic species zoomed
Application menus enable the user to act over EcoDynamo. Figure 9 shows some of the Development Agent menus and submenus.
Figure 9 - Available commands from development agent
For instance, if the user wants to know what the available classes are configured in the model, it selects the command “Classes Available” in the Specifications menu. Figure 10 shows one example of the command and the result window. The command is translated to the corresponding ECOLANG message and sent to the EcoDynamo application; EcoDynamo answers with the names of the available classes in another message; the result is shown in the “Classes Available” window.

DSS Application – Ria Formosa Lagoon 14
June 2006
Figure 10 - Classes Available from model
The user can also see the variables existent in each class: selecting the “Get Variables…” command from the Specifications menu; the result is shown in Figure 11. In this figure the Development Agent main window is also visible; in this window all the messages, sent and received, are logged. This enables the user to follow the messages exchanged between the applications. The user can see the variable values in each cell of the domain’s model. For example, Figure 12 shows the value of the variable “R. decussatus individual weight 1” from TRDecussatusIndivGrowthPhytoAndTPM class at the 27160th grid cell of the model. The value is displayed in the same window after the answer received from EcoDynamo. The user can also change the value of the variable in a particular cell of the domain sending the command “Set Variable Value…” from Specifications menu. Figure 13 shows the new value of previous variable sent to EcoDynamo. It is also possible to see the parameters involved in the equations of each class. The command “Parameters…” from Specifications menu is showed in Figure 14. Like with the variables, it is also possible to change the parameter values with the command “Set Parameters…” from Specifications menu. The actions over the parameters are typically done by the Calibration Agent

DSS Application – Ria Formosa Lagoon 15
June 2006
during the model calibration phase.
Figure 11 - Get Variables from TRiaF2DPhytoplankton class
Figure 12 - Get variable value

DSS Application – Ria Formosa Lagoon 16
June 2006
Figure 13 - Set variable value
Figure 14 - Get parameters from one class

DSS Application – Ria Formosa Lagoon 17
June 2006
Scenarios definition The main goal of the Aquaculture Agent is to maximize the profit from bivalve culture. It has specific regions to seed the bivalves and try to maximize its growth in order to harvest them as quickly as possible. The main actions done by the Aquaculture Agent include seed and harvest bivalves to and from specific regions, but it can also define new regions and inspect them regularly in order to obtain a perception of the bivalves’ growing rate (shell length of bivalves). As the bivalves’ growth rate is influenced by the environment (water quality) and the entire neighbourhood, the agent’s decision is not as simple as that. The agent can select variables related with the environment (all model simulated variables are available), collect their values (total or medium) and relate them with some kind of qualitative importance to rank the options assumed. Each change in the cultivation area of bivalves, or in their density distribution, will generate a new scenario. Each run of the model with different configuration of the site generates different results that must be saved to posterior analysis. Figure 15 shows one example of variables selection from one simulation run. The selection must be done before the simulation. After clicking on the “Select Variables” button, another window pops-up (Figure 16) to specify which of the variables will be time integrated. In this dialog, the user (in this case the aquaculture farmer) can choose from which regions the variable values will be collected.

DSS Application – Ria Formosa Lagoon 18
June 2006
Figure 15 - Select variables from model
Figure 16 - Selecting variables (second phase)

DSS Application – Ria Formosa Lagoon 19
June 2006
DSS Integration A new module was developed to integrate some kind of decision support in the development agent. This module is conceived to receive as inputs the results captured by the development agent in each scenario (that define the criteria used by the decision maker, in this case the aquaculture farmer), to define the relative importance between each criterion and to rank the several scenarios using the relative importance criteria comparison definition. Figure 17 shows the available menus for this module.
Figure 17 - DSS module menus After each simulation run, the user must save the results of the output selected variables as one scenario (configuration of the model) for later reference (command “Save Scenario…”, Figure 18).
Figure 18 - Save scenario dialog
One file can accumulate all the related scenarios – the file is alphanumeric
DSS Application – Ria Formosa Lagoon 20
June 2006
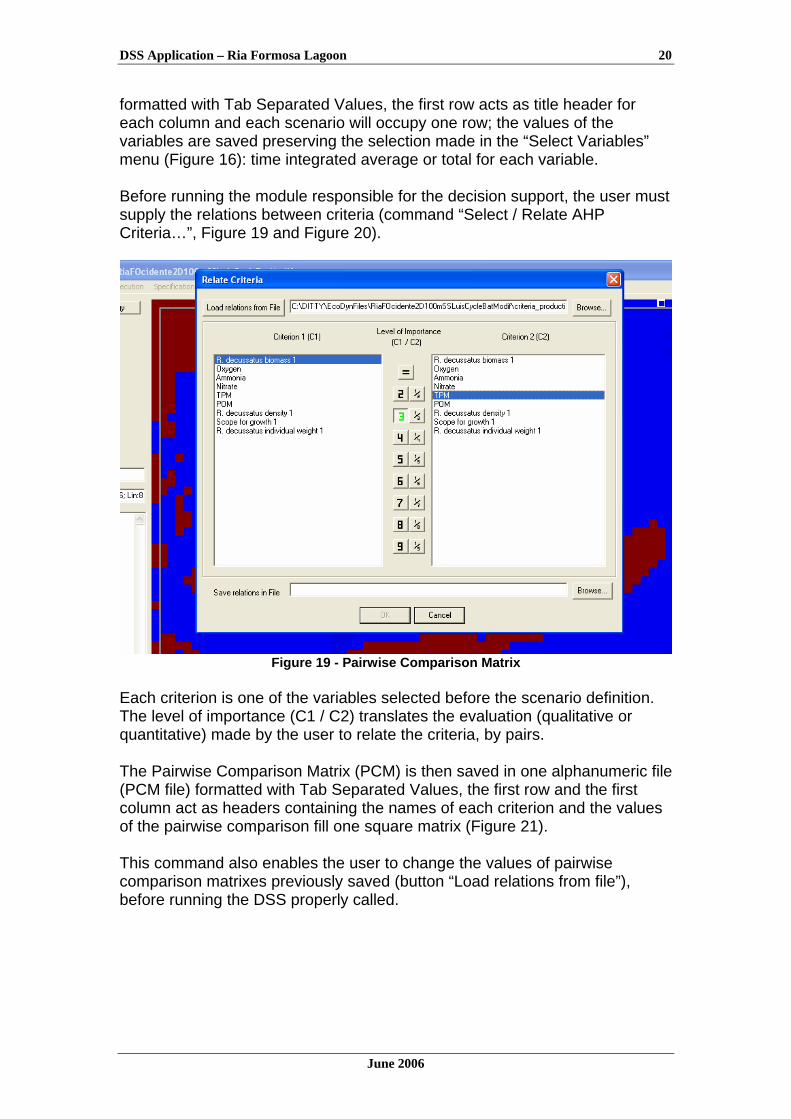
formatted with Tab Separated Values, the first row acts as title header for each column and each scenario will occupy one row; the values of the variables are saved preserving the selection made in the “Select Variables” menu (Figure 16): time integrated average or total for each variable. Before running the module responsible for the decision support, the user must supply the relations between criteria (command “Select / Relate AHP Criteria…”, Figure 19 and Figure 20).
Figure 19 - Pairwise Comparison Matrix
Each criterion is one of the variables selected before the scenario definition. The level of importance (C1 / C2) translates the evaluation (qualitative or quantitative) made by the user to relate the criteria, by pairs. The Pairwise Comparison Matrix (PCM) is then saved in one alphanumeric file (PCM file) formatted with Tab Separated Values, the first row and the first column act as headers containing the names of each criterion and the values of the pairwise comparison fill one square matrix (Figure 21). This command also enables the user to change the values of pairwise comparison matrixes previously saved (button “Load relations from file”), before running the DSS properly called.
DSS Application – Ria Formosa Lagoon 21
June 2006
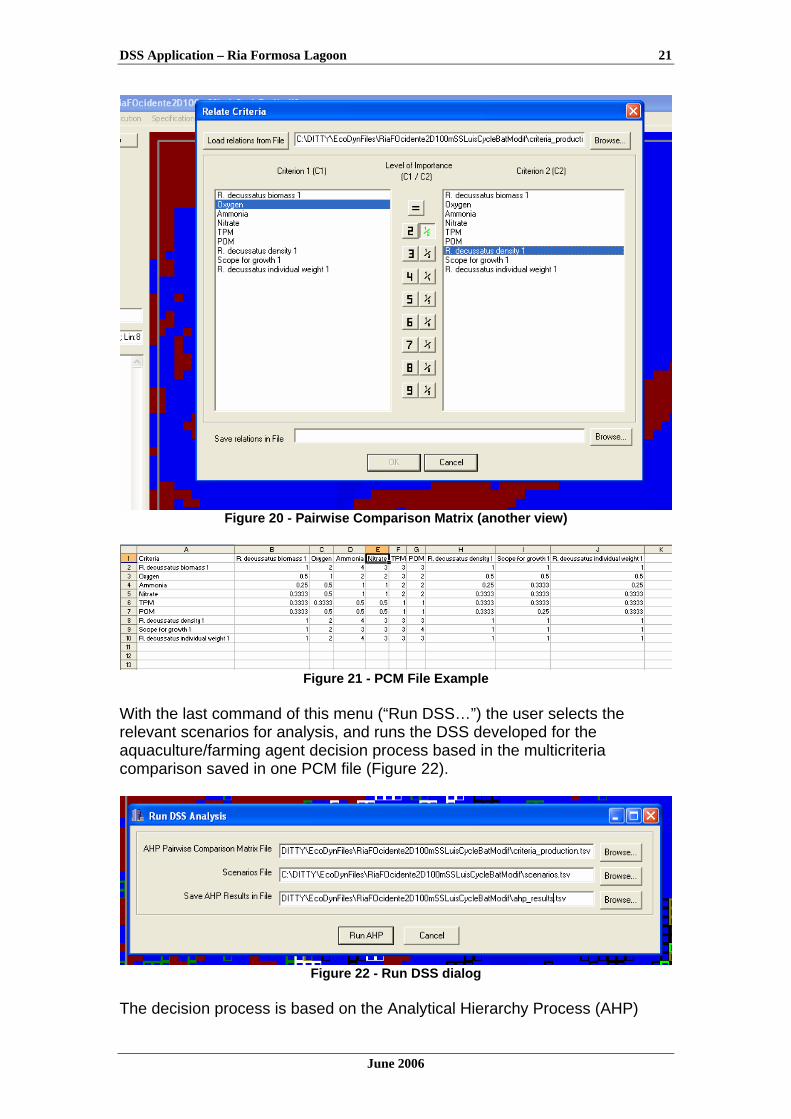
Figure 20 - Pairwise Comparison Matrix (another view)
Figure 21 - PCM File Example
With the last command of this menu (“Run DSS…”) the user selects the relevant scenarios for analysis, and runs the DSS developed for the aquaculture/farming agent decision process based in the multicriteria comparison saved in one PCM file (Figure 22).
Figure 22 - Run DSS dialog
The decision process is based on the Analytical Hierarchy Process (AHP)
DSS Application – Ria Formosa Lagoon 22
June 2006
approach, developed by the University of Siena for the DSS Application in the DITTY project (Siena 2006). One DLL is developed to interface the AHP MatLab® code with the Development Agent code. The result of the AHP analysis is saved in one file for posterior treatment, if the user wants to integrate the results with another application or presentation. The results can be seen graphically using the MatLab® application. One important feature of this method is that the relative importance between criteria and scenarios, used by AHP analysis, can be changed between model runs. The data from several scenarios can be collected and saved to be used in a later decision process.
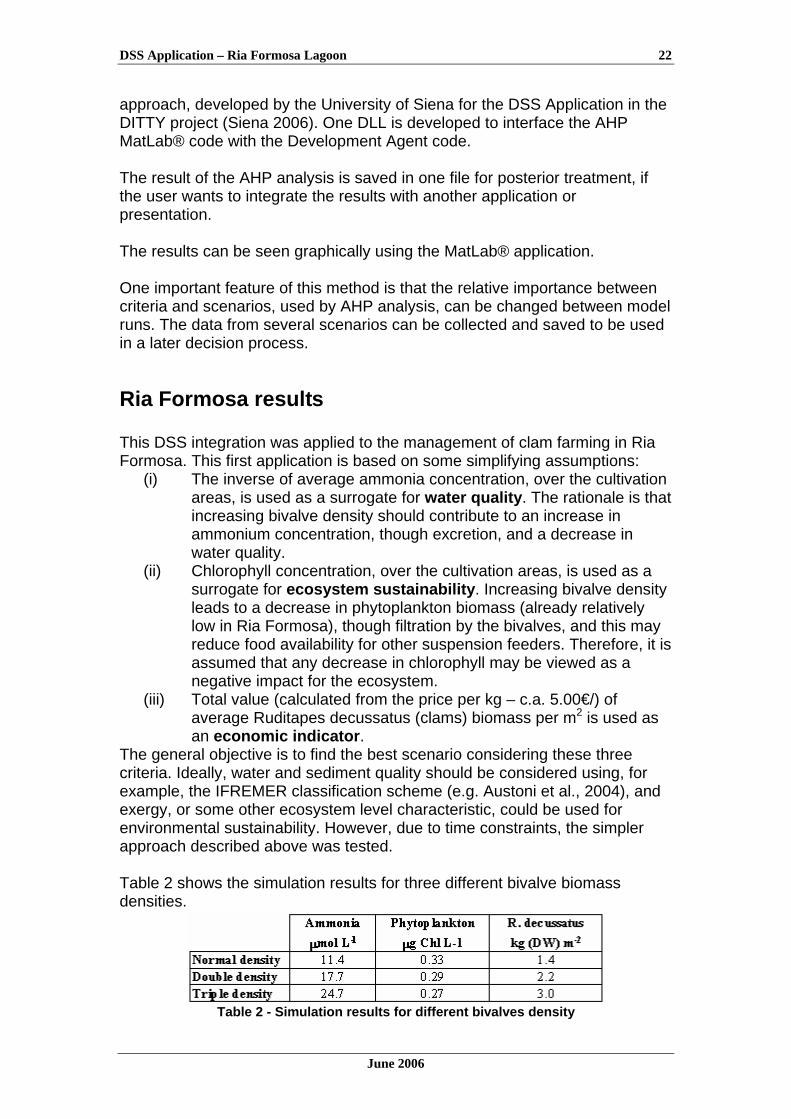
Ria Formosa results This DSS integration was applied to the management of clam farming in Ria Formosa. This first application is based on some simplifying assumptions:
(i) The inverse of average ammonia concentration, over the cultivation areas, is used as a surrogate for water quality . The rationale is that increasing bivalve density should contribute to an increase in ammonium concentration, though excretion, and a decrease in water quality.
(ii) Chlorophyll concentration, over the cultivation areas, is used as a surrogate for ecosystem sustainability . Increasing bivalve density leads to a decrease in phytoplankton biomass (already relatively low in Ria Formosa), though filtration by the bivalves, and this may reduce food availability for other suspension feeders. Therefore, it is assumed that any decrease in chlorophyll may be viewed as a negative impact for the ecosystem.
(iii) Total value (calculated from the price per kg – c.a. 5.00€/) of average Ruditapes decussatus (clams) biomass per m2 is used as an economic indicator .
The general objective is to find the best scenario considering these three criteria. Ideally, water and sediment quality should be considered using, for example, the IFREMER classification scheme (e.g. Austoni et al., 2004), and exergy, or some other ecosystem level characteristic, could be used for environmental sustainability. However, due to time constraints, the simpler approach described above was tested. Table 2 shows the simulation results for three different bivalve biomass densities.
Table 2 - Simulation results for different bivalves density

DSS Application – Ria Formosa Lagoon 23
June 2006
Different criteria weights are obtained from three different pairwise comparison matrices A1, A2 and A3:
Figure 23 - Pairwise comparison matrices
The first matrix, A1, considers that all the criteria have the same importance. The second one, A2, considers that the environmental criterion (inverse of ammonium concentration) is more important than the others. The third matrix, A3, considers that the economic criterion is the most important. With the simulation results, 6 scenarios were generated with one controllable variable: the bivalve price per kg was considered fixed in 5.00€/kg (scenarios 1 to 3) or elastic (Perna, com pers.) - decreasing 5% per kg if bivalve biomass exceeds 2kg m-2, and decreasing again 5% if bivalves biomass exceeds 3kg m-2 (scenarios 4 to 6). This last option is to reflect the market price variation when the offer increases. Scenarios 1 and 4 are the same. The values inserted for each indicator in each scenario can be seen in Table 3 and Table 4.
Table 3 - Indicators' values with fixed price
Table 4 - Indicators' values with elastic price
Running the AHP analysis combining scenarios results and pairwise comparison matrices, produces the results shown in Table 5 and Table 6:
Table 5 - AHP scores under fixed price
Table 6 - AHP scores under elastic price

DSS Application – Ria Formosa Lagoon 24
June 2006
If water quality or ecosystem sustainability criteria are considered more important, the normal density farming is the best option. Increasing bivalve density seems justifiable only when economic criterion is assumed as the most important. In this case, it is apparent that considering the price fixed or elastic does not change much the obtained results. This report shows one simple example of the methodology followed for the application of the AHP approach to the DSS process. More sophisticated analysis and scenarios will be generated in the future. Also, using ECOLANG, more functionalities will be added to the software described in this work. These will allow the user to simulate the effects of other management scenarios, such as changing bathymetry, opening/closing inlets, changing the location of Waste Water Treatment Plants, etc.

DSS Application – Ria Formosa Lagoon 25
June 2006
Conclusions This work throws three important conclusions:
1. Complex simulation ecosystems do not have to be incomprehensible to the end users. ECOLANG makes simulation experiments of complex ecosystems more comprehensible to the humans and facilitates the interface with other applications.
2. High-level messages facilitates the construction of agents that
intermediate the simulation and users: a. Changing the system configuration between simulation
experiments; b. Online supervision by the users.
3. The AHP integration in the agent is an easy way to help multicriteria
decision making adapted to each decision maker.

DSS Application – Ria Formosa Lagoon 26
June 2006
References Austoni, M., Viaroli, P., Giodani, G. & J.M. Zaldíval, 2004. Intercomparison among the test sites of the DITTY project using the IFREMER classification scheme for coastal lagoons. Institute for Environment and Sustainability, Island and Waters Unit. Available at http://www.dittyproject.org/Reports.asp. Naur, P. (ed.). 1960. Revised Report on the Algorithmic Language ALGOL 60, Communications of the ACM, Vol. 3 No.5 (May), 299-314. Norvig, P. & S.J. Russel. 2003. Artificial Intelligence: a modern approach, 2nd edition, Prentice Hall. Pereira, A.; Duarte, P. & L. P. Reis. 2004. Agent-Based Simulation of Ecological Models. In: H. Coelho and B. Espinasse (eds), Proceedings of the 5th Workshop on Agent-Based Simulation, pp. 135-140, Lisbon, Portugal, May. ISBN: 3-639150-31-1. Pereira, A. & P. Duarte. 2005. EcoDynamo – Ecological Dynamics Model Application, DITTY Technical Report, University Fernando Pessoa. Pereira, A.; Duarte, P. & L. P. Reis. 2005. ECOLANG – A Communication Language for Simulations of Complex Ecological Systems. In: Y. Merkuryev, R. Zobel and E. Kerckhoffs (eds), Proceedings of the 19th European Conference on Modelling and Simulation, pp.493-500, Riga, Latvia. ISBN: 1-84233-112-4. Pereira, A., Duarte, P. & A. Norro. submitted. Different modelling tools of aquatic ecosystems: A proposal for a unified approach. Ecological Informatics. Siena, 2005. The Analytic Hierarchy Process in the architecture of the DSS, DITTY Technical Report, Centre for Complex Systems Studies, University of Siena. Siena 2006. Development of a Decision Support System for the Management of Southern European Lagoons, DITTY WP8 Draft Report (2006.04.27), Centre for Complex Systems Studies, University of Siena Weiss, G. 1999. ed., Multi-Agent Systems: A Modern Approach to Distributed Artificial Intelligence, MIT Press. Wooldridge, M. 2002. An Introduction to Multi-Agent Systems, John Wiley & Sons, Ltd.