DSO150 Oscilloscope Kit & Manual - Z-100 LifeLine Home
21
DSO150 Oscilloscope Kit & Manual By Steven Vagts Z-100 LifeLine Insert, Issue #134 DSO150 Oscilloscope Kit Description: The DSO150 Oscilloscope is a bigger brother to the DSO138 discussed in an earlier issue. It is another inexpensive low-speed miniature oscilloscope with 2.4" color TFT LCD (320 x 240 dot matrix, 262K color display. Based on the ARM Cortex-M3 processor (STM32F103C8), it was developed by JYE Tech, China. It is sold as a full kit, or a partial kit with all the surface mounted parts already installed on the boards, leaving just a few parts remaining. Designed as a training oscilloscope, the DSO150 contains only the basic oscilloscope functions with no fancy features. Simplicity in structure and easiness in assembly and operation are the main highlights of the design. The MCU has already been pre- programmed and no reprogramming is required. Please note that a 9Vdc power supply must be purchased separately. DSO150 Oscilloscope Features: - ARM Cortex-M3 processor (STM32F103C8) - 2.4" color TFT LCD (320 x 240 dot matrix, 262K color display. - Analog bandwidth: 0 – 200KHz - Sampling rate: 1Msps max - Vertical Sensitivity: 5mV/Div to 20V/Div - Sensitivity error: < 5% - Vertical resolution: 12-bit - Horizontal Timebase: 10us/Div to 50s/Div using 1-2-5 progressive manner and automatic, regular, or one-shot triggering - Adjustable rising or falling edge trigger with observable previous trigger waveform (negative delay) - Waveform frozen (HOLD) function available – Save/recall waveform - Automatically calculate and report on-screen measurements including: Vmax, Vmin, Vavr, Vpp, Vrms, Frequency, Cycle, Pulse Width, & Duty Cycle. - Sampling Buffer Depth: 1024 points - Input Impedance: 1 Megohm - Maximum Input Voltage: 50Vpp (1:1 probe) 400Vpp with 10:1 probe (not provided) - Coupling Modes: DC / AC / GND - Built-in 1KHz/3.3V square wave test signal source - Power Supply: Requires 9Vdc AC/DC power supply or 9Vdc battery with cable adapter
Transcript of DSO150 Oscilloscope Kit & Manual - Z-100 LifeLine Home

DSO150 Oscilloscope Kit & Manual
By Steven Vagts
Z-100 LifeLine Insert, Issue #134
DSO150 Oscilloscope Kit Description:
The DSO150 Oscilloscope is a bigger brother to the DSO138 discussed in an earlierissue. It is another inexpensive low-speed miniature oscilloscope with 2.4" color TFTLCD (320 x 240 dot matrix, 262K color display. Based on the ARM Cortex-M3 processor(STM32F103C8), it was developed by JYE Tech, China. It is sold as a full kit, or apartial kit with all the surface mounted parts already installed on the boards,leaving just a few parts remaining.
Designed as a training oscilloscope, the DSO150 contains only the basic oscilloscopefunctions with no fancy features. Simplicity in structure and easiness in assembly andoperation are the main highlights of the design. The MCU has already been pre-programmed and no reprogramming is required.
Please note that a 9Vdc power supply must be purchased separately.
DSO150 Oscilloscope Features:
- ARM Cortex-M3 processor (STM32F103C8)- 2.4" color TFT LCD (320 x 240 dot matrix, 262K color display.- Analog bandwidth: 0 – 200KHz- Sampling rate: 1Msps max- Vertical Sensitivity: 5mV/Div to 20V/Div- Sensitivity error: < 5%- Vertical resolution: 12-bit- Horizontal Timebase: 10us/Div to 50s/Div
using 1-2-5 progressive manner andautomatic, regular, or one-shot triggering
- Adjustable rising or falling edge triggerwith observable previous trigger waveform (negative delay)
- Waveform frozen (HOLD) function available– Save/recall waveform- Automatically calculate and report on-screen measurements including: Vmax, Vmin, Vavr, Vpp, Vrms, Frequency, Cycle, Pulse Width, & Duty Cycle.- Sampling Buffer Depth: 1024 points- Input Impedance: 1 Megohm- Maximum Input Voltage:
50Vpp (1:1 probe)400Vpp with 10:1 probe (not provided)
- Coupling Modes: DC / AC / GND- Built-in 1KHz/3.3V square wave test signal source- Power Supply: Requires 9Vdc AC/DC power supply or
9Vdc battery with cable adapter

Specifications:
VerticalNumber of Channel: 1Analog Bandwidth: 0 - 200KHzSensitivity: 5mV/Division - 20V/DivisionResolution: 12 bitsInput Impedance: 1M ohm / 20pFMax Input Voltage: 50Vpk (1x probe)Coupling: DC, AC, GND
HorizontalMax Real-time Sampling Rate: 1MSa/secondTimebase: 10us/Div - 500s/DivRecord Length: 1024 points
TriggerTrigger Modes: Auto, Normal, and SingleTrigger Types: Rising/falling edgeTrigger Position: ½ of buffer size fixed
Display2.4" color TFT LCD with 320x240 resolution
Power SupplySupply Voltage: 9Vdc (8-10Vdc acceptable, Do NOT exceed 10Vdc)Supply Current: 120mA @ 9VdcBarrel Size: 2.1mm x 5.5mm x 9.5mm (Center tap must be positive)
PhysicalDimensions: 4" tall x 2.88" wide x 1.13" deep in case.Weight: 4 ounces (without PS)
Physical Layout of the Finished Oscilloscope:
Power:
The DSO150 Oscilloscope requires powerfrom an external 9Vdc AC/DC power supplyor 9V battery (NOT included). When thepower is ON, the current is about 120mA.
ATTENTION: DO NOT exceed +10Vdc!
The maximum allowed signal input voltageis 50Vpk (volts peak, but some on-linesources report this as peak to peak) withthe clip (1:1 or 1X) probe or 400Vpp witha (10:1 or 10X) probe (NOT included).

Assembly:
The JYE Tech Ltd DSO150 Oscilloscope can be purchased as a full kit, or with all thesurface mount parts already installed. Both come with an excellent set of detailedstep-by-step instructions with color photographs. As you can see from the firstpicture, the partial kit came with only a few remaining parts to install. Additionalinformation can be found at the JYE website: www.jyetech.com
Assembly will require the following tools:
Volt-Ohmmeter to check voltages and for shorts (recommended)Needle tip soldering iron or gunThin electronics solder w/flux coreFine solder wick or de-soldering braid for mistakesNeedle nose pliersDiagonal side cuttersPhillip’s head screwdriverSmall flat-head screwdriver9Vdc AC/DC power adapter or 9Vdc battery (with adapter)
Note: Before beginning construction, identify and compare the parts you received withthe enclosed parts list.
Assembly Procedures:
As I already mentioned, with thepartially assembled kit, there are only afew remaining parts to install. However,soldering skills are required. If you arenew to soldering, I recommend doing somepractice before hand. If you do make amistake and you create a solder bridge,use the solder wick to remove the excesssolder (see comments below).
If you purchase the full kit, experiencedsoldering skills are required. There arefull color photographs (though tiny) ofeach step as you proceed. I recommend yousearch on-line for DSO150 Oscilloscopeassembly procedures.
Just a few comments regarding fullassembly:
- Begin assembly by inspecting the bare board. Get a feel for the layout of theparts, part numbers, and what is going to go where. The component side is generallythe side with the silk screening, but there may be some silk screening and some partsthat may need to be installed on the solder side.
- I always suggest installing those components with the lowest vertical profilefirst. This keeps the circuit board flat and stable for as long as possible during theassembly and soldering process. So, start with any surface mounted components, whilethe board is empty and most stable.
- Using a spare cotton towel under the circuit board helps protect the worksurface and stabilize the board during soldering.
- Some of the solder pins on this board are a bit tight and close together. Ifyou accidently create a solder bridge across 2 or 3 pins, place solder wick over thesolder bridge and carefully heat the wick only until solder flows into the wick. Takecare not to overheat the component!

- While you can install components one at a time, I recommend installing alllike components at the same time. For example, insert all the resistors, bending theleads slightly to keep them in place. For a small project such as this, the groupmethod ensures that all of the resistors are of the correct value, used correctly andin their proper location, BEFORE soldering any in place! When you have found that allis as it should be, turn the board over and solder all the leads at once, clipping offthe excess leads as you go.
- When you install multi-pin components, such as a switch, an IC socket or aheader, always solder one lead at each end of the component first, check to insure thecomponent is fully inserted in the board (not tilted to one side or one end is notfully seated), before soldering the remaining pins. It is much easier to fix a tiltedsocket with only one pin to heat to reposition the socket.
- When all the parts have been installed, it is time to visually check your worklooking for solder bridges, parts with cold solder joints (meaning a poor connection,not having the same appearance of smooth solder flow as the other solder joints), oropen, unsoldered joints. If you have an ohmmeter, check joints near each other forshorts.
- Finally, clean the solder side of the board. Many use a special flux cleanerproduct to clean the soldering side. Personally, I check each solder connection anduse a fine screwdriver or dental pick to scrape away any flux residue, then use aslightly moistened toothbrush to remove the scraped residue. Do NOT get moisture onany sensitive parts, such as switches, sockets, the display circuitry, etc.
I purchased the partial kit and it included just a few parts left to install, but,surprisingly, this partially assembled board comes with the screen ready for awarranty check with power!
[ ] So, BEFORE mounting any parts to the main board, connect a 9Vdc power supply(center positive) to the power connector, J7, on the board to check the display.
You should see the scope boot up to a screen similar to the photo at left. D1 (LED)blinks twice. If the screen does NOT function as described above, please contact youragent for a replacement.

Main Board: Please review the photobefore installing the following parts!
[ ] Install the Test Signal Terminal(4.8 x 0.8mm) at J8. Note: Beforesoldering the terminal, bend the solder-ing tabs 90 degrees so the terminal willbe parallel to the plane of the board (asshown). When complete, this terminal willstick through the top bracket of thecase. Do NOT bend too far, nor attempt toadjust it after the initial bend, or thesoldering tab will snap off (the voice ofexperience)!
[ ] There is an OPTIONAL powerconnector for use with a battery.However, there is no space for aninternal battery, and once the case isconstructed, there is no access to thisconnector.
I installed mine, but unless you have plans to use this board with a battery, oranything else but the normal 9Vdc power jack, I recommend skipping this step.
[ ] Install the DPDT (Double Pole Double Throw) switch at SW5.
[ ] Install the 1x4 pin, 0.1" pitch Pin Header at J2.
[ ] Install the four Tact Switches (12x12x7mm) at SW1, SW2, SW3, and SW4.Note: Be careful. These are installed on the same side as the LCD screen!
[ ] Remove Resistor R30. R30 was used to bypass the uninstalled power switch, SW5,so the main board could be tested without additional circuitry. It must be removed forcorrect functioning of the power switch.
Note: To remove R30, let the soldering iron stay on one pad of the resistor untilsolder on the other pad melts, then remove the part by sliding it to the side off thepads.
[ ] Apply power again to test the powerswitch and tact buttons for their correctfunctions.
Analog Board Assembly: Note this board wasdifferent from that of the photographs in theinstructions. There were no resistors orceramic capacitors to install.
[ ] Install the 2P3T (Two Pole three positionThrow) switch at SW1.
[ ] Install the three 100uF, 16V electrolyticcapacitors at C8, C10, and C11.
Note: Electrolytic capacitors come with thelonger lead being positive and a negative bandon the case. Install each capacitor with thepositive lead in the hole marked with a + sign.
[ ] Install the 2x5 pin, 2mm pitch, PinHeader at J2.
[ ] Install the BNC Connector at J1.

Note: The thicker pins need to heat up longer to get good soldering results. I suggestusing a higher wattage soldering iron for these connections.
The analog board is complete.
Front Module Assembly: Please pay attention to the orientation of this small PCB!
[ ] Mount the Rotary Encoder to theside of the circuit board with the silkscreen box. The encoder will snap intothe large mounting holes, with thevarious leads going into their respectivesmall holes.
Do me a favor and before soldering, checkonce more that the encoder is on the sidewith the printed white box.
I was interrupted between doing the firstand the second and distracted by havingto straighten two of the pins of theencoder to fit in the holes... andinstalled it WRONG! I saw it while takingthe photograph! It was a real bear tounsolder it - and I ruined two thintraces while wrestling with it. I finallygot it, but had to solder two small wiresto replace the bad traces. See the laterphotographs!
So... Double check BEFORE soldering!
[ ] Fit the LCD to the front panel as shown on the left. It should just fit betweenthe plastic tabs and corners of the front panel.
[ ] Fold the main board back over the LCD panel (right photo), while keeping the LCDin place.

[ ] Mount the rotary encoder board tothe front plate with two flat headscrews. Make sure the 4 pins from theheader on the main board fit in the smallholes of the encoder board and that theboard is perfectly level with the mainboard, before soldering.
[ ] Solder the four pins of the header.
Congratulations! This completes theconstruction of the circuit boards.
We will check all the voltages, next.
Verify voltages on the analog board:[ ] Attach the analog board to themain board by mating J2 on the analogboard to J4 on the main board (seephoto).
[ ] Apply 9Vdc power to J7 (or J6) onthe main board.
[ ] Set the couple switch to the GNDposition.
[ ] Connect the voltmeter black lead toDGND, and with the red lead probe, checkthe voltages at the points shown in thenext photo.
Note: these voltages will vary withboard versions. The following list isfor the “E” version (PN: 109-15001-00E).
Voltage References:
Input: +9.30VdcV+ +8.35Vdc *AV+ 5.0Vdc +/-2%V- -7.87Vdc *AV- -5.0Vdc +/-2%V1 0VdcV2 0VdcV3 0VdcV4 ~1.65Vdc
Note: Those voltages with an asterisk(*) vary with the supplied inputvoltage.

Calibration:
Whether you assembled the kit, or bought one already assembled, you should check thecalibration. Because there is always some capacitance between the scope input and theground probe, the unit needs to be calibrated to achieve better measurement resultsfor high frequency signals. If you change probes or probe cables to something of adifferent length, this becomes particularly important. The calibration can be easilydone with the help of the built-in test signal at jumper J8.
The procedures are included with the kit, with color pictures, but in case you lostyour instructions, I have included them here with a few pictures of my own:
Calibration Procedures:
[ ] Connect the test leads to the BNCinput connector.
[ ] Connect the RED lead to the TestSignal terminal and leave the BLACK leadunconnected.
[ ] Set the coupling switch to AC orDC.
[ ] Apply power and boot. Hold downthe ADJ dial for 3 seconds to bring upthe Test Signal amplitude display at thelower-left corner of the display. PushADJ to set the amplitude to 0.1v (Witheach press, it will alternate between3.3v and 0.1v).
[ ] Perform the VPOS alignment bypressing the V/DIV button for threeseconds. This centers the waveform onthe vertical axis.
[ ] Set the sensitivity to 50mV andadjust the trigger level (the pinktriangle in the right margin of thescreen) so that the waveform becomesstable.
[ ] Turn the trimmer capacitor, C3,with a small flat-head screwdriver, sothat the waveform displays a sharp rightangle in the upper and lower left corners(leading edge) of the square wave. Toomuch and the waveform becomes a descend-ing ramp from the leading edge of thewaveform. Not enough and the leading edgewill appear rounded or an increasingramp. See the next photo.
Note: These trimmer capacitors rotatethrough 360 degrees, generally giving twolocations where the setting will becorrect; one while increasing capaci-tance, the other while decreasing capaci-tance. Either location will be fine.

Note: The two trim capacitors are hard to get to when the top cover is installed, butit can be done. The photo on the left shows the location of each, before mounting onthe other board and the cover is installed.
When adjusting the trimming capacitor (left photo) for each test (please refer to theright photo), we desire a right angle on the leading edge of the square wave, as closeto curve B as you can get. Too much capacitance and the waveform becomes a descendingramp (Curve C) from the leading edge of the waveform. Not enough and the leading edgewill become an increasing ramp (Curve A).
Referring to the photo on the left,perform the following:
[ ] Push the ADJ dial to set theamplitude to 3.3v (With each press, itwill alternate between 3.3v and 0.1v).
[ ] Change sensitivity to 1V.
[ ] Turn C5 so that a right-angleleading edge (Curve B) of the squarewave is obtained.
The adjustments are complete.

Final Assembly:
[ ] As shown above,screw the analog boardto the back cover withthe top bracketattached, using 4 flathead screws.
[ ] As shown to theleft, insert the testsignal terminalthrough the small slotin the top bracket andcombine the frontmodule and the backcover. Make sure thepin header and pinsocket mate properlybefore pressing thetwo modules together.
[
] As shown on the left, attach the bottom bracket before holding the two modulestogether.
[ ] As shown on the right, lower the front frame onto the assembly. Without forcing,press the frame and lower unit together, invert and screw the assembly together using4 long round-head screws.
[ ] Attach the knob cap, and the unit is complete, ready for use!
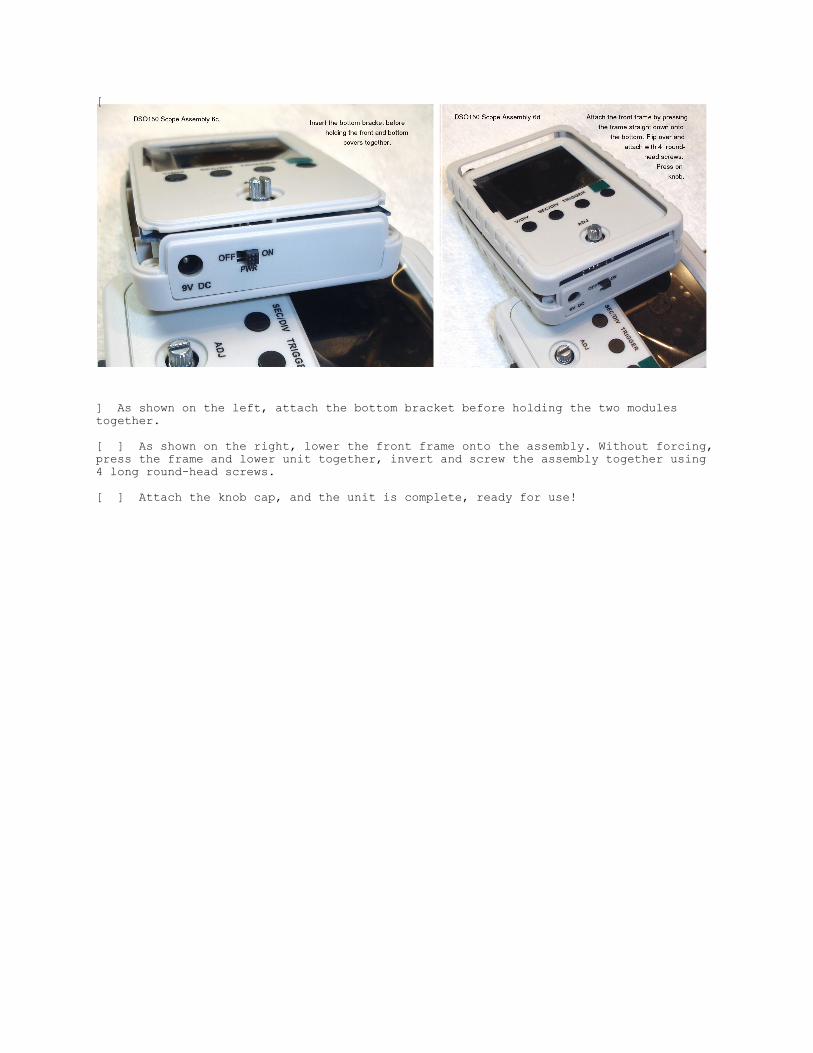
Connections and Controls:
DC Power: Connect a 8-10Vdc power source to the DC power jack on the bottom bracket.The connector is 5.5 x 2.1mm with a positive center. Do NOT exceed +10Vdc! There isalso a power ON/OFF switch.
Probe: Connect the oscilloscope probe to the Probe Connector. The probe is 1x and themaximum signal input voltage is 50Vpeak (100Vpp) with the clip probe.
Note: There appears to be some confusion in the on-line advertising and literaturethat shows the maximum is actually 50Vpp (Peak to Peak), so don’t take chances. If youcan purchase a 10x probe, the limit would be 10x higher, because it would reduce thesignal by a factor of 10.
Couple Switch: The couple switch sets the oscilloscope coupling to AC, DC, or GND(Ground). The coupling mode selected is displayed in yellow in the bottom left cornerof the screen.
Most oscilloscopes have two types of input coupling to handle both alternating currentand direct current signals. Typically, a switch lets you select AC or DC to suit yourmeasurement needs. When you set an input to DC coupling, the oscilloscope displaysboth AC and DC signals, although AC signals may pose a problem. By switching to ACcoupling, the scope displays only AC signals; this simplifies measuring certainelectronic circuits.
DC CouplingThe DC coupling setting provides a direct electrical path into the scope. It acceptsall types of signals, including unchanging DC voltages, time-varying DC voltages, AC,and combinations of AC and DC. In the last case, technicians call it an AC signal witha DC offset. Sometimes, DC offsets can be bothersome; the total signal voltage maypush the signal waveform past the top or bottom of the display, hiding the parts youwant to see. However, under most other circumstances, DC coupling is all you need.
AC CouplingWith AC coupling, the oscilloscope’s input has a capacitor in the signal path,removing the DC offset from any mixed signal and letting you see the AC part moreeasily. For example, some transistor and vacuum-tube amplifiers have a significant DCoffset; removing it with AC coupling helps you troubleshoot these circuits. Althoughit is most helpful with mixed signals, AC coupling also works with pure AC signals.Because it blocks DC, it is not suitable for DC signals.
GND CouplingWhen GND is selected, the scope input is isolated from the input signal and isconnected to ground (0V input), disabling the waveform.

[V/DIV]: The [V/DIV] button selects theSensitivity OR VPOS (Vertical PositionIndicator), alternately with each press.
When Sensitivity is active, a blue boxis placed around the yellow sensitivityvalue in the lower left corner of thescreen. The ADJ dial then adjusts theInput Sensitivity between 5mV/div to20V/div.
When VPOS is active, the yellow VerticalPosition Indicator (triangle in the leftmargin of the screen) turns blue. TheADJ dial will then set the desiredvertical position of the waveform.
Finally, the V/DIV button is used forVPOS Alignment, by pressing it for about3 seconds, while the Couple Switch isset to the GND position.
[SEC/DIV]: The [SEC/DIV] button selects the Timebase or HPOS (Horizontal PositionIndicator), alternately with each press. The Timebase is the horizontal axis of thedisplay. When selected, the Timebase value appears green in a blue box at the bottomof the screen. The ADJ dial then adjusts the Timebase value from the lowest of 10us(10 microseconds) to the highest of 500s (500 seconds).
The HPOS (Horizontal Position Indicator) is a thick green line on a thin green line atthe top center margin of the screen and represents the portion of the waveformdisplayed on the screen. When HPOS is active, the thick portion of the line turns blueand the ADJ dial can be used to move the waveform left or right to begin the waveformat any desired location at the left margin.
[TRIGGER]: The Trigger Button selects the trigger function. By repeatedly pushing theTrigger Button, the functions rotate through 3 settings: Trigger Mode, Trigger Level,and Trigger Slope (or Edge), each turning from a purple color to a blue color or bluebox when becoming active.
Trigger Mode: In Trigger Mode, the ADJ dial then selects [AUTO], [NORM], or[SING], which is displayed in pink at the bottom of the display. When selected, theTrigger Mode appears pink in a blue box.
Trigger Level: A Trigger Level Indicator (triangle marker) is displayed in pink atthe right margin of the screen at the appropriate voltage selected. When selected withthe Trigger Button, the Trigger Level Indicator (triangle marker) changes color frompink to blue. Then rotating the ADJ dial adjusts the voltage level for the desiredtrigger.
Trigger State: The Trigger State, shown in the upper right corner of the screen,can have three functional states - Holdoff, Waiting, or Trigged. These states changeautomatically depending upon the trigger value and signal.
Holdoff: Displayed in purple, Trigger is disabled until a portion of samplebuffer prior to a trigger point is filled with raw data.
Waiting: Displayed in green, Waiting means the Trigger is waiting for avalid signal slope. The desired trigger level may be outside the voltage range of thepresent signal waveform.

Trigged: Displayed in yellow, Trigged means a valid signal slope has beendetected and registered.
Trigger Slope: A Trigger Slope symbol (rising or falling) is displayed in thelower right corner of the display to show the desired slope of the trigger. Whenselected with the Trigger Button, the Trigger Slope symbol appears pink in a blue boxand can be changed from rising or falling by rotating the ADJ dial.
Rolling Mode: When Timebase is set to 50ms or slower and Trigger Mode is set toAUTO, the scope will automatically switch to Rolling Mode, where waveform shifts fromright to left constantly. The trigger is disabled under this mode.
[OK]: The [OK] button freezes waveform refresh, entering the HOLD state. The HOLDstate allows you to freeze the waveform while you study it and take voltage readings.In the upper left corner of the screen, the Oscilloscope State will show ‘HOLD’ inorange. Pressing [OK] again will unfreeze the waveform and the Oscilloscope State willchange to ‘Running’ in green.
[ADJ]: This is a special switch with numerous press and rotating functions. Asmentioned earlier, by rotating the dial it can adjust whichever of the above functionsare active.
Short Press: A short press will toggle ‘Fast Adjustment’ Mode ON or OFF forVPOS, HPOS, and Trigger Level. A ‘>>’ sign appearing at the top of the screenindicates ‘Fast Adjustment’ is ON.
[ADJ] + [SEC/DIV]: If pressed simultaneously with the [SEC/DIV] button, it willsave a waveform.
[ADJ] + [TRIGGER]: If pressed simultaneously with the [TRIGGER] button, it willrecall a saved waveform.
More Available Functions:
Function: Operations:VPOS Alignment Set Couple Switch to GND position. Hold down [V/DIV] button
for about 3 seconds.
Measurements Hold down [OK] button for about 3 seconds.ON / OFF This will turn ON or OFF on-screen display of measurements
including: Vmax, Vmin, Vavr, Vpp, Vrms, Frequency, Cycle,Pulse Width, and Duty Cycle.
Save Waveform Press [ADJ] + [SEC/DIV] buttons simultaneously.The currently displayed waveform is saved to EEPROM.The existing data in EEPROM will be over-written.
Recall Waveform Press [ADJ] + [TRIGGER] buttons simultaneously.The recalled waveform is always displayed in HOLD state.
Default Restore Hold down [SEC/DIV] + [TRIGGER] buttons simultaneouslyFor about 3 seconds.
Center HPOS Hold down [SEC/DIV] button for about 3 seconds.This will display the data at the center of the capturebuffer.
Center Trigger Hold down [TRIGGER] button for about 3 seconds.Level This will set the trigger level to the medium value of
Signal amplitude.
Fast Adjustment Short press of [ADJ] toggles ‘Fast adjustment’ modeON / OFF for VPOS, HPOS, and Trigger Level.A ‘>>’ sign is displayed at the top of the screen toIndicate ‘Fast Adjustment’ is ON.

Oscilloscope Waveform Display:
The waveform displayed on an oscilloscope is nothing more than a waveform’s voltageover time. Hence the vertical axis shows the voltage, and the horizontal axisrepresents time, generally in fractions of a second.
And while most waveforms are repetitive, such as the sine wave AC (AlternatingCurrent) electrical power in our homes, the audio signal in our radios, or the picturesignal in our televisions, some can be single-shot, like closing a switch in acircuit. All these signals are nothing more than a voltage value over time. However,unless there is some way to tell an oscilloscope where or when to begin displaying arepetitive waveform, the resulting signal is a very confusing changing measure of thatvoltage over time.
The oscilloscope’s display is divided into dotted boxes, with each dotted boxrepresenting a division. The vertical scale represents the signal strength in volts;the horizontal scale represents time in seconds (more on this later). So, each boxvertically represents the signal strength selected; 1 volt per division (dotted box)if 1V is selected. Each division is further divided by 5 marks and each dot represents0.2 of a division on the display. Always select a scale that allows the signalwaveform to fill as much of the display as possible, without losing the top or thebottom of the waveform. This improves the accuracy of signal measurements.
Example: If the upper trace covers 2 divisions and 2 marks above that, on the 1Vscale, the signal would be 2.4 volts peak; and if the signal were symmetric (the sameabove and below the center, brighter horizontal line on the display), the signal wouldbe 4.8 volts peak to peak.
The Timebase is the horizontal axis of the display. As we discussed regarding thevoltage (Vertical) axis, each division is the dotted square, but horizontally, andeach dot represents 0.2 of the next division. The ADJ dial then adjusts the Timebasevalue from the lowest of 10us to the highest of 500s, in the following values:
10us, 20us, 50us,0.1ms, 0.2ms, 0.5ms,1ms, 2ms, 5ms,10ms, 20ms, 50ms,0.1s, 0.2s, 0.5s,1s, 2s, 5s,10s, 20s, 50s,100s, 200s, 500s
Where us is microseconds, ms is milliseconds, and s is seconds.
Oscilloscope Triggering
An oscilloscope’s trigger function is important to synchronizing the horizontal sweepof the oscilloscope to a chosen point of the signal. The trigger control enables usersto stabilize repetitive waveforms as well as capture single-shot waveforms. Byrepeatedly displaying the similar portion of the input signal, the trigger makesrepetitive waveforms look static, giving us the opportunity to make measurements andanalyze the signal.
Most oscilloscopes offer various types of trigger functions. Edge triggering is themost basic and common type, but threshold triggering is another type of triggerfunction that is offered both in analog and digital oscilloscopes.
Digital oscilloscopes, however, feature numerous specialized trigger settings nototherwise available in analog oscilloscopes. These triggers enable users to easilydetect, for instance, a pulse that is narrower than usual. Such a condition would notbe detected by a voltage threshold trigger only. Advance trigger controls allow usersto isolate events of interest to enhance the oscilloscope’s record length and samplerate. Some oscilloscopes even offer advanced triggering capabilities with highlyselective control, allowing users to trigger on pulses defined by time (such asglitch, pulse width, setup-and-hold, slew rate and time-out), defined by amplitude(runt pulses), and delineated by pattern or logic state (such as logic triggering).

Other advanced triggering functions may include serial pattern triggering, A&Btriggering, trigger correction, search and mark triggering, parallel bus triggeringand serial triggering on specific standard signals.
However, our simple oscilloscope can only trigger on a voltage that we set. Triggersare events that indicate signal voltage crossing a set level (i.e. trigger level)along a specified direction (i.e. trigger slope, rising or falling).
Our oscilloscope has three trigger modes:
Auto Mode - In Auto Mode our oscilloscope will perform display refresh no matterif triggers happen or not. When triggers are detected, the waveform display will bedisplayed with reference to trigger points. Otherwise, it will display whateverwaveform is detected, but at random reference points.
Normal Mode - In Normal Mode our oscilloscope will only perform display refreshwhen there are triggers. If no triggers happen, the waveform display will stayunchanged.
Single Mode - In Single Mode our oscilloscope works in Normal Mode, except thatthe display will enter HOLD state after a trigger has been detected and the waveformdisplay has been updated.
Note: Both Normal and Single Modes are useful for capturing sparse or singlewaveforms.
Note: The Trigger State, shown in the upper right corner of the screen, can have threefunctional states - Holdoff, Waiting, or Trigged. These states change automaticallydepending upon the trigger value and signal.
Holdoff: Displayed in purple, Trigger is disabled until a portion of samplebuffer prior to a trigger point is filled with raw data.
Waiting: Displayed in green, Waiting means the Trigger is waiting for avalid signal slope. The desired trigger level may be outside the voltage range of thepresent signal waveform.
Trigged: Displayed in yellow, Trigged means a valid signal slope has beendetected and registered.
Trigger Slope: A Trigger Slope symbol (rising or falling) is displayed in thelower right corner of the display to show the desired slope of the trigger. Whenselected with the Trigger Button, the Trigger Slope symbol appears pink in a blue boxand can be changed from rising or falling by rotating the ADJ dial.
Note: The trigger slope and trigger level are best set for the fastest rising orfalling part of the curve. For example, if a waveform had a fast rise time, but areally slow fall time, such as a ramp curve, it would be best to set a positive slopefor the trigger and set the trigger level for the fastest rising or falling point inthe curve because it would be a more accurate trigger.
Rolling Mode: When Timebase is set to 50ms or slower and Trigger Mode is set toAUTO, the scope will automatically switch to Rolling Mode, where waveform shifts fromright to left constantly. The trigger is disabled under this mode.

DSO150 Oscilloscope Operation:
Operation is simple, but will take some getting used to. Plug in the 5-9Vdc powersupply and turn the device ON with the ON/OFF switch on the bottom bracket. The DSO150Oscilloscope will display two screens while powering up (booting):
And then display whatever waveform that may be present at the Oscilloscope’s Input.There is no critical function that must be done first, so let us discuss the buttonson the front panel from the left:
[V/DIV]: The [V/DIV] button selects theSensitivity adjustment OR VPOS (VerticalPosition), alternately. When sensitivityis active, a blue box is placed aroundthe yellow sensitivity value in the lowerleft corner of the screen. The ADJ dialthen adjusts the Input Sensitivitybetween 5mV/div to 20V/div. The objecthere is to simply fit the whole waveformvertically on the screen. Normally, wewish to see the entire wave, from thehigh point to the low point, withoutcutting off the top or the bottom. [SEC/DIV]: The [SEC/DIV] button selectsthe Timebase OR HPOS (Horizontal Posi-tion), alternately. When Timebase isactive, the Timebase value appears greenin a blue box at the bottom of thescreen. The ADJ dial then adjusts theTimebase value from the lowest of 10us tothe highest of 500s. The object here isto adjust the waveform so that we see oneor two whole cycles. If you see too many,rotate the ADJ dial to decrease the timeperiod. If you see only a partial cycle,increase the time period.
[TRIGGER]: The Trigger Button selects the trigger function. By repeatedly pushing theTrigger Button, the functions rotate through 3 settings: Trigger Mode, Trigger Level,and Trigger Edge, each turning from a purple color to a blue color or blue box whenbecoming active.
Trigger Mode: In Trigger Mode, the ADJ dial then selects [AUTO], [NORM], or[SING], which is displayed in pink at the bottom of the display. When selected, theTrigger Mode appears pink in a blue box.

Normally, the Trigger is just set to {AUTO], but you may use the other modes, ifnecessary.
Trigger Level: You may need to adjust the Trigger Level to display the exactwaveform or portion that you wish to view. For Triggering to work, however, theTrigger Level (the triangle in the right margin of the screen) needs to be adjusted tobe within the vertical displacement of the waveform.
Trigger Slope: The trigger slope is not normally important, but is best set forthe fastest rising or falling part of the curve.
Note: The trigger slope and trigger level are best set for the fastest rising orfalling part of the curve. For example, if a waveform had a fast rise time, but areally slow fall time, such as a ramp or sawtooth curve, it would be best to set apositive slope for the trigger and set the trigger level for the fastest rising orfalling point in the curve because it would be a more accurate trigger and lesssusceptible to noise.
Horizontal Position Indicator: The [SEC/DIV] button selects the Timebase OR HPOS(Horizontal Position), alternately. Located at the top center of the screen display,the HPOS can be adjusted along the horizontal axis so the first point the waveformcurve crossing the horizontal centerline is at the left margin of the display. Thispermits easier calculation along the horizontal (Time) axis for determining period, orfrequency of the waveform. One cycle period occurs from the first crossing of thecenter horizontal axis (set at the left margin, either up or down) to the next timethe curve crosses the horizontal axis while headed in the same direction. Whenselected, the HPOS Indicator (the long, thick bar in the center of a long linerepresenting the horizontal axis) at the top center of the display will change colorfrom green to blue. Rotating the ADJ dial will move the waveform left or right untilthe waveform is beginning at the desired place at the display’s left edge.
Vertical Position Indicator: The [V/DIV] button selects the Sensitivity adjustment ORVPOS (Vertical Position), alternately. Located at the left edge of the display screen,the VPOS Indicator is a triangle in the left margin of the display. When selected, theVPOS Indicator (triangle marker) changes color from yellow to blue. Rotate the ADJdial to move the waveform up or down until both the top and bottom of the waveform canbe seen at the same time. If the full waveform is too tall or small to see, change theSensitivity.
Oscilloscope State: The Oscilloscope State is at the top left corner of the screen. Itwill display HOLD in orange or Running in green and alternates between the twosettings when the [OK] button is pressed.
Trigger State: The Trigger State, shown in the upper right corner of the screen, canhave three functional states - Holdoff, Waiting, or Trigged. These states changeautomatically depending upon the trigger value and signal.
Holdoff: Displayed in purple, Trigger is disabled until a portion of samplebuffer prior to a trigger point is filled with raw data.
Waiting: Displayed in green, Waiting means the Trigger is waiting for avalid signal slope. The desired trigger level may be outside the voltage range of thepresent signal waveform.
Trigged: Displayed in yellow, Trigged means a valid signal slope has beendetected and registered.
Couple Mode: The Couple Mode is displayed in the bottom left corner of the display. Itis set by the couple switch on the top bracket to AC, DC, or GND (Ground). Please seethe Couple Switch discussion above for further information on oscilloscope coupling.

What is a Waveform?
As we briefly mentioned earlier, the waveform displayed on an oscilloscope is nothingmore than a waveform’s voltage over time. Hence the vertical axis shows the voltage,and the horizontal axis represents time, generally in fractions of a second.
Most waveforms are repetitive. For example, a sine wave (such as 120VAC house voltage)crosses the horizontal axis in a positive direction, then at the positive peak, startsdown again, crosses the axis and heads to a negative peak, where it starts heading upagain to cross the axis for a second time, but in a positive direction again. A halfcycle covers just the positive side (upper part of the curve) or the negative side(lower part of the curve). The entire cycle or period of the wave is the length oftime to cover both the positive AND the negative part of the curve (to the exact sameposition in the next cycle). It does not matter which part of the curve is first(negative or positive), nor does it matter if the negative portion has the sameappearance as the positive portion, as long as the period covers both segments of thecurve. Also, the cycle can begin at any point in the curve to the next correspondingsimilar point in the curve.
As another example, the period or cycle of the wave in our picture showing theoscilloscope controls, is the time between each negative peak (the wave has bothpositive going and negative going signal, but need not actually go negative involtage), and the waveform is similar at each of these points.
The oscilloscope allows us to measure a waveform using a time scale (the horizontalaxis) with the scale determined by the Timebase, measured in us (microseconds), ms(milliseconds) or s (seconds). The cycle mentioned above is called the period of thewave. From the period of a wave, we can determine the wave’s frequency, using theformula:
Frequency = 1/Period(or cycle) or Hertz = 1 Cycle/1 second (s)KHertz = 1/millisecond (ms)MHertz = 1/microsecond (us)
Similarly:Period = 1/Frequency or Period (seconds) = 1/Hertz
Period (mseconds) = 1/KhertzPeriod (useconds) = 1/Mhertz
For example, let us try out our new oscilloscope with some of our previous kits:

As you can see, I’m using our DL4YHF2 Frequency Counter, our XR2206 Function Generator(set for a 10KHz square wave), and our new DSO150 Oscilloscope to show the waveform.
Regarding the frequency and period? As you can see, the frequency is 10.009 KHz andfrom the oscilloscope with the Timebase on the 10us scale, we get about 100us.Our formula shows:
Period = 1/Frequency or 100us = 1/10.009 KHz
But, which is more accurate? Well, it is obviously much more difficult to see (ordetermine) 100 microseconds on our small screen, the counter is obviously easier toread. However, I would think that a waveform on an oscilloscope is a more accuraterepresentation of what is shown; it is just harder to measure visually.
Finally I want to show you one more important function with this DSO150 Oscilloscope.
I set the frequency of the square wave to 15.018KHz. If we do our calculations asbefore, at 15KHz, we should have a period of about 66us. But, this inexpensiveoscilloscope can do all the calculations for you automatically. Simply press [OK] tohold the waveform, then press and HOLD the [OK] button for 3 seconds to get thisdisplay. Press and hold the [OK] button again to remove the stats from the screen.
As you can see, the oscilloscope reports the actual frequency is 15.495KHz. This hasbeen consistent with all my previous measurements with the oscilloscope - thewaveform’s period has been slightly high at all the frequencies that I tried. So,perhaps the crystal oscillator that I used to tune the frequency counter was slightlyoff (low), in this case off by 3.3%. I should try tuning it again, from theoscilloscope (but who can say which is actually the more accurate).

Troubleshooting:
Problems: Possible Causes:
Bad V+ Connector J7 defective.Diode D2 open or damaged.
Bad V- Bad C12 and/or C13.U5 (7660) bad soldering or defective.Hint: Check with R27 disconnected; would let you knowthe issue is caused by load or source.
Bad AV- R27 bad soldering or wrong value.Short between AV- and ground.
Bad AV+ R26 bad soldering or wrong value.Short between AV+ and ground.
V1 not 0V SW1 not set to GND position.Bad soldering on R1 and/or R2.Bad soldering on U1.
V2 not 0V SW1 not set to GND position.Bad soldering on R3 and/or R4.Bad soldering on U1.
V3 not 0V Bad soldering on U1 and/or U2.Bad soldering on R5/or R6.
Bad V4 Bad soldering on R13, R14, and R15.
No Trace Incorrect V4.If V4 is correct, perform factory default restore:
Make sure trigger mode is AUTO and Timebase is 1ms.Hold down [SEC/DIV] and [TRIGGER] buttonssimultaneously for 3 seconds.
Trig Level Perform Default Restore:Indicator Hold down [SEC/DIV] and [TRIGGER] buttonsstuck in simultaneously for 3 seconds.upper corner
Final Considerations:
Summary: The DSO150 Oscilloscope is next level up from the DSO138 Oscilloscope, withmore functions, but same nice screen and a nicely engineered case is included. I amgreatly impressed with the small size and functionality of this oscilloscope. It makesan excellent, useful addition to your electronic toolbox for a reasonable price.
I hope you find this document helpful.
If you have any comments, corrections, changes, or thoughts, feel free to contact meat:
Email: [email protected]


![LIFELINE-KIT - INNOTECH · 2 lifeline-kit / 180212 / pt 1 Índice [2] descriÇÃo dos sÍmbolos 3 [3] advertÊncias de seguranÇa 4 [4] componentes / material 6 [5] utilizaÇÃo 8](https://static.fdocuments.us/doc/165x107/5f06e8ed7e708231d41a579d/lifeline-kit-innotech-2-lifeline-kit-180212-pt-1-ndice-2-descrifo-dos.jpg)