DSIT_Results-Based Planning and Monitoring for Inclusive Design in Transport
25
Results-Based Planning and Monitoring for Inclusive Design in Transport September 12, 2014 Bernard Woods SPD/SPRU
-
Upload
asian-development-bank-transport -
Category
Documents
-
view
213 -
download
0
Transcript of DSIT_Results-Based Planning and Monitoring for Inclusive Design in Transport
8/10/2019 DSIT_Results-Based Planning and Monitoring for Inclusive Design in Transport
http://slidepdf.com/reader/full/dsitresults-based-planning-and-monitoring-for-inclusive-design-in-transport 1/25
Results-Based Planning and
Monitoring for Inclusive Design inTransport
September 12, 2014
Bernard WoodsSPD/SPRU

8/10/2019 DSIT_Results-Based Planning and Monitoring for Inclusive Design in Transport
http://slidepdf.com/reader/full/dsitresults-based-planning-and-monitoring-for-inclusive-design-in-transport 2/25
Agenda
1. Inclusive design
2. Results chain
3. Who is missing / not benefitting?4. Inclusion in the DMF
5. Indicators
8/10/2019 DSIT_Results-Based Planning and Monitoring for Inclusive Design in Transport
http://slidepdf.com/reader/full/dsitresults-based-planning-and-monitoring-for-inclusive-design-in-transport 3/25
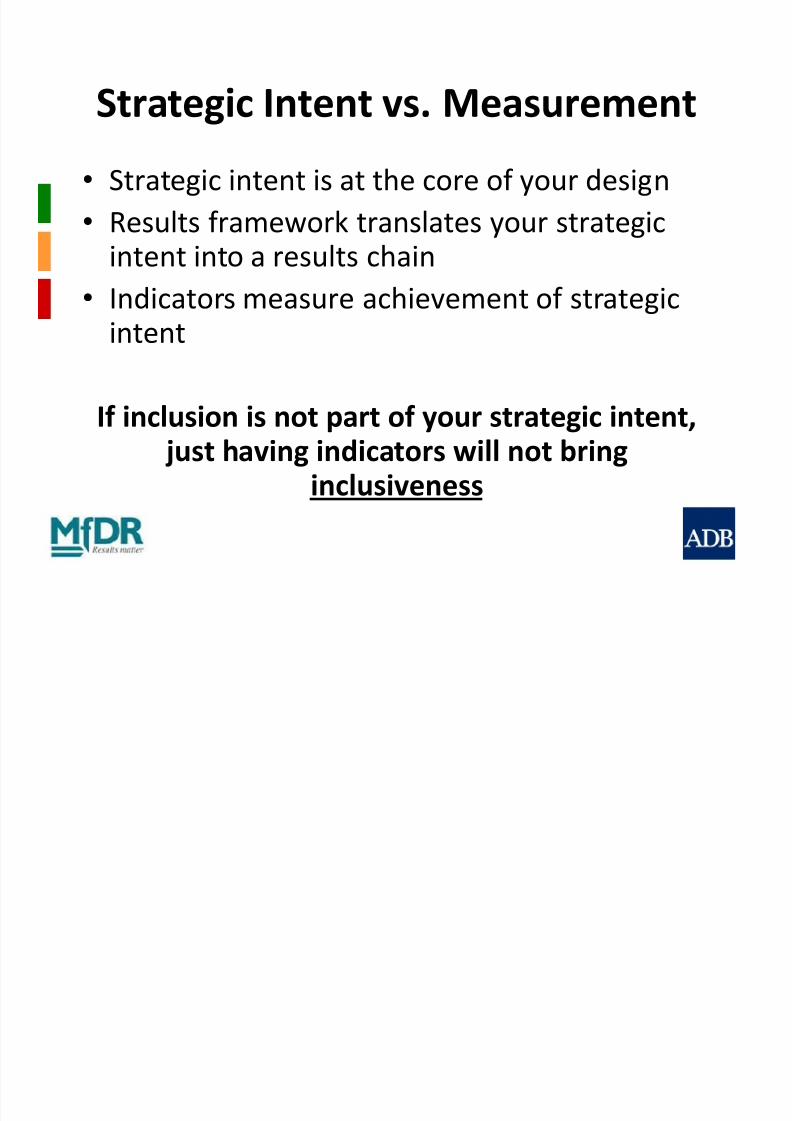
Strategic Intent vs. Measurement
• Strategic intent is at the core of your design
• Results framework translates your strategicintent into a results chain
• Indicators measure achievement of strategicintent
If inclusion is not part of your strategic intent, just having indicators will not bring
inclusiveness

8/10/2019 DSIT_Results-Based Planning and Monitoring for Inclusive Design in Transport
http://slidepdf.com/reader/full/dsitresults-based-planning-and-monitoring-for-inclusive-design-in-transport 4/25
Results Chain – Simple Rule
Produced
Delivered
Used by
Beneficiary
Benefit
of Use
Output Outcome Impact
PeopleDesign

8/10/2019 DSIT_Results-Based Planning and Monitoring for Inclusive Design in Transport
http://slidepdf.com/reader/full/dsitresults-based-planning-and-monitoring-for-inclusive-design-in-transport 5/25
Transport
Output Outcome Impact
Produced
Delivered
Used by
Beneficiary
Benefit
of Use
Roads built/
upgraded
People /
goods travel
from A to B
Income,
education,
health, etc
8/10/2019 DSIT_Results-Based Planning and Monitoring for Inclusive Design in Transport
http://slidepdf.com/reader/full/dsitresults-based-planning-and-monitoring-for-inclusive-design-in-transport 6/25
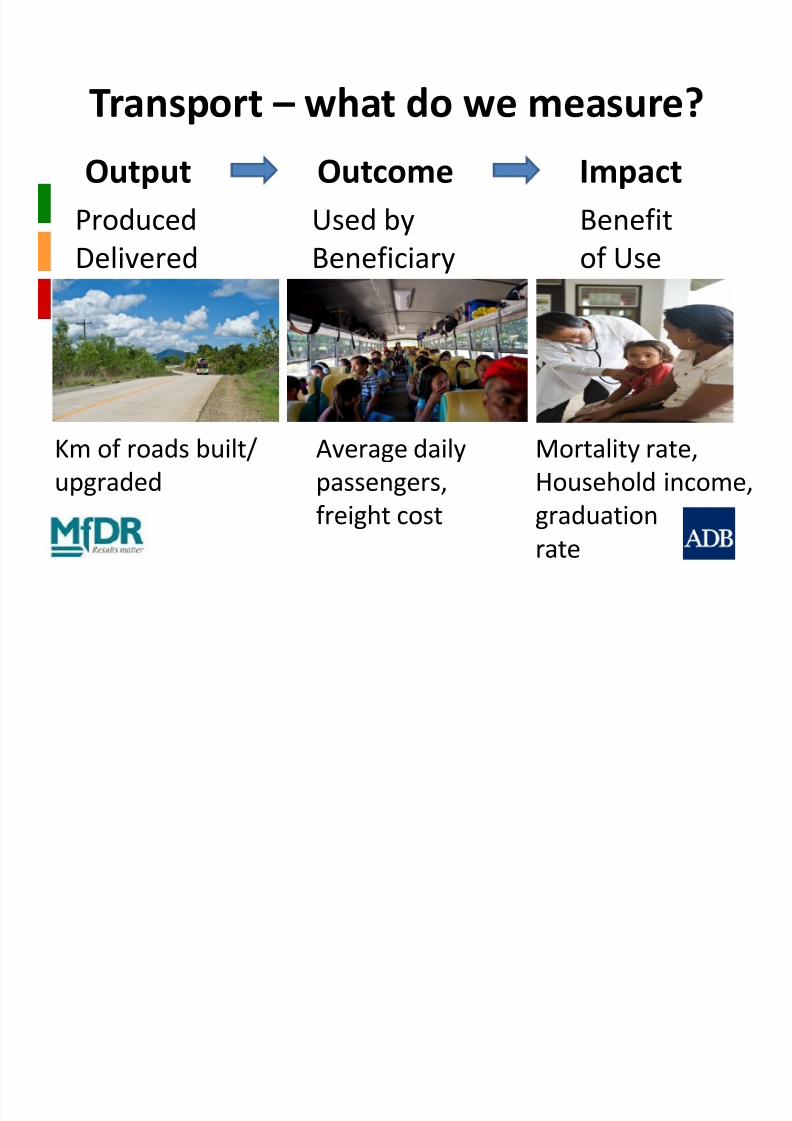
Transport – what do we measure?
Output Outcome Impact
Produced
Delivered
Used by
Beneficiary
Benefit
of Use
Km of roads built/
upgraded
Average daily
passengers,
freight cost
Mortality rate,
Household income,
graduation
rate

8/10/2019 DSIT_Results-Based Planning and Monitoring for Inclusive Design in Transport
http://slidepdf.com/reader/full/dsitresults-based-planning-and-monitoring-for-inclusive-design-in-transport 7/25
Who is Missing?
Who is not using?
Who is not benefitting from use?

8/10/2019 DSIT_Results-Based Planning and Monitoring for Inclusive Design in Transport
http://slidepdf.com/reader/full/dsitresults-based-planning-and-monitoring-for-inclusive-design-in-transport 8/25
Airstrips builtFaster, affordable
travel Increased income
Inclusiveness: Project Level Benefits / Beneficiaries
Whose income
is increasing?
Who is
travelling?
Who can
access?
Output Outcome Impact

8/10/2019 DSIT_Results-Based Planning and Monitoring for Inclusive Design in Transport
http://slidepdf.com/reader/full/dsitresults-based-planning-and-monitoring-for-inclusive-design-in-transport 9/25
Who is missing – not using?
8/10/2019 DSIT_Results-Based Planning and Monitoring for Inclusive Design in Transport
http://slidepdf.com/reader/full/dsitresults-based-planning-and-monitoring-for-inclusive-design-in-transport 10/25
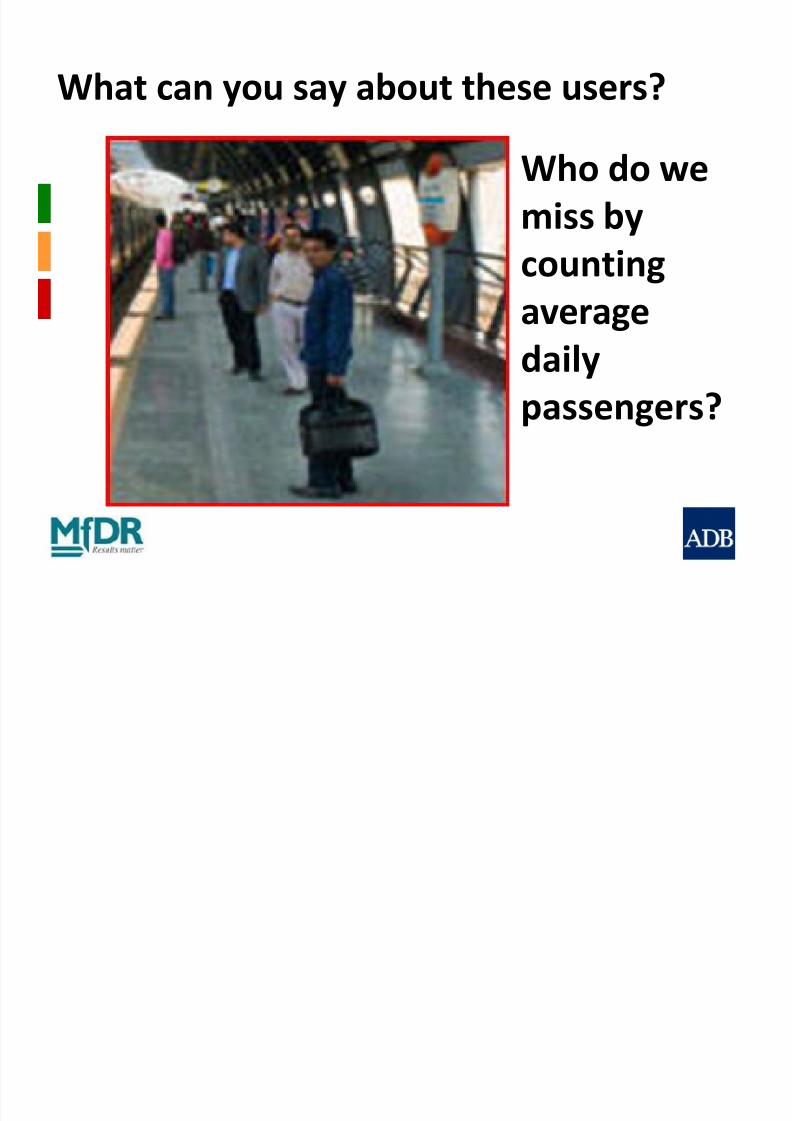
Who do we
miss by
countingaverage
daily
passengers?
What can you say about these users?

8/10/2019 DSIT_Results-Based Planning and Monitoring for Inclusive Design in Transport
http://slidepdf.com/reader/full/dsitresults-based-planning-and-monitoring-for-inclusive-design-in-transport 11/25
Transport - What we need to do at
the design stage?• Look at the needs of different user groups
– What do women need in terms of safety?
• Look at the barriers to use
– How do differently abled people access thesystem?
• Look at how different groups use the outputs
differently – Where do poorer people live? Where do they
need to go?

8/10/2019 DSIT_Results-Based Planning and Monitoring for Inclusive Design in Transport
http://slidepdf.com/reader/full/dsitresults-based-planning-and-monitoring-for-inclusive-design-in-transport 12/25
Design and Monitoring Framework
Design Summary Performance Targets and
Indicators with Baselines
Impact – 1 statement Multiple indicators
Outcome – 1
statement
Multiple indicators
Outputs – multiple
statements
Multiple indicators
Inclusion

8/10/2019 DSIT_Results-Based Planning and Monitoring for Inclusive Design in Transport
http://slidepdf.com/reader/full/dsitresults-based-planning-and-monitoring-for-inclusive-design-in-transport 13/25
Measurement of Inclusion
Deconstructing Indicators
Indicator Options

8/10/2019 DSIT_Results-Based Planning and Monitoring for Inclusive Design in Transport
http://slidepdf.com/reader/full/dsitresults-based-planning-and-monitoring-for-inclusive-design-in-transport 14/25
Number of
People traveling from farm to market
centers increases to 5,000/yr by 2018
(2013 Baseline: 2,000/yr)
Result (Change we want)
Indicator (How we will count it)
Targets & Baselines (How much increase
from where we are now, by when”)
Inclusion

8/10/2019 DSIT_Results-Based Planning and Monitoring for Inclusive Design in Transport
http://slidepdf.com/reader/full/dsitresults-based-planning-and-monitoring-for-inclusive-design-in-transport 15/25
What should we measure – People
Travelling?Who is travelling?
• Sex
• Age
• Income group
• Differently abled
• Marginalized group identity
• Location
• ?

8/10/2019 DSIT_Results-Based Planning and Monitoring for Inclusive Design in Transport
http://slidepdf.com/reader/full/dsitresults-based-planning-and-monitoring-for-inclusive-design-in-transport 16/25
How can we measure inclusion –
People Travelling?Number of
People traveling from farm to market
centers increases to 5,000/yr by 2018
(2013 Baseline: 2,000/yr)
Number of
Poor/female/indigenous peopletraveling from farm to market
centers increases to 5,000/yr by 2018

8/10/2019 DSIT_Results-Based Planning and Monitoring for Inclusive Design in Transport
http://slidepdf.com/reader/full/dsitresults-based-planning-and-monitoring-for-inclusive-design-in-transport 17/25
2 Indicator Options for included
group(s)• Inclusive result – Transport costs for poor women
reduced
1. Standalone indicator - # of poor women with reduced
transport costs…2. Component of indicator - # of women with reduced
transport costs…, of which half are poor…
• Disaggregated data - # (M/F) of people with reducedtransport costs… [no poor, no female target ]
• When counting people always sex-disaggregate

8/10/2019 DSIT_Results-Based Planning and Monitoring for Inclusive Design in Transport
http://slidepdf.com/reader/full/dsitresults-based-planning-and-monitoring-for-inclusive-design-in-transport 18/25
Output, Outcome and Impact
Indicators

8/10/2019 DSIT_Results-Based Planning and Monitoring for Inclusive Design in Transport
http://slidepdf.com/reader/full/dsitresults-based-planning-and-monitoring-for-inclusive-design-in-transport 19/25
Output Indicators
(Produced / Delivered)• Spatial Location
– % of urban rail stations serving predominantly
poor communities (placement)
– % of slum area within 5 km of an urban rail station
(coverage)
• Design
– % of urban rail stations with signage and accessfor people with disabilities

8/10/2019 DSIT_Results-Based Planning and Monitoring for Inclusive Design in Transport
http://slidepdf.com/reader/full/dsitresults-based-planning-and-monitoring-for-inclusive-design-in-transport 20/25
Output Indicators
(Produced / Delivered)• Component
– # of rail cars for women
• Participation
– % of construction jobs held by poor laborers

8/10/2019 DSIT_Results-Based Planning and Monitoring for Inclusive Design in Transport
http://slidepdf.com/reader/full/dsitresults-based-planning-and-monitoring-for-inclusive-design-in-transport 21/25
Outcome Indicators
(Direct Beneficiaries / Users)Ex. Passengers, drivers, owners of vehicles
and/or goods transported
• Measuring sustained use:
– Takes care of “access” and “affordability”
– “Access” often used as proxy measurement of use,but can be at output level
•
Measuring who is using: – Number and percentage who belong to “included”
groups

8/10/2019 DSIT_Results-Based Planning and Monitoring for Inclusive Design in Transport
http://slidepdf.com/reader/full/dsitresults-based-planning-and-monitoring-for-inclusive-design-in-transport 22/25
Impact Indicators
(Direct and Indirect Beneficiaries)• Direct beneficiaries: Secondary Effects
– Ex. Passengers, drivers, owners of goods
transported : Level of income increases…
• Indirect beneficiaries: Primary Effects
– Ex. Factory Workers: Level of employment of poor
worker increases…
– Ex. Farm Workers: Level of employment ofindigenous people on farms increases…

8/10/2019 DSIT_Results-Based Planning and Monitoring for Inclusive Design in Transport
http://slidepdf.com/reader/full/dsitresults-based-planning-and-monitoring-for-inclusive-design-in-transport 23/25

8/10/2019 DSIT_Results-Based Planning and Monitoring for Inclusive Design in Transport
http://slidepdf.com/reader/full/dsitresults-based-planning-and-monitoring-for-inclusive-design-in-transport 24/25
Review
• Inclusion as part of strategic intent, not after-thought
• Inclusion in DMF – mostly with outcome and
impact indicators
• Proper formulation of indicators
• Inclusion as standalone indicator or
component• Investigate data collection and determine
baseline
8/10/2019 DSIT_Results-Based Planning and Monitoring for Inclusive Design in Transport
http://slidepdf.com/reader/full/dsitresults-based-planning-and-monitoring-for-inclusive-design-in-transport 25/25
Thank You!
Questions? Comments?