DSD-INT 2016 Stochastic Dredge Plume Modelling in the Great Barrier Reef - Schuurman
28
Stochastic Dredge Plume Modelling in the Great Barrier Reef Filip Schuurman, Andrew Symonds & Marcela Busnelli
-
Upload
delftsoftwaredays -
Category
Software
-
view
102 -
download
0
Transcript of DSD-INT 2016 Stochastic Dredge Plume Modelling in the Great Barrier Reef - Schuurman

Stochastic Dredge Plume Modelling
in the Great Barrier Reef
Filip Schuurman, Andrew Symonds &
Marcela Busnelli

Abbot Point port

Abbot Point port
• Australia’s most northerly and largest bulk port
• Started in 1984
• Capacity 50 Mton/year
• Area 5350 ha
• Operated by Abbot Point Bulkcoal Pty Ltd.


Location of Abbot Point within Great Barrier Reef Marine Park

2.8 km jetty
Existing coal terminal T1
Berthing and loading of ships
Existing and proposed terminals

Existing and proposed terminals
Dredging for deepening of berthing place (1.1 million m³)
Onshore dumping of dredged sediment

Main question:
Will the dredged and dumped sediment affect the Great Barrier Reef?

Scope of work • Data collection and analysis
• Hydrodynamics around the Abbot Point port
• Dredged sediment dispersal and deposition
• Modelling approach:
– 3D hydrodynamic modelling using Delft3D 4
– Sediment dynamics using DelWaq offline
– Assess dredging and onshore dumping strategies
– Account for large variation in meteorological conditions (incl. tides, wind, El Niño, cyclones and regional scale circulations)

110 km by 60 km
Nested grids (3x)
Outer grid = 350 – 550 m
Inner Grid = 30– 60 m
3x water level boundaries

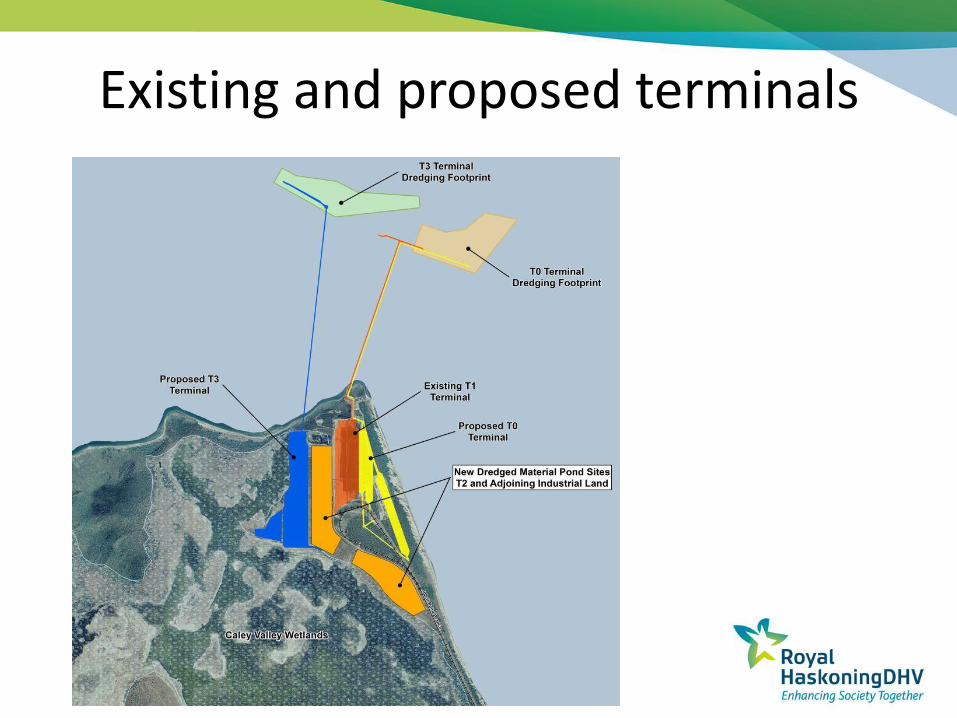
Driving Forces
• Astronomical Tides – water level boundaries derived using DHI Global Tidal Model, KMS.
• Wind and wave data – from regional scale hindcast wave model (resolution 0.05 degrees).
• Wave modelling online with hydrodynamics
• Uniform wind field
• Regional scale circulation processes……

Calibration Water level
WL at location A2:
WL at location B1:

Wind
• Wind-induced currents from South-East

Calibration regional flow circulation
Flow speed:
Flow direction:

Dominant flow at peak ebb

Wave Calibration
0
0.5
1
1.5
2
2.5
3
3.5
4
24/12/2013 31/12/2013 7/01/2014 14/01/2014 21/01/2014 28/01/2014 4/02/2014 11/02/2014
Sign
ific
ant
Wav
e H
eigh
t (m
)
Date
Measured
Modelled
0
90
180
270
360
24/12/2013 31/12/2013 7/01/2014 14/01/2014 21/01/2014 28/01/2014 4/02/2014 11/02/2014
Mea
n W
ave
Dir
ecti
on
(deg
s)
Date
Measured
Modelled
0
2
4
6
8
10
12
14
24/12/2013 31/12/2013 7/01/2014 14/01/2014 21/01/2014 28/01/2014 4/02/2014 11/02/2014
Pea
k W
ave
Per
iod
(S)
Date
Measured
Modelled

Sediment properties
• 3 fractions
• Sediment concentrations based on measurements

Stochastic Modelling
• Modelled 3 years:
– El Nino (1997)
– La Nina (2011)
– Neutral year (2007)
• 10 months dredging period
• 13 scenarios with 21 days difference in starting date

Result: sediment concentration
95th percentile of sediment concentration in a neutral year

95th percentile of sediment deposition in a neutral year

95th percentile of sediment concentration in a neutral year

El Niño, La Niña and neutral year
La Niña El Niño
Neutral year

Wet vs dry season
Wet season Dry season

Summary
• Undertook a numerical modelling comparative assessment for offshore disposal sites at Abbot Point
• Extensive modelling required to meet approval requirements
• Study showed that impact to Great Barrier Reef is insignificant
• Study helped identify most suitable dredging conditions


QUESTIONS?