
DSATS Automated Drilling Competition Design … Automated Drilling Competition Design Report ... 3.1...
43
DSATS Automated Drilling Competition Design Report Jung Yong Kim Prudhvi Mohan Narendra Vishnumolakala Tianbo Zhai
Transcript of DSATS Automated Drilling Competition Design … Automated Drilling Competition Design Report ... 3.1...

DSATS Automated Drilling
Competition
Design Report
Jung Yong Kim
Prudhvi Mohan
Narendra Vishnumolakala
Tianbo Zhai

2
Acknowledgements, and Faculty involvement
The students from team Texas A&M would like to express sincere gratitude to the faculties involved in this project. We are grateful to have encouragements and supports from the dedicated faculties. We like to thank Professor Fred Dupriest, Dr. Eduardo Gildin, Dr. Sam Noynaert, and Dr. Alan Palazzolo. Here is the brief list of faculty involvements: Professor Fred Dupriest has given guidance in concepts in minimize MSE by mitigating various dysfunctions and its limitations. Dr. Eduardo Gildin has given guidance in coding the algorithm with the MSE concept. Dr. Sam Noynaert has given guidance in the rig design. Dr. Alan Palazzolo has given guidance in the rig mechanical design. We would like to show a special gratitude to Mr. Torbjorn Pederson for his guidance in designing a safety system. For the guidance in rig fabrication, we would like to thank Mr. Randy Tucker and Mr. Tom.

3
Table of Contents
1. Introduction ……………………………………………………………………………………………………………… 4
2. Rig Construction …………………………………………………………………………………………………………6
2.1 Mechanical Systems Design …………………………………………………………………………….……6
2.2 Electrical Systems Design …………………………………………………………………………………..…9
3. Control System Design ………………………………….……………………………………………………..……12
3.1 ROP Optimization Using MSE ………………………………………………………………………….……12
3.2 Instrumentation …………………………………………………………………………………………….…….19
4. Simulation …………………………………………………………………………………………………………………23
4.1 Algorithm …………………………………………………………………………………………………….……...23
4.2 Data Visualization ………………………………………………………………………………………….…....25
4.3 Simulation Results …………………………………………………………………………………………..……31
5. Safety ……………………………………………………………………………………………………………..…….……34 6. Cost Estimate ……………………………………………………………………………………………………….…….38 Appendix References

4
1. INTRODUCTION
The main objective for any driller is to simultaneously drill fast and drill safe, ensuring quick
and accurate execution. Typically, drilling faster means less time spent drilling, which in turn
works to reduce costs. At the same time, though, people are a company's most valuable asset
and keeping their well-being intact is of the utmost importance. These objectives can be
achieved and maximized with the introduction of automated drilling rigs. This is indeed the
main objective of any drilling automation process: increase safety by ensuring that well
dynamics does not exceed the ones specified by its natural behavior.
Automation in the drilling industry is less advanced compared to other industries (Thorogood,
Aldred, Florence and Iversen 2010). Failure to adopt new technology in any industry can occur
for a variety of reasons. The oil and gas industry and the drilling sector in particular, has always
been slow to take up new technologies due to economics, safety concerns and the drilling
environment. The operator service company dynamic requires the push for innovation come
from the customer. Most operators do not ask for automation and thus are not willing to pay
for it. In addition, a mistrust of automation exists, especially of automation of downhole
pressure control. This mistrust is based on the inaccurate assumption that a human can better
process the data and make better decisions. Another reason for this slow adoption can be
attributed to the fact that drilling activity takes place in extreme working conditions, above
ground in unhospitable areas and downhole with high temperature, high pressure (HTHP)
formations. Finding control equipment and sensors to handle this environment is difficult. It
is also important to note that the drilling process is not standard for all wells every wellbore's
construction is unique in its own way. Therefore, the modeling of this process cannot be
definite, but, instead has to be adaptive. All of these contributing factors make automation in
drilling a difficult task. However, with each technological advancement, these limitations are
being overcome. It is also no surprise that the recent boom in unconventional reservoirs is
adding more motivation for transitioning into automation.
The objective of this project is to come up with a safe automated drilling system which can
achieve drilling optimization with the given constraints. Given constraints include amount of

5
power available (2.5 hp), Weight-On-Bit(≤ 50 lbf), specified drill strings, and drill bit. Our
automated drilling rig will have a test run to drill approximately 2-ft of concrete block with
unknown strata. By optimizing the drilling efficiency in this controlled environment, we
believe that what we learn in this research could possibly be applicable in the real drilling
operation. The goal is to enable the drilling process to be more productive by managing
various risks while keeping a safe operational practice in place. The focus of the project is on
maximizing Rate of Penetration (ROP) thereby optimizing performance. The concept of MSE
is used to develop a control algorithm for designing automatic control systems. The types of
dysfunctions encountered down-hole are discussed. Each dysfunction can be corrected with
a particular response specific to the dysfunction. The corrective actions are also discussed.
These are included in the control algorithm.
This report is organized as follows. We start by discussing mechanical and electrical system
design of the rig supported by engineering drawings. In section 3.1, we introduce control
system design and in section 3.2, we discuss sensors and instrumentation used in the design.
Next we present control algorithm in section 4.1, Data handling and visualization in 4.2 and
close the section with simulation results. Section 5 is dedicated to safety. Cost estimates and
references are included at the end.

6
2. RIG CONSTRUCTION
2.1 MECHANICAL DESIGN OF DRILLING RIG
Our objective in drilling rig construction is to come up with a fully functional miniature drilling
rig with limitation in the hoisting system, i.e. making connection and laying down the drilling
strings are ignored. The required rig need to drill, with WOB limit to 50- lbs., through a 60 x
60 x 60-cm cement block with a 1.125-in. diameter PDC micro-bit and three different drill
string configurations with OD ranging from 1-in. to 3/4-in. OD. The power system is also
limited to the electrical power from the local grid not to exceed 2.5-HP. As we are only
simulating the drilling optimization, setting casing is not considered in our design. With the
given constrains, we have reviewed the current drilling rig system and came up with the
configurations as described in the following sections.
2.1.1 DRILLING RIG
Selection of drilling rig depends mainly on the drilling environment, power required,
economic, and mobility (Bourgoyne et al. 1986). The drilling rig we need has to drill through
approximately 2-ft concrete block with the maximum weight on bit of 50-lbs with the rig
mobility in consideration. We have decided to model a portable land drilling rig for the
mobility and the economic reason. The conventional land rig would limit the mobility, and the
offshore rigs would be too expensive to fabricate. The full diagram of our miniature drilling
rig is provided in the appendix.
The important structural parts are included as follows: a) steel support pipes – two steel pipes
of different diameters are chosen such that the thinner pipes concentrically fits in the larger
pipe for the height adjustment. A tightening screw is used to hold the inner pipe at required
position. 4 steel support pipes are going to be used to mount the rig floor, b) locking casters
– locking casters are used to support the steel pipes and to provide the rig mobility. Separate
plates to anchor the locking casters to the ground will be used for rig stability, c) I-beam – I-
beam will be securely mounted on the rig floor (steel plate). This structure will support the
entire top drive and swivel system, functioning as a derrick.

7
2.1.2 DRILLING TECHNIQUE
We decided to use the conventional rotary drilling technique. Among many drilling
techniques, the percussion drilling system has been seriously considered. However, we
decide to abandon this idea due to the objective of this competition; the objective is not just
to drill faster, but to minimize today’s common dysfunctions to achieve better penetration
rate. Also, the percussion drilling technique would require much heavier equipment than the
weight limits we are given if uncommonly hard formation is encountered. Between the top
drive and kelly drive system, we chose to use top drive in our rig design. Although the
advantage of time saving with the top drive will not be realized in our simulation as only one
stand of drill strings is needed to be used, it would aid us in delivering sufficient weight on
bottom. The kelly drive system was considered as the kelly bushing would act as a centralizer
which would help in stabilizing the drill strings. However we decided that the placement of
the bell nipple with enough height between the rig floor and the rock sample would provide
us with the same stability as the kelly bushing.
The important mechanical parts for the top drive system for our application are listed as
follows: a) top drive motor – we are going to have approximately 2 hp drive motor
representing the top drive, b) swivel – the swivel will be placed between the top drive motor
and the drill string, c) guide rails and clamp – the top drive motor and the swivel are clamped
and are mounted on a guided rails. This will serve as the elevator for the top drive, allowing
the system to drill a vertical well, and will be able to have 100 lbs load limits. The guide rails
will also have the breaks to hold the top drive when it is not in use, d) additional weight – if
necessary, weight blocks will be placed on the motor to obtain a maximum WOB of 50 lbs.
2.1.3. POWER SYSTEM
Constrains are given in available power system we can use for our drilling system. Normally,
diesel engines would be used to generate power on the rig site. This power is utilized among
many components, mainly in the mud circulation, hoisting, and rotary system. Among the
three systems, power is mostly used by the mud circulation and hosting system. In our case,
most power will be utilized in the rotary system to vary and maximize the power in the RPM
control of the drill strings. As we are going to be drilling a block of cement in the atmospheric
condition, we do not need much power in the mud circulation system. Minimal power is going
to be needed in the hoisting system as we do not have to deal with heavy drilling strings.

8
2.1.4. HOISTING SYSTEM
The hoisting system serves many functions in the drilling operation. It includes derrick,
drawwork, traveling/crown block, and drilling line. The main function is to raise and lower the
drill strings to make connections and various trips. In our hoisting design, making connections
and various trips were not required. Thus, our hoisting function is intentionally limited to only
lower and raise the drill strings to vary the weight on bit between 0 to 50-lbs for the economic
reason.
2.1.5. DRILLING FLUID CIRCULATION SYSTEM
There are many functions of drilling fluid system. The effective drilling fluid system is needed
for well stability, remove rock cuttings, lubricate and cool the drill bit. The system includes
mud pumps, various mud-mixing equipment, mud pits, shale shakers, etc. In our design, our
only concern was to effectively cool the bit and remove cuttings. Other functions are ignored
as we are drilling a 2-ft height concrete block in the atmospheric condition. Also, the closed-
loop fluid circulation system is not mandated. Thus, we decided to use air as our drilling fluid
and an air pump as mud pumps for economic reasons for now. However, we are designing
the circulation system to have sufficient seals to use water as the drilling fluid if we decide to
switch it later in our actual test run.
As a BOP stack is not required in our rig design, we decided to place a bell nipple; with rubber
gasket on the bottom, a flange welded on top and a flow outline, between the rig floor and
the rock sample. This bell nipple will allow sufficient transportation of cuttings through the
annular space to the flow line with sufficient seal. The diagram of this bell nipple is also
included in the mechanical drawing.
Other important consideration regards to the drilling fluid circulation system include design
of the swivel that will be placed between the top drive and the drill pipes. The use of swivel
to affectively deliver fluid down hole without leaks while drilling is going to be necessary. Our
swivel will exactly serve this purpose in delivering the fluid downhole.
2.1.5. RIG MOBILITY
The mobility of the rig is important, this includes moving the rig to the drill site, rig up, rig
down, and changing necessary mechanical parts with ease in an economical manner.

9
Especially in some regions, mobility of the rig is critical as many wells are drilled in the same
field in very short period of time.
For the design of the rig system, we have considered mobility of the rig as a major criteria. As
mentioned in the section 2.1.1, the miniature drilling rig will be fabricated with a portable
land drilling rig, i.e. flex rig, as a model. We are going to have rig floor supported by four height
adjustable steel pipes with wheels. This will allow us to move the drilling rig by rolling to a
preferable place to carry out the test runs. The I-beam, representing the derrick, will be bolted
into the rig floor. Our drilling rig will be around 7 feet in height, and by having detachable
derrick, we will be able to achieve the height clearance in most of the places. We are going to
also have our motors detachable so that it can be modified or changed.
Since a drilling lab is available at Texas A&M University – Petroleum Engineering Department,
we are likely going to operate the drilling rig in the drilling lab. Thus, it is probable that the
drilling rig we fabricated will stay in the drilling lab, eliminating needs to move the drilling rig.
2.2. ELECTRICAL SYSTEM
Maximum power that can be drawn from the grid = 2.5 HP. It should be able to power the top
drive, air pump, and the Draw works motor simultaneously. A typical household power outlet
cannot deliver 2.5 HP. Additional safety fuse systems will be designed while drawing power
from the grid and connecting it to the motor drives.
Top drive motor
This motor drives the drilling string and is the crucial component in drilling operation. For our
application, it consumes majority of the power. This motor is hinged to the carriage, placed
on the guide rail and it moves down with the drill rod when drilling.
Requirements
1.) Nominal speed of 500 rpm and wide speed variation is desired.
2.) Weight of the motor should not greatly exceed the maximum WOB of 50 lbs.
No limit on the voltage and current rating has been specified.
A power rating of 2 HP is chosen to leave enough margin for the air pump and draw works
motor to work. DC machines have a good advantage over AC machines when the application
requires wide speed and load variation. A Brushless DC (BLDC) motor along with the speed
10
encoder and variable voltage and variable frequency source would be ideal for this application,
however a brushed motor is also a viable option.
The load torque in this application can change abruptly at any instant. An additional safety
feature to reduce the voltage when speed reduces abruptly will be incorporated to prevent
sudden in rush currents at such instances.
Draw work motor
This motor (gear motor) is used to maintain the desired WOB the bit and for pulling out the
top drive after drilling. The motor typically runs at very low rpm and requires a gear system
to maintain proper speed control. This machine is placed on the platform and is hinged to the
top drive motor through a pulley system.
Requirements
1.) Wide speed variation.
2.) RPM value is dependent on the radius of the rotor block, and is to be decided (typically
< 10rpm).
3.) It should be able to pull out the assembly in < 5sec ( Power rating of 50W)
Again a brushless DC machine with variable frequency and variable voltage source is preferred.
Air pump/Water pump
This system is used to carry out the cuttings while drilling. In our application, it operates at a
constant pressure and flow rate. It is connected to the swivel through a flexible pipe and can
be placed on the platform.
Requirements
1.) At least 50 PSI.
2.) No requirements on speed control.
3.) ON/OFF operation.
An air pump with 300W and 50 psi, and ON/OFF controller are chosen.
At this point it is not entirely decided if the application demands can be met by using air pump.
Water pumps will be used if the application demands higher cooling rates.

11
2.3. LESSONS LEARNED
With the given constrains and the difficulty in simulating the actual drilling conditions in the
lab environment, there are some important lessons learned in the first design phase of our
project. Mechanically, it is difficult to scale down the complexity of the fully functional rig
system. Not only that, but there are several different rig systems depending on the drilling
situation. To have a fully automated miniature drilling rig system to satisfy all the drilling
situation would be too complex.
One of the objective in our drilling project is to mitigate dysfunctions. During the literature
review, we discovered that some of the dysfunctions would be hard to simulate in the lab
condition. For example, the interfacial severity would be difficult to simulate with weight on
bit of only 50 lbs in the atmospheric condition. Thus, testing a fully automated drilling
optimization system would require several real field runs to verify the functionality of the
optimization system.
We also learned that it would be hard to justify how effective our automated drilling system
is. This is due to the fact that we would not know the actual rock strength. The rock strength
of the formation is usually found by logging the formation or compared with the offset wells.
However, this was not possible to do in our project. It would be logical to have a drilling
optimization system without really knowing the exact formation characteristics. But, this also
limits our ability to justify the efficiency of our automated drilling system.

12
3. CONTROL SYSTEM DESIGN 3.1 ROP OPTIMIZATION USING MSE
Drilling Automation is the ‘control’ of drilling processes by computer instead of humans.
Therefore designing control system for the processes is key in automation. For automatic
control of the rig, we have designed few control systems in this application. The most
important one is the control system for ROP optimization.
The Rate of Penetration (ROP) depends on several factors such as Weight on Bit (WOB) (which
creates rock indentation – higher WOB implies deeper indentation), Motor rotations per
minute (RPM) (which creates cutting length on the rock – higher RPM implies more sliding
distance), bit aggressiveness and rock strength among other non-linear effects. For a given
bit type and a given formation, ROP can be optimized using WOB and RPM.
Fig 3.1 The dependency of ROP on different parameters is shown
The algorithm is developed based on the concept of Mechanical Specific Energy (MSE).
The Mechanical Specific Energy (MSE) concept has been widely used to quantify the efficiency
of the energy used to remove the volume of rocks in drilling operation. This concept was first

13
suggested in 1965 by Teale in “The Concept of Specific Energy in Rock Drilling”. However, it
did not get much attention as it should in the academic research until ExxonMobil
implemented MSE surveillance throughout the company worldwide in the early 2000. Since
then, there has been several laboratory scale drilling experiments and industry application
based on the MSE concept, and many successful cases has been reported.
MSE can be mathematically expressed with total energy input and total rock volume removed
as shown below.
MSE = 𝑇𝑜𝑡𝑎𝑙 𝐸𝑛𝑒𝑟𝑔𝑦 𝐼𝑛𝑝𝑢𝑡
𝑇𝑜𝑡𝑎𝑙 𝑅𝑜𝑐𝑘 𝑉𝑜𝑙𝑢𝑚𝑒 𝑅𝑒𝑚𝑜𝑣𝑒𝑑
According to Teale, there is a distinctive correlation between the MSE and the strength of the
rock. Not only that there is a positive correlation, but the MSE should equal to the rock
strength if the drilling system is hundred percent efficient in just cutting the rock volume.
Expanding the above equation, the MSE equation becomes
MSE = (𝐸𝑛𝑒𝑟𝑔𝑦 𝐼𝑛𝑝𝑢𝑡 𝑓𝑟𝑜𝑚 𝑉𝑒𝑟𝑡𝑖𝑐𝑎𝑙) + (𝐸𝑛𝑒𝑟𝑔𝑦 𝐼𝑛𝑝𝑢𝑡 𝑓𝑟𝑜𝑚 𝑅𝑜𝑡𝑎𝑡𝑖𝑜𝑛)
𝑅𝑜𝑐𝑘 𝑉𝑜𝑙𝑢𝑚𝑒 𝑅𝑒𝑚𝑜𝑣𝑒𝑑
And it can be expanded with WOB, RPM, Torque, ROP, and bit-diameter as shown below,
MSE = (4 × 𝑊𝑂𝐵)
𝐵𝑖𝑡 𝐷𝑖𝑎2 × 𝜋+
(480 × 𝑇𝑜𝑟𝑞𝑢𝑒 × 𝑅𝑃𝑀)
𝐵𝑖𝑡 𝐷𝑖𝑎2 × 𝑅𝑂𝑃
Where: MSE = Mechanical Specific Energy, psi. WOB = Weight-On-Bit, lbs. Bit Dia = Bit Diameter, inches. Torque = Torque from rotation, ft-lbs. RPM = Rotation per Minute ROP = Rate of Penetration, ft/hr
The importance of the MSE concept does not only lay in its physical meaning but the
application of the surveillance program to optimize rock cutting efficiency. Simply put, ROP
can be optimized by minimizing the MSE, and we can get this done by varying the three
variables in real time through the surveillance program or having a modification to the
existing engineering design to remove limiting factors prohibiting lower MSE realization.

14
The control algorithm is based on the above formula. Using the parameters WOB & RPM, the
system is designed to minimize MSE and thus improve ROP. The parameters are adjusted as
long as the MSE value decreases or remains constant. The rate of penetration (ROP) should
increase proportionately to increase in WOB and RPM. If the increase is not proportionate, it
is an indication that bit is performing inefficiently and that a dysfunction is present in the
system.
Fig 3.2 The bit is considered performing efficiently if ROP increase is proportionate to WOB.
Beyond Point 2 (called founder’s point), the bit is considered performing inefficiently.
In our application, we have the control algorithm, based on the surveillance program, to
automatically change variables to minimize the MSE in real time by eliminating possible
dysfunctions. There are several types of dysfunctions that can occur down-hole, to the drill-
string or to the drill-bit namely
1. Bit balling
2. Bottom-hole balling
3. Interfacial severity
4. Whirl (Lateral Vibrations)
5. Stick-slip (Torsional Vibrations)
6. Axial Vibrations

15
Fig 3.3 The most common dysfunctions encountered and the response of ROP to drilling parameters
like WOB is shown here.
The type of dysfunction can be diagnosed using MSE and corrective action corresponding to
the dysfunction can be taken to optimize performance. Each of the dysfunctions is briefly
explained below. For the miniature drilling system we are designing, some of the dysfunctions
may not be significant and can be ignored in the control algorithm at this point of time. The
applicability of the dysfunction to our current application is also described below.
Bit balling
It is the accumulation of material on the face of the cutting structure that interferes with
depth of cut when weight is applied. The material carries a portion of the WOB so that the
load on the cutter tips is reduce – so DOC is reduced. As material is compacted it builds
compressive strength and is able to carry some of the bit load, which reduced DOC. Balling
then occurs in degrees and effects ROP in degrees. MSE tells us the severity of the effect on
DOC, torque and ROP. It should be noted that Balling is not simply material stuck to the bit. It
must be material on the cutter itself that is strong enough to interfere with depth of cut.

16
Response:
Increase pump (flow) rate to use all horsepower. Reduce WOB to below founder’s point to
reduce DOC and cut a thinner ribbon to mitigate balling. This results in loss of ROP which can
be compensated by increasing RPM.
Applicability:
Balling is common and is observed under high hydrostatic heads. Given the size of rock sample
(2 ft. TVD) and BHA (1.125 inch dia PDC drill bit), the chances of bit balling are less and is
ignored in the performance optimization algorithm. Even if there was a situation of bit balling,
since the maximum WOB is just 50 lbs which is assumed to be under founder, the weight on
bit is not reduced and RPM is increased.
Bottom-hole balling
This usually occurs when the hydrostatic head is very high and in deep impermeable rock
(shale). Bottom-hole balling is observed when the rock cuttings accumulate and form a layer
at the bottom. BHB results in a very high MSE value and ROP becomes unresponsive to WOB.
Response:
Since ROP is unresponsive to WOB, all that can be done is to maximize hydraulics (Increase
flow rate) and increase motor RPM.
Applicability:
It is almost impossible to have bottom-hole balling in our application because the hydrostatic
head cannot be large for a 2 ft. deep hole. Also, it is more common with insert bits.
Interfacial severity
When a hard material is encountered in the formation, bit force is concentrated on the bit
cutter in contact with the hard material causing bit damage. In uniform rock, the load per
area on the cutter face equals the rock compressive strength. But if a formation includes very
high strength material, high point loading occurs at the contact points with the cutter.

17
Response:
Reduce WOB to limit bit damage. Operate at moderate RPM values.
Applicability:
Interfacial severity failure is not common. When it is encountered it is usually only for short
intervals in an entire well (unless you are drilling horizontally in the zone). Also, usually only
in wells with general rock strengths above 10-20 ksi. Therefore this situation is ignored in our
optimization algorithm for the 2 ft. rock sample drilling operation. Though there were layers
of hard formation, it is optimum to drill off the layer at the existing operating parameters as
the layer would not be more than few inches. But one corrective action that is included in the
algorithm is to reduce RPM to prevent bit damage.
Whirl
When the bit is rotated using the drill string, any imbalance tends to cause the BHA to flex
and develop a sine wave resulting in lateral vibrations. The wave may rotate with the string
in a jump rope action, or it may oscillate across the hole. This lateral movement of the string
off center is referred to as whirl.
Response:
The magnitude of the wave has to be reduced on order to mitigate lateral vibrations and
improve ROP, bit life and borehole quality. Primary response to whirl is to increase WOB to
increase the DOC to suppress the bit tilt due to the sine wave. RPM must be changed to ensure
that the whirl is not resonating.
Applicability:
Whirl can occur when there is imbalance in BHA (worse at resonant RPM). Mitigating this
dysfunction is important in our application because the clearance is small (drill pipe is 1’’ dia
and drill bit is 1.125’’ dia) and small lateral vibrations can affect borehole quality badly. But
the drill pipe provided is very stiff (1’’ OD and 7/16’’ ID) which makes it difficult for whirl to
propagate. The algorithm is designed in such a way that when whirl is encountered, WOB is
increased to its maximum design limit and ROP is increased slowly as long as MSE is not
increasing.

18
Stick-slip
The torque due to motor rotating the drill pipe generates bit torque and drag causing the drill
string to twist and turn. Stickslip is a resonant-period torsional oscillation in the drill string.
While the RPM at the surface is constant, the bit is speeding up and slowing down as the
string winds and unwinds. If the amplitude is small, this is called an “oscillation”. If the swing
in speed is so great the bit comes to a full stop during the backward motion, it is call “full
stickslip”.
Response:
The shape of the torque curve at the surface will be symmetric if we are experiencing only
oscillations. It will be non-symmetric if the bit is fully stopping for any period of time.
Increasing WOB causes an increase in bit torque which drives higher torque oscillations. Effect
on MSE is usually subtle up to the point that the accelerations cause full stickslip. RPM is
increased to keep ROP high.
Applicability:
This type of dysfunction usually is dominant when the drill string is long. The chances are high
when a small diameter drill pipe is used. But the small diameter is not a problem in our case
because of large stiffness (high wall thickness). Real-time data is obtained and plotted to
identify asymmetric curve which is an indication of Stick-slip. WOB is reduced and RPM is
increased as corrective action.
These points are summarized in the below table.
Type of Dysfunction WOB RPM Concern
Whirl ↑ ↓ Yes
Stick-Slip ↓ ↑ Yes
Bit Balling ↓ ↑ No
Bottom-hole balling - ↑ No
Interfacial Severity ↓ - May be
Table 3.1 Summary of dysfunctions encountered during drilling; driller’s response with respect to
changing WOB and RPM; significance of the dysfunction to current application

19
3.2 INSTRUMENTATION
A control system model is designed based on the concepts described in the previous section.
To implement the control system in the actual application, data is to be transferred from plant
to the control system and vice-versa. Measurements are made at the plant using sensors (or
transducers) and are given as input to the control system (in computer). Outputs based on
the control algorithm are given to the plant using actuators. An interface is required for
communication and data transmission between the plant (hardware) and control system
(software). These three topics (1. Sensors, 2. Actuators 3. Data Acquisition) are addressed in
this section.
3.2.1 SENSORS
We have identified some key parameters that have to be measured in real-time to ensure
better performance as well as plant safety. We have decided to make only surface
measurements for the parameters. We initially had a plan of building a wired-pipe (with real-
time data transfer) and Bottom-Hole Assembly (BHA) and have sensors down-hole. This is not
hard to build given the short length of drill pipe. It is even possible to have wireless sensors
down-hole. But it turned out to be out of the budget, in particular packaging accelerometers
in 7/16’’ ID pipe and torque measurement systems are very expensive. The following is the
list of sensors used and the parameters measured using the sensors.
Weight-on-Bit (WOB)
This is an indirect measurement. It is done by having a load cell measure tension in the drill
line of hoisting system and relate it to the weight applied on the bit. Alternatively, a hanging
load-cell can be fitted just above the top drive that can directly measure the weight
suspended.
Rotations Per Minute (RPM)
RPM is directly measured from the motor. The motor used is a VFD (Variable Frequency Drive)
which gives voltage outputs that can be programmed to relate it to RPM.

20
Torque
Instead of purchasing a commercial torque sensor (which is very expensive), we plan to
measure torque indirectly using the relation P = V*i = T*w. The VFD gives voltage output and
measuring the current drawn by it, torque can be calculated. Power losses in gearbox and
couplings are assumed negligible. Proper calibration ensures accurate measurements.
Rate of Penetration (ROP)
ROP is calculated by measuring the total depth drilled and diving the value by the total time
taken to drill the depth. Since the well planned is a vertical well, placing a position sensor such
as LVDT (Linear Variable Differential Transformer) to measure displacement would suffice.
Vibrations
Vibrations in the drill pipe is the performance limiter of ROP optimization algorithm and hence
is a key measurement. A triaxial accelerometer is required in actual drilling operation to
indicate type of dysfunction. But since we have assumed small axial vibrations (because the
pipe is short ~ 2ft.), we just look for lateral vibration measurements.
Temperature
Temperature measurements are made on the equipment such as top drive, drawworks motor,
hardware interfaces and others to ensure that the equipment is not overloaded. High
temperature indicates overload and alarms/ warnings are generated based on the algorithm.
A simple RTD is sufficient for our system.
3.2.2 ACTUATORS
RPM Control
One of the outputs of the control system is motor speed or RPM. Based on the control
algorithm, a value of RPM is generated in real-time and the drill pipe is required to operate
at the set RPM. A Variable Frequency Drive (VFD) solves this purpose. We have selected
Omega DC series motor which can receive analog inputs for our operation.

21
WOB Control
The second parameter of the control algorithm is weight-on-bit. It can be controlled by
sending analog voltage signals to the draw-works motor. A simple PID loop ensures that the
WOB is brought to the reference set-point.
Summary Table:
Sensor Type Measurement Sensor Name Specification
Load cell Tension/ Weight Futek Miniature
S-Beam Load Cell (LSB200)
Load capacity ≤100 lbs
RPM Motor Speed Directly from the motor
Torque Voltage, Current Directly from the motor
Accelerometer Vibrations Wilcoxon Research
Low profile industrial accelerometer (785A)
Acceleration Range ≤80 G
Thermocouples Temperature NI Ready Made
Thermocouples (NI-745690-E002)
Temp Range 32 to 900 °F
Table 3.2 Summary of sensors used for the design and their specifications
3.2.3 DATA ACQUISITION
Sensors and transducers measure the physical phenomenon such as temperature, tension,
pressure etc. and converts into a measureable electrical signal like voltage, current etc. These
signals are transferred in to a computer by means of a Data Acquisition (DAQ) device. A DAQ
device contains several components such as Analog-Digital Converter (ADC, to manipulate
the signal to a form readable by computer), Signal Conditioner (to filter out noise and amplify
the signal if required), a Bus (computer bus which is the communication interface).
There are several commercial DAQ devices that are available in the market. Each sensor (or
each measurement) required a DAQ system to transfer the signals to computer and each
actuator requires DAQ to receive signals from the computer. We looked in to several options
for DAQ devices and have decided to go with National Instruments DAQ systems. There are
several advantages of using NI DAQ devices – 1) rugged design, accurate measurements with
integrated signal conditioning 2) a single instrument can interface measurements from

22
various sensors 3) Multiple timing engines so that data rates of different systems is not a
problem 4) LabVIEW for better data handling and data visualization.
We are using NI CompactDAQ 2-slot Chassis (Model number: NI cDAQ-9174) along with
Universal Analog Input 4 Ch Module (NI 9219) for the Data Acquisition Purposes.
Fig 3.4 Data Acquisition devices used – NI cDAQ-9174 (left) ; NI 9219

23
4. SIMULATION
With the concepts described in Section 3.1 and using the hardware mentioned in 3.2, a
control system is designed to optimize ROP and thus improve performance. An algorithm is
designed for the problem and it is simulated in software to ensure proper working, before
actually using it on the physical model. This section explains the algorithm and some of the
simulations.
4.1 ALGORITHM
Objective: As the drill pipe is drilled into the formation, the rate of penetration is affected by
several factors. There can be different types of dysfunctions encountered during drilling. The
dysfunctions are mitigated either by engineering redesign or by adjusting the drilling
parameters. The algorithm is developed for real-time corrective action using drilling
parameters based on MSE curve response. The objective of the algorithm is to minimize MSE
and thus optimize Rate of Penetration (ROP).
Variables: Weight-on-Bit (WOB) and Motor Speed (RPM) are the two parameters that are
adjusted depending on the response. WOB is adjusted using draw-works motor and RPM is
adjusted using Variable frequency drive (VFD) on the top drive.
Flow chart:
The following flow chart is the basis for the algorithm. It shows the action to be taken to
improve performance (achieve higher ROP) while drilling operation is going on. As described
in section 4.1, the dominant type of dysfunction is Whirl for which the corrective action is to
increase WOB and RPM. Bit balling and bottom-hole balling are assumed to be absent.
Torsional vibrations (Stick-slip) is identified by plotting data points and observing asymmetric
curve. Only in this case, the WOB is reduced from the current operating value. Axial vibrations
are assumed to be negligible.
Another important control system other than ROP optimization system is the Auto-Driller
Control system. The drilling is carried out automatically using a set WOB. This is achieved by
using a simple PID (Proportional Integral Derivative) Controller for the draw works system

24
(assumed first order system). Tuning for the PID controller is done using Auto-tuning function
in the software (LabVIEW). The block diagram of the system is shown in Fig 4.1.
Fig 4.1 Block Diagram of Draw works motor and weight adjustment system (Auto-Driller)

25
4.2 DATA VISUALIZATION
In this work, LabVIEW has been used to develop a simulation environment for experimental
purposes. We have chosen LabVIEW for its various advantages such as
Interactive GUI
A simple, user-friendly interface (called 'Front panel') with graphics can be developed on this
platform such that even non-technical people or floor hands can operate.
Hardware integration
NI has got powerful data acquisition tools that can acquire data from almost any type of
devices. With the help of these tools, it is possible to use the same simulated program
developed for mathematical automated models for real-world implementation in field as well
just by replacing few blocks in the program.
Advanced Control
There are several in-built functions (such as PID Auto-tuning, MPC controller among others)
in the software, Control Design and Simulation toolkit in particular, which is of high relevance
to the drilling automation applications.
The simulation is explained below.
The front panel of the LabVIEW program (called Virtual Instrument or VI) is a user-friendly
GUI that depicts the control room at the drilling rig site. Since the drilling operation is fully
automatic, there are not many parameters for the user to input in the program, other than
initialization and motor design parameters to start the simulation.
Data Visualization
The drilling operation (drill pipe drilling into the formation) is displayed as animation and
updated in real-time. Depth as measured using LVDT is used to update the display. Real-time
data is read and logged into the program. The data is displayed (synchronous with real-time)
emulating drillers control dials in the field. The data includes WOB, Motor Speed (RPM),
Torque and ROP. MSE is calculated using Teale’s equation and is displayed along with other
parameters.

26
Fig 4.3 Real-time monitoring of drilling operation (animation)

27
Fig 4.4 Real-time Data Logging – Data is recorded and displayed in real-time for parameters WOB,
RPM, Torque, ROP, MSE

28
Manual Control
It is important to have manual over-ride controls for all the operations that are automated.
This is to have a control in case of unpredictable incidents. In the drilling simulator, there are
manual controls for adjusting WOB, and RPM. The drilling operation is not carried by the auto
driller, but manually increase in depth using a joystick (Xbox 360 controller is used in this case).
Fig 4.5 Manual Override Control – Auto Driller is OFF and drill takes control of the operation by switching to manual mode
Fig 4.6 Joystick control in manual operation – The driller can carry out drilling, change WOB, RPM
and other parameters using the controller

29
Alarm System
To ensure safe operation, several alarm systems are installed such as
1. Motor Overload – Draw works
2. Motor Overload – Top Drive
3. Pump failure
4. Circulation failure
5. Sensor failure
6. Instrumentation failure
There are alerts included in the system to keep the driller aware of abnormal conditions
down-hole.
1. Excessive vibrations
2. Design limit of WOB reached
3. Sudden increase in MSE
Fig 4.7 Alarm System showing different alarm and alert settings available in the system
In addition to the alarm systems, there is an emergency shut down button to cut off entire
power system and stop the drilling operation. We have also included notifications, records
and alarm acknowledgement logs to keep track of unsafe activities.

30
Fig 4.8 Emergency Shut Down panel; Alarm Logs are also available
Remote Access
The drilling simulator can be accessed by other users from any other location over internet.
LabVIEW has different tools to accomplish this. In real-world application, the drilling program
can be hosted by a driller at the drill rig site and the program can be shared with other users
(can be supervisor at office, contractors and others). The users have the provision to monitor
the drilling activity as well as control the drilling operations from their locations through a
web browser. We have used a simple web publishing tool in LabVIEW to share the drilling
simulator with other users. This application is useful in situations where frequent access to
the rig site is not possible.
We have tried this feature on local network by hosting the drilling automation program at
http://pe-gld-105076.pe.tamu.edu:8000/Drilling_Automation.html. Users from different
locations could access (monitor in real-time) the program through a browser. There is even
provision for transferring control to any particular user.

31
4.3 SIMULATION RESULTS
The design is simulated in LabVIEW to ensure proper functioning of control systems. In the
absence of actual instruments and signals, we made use of NI-DAQmx Simulated devices to
imitate real-world instruments like sensors, actuators and data acquisition devices. The
simulated devices can be programmed to emulate required sensor (load cell, voltage input,
temperature input etc.) and generate appropriate signals.
Fig 4.9 Configuring NI DAQmx simulated device
The algorithm as explained in section 3.1 is programmed to optimize performance by
minimizing MSE using drilling parameters WOB and RPM.
Fig 4.10 shows an example response of MSE to varying drilling parameters WOB and RPM.
Since we do not have any field data, the entire data used in the simulation is fabricated and
the values have no significance. Only relative trends of the parameters is important here.
Observation 1: The simulation is started (at time = 0s) with initial WOB of 30 lbs and RPM of
200 rpm. The value of MSE observed is around 4500 ksi. Increasing WOB and RPM did not
increase the value of MSE. Instead, MSE value decreased for some period of time. This
indicates that ROP is increased and performance improved by increasing the parameters WOB

32
& RPM. They are increased to the maximum values (limited by design and power
requirements). The MSE value remained constant (at around 2500 ksi) which means that the
operation can be carried out at the maximum values.
Observation 2: At around 160 seconds, the value of MSE increased (for unknown reason, may
be because a hard rock is encountered). MSE value kept increasing when operating at the
existing parameters (WOB = 50 lbs. and RPM = 500 rpm). The drilling parameters are now
reduced to WOB = 30 lbs and RPM = 100 rpm which resulted in decrease of MSE.
Observation 3: The drilling parameters are increased again at around 250 sec. The MSE value
started decreasing with increase in WOB and RPM. This implies that the bit was performing
inefficiently earlier. The values are increased further as long as MSE did not increase. MSE did
not increase until the drilling parameters reached design limits (WOB = 50 lbs. and RPM = 500
rpm). This indicates that the bit is performing efficiently under these conditions.
Fig 4.10 Simulated MSE response to drilling parameters
1. MSE increased
2. WOB reduced
3. MSE decreased

33
The drilling parameters WOB & RPM are changed (increased or decreased) whenever there is
an increase in MSE. The change is based on the type of dysfunction encountered down-hole.
The types of dysfunctions and corrective action to be taken for each of the dysfunctions is
explained in section 3.1. The algorithm is designed to control the drilling parameters as per
the required response for a particular dysfunction.

34
5. SAFETY
The safety of personnel involved in any operation should always be the first priority. By
removing the physical involvement during the operation, fully automated control drilling
system will keep personnel from the hazardous situation. Not only this is advantageous in
obvious safety reasons, but will be more economical in today’s environment as the liability
cost for personnel is very costly.
The automatic drilling system developed in this project operates automatically for most of its
tasks. Manual intervention is not required for normal drilling operation. Physical labor is
required only during rig setup, transportation and installing machinery. From the statistics
obtained from US department of labor, majority of safety concerns are due to improper
handling of machinery or equipment. Safety in the system can be ensured by limiting human
intervention during operations as much as possible. This is one of the biggest motivations for
implementing automated drilling systems in the field.
Fig 5.1 Distribution of accidents/injuries from work in drilling oil and gas wells Source: www.oshasafetyconference.org dt. Dec’ 2012
Safety (and health) Hazards during operation:
Chemical Hazards: Dust (cuttings)
Energy Hazards: Electricity and Mechanical
Machine Hazards: Rotating parts (motors, pipes), heavy objects
Other Hazards: Noise

35
Keeping these hazards in mind, safety operating procedures have been designed to ensure
operational safety of plant. Major safety concerns that are relevant to our application
(miniature automated drilling) have been identified and listed below. Alarm systems and
responses are designed for some critical issues. We have already discussed the alarm systems
in section 4.3.1. This list is not comprehensive. Since the system doesn’t require a circulation
system (for pressure management down-hole) or making connections, many of the safety
concerns encountered in actual drilling operations can be ignored here. Now we briefly
explain safety concerns and preventive action/ safe operating procedures to avoid each of
the concerns.
Damage to Rig
Motor Failure - We have two motors (one each for Draw works and Top Drive) in the
system. The motors can fail due to over-heating (overload) or power failure or for
some other unknown reason. An alarm system is designed to detect motor failure
which triggers immediate stoppage of drilling operation.
String Buckling - This can occur due to excessive vibrations or torque. The control
system (for optimal performance) mitigates dysfunctions. In addition, Alerts
(Warnings) are generated when excessive vibrations are observed in the drill string,
for the driller to respond if required.
Bit Damage - Bit damage is unlikely in this application because the total depth to be
drilled is only 2 feet and WOB & RPM values are not abnormally high. The only
possibility of bit damage is due to interfacial severity. The algorithm makes sure that
RPM is reduced in such situation to avoid bit damage (WOB is not reduced because
max design limit is only 50 lbs., more details in the Interfacial severity section in 4.1).
Software/ Communication Error - Alarm systems are designed to detect sensor or
instrumentation failure and trigger stoppage of drilling operation. The operation can
be restarted in manual mode or in automatic mode after repairs and maintenance.

36
Damage to Personnel
Struck by object - The rig consists of a huge mechanical structure (derrick), heavy
objects (load), rotating objects (motors and drill pipe) etc. Care must be taken while
handling such objects. Wear proper PPE (Personal Protective Equipment) including
hand gloves, safety goggles, steel toe boots, etc. during rig setup.
Electric Shock - The power system of rig includes electric power source to motors,
pump, sensors communication and data acquisition devices. Wear appropriate PPE
while handling equipment. Proper cabling (no loose/open wiring) and grounding
should be ensured before switching on the main power supply. Electrical devices
should be properly insulated.
Incident of Fire
Overload of motor - Tripping system for overload of motor ensures that the
equipment do not operate beyond specified capacity. The tripping system is
synchronized with the alarm system in software and notifies the driller of the incident.
Overheating of battery / electronics - Sensors and other electronics are selected to
operate for sufficient time without requirement for cooling. But if a sensor or any
other device fails resulting in loss of communication, alarm system ensures stoppage
of operation. If required, the electronics can be cooled using compressed air or a fan.
Insufficient cooling - A dedicated circulation system (cool air/ water) is provided to
cool the bit down-hole and also for cuttings transport. The circulation is provided at
sufficient flow rate throughout the operation.
Fire Triangle - Since we are not drilling an actual oil well, we do not have any obvious
fuel or ignition source. But in case of an unexpected incident, an Emergency Shut
down button is provided to cut-off the power and stop further operations. A fire
extinguisher is also provided at the rig site.

37
The above points are depicted in a flow chart as suggested by Mr. Torbjorn Pederson :
Fig 5.2 Flow Chart showing safety concerns
38
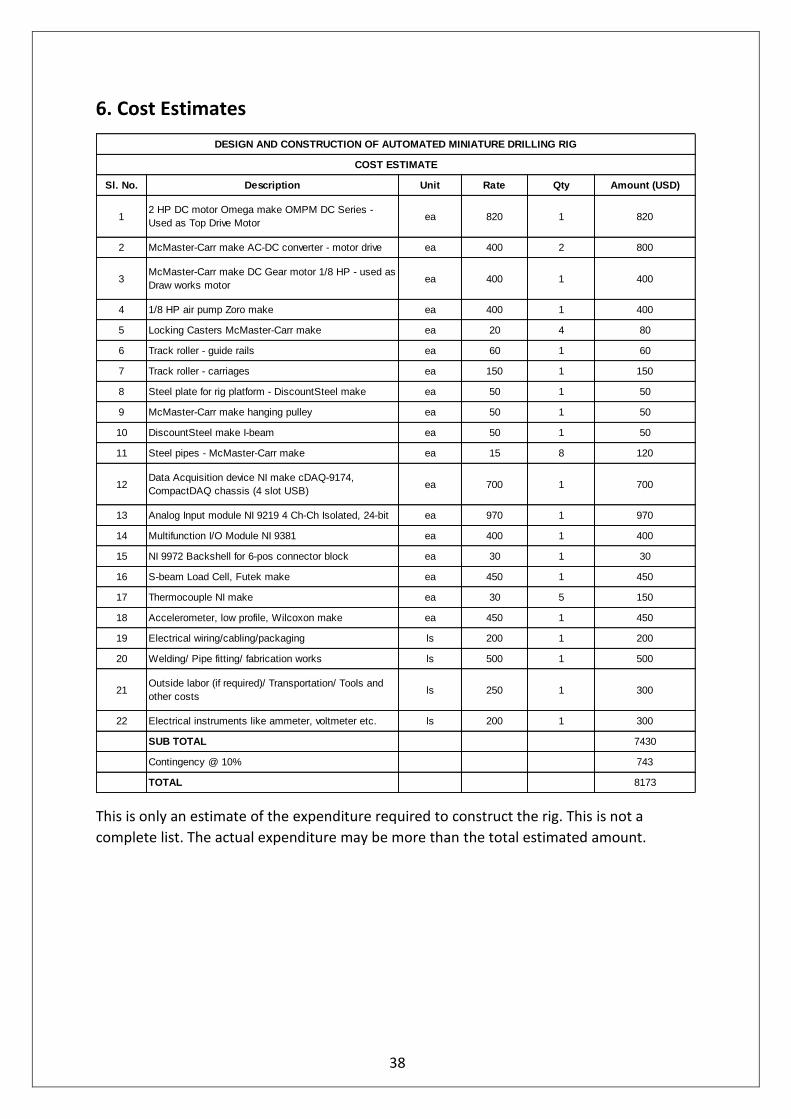
6. Cost Estimates
This is only an estimate of the expenditure required to construct the rig. This is not a
complete list. The actual expenditure may be more than the total estimated amount.
Sl. No. Description Unit Rate Qty Amount (USD)
12 HP DC motor Omega make OMPM DC Series -
Used as Top Drive Motorea 820 1 820
2 McMaster-Carr make AC-DC converter - motor drive ea 400 2 800
3McMaster-Carr make DC Gear motor 1/8 HP - used as
Draw works motorea 400 1 400
4 1/8 HP air pump Zoro make ea 400 1 400
5 Locking Casters McMaster-Carr make ea 20 4 80
6 Track roller - guide rails ea 60 1 60
7 Track roller - carriages ea 150 1 150
8 Steel plate for rig platform - DiscountSteel make ea 50 1 50
9 McMaster-Carr make hanging pulley ea 50 1 50
10 DiscountSteel make I-beam ea 50 1 50
11 Steel pipes - McMaster-Carr make ea 15 8 120
12Data Acquisition device NI make cDAQ-9174,
CompactDAQ chassis (4 slot USB)ea 700 1 700
13 Analog Input module NI 9219 4 Ch-Ch Isolated, 24-bit ea 970 1 970
14 Multifunction I/O Module NI 9381 ea 400 1 400
15 NI 9972 Backshell for 6-pos connector block ea 30 1 30
16 S-beam Load Cell, Futek make ea 450 1 450
17 Thermocouple NI make ea 30 5 150
18 Accelerometer, low profile, Wilcoxon make ea 450 1 450
19 Electrical wiring/cabling/packaging ls 200 1 200
20 Welding/ Pipe fitting/ fabrication works ls 500 1 500
21Outside labor (if required)/ Transportation/ Tools and
other costsls 250 1 300
22 Electrical instruments like ammeter, voltmeter etc. ls 200 1 300
SUB TOTAL 7430
Contingency @ 10% 743
TOTAL 8173
COST ESTIMATE
DESIGN AND CONSTRUCTION OF AUTOMATED MINIATURE DRILLING RIG

39
Appendix 1 (a) – Mechanical Drawings

40
Models developed in Solidworks software. (Drawings not to scale)

41
Appendix 1 (b) – Electrical Drawings
Circuit connections

42
Appendix 1 (c) – P&ID Drawing
Single flow line – Fluid circulation to cool the bit downhole and remove cuttings

43
References
[1] Thorogood, J., Aldred, W. D., Florence, F., and Iversen, F. Drilling Automation:
Technologies, Terminology, and Parallels With Other Industries. - 2010, Society of
Petroleum Engineers. doi:10.2118119884-PA.
[2] Eustes, A. W. The Evolution of Automation in Drilling. - 2007, January 1. Society of
Petroleum Engineers. doi:10.2118111125-MS.
[3] Dupries, F. E. Comprehensive Drill Rate Management Process to Maximize Rate of
Penetration. SPE 102210 presented at SPE Annual Technical Conference and
Exhibition, San Antonio, USA, 24-27 September 2006
[4] Teale, R. The Concept of Specific Energy in Rock Drilling, Intl. J. Rock Mech. Mining Sci.
(1965) 2, 57-73
[5] Dupriest, F.E., Keoderitz, W. Maximizing Drill Rates with Real-Time Surveillance of
Mechanical Specific Energy, SPE paper No.92194 presented at annual Drilling
Conference, Amsterdam, Netherlands, 23-25 February, 2005
[6] Florence, F.R. ; Burks, J. New surface and down-hole sensors needed for oil and gas
drilling I2MTC, 2012 IEEE International DOI: 10.1109/I2MTC.2012.6229568,
Publication Year: 2012 , Page(s): 670 – 675
[7] Cayeux, E., Daireaux, B., Dvergsnes, E. W., and Florence, F. Toward Drilling Automation:
On the Necessity of Using Sensors That Relate to Physical Models. - June 1, 2014.
Society of Petroleum Engineers. doi:10.2118163440-PA.
[8] Iversen, F., Gressgard, L. J., Thorogood, J., Balov, M. K., and Hepso, V. Drilling
Automation: Potential for Human Error. - Society of Petroleum Engineers.
doi:10.2118151474-PA. March 1, 2013.
[9] Bourgoyne, A. T., Millheim, K. K., Chenevert, M. E., & Young, F. S. (1986). Applied
drilling engineering.