DS Smith Plc Insight. Innovation. · ANNUAL REPORT AND ACCOUNTS 2015 Insight ... Annual Report and...
140
ANNUAL REPORT AND ACCOUNTS 2015 Insight. Innovation. Leadership.
-
Upload
truongdung -
Category
Documents
-
view
223 -
download
0
Transcript of DS Smith Plc Insight. Innovation. · ANNUAL REPORT AND ACCOUNTS 2015 Insight ... Annual Report and...

ANNUAL REPORT AND ACCOUNTS 2015
Insight.Innovation.Leadership.
DS Smith Plc
Annual Report and Accounts 2015

DS Smith is a leading provider of corrugated packaging in Europe and of specialist plastic packaging worldwide, supported by paper and recycling operations. We operate across 32 countries and employ around 24,700 people.
In this report
Strategic Report1 Chairman’s Statement2 At a Glance4 Chief Executive's Q&A 7 Packaging in a Changing Market14 Our Business Model18 Supply Cycle Thinking19 Our Vision and Strategy20 Key Performance Indicators22 Chief Executive’s Review26 Operating Review28 Financial Review33 Sustainability36 Employees39 Principal Risks
Governance44 Introduction to Corporate Governance46 Board of Directors and Company Secretary48 Directors’ Governance Report58 Audit Committee Report62 Nomination Committee Report64 Remuneration Committee Report 66 Policy 70 Annual Remuneration Report79 Directors’ Responsibilities Statement
Financial Statements80 Independent Auditor’s Report84 Consolidated Financial
Statements and Notes130 Company Balance Sheet and Notes135 Five-Year Financial Summary136 Shareholder Information
Explore our website www.dssmith.com
p07Leading in a
rapidly changing market

Strategic Report 1
dssmith.com
Chairman's Statement
PERFORMANCEI am delighted to report another year of excellent performance by DS Smith. We have delivered strong growth in volumes, profits, margins and returns, in a market that is still tough.
I am particularly pleased with the way that the business has continued to re-shape. Since the acquisition of SCA Packaging in July 2012, which transformed the business into a genuinely pan-European business, the principal focus has been on integration and the delivery of substantial synergies. With that programme complete, over the last 12 months DS Smith has acquired businesses in Italy, Spain, and in the high growth region of south eastern Europe. These businesses are focused on our core enterprise of recycled packaging. We have also been investing in new sites, such as those for the plastics business in both the US and Europe. At the same time, some non-core businesses have been disposed of, releasing capital that can be deployed elsewhere.
While we have done this, we have continued to deliver on our key performance indicators, with our margin now at the top end of our target range. I am delighted to confirm that this medium-term target is now being raised by 100 basis points, reflecting both the performance of the business and also our aspiration for the future.
DIVIDENDThe Board considers the dividend to be an important component of shareholder returns and, as such, has a policy to deliver a progressive dividend, where dividend cover is between 2.0 and 2.5 times, through the cycle. For the year 2014/15, the Board recommends a final dividend of 7.7 pence, which together with the interim dividend of 3.7 pence gives a total dividend for the year of 11.4 pence per share (2013/14: 10.0 pence per share). This represents an increase of 14 per cent on the prior year and cover of 2.1 times in relation to earnings per share (before amortisation and exceptional items) (adjusted EPS), in line with our policy.
Looking back over the past five years I am particularly proud of the consistent growth and returns to shareholders. Adjusted EPS has grown at an average rate of 34 per cent each year, with the dividend per share growing similarly at 29 per cent.
Total shareholder return, which is a measure combining growth in the share price with the benefit of dividends, has grown 343 per cent, considerably out-stripping the FTSE 250 at 93 per cent over the same five year period.
OUTLOOKAs usual, on behalf of the Board, I would like to thank all my colleagues throughout DS Smith for their dedication and hard work over the past year. That commitment has resulted in the great results for the year, and the growth in market share that we are seeing across our business. We see significant opportunities for the business in the coming year and are confident of future success.
Gareth DavisChairman
See p 44 for more information on Governance
Total shareholder return
DS Smith FTSE 250 Index
+343%
+93%
2010 2011 2012 2013 2014 2015
100
200
300
400
500
" I am delighted to report another year of excellent performance by DS Smith. We have delivered strong growth in volumes, profits, margins and returns, in a market that is still tough."

14.613.0
12.2
13/14 14/1512/13
24.5
21.4
17.1
13/14 14/1512/13
2 Strategic Report
Annual Report & Accounts 2015
At a Glance
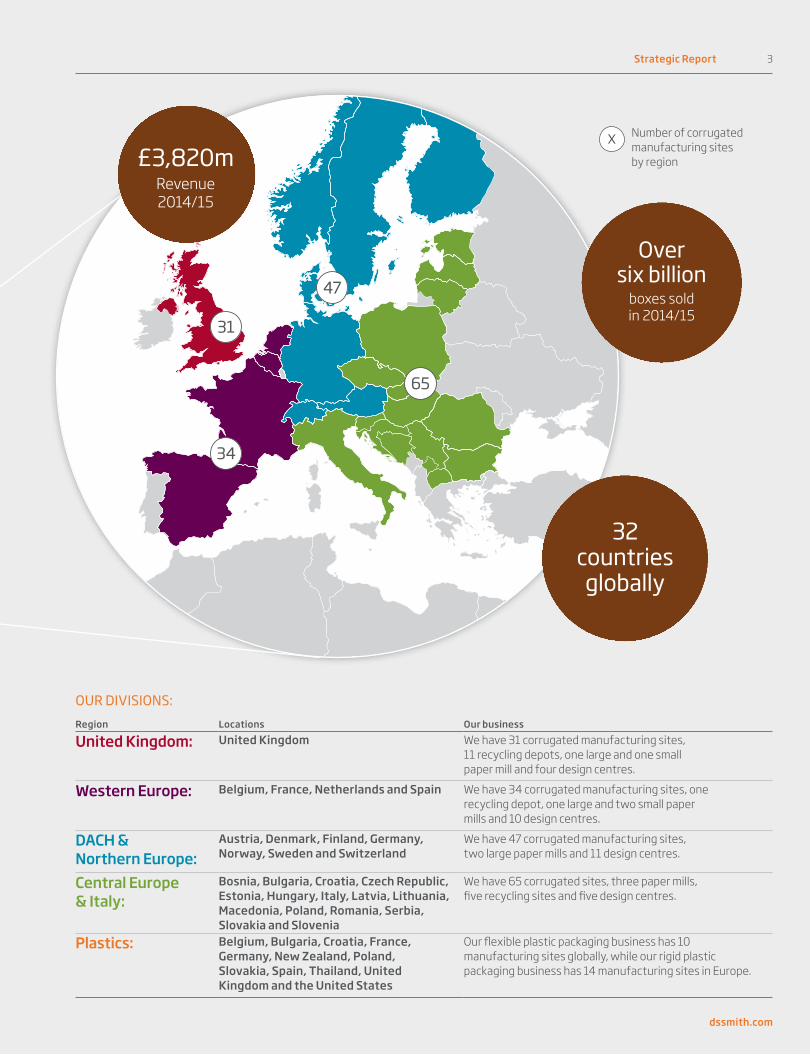
Expanding our footprint and leadership position.DS Smith now operates across 32 countries and employs around 24,700 people, having acquired businesses in Spain, Italy and in south eastern Europe over the last year. These actions are part of our efforts to increase the scale and quality of the business in order to achieve our vision — to become the leader in recycled packaging for consumer goods.
Operating profit (£m)1
£335mReturn on capital employed (%)1
14.6%Earnings per share (p)1
24.5pKEY FINANCIAL HIGHLIGHTS
335307
249
13/14 14/1512/13
1 Adjusted, before amortisation and exceptional items
PlasticsPackaging
Strategic Report 3
dssmith.com
Number of corrugated manufacturing sites by region
Over six billion
boxes sold in 2014/15
32 countries
globally
£3,820mRevenue 2014/15
OUR DIVISIONS:Region Locations Our business
United Kingdom: United Kingdom We have 31 corrugated manufacturing sites, 11 recycling depots, one large and one small paper mill and four design centres.
Western Europe: Belgium, France, Netherlands and Spain We have 34 corrugated manufacturing sites, one recycling depot, one large and two small paper mills and 10 design centres.
DACH & Northern Europe:
Austria, Denmark, Finland, Germany, Norway, Sweden and Switzerland
We have 47 corrugated manufacturing sites, two large paper mills and 11 design centres.
Central Europe & Italy:
Bosnia, Bulgaria, Croatia, Czech Republic, Estonia, Hungary, Italy, Latvia, Lithuania, Macedonia, Poland, Romania, Serbia, Slovakia and Slovenia
We have 65 corrugated sites, three paper mills, five recycling sites and five design centres.
Plastics: Belgium, Bulgaria, Croatia, France, Germany, New Zealand, Poland, Slovakia, Spain, Thailand, United Kingdom and the United States
Our flexible plastic packaging business has 10 manufacturing sites globally, while our rigid plastic packaging business has 14 manufacturing sites in Europe.
X
31
47
65
34

4 Strategic Report
Annual Report & Accounts 2015
Chief Executive's Q&A
We are leading change by providing innovative packaging solutions.
You joined DS Smith as CEO in May 2010 — over five years ago. What has been achieved in that time?The business has changed a great deal over the last five years, but there remains plenty of opportunities and a lot more to do.
At the time I joined, DS Smith was principally an Anglo-French business, with substantial paper mills, a large business in office products supply and margins of 4.5 per cent. I set out a simple strategy, focused on our customers, to design and manufacture recycled packaging with the high quality, service and innovation that customers want. The goal of that strategy was to improve our financial performance and the consistency of our returns.
This idea was summed up in the key pillars of our strategy — to delight our customers, to realise the potential of our people, to double the size and profitability of the business, and to lead the way in recycling.
Five years on, we have done a huge amount. We have made a number of acquisitions, so that the corrugated business is now genuinely pan-European, in 27 countries. We have also disposed of parts of the business that did not fit. In financial terms, since 2009/10 we have doubled revenues, close to doubled our 2010 margins and nearly tripled our earnings per share.
We have achieved this by winning market share, which is the most significant test of whether you offer an attractive proposition
Miles RobertsGroup Chief Executive
Strategic Report 5
dssmith.com
to customers. We have invested in employee programmes to engage everyone in the organisation. We have also invested in our recycling business as well as our own corporate sustainability.
See p 20 for more about our key performance indicators
Does that mean that everything is done?DS Smith is leading change in the industry, not just within our own organisation. The changes are driven by our customers and their customers’ changing needs, which we see as continuing to evolve, so I believe there is a great deal further forward for DS Smith to travel, as we continue to invest in our business.
The business is cash generative, which means that we have choices on how to invest for further growth. We are investing significantly in our plants and adding new technology to produce high quality packaging, for example display units. We are investing in rolling out design centres across Europe so that all our customers have a centre within easy reach where we can develop innovative solutions for them.
In Europe, while we have a network of plants that broadly cover the full region, there are areas where we would like a greater presence.
There is also the challenge of integrating the businesses we have acquired recently — Andopack in Spain, for example, and the Duropack businesses in south eastern Europe. Making the acquisition is just the start — we then bring in our ways of working, our innovation, links to our design centres — in order to make the acquired businesses as successful as possible.
Is bigger always better in the corrugated industry?The scale of DS Smith gives us some clear advantages versus our competitors. First, we are able to offer solutions to large customers across Europe. That is
something that can only be achieved with a pan-European manufacturing network like ours. Large pan-European customers are realising that it is more efficient for them to have only a small number of corrugated suppliers rather than many, because we can offer consistency and quality that is otherwise difficult to achieve.
Second, we have the size to be able to invest in innovation and research, with the benefit shared across the business. For example, we have invested substantially in the quality of the paper we manufacture, to allow us to build the best possible corrugated boxes. I believe that, in the case of DS Smith, scale and quality of business therefore go hand-in-hand.
When you talk about “leading change” in the industry, what does that mean? We put our customers at the heart of our operation and focus on what is important to them and delivers value for them. Corrugated boxes fulfil a role far wider than just transit. Packaging touches many points in the supply chain — so it is important how easily it works on our customers’ packaging lines, how it can be used to maximise the transit logistics, and then, at the end, how the packaging helps our customers sell more too, by presenting the product in a way that attracts the attention of the consumer and is easy to shop. Good retail-ready packaging (packaging that is used in a store) can save the retailers money too — by reducing shelf-stacking time.
At DS Smith we think that this whole supply cycle is important, and that to make packaging that fulfils the needs of our customer, you need the skills to address all these areas, in innovation, design and manufacturing. This is a big change for the industry and we are proud to lead this change in becoming more customer focused.
See p 18 for more about how we analyse the supply cycle
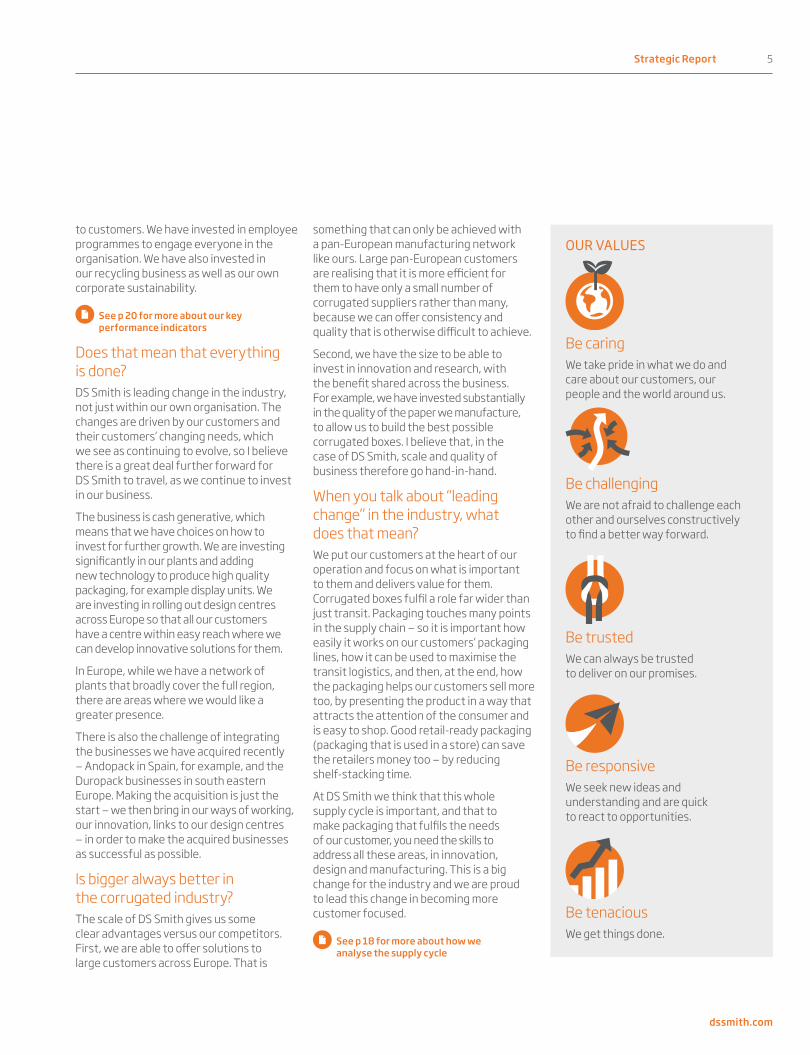
OUR VALUES
Be caringWe take pride in what we do and care about our customers, our people and the world around us.
Be challengingWe are not afraid to challenge each other and ourselves constructively to find a better way forward.
Be trustedWe can always be trusted to deliver on our promises.
Be responsiveWe seek new ideas and understanding and are quick to react to opportunities.
Be tenacious We get things done.

6 Strategic Report
Annual Report & Accounts 2015
Chief Executive's Q&A continued
Why are you changing your return on sales target in your financial key performance indicators (KPIs)? This year we have delivered a return on sales margin of 8.8 per cent, near the top of our range of 7 to 9 per cent. The Board now believes we can achieve an additional 100 basis points, in the medium-term. This increase reflects two changes to our business. First is the quality of our whole offering, from innovation, design and manufacture, adding more value across the whole supply chain for our customers. Second is the scale of our business, which means, among other things, that the costs and benefits of innovation, research and design are shared.
See p 20 for more about our KPIs
Consumer behaviour has changed significantly over the last few years, with more products bought on-line for example. Is this an opportunity or a threat to DS Smith?We see the changing consumer and retail trends as an opportunity. More and more is expected of the humble corrugated box and packaging now needs to be adaptable to different retail environments from supermarkets, a convenience store, a discounter, to an on-line distributor. Each has slightly different requirements, which means complexity. We provide solutions for these challenges. We have teams who work on smart designs for each format, and these solutions are shared throughout the organisation. That gives us a commercial advantage.
See p 11 for more about packaging for different retail channels
The returns for shareholders have been excellent over the last five years – how has the business’s success benefited employees?Employees are our key asset. We have made health and safety a top priority and have seen a 46 per cent drop in our lost-time accident rate over the last five years. We have a programme called OWN IT! that aims to help our employees understand how their own targets and actions contribute to the performance of the business as a whole. At the same time we encourage share ownership among our employees, and in 2014 launched an award-winning SAYE scheme across 23 countries.
I am also proud of the work that DS Smith is undertaking, through our Charitable Foundation, to reach out to both new employees and potential employees. In the last 12 months we have entered into a partnership with Nestlé in its Alliance 4 YOUth programme — to give opportunities to young people across Europe to get that all-important first job or work experience. We are now also entering our third year of sponsoring 17 and 18-year-olds interested in engineering, through the Arkwright Scholarship programme.
What does the circular economy mean to DS Smith?We are proud to be the largest recycler of paper and corrugated board in the UK, and with a substantial position in that market in Europe. Not only is it a good business, but it provides an essential service to the economy, as there are not enough trees for paper only to be made from new fibre. As well as providing an essential, reliable collection service for our customers, we will work with them to make sure that they are recovering all their used paper and corrugated board, rather than sending it to landfill. That makes sense for them, for us, and is a benefit to the whole environment.
Annual Report & Accounts 2015
Looking at the past year, what are you most proud of?I am proud of how the business balance has delivered another good set of financial results, despite difficult economic conditions. That has come from excellent work by our commercial teams throughout the organisation, working to design and manufacture the best packaging possible. We have further developed the shape of the business with both acquisitions and disposals, and invested in our own assets and network at the same time. This has all been delivered thanks to our employees each one of whom takes responsibility for delivering their part of our plan each year — I am grateful to them all.
View our ‘Supply Cycle Thinking’ at www.dssmith.com/company/who-we-are/supply-cycle-strategists

Strategic Report 7
dssmith.com
Strategic Report 7
dssmith.com
Strategic Report 7
Packaging is more relevant than ever in a rapidly changing market.
Packaging performs a number of functions in the retail environment and supply chain. Well designed, attractive packaging is essential to ensure product availability, identification and accessibility, as more buying decisions are made in-store.We provide insight, innovation, design and manufacturing expertise to produce packaging that fulfils the requirements of the changing market.
Our market insights
Consumer behaviour and the retail environment are changing
Requirements for packaging are changing
We create innovative solutions for changing customer needs
p 8
p 10
p 12
Packaging in a Changing Market

8 Strategic Report
Annual Report & Accounts 2015Annual Report & Accounts 2015
8 Strategic Report
Strategic Report 9
dssmith.comdssmith.com
Strategic Report 9
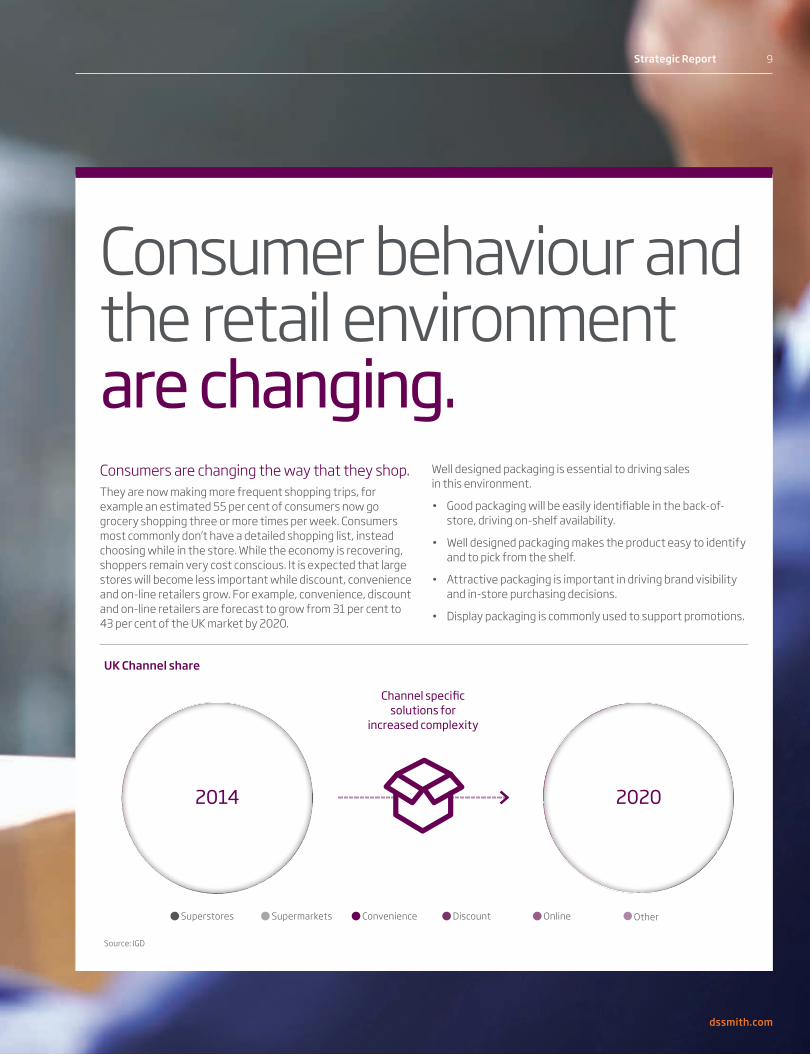
Consumer behaviour and the retail environment are changing.Consumers are changing the way that they shop.They are now making more frequent shopping trips, for example an estimated 55 per cent of consumers now go grocery shopping three or more times per week. Consumers most commonly don’t have a detailed shopping list, instead choosing while in the store. While the economy is recovering, shoppers remain very cost conscious. It is expected that large stores will become less important while discount, convenience and on-line retailers grow. For example, convenience, discount and on-line retailers are forecast to grow from 31 per cent to 43 per cent of the UK market by 2020.
Well designed packaging is essential to driving sales in this environment.
• Good packaging will be easily identifiable in the back-of-store, driving on-shelf availability.
• Well designed packaging makes the product easy to identify and to pick from the shelf.
• Attractive packaging is important in driving brand visibility and in-store purchasing decisions.
• Display packaging is commonly used to support promotions.
Superstores Supermarkets Convenience Discount Online Other
Channel specific solutions for
increased complexity
Source: IGD
UK Channel share
2014
42%
20%
21%
6%
4%5%
2020
35%
18%
22%
12%
9%
5%

10 Strategic Report
Annual Report & Accounts 2015Annual Report & Accounts 2015
10 Strategic Report

Strategic Report 11
dssmith.comdssmith.com
Strategic Report 11
Requirements for packaging are changing.
Supermarkets —large box displays required for volume
Discounters — high quality packaging required, often with different variants in one box
Packaging is no longer one-size-fits-all. Packaging needs to fulfil its purpose of transporting and protecting its product. It also needs to drive availability, accessibility and visibility in a range of store settings — large store, convenience store, discounters, plus picking for on-line delivery and wholesale distributors.
Supermarkets require large unit sizes to deal with the volume being purchased, while convenience stores require narrow
units in order to maximise availability. Discounters require very high quality packaging, with a single unit containing a range of brand variants, in order to maximise efficiency in stacking shelves.
For any branded product, its presentation at the retailer is key, so packaging must support and enhance the brand proposition. Retail-ready packaging achieves this through the quality of materials and printing, the interaction between the primary product and the outer packaging, and the prominence of the brand logo.
Convenience — small format packaging required to give range

12 Strategic Report
Annual Report & Accounts 2015Annual Report & Accounts 2015
12 Strategic Report

Strategic Report 13
dssmith.comdssmith.com
Strategic Report 13
We create innovative solutions for changing customer needs. DS Smith provides solutions based on our insight, innovation, design and manufacturing expertise. Our overall aim is to create packaging that reduces costs, drives sales and manages risk.For example, for Ritter Sport chocolate, we have designed a display case that can be automatically filled and stacked, rather than stacked and assembled by hand, and can be configured for either a quarter or a half-sized pallet. The construction is modular, allowing for different size displays while keeping the construction simple. This makes it ideal for a range of store sizes while reducing costs for the manufacturer. The display is a highly attractive unit which complements the branding of the primary product — the bars of chocolate — matching the colours and supporting the quality of the brand.

14 Strategic Report
Annual Report & Accounts 2015
Balance of our combined businesses1 (million tonnes)Corrugated packaging is our primary output:
Our Business Model
We create value by bringing together a collection of skills, all centred around the design and manufacture of packaging.OUR BUSINESS MODEL
DESIGN
MANUFACTURE INNOVATION
INSIGHT
PAPER
RECYCLING
CORRUGATED PLASTICS
PACKAGING
3.3
2.4
Corrugated Packaging
Corrugated Paper Manufacture
Fibre Sourcing/ Recycling 5.4
1 Proforma based on 2014/15 sales volumes, plus the estimated full-year effect of acquired businesses (Andopack and Duropack), less the Nantes mill disposal.

Strategic Report 15
dssmith.com
Our business model is focused on packaging. We bring insight and innovation, and use this to design the optimum packaging for our customers’ supply chains, and manufacture it to the highest standard.
To support the production of high quality corrugated packaging, we manufacture paper and in turn have a recycling business to source fibre for this activity. We design and manufacture specialised paper grades to produce the best packaging possible.
We also design and manufacture certain types of speciality plastic packaging, in particular plastic bags and taps for bag-in-box packaging and rigid crates for bottled liquids.
Unless otherwise specified, all data regarding our operations, including sites, volumes and employee numbers include the Duropack business, acquired on 31 May 2015.
OUR BUSINESSES
DS Smith designs and manufactures corrugated packaging. We focus particularly on packaging for fast-moving consumer goods, such as grocery products, which need large volumes of high quality packaging to complement branded products with requirements changing frequently.
The remainder of our business is for industrial products, other consumer products and other uses, such as packaging for on-line deliveries. Industrial packaging is often very high precision and involves complex designs.
We source used paper and old corrugated cases (OCC) from both retailers and traders. The fibre is principally used by our own paper mills to make recycled paper, with the remainder sold to other paper manufacturers in both Europe and globally. We also offer a full recycling service to cover other materials such as glass and metals, which we then recycle in partnership with subcontractors. DS Smith is different to other recyclate collectors because we do not operate landfill sites — our sole focus is on recycling, with a target of helping our customers achieve zero waste. In 2014/15, we expanded our operations by taking our ownership of Italmaceri to 100 per cent. The acquisition of Duropack on 31 May 2015 has further increased our recycling capabilities in south eastern Europe.
DS Smith manufactures recycled paper, principally corrugated case material (CCM) or testliner, which is the paper used to make corrugated board. We also make some other grades of paper, such as core board and plasterboard liner. The majority of the CCM that we make is used by our own packaging business, with the remainder sold externally. All other grades are sold externally. The acquisition of Duropack on 31 May 2015 has added a further two testliner mills, both in south eastern Europe.
DS Smith has two parts to its plastics business:
Flexible packaging and dispensingDS Smith designs and manufactures plastic bags and taps and fitments for use in bag-in-box packaging for liquids. Our products are used for transportation of beverages, concentrates, chemicals and pharmaceuticals. Bag-and-tap solutions can be used for industrial containers, for dispensing beverages in restaurants or as an end-product, such as a wine box. Our flexible packaging business operates globally.
Rigid packagingWe design and manufacture rigid plastic packaging products for the transit of beverages, healthcare products, automotive products and in retail. This business operates in Europe.
Corrugated Packaging Recycling Paper
Plastic Packaging

16 Strategic Report
Annual Report & Accounts 2015
Our Business Model continued
Corrugated Packaging
27 countries across Europe Consultancy services in Europe, Asia and the US177 manufacturing sites30 design centresc. 3.3 million tonnes of corrugated packaging per annumc. 19,400 employees£6 million investment in research and development 2014/15
HOW WE CREATE VALUE We seek to help our customers reduce their costs, sell more, and manage their risk. We are able to do this through our skills in innovation, design and manufacture, and insight into consumer behaviour in the retail environment. We are able to invest in the skills necessary to deliver this due to our scale, and we offer our solutions on a pan-European basis.
We work with our customers, analysing every point where packaging interacts with their activities, and considering how it might be optimised. For example, we optimise the box strength for stacking in a lorry, and optimise the design for speed on the packing line, on to how easily it can be opened and displayed once in store. We also look at how packaging works best once on a retailer’s shelf, in order to drive sales and improve the handling costs for the retailer. Once a box is used, it then needs to be easily recycled, and the journey begins again.
To achieve this, we employ a range of skills. We start with analysing what the customer needs from the packaging in terms of physical performance across the supply chain, and we design suitable packaging based on that specification. Our paper business works in close collaboration with our corrugated packaging business to develop high performance paper that best suits the needs of the packaging designers and the manufacturing process. We also work with our customers and supply our own insight on how packaging can maximise sales by maximising availability within store, through brand visibility and ease of use.
We describe this approach as “Supply Cycle Thinking”.
See p 18 for more on supply cycle thinking
Our scale gives us a commercial advantage and allows us to deliver this quality of service sustainably. Our ability to provide pan-European solutions, via our extensive
manufacturing base, is a key differentiator compared to many competitors. We work with leading FMCG and industrial customers to supply packaging to their own network of factories, with guarantees for service and quality that apply across the business. For example, our customers know that the packaging for their branded product will be in precisely the correct specified colour, whether it has been manufactured in the UK, Spain, Sweden or Romania. This is all part of our strategic commitment to delight our customers.
Our scale also allows us to invest in research, innovation and design, for example our network of design centres. The benefit and costs are then shared across the business. We are therefore able to offer a high standard of product while maintaining competitive pricing. This is key to our success with customers, as demonstrated by our consistent volume growth ahead of market growth.
More Sales Managed Risk
Lower Cost
Strategic Report 17
dssmith.com
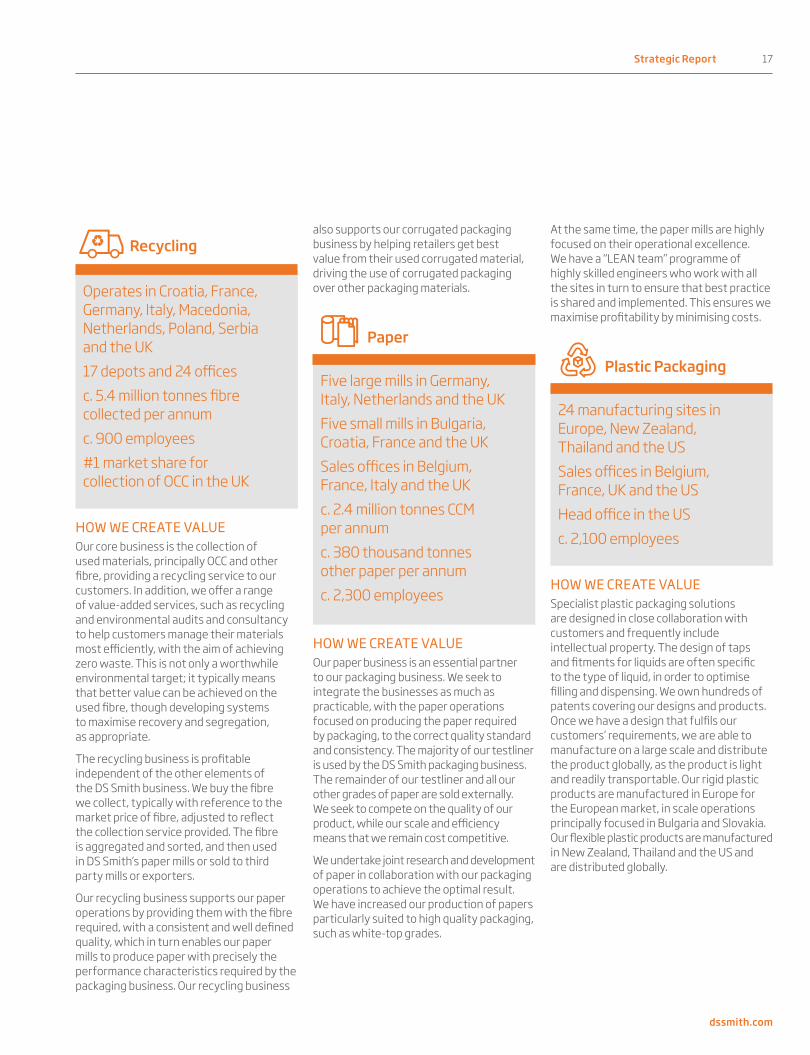
At the same time, the paper mills are highly focused on their operational excellence. We have a “LEAN team” programme of highly skilled engineers who work with all the sites in turn to ensure that best practice is shared and implemented. This ensures we maximise profitability by minimising costs.
Plastic Packaging
24 manufacturing sites in Europe, New Zealand, Thailand and the USSales offices in Belgium, France, UK and the USHead office in the USc. 2,100 employees
HOW WE CREATE VALUE Specialist plastic packaging solutions are designed in close collaboration with customers and frequently include intellectual property. The design of taps and fitments for liquids are often specific to the type of liquid, in order to optimise filling and dispensing. We own hundreds of patents covering our designs and products. Once we have a design that fulfils our customers’ requirements, we are able to manufacture on a large scale and distribute the product globally, as the product is light and readily transportable. Our rigid plastic products are manufactured in Europe for the European market, in scale operations principally focused in Bulgaria and Slovakia. Our flexible plastic products are manufactured in New Zealand, Thailand and the US and are distributed globally.
Recycling
Operates in Croatia, France, Germany, Italy, Macedonia, Netherlands, Poland, Serbia and the UK17 depots and 24 officesc. 5.4 million tonnes fibre collected per annumc. 900 employees#1 market share for collection of OCC in the UK
HOW WE CREATE VALUE Our core business is the collection of used materials, principally OCC and other fibre, providing a recycling service to our customers. In addition, we offer a range of value-added services, such as recycling and environmental audits and consultancy to help customers manage their materials most efficiently, with the aim of achieving zero waste. This is not only a worthwhile environmental target; it typically means that better value can be achieved on the used fibre, though developing systems to maximise recovery and segregation, as appropriate.
The recycling business is profitable independent of the other elements of the DS Smith business. We buy the fibre we collect, typically with reference to the market price of fibre, adjusted to reflect the collection service provided. The fibre is aggregated and sorted, and then used in DS Smith’s paper mills or sold to third party mills or exporters.
Our recycling business supports our paper operations by providing them with the fibre required, with a consistent and well defined quality, which in turn enables our paper mills to produce paper with precisely the performance characteristics required by the packaging business. Our recycling business
also supports our corrugated packaging business by helping retailers get best value from their used corrugated material, driving the use of corrugated packaging over other packaging materials.
Paper
Five large mills in Germany, Italy, Netherlands and the UKFive small mills in Bulgaria, Croatia, France and the UK Sales offices in Belgium, France, Italy and the UKc. 2.4 million tonnes CCM per annumc. 380 thousand tonnes other paper per annumc. 2,300 employees
HOW WE CREATE VALUE Our paper business is an essential partner to our packaging business. We seek to integrate the businesses as much as practicable, with the paper operations focused on producing the paper required by packaging, to the correct quality standard and consistency. The majority of our testliner is used by the DS Smith packaging business. The remainder of our testliner and all our other grades of paper are sold externally. We seek to compete on the quality of our product, while our scale and efficiency means that we remain cost competitive.
We undertake joint research and development of paper in collaboration with our packaging operations to achieve the optimal result. We have increased our production of papers particularly suited to high quality packaging, such as white-top grades.

18 Strategic Report
Annual Report & Accounts 2015
Supply Cycle Thinking
Consumer
Recycling
DS Smith
Manufacturer
Logistics provider
Regional distribution
centresShop
SUPPLY CYCLE
Transport cost
reductions
Faster packing
lines
Cost savings
More sales
More recycling
OUR CUSTOMER SUPPLY CYCLE
DS Smith is a supply cycle strategist.‘Supply chain’ only tells half the story and misses the bigger picture. For everything that goes one way in the chain, something moves the other way too. It’s a Supply Cycle.Traceability, emissions… the biggest challenges of a supply chain are actually circular. When you start thinking about the whole cycle, you’re seeing the whole picture. Your thinking becomes more joined-up. More efficient. More integrated.
DRIVEN BY INNOVATIONWe’re driven by anticipating and solving our customers’ problems. By using our expertise from design to production and supply to recycling, we can offer high quality, innovative solutions and great service that looks at the whole of their packaging needs, not just one part.
We call this Supply Cycle Thinking, it is a unified approach for every area of our business and it makes our customers’ lives easier by creating simplicity in otherwise complicated supply chains.
www.dssmith.com/company/who-we-are/supply-cycle-strategists
Find out more about our Supply Cycle on-line
Strategic Report 19
dssmith.com
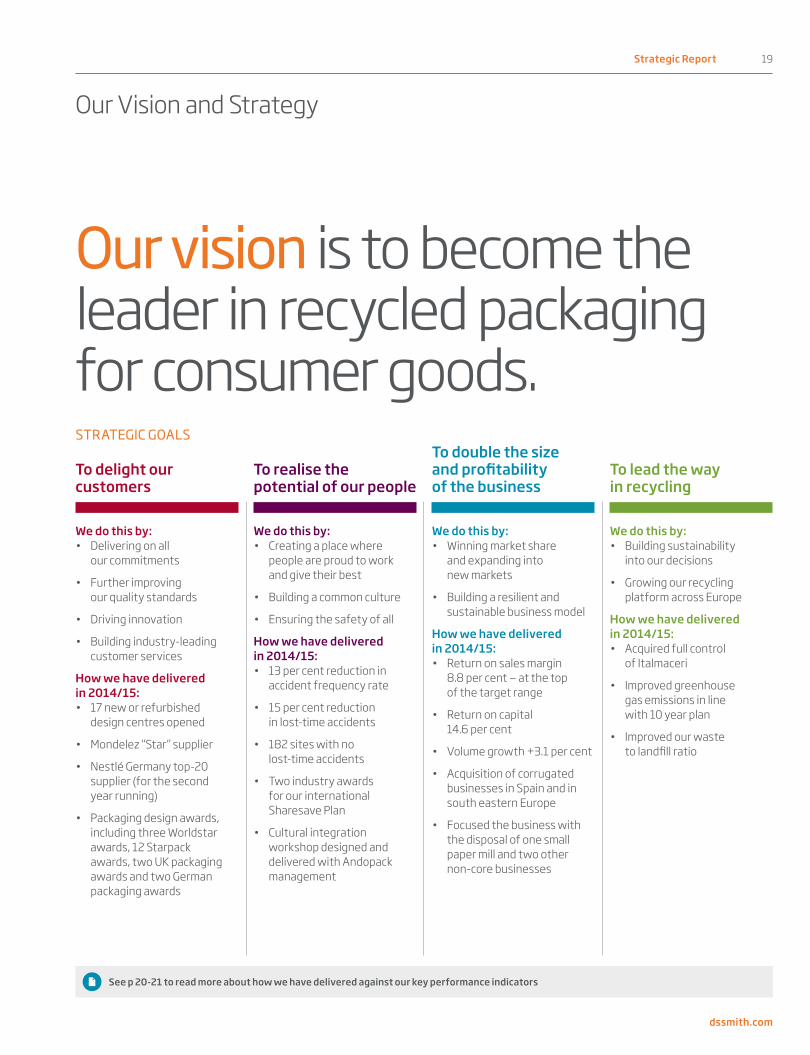
See p 20-21 to read more about how we have delivered against our key performance indicators
Our Vision and Strategy
Our vision is to become the leader in recycled packaging for consumer goods.
We do this by:• Delivering on all
our commitments
• Further improving our quality standards
• Driving innovation
• Building industry-leading customer services
How we have delivered in 2014/15:• 17 new or refurbished
design centres opened
• Mondelez “Star” supplier
• Nestlé Germany top-20 supplier (for the second year running)
• Packaging design awards, including three Worldstar awards, 12 Starpack awards, two UK packaging awards and two German packaging awards
We do this by:• Building sustainability
into our decisions
• Growing our recycling platform across Europe
How we have delivered in 2014/15:• Acquired full control
of Italmaceri
• Improved greenhouse gas emissions in line with 10 year plan
• Improved our waste to landfill ratio
We do this by:• Winning market share
and expanding into new markets
• Building a resilient and sustainable business model
How we have delivered in 2014/15:• Return on sales margin
8.8 per cent — at the top of the target range
• Return on capital 14.6 per cent
• Volume growth +3.1 per cent
• Acquisition of corrugated businesses in Spain and in south eastern Europe
• Focused the business with the disposal of one small paper mill and two other non-core businesses
We do this by:• Creating a place where
people are proud to work and give their best
• Building a common culture
• Ensuring the safety of all
How we have delivered in 2014/15:• 13 per cent reduction in
accident frequency rate
• 15 per cent reduction in lost-time accidents
• 182 sites with no lost-time accidents
• Two industry awards for our international Sharesave Plan
• Cultural integration workshop designed and delivered with Andopack management
To delight our customers
To realise the potential of our people
To double the size and profitability of the business
To lead the way in recycling
STRATEGIC GOALS

20 Strategic Report
Annual Report & Accounts 2015
Key Performance Indicators
To delight our customers
To realise the potential of our people
To double the size and profitability of the business
To lead the way in recycling
On-time, in-full delivery Accident frequency rate (AFR)
Like-for-like corrugated volume growth
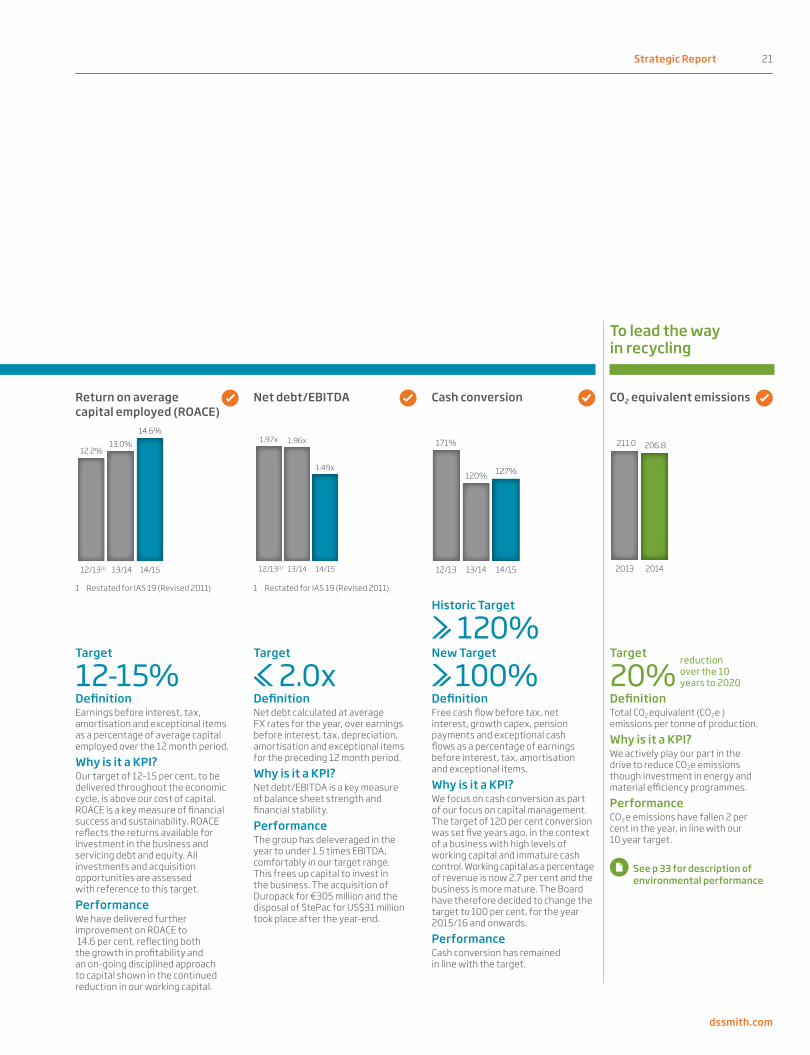
Return on sales Return on average capital employed (ROACE)
Net debt/EBITDA Cash conversion CO2 equivalent emissions
Weighted GDP +1% target 1 Restated for IAS 19 (Revised 2011) 1 Restated for IAS 19 (Revised 2011) 1 Restated for IAS 19 (Revised 2011)
Historic Target
120%New Target
100%
Historic target
7-9%New target
7-10%Target
97%Target
NilTarget
GDP+1%Target
12-15%Target
2.0xTarget
20%reduction over the 10 years to 2020
DefinitionProportion of orders fulfilled on-time, in-full, across all businesses.Why is it a KPI?This measures our commitment to high standards of service to customers. It is part of our aim to provide “more than a box”.PerformanceService levels have remained relatively flat year-on-year. We remain committed to improving service and quality.
DefinitionThe number of lost-time accidents (LTAs) per million hours worked.Why is it a KPI?Safety is our highest priority. We aim to provide employees with a safe, productive and rewarding workplace. PerformanceWe are very pleased to have achieved a further 13 per cent reduction in AFR. We have also reduced our number of LTAs by 15 per cent. 182 sites achieved our target of no LTAs in the year. We continue to strive to achieve this across the whole Group.
DefinitionVolume of corrugated box products sold (excluding the effect of acquisitions and disposals) measured by area.Why is it a KPI?We target volume growth above GDP because we expect the market to favour recycled packaging and because we aim to win market share by delivering value to our customers across their supply chain.PerformanceFor 2014/15, GDP for our regions, weighted by our sales in those regions, was 1.3 per cent (Source: Eurostat).We are pleased to have delivered box volume growth of 3.1 per cent, which out-performs our target and the market. This has been achieved by growth in all our reporting regions, with particularly strong growth in Central Europe and Italy, a region in which we have expanded with the addition of Duropack on 31 May 2015.
DefinitionEarnings before interest, tax, amortisation and exceptional items as a percentage of revenue.Why is it a KPI?The margin we achieve is a reflection of the value we deliver to our customers and our ability to charge for that value. It is also driven by our scale. A higher margin makes the profit more robust to adverse events. As set out in the Chief Executive’s Review, the Board has decided to raise this target by an additional 100 basis points for the year 2015/16 and onwards.
PerformanceThe business has achieved margin growth of 130 bps on a constant currency basis, or 120 bps on a reported basis, resulting in a margin at the top end of the historic target range.
DefinitionEarnings before interest, tax, amortisation and exceptional items as a percentage of average capital employed over the 12 month period.Why is it a KPI?Our target of 12–15 per cent, to be delivered throughout the economic cycle, is above our cost of capital. ROACE is a key measure of financial success and sustainability. ROACE reflects the returns available for investment in the business and servicing debt and equity. All investments and acquisition opportunities are assessed with reference to this target.PerformanceWe have delivered further improvement on ROACE to 14.6 per cent, reflecting both the growth in profitability and an on-going disciplined approach to capital shown in the continued reduction in our working capital.
DefinitionNet debt calculated at average FX rates for the year, over earnings before interest, tax, depreciation, amortisation and exceptional items for the preceding 12 month period.Why is it a KPI?Net debt/EBITDA is a key measure of balance sheet strength and financial stability.PerformanceThe group has deleveraged in the year to under 1.5 times EBITDA, comfortably in our target range. This frees up capital to invest in the business. The acquisition of Duropack for €305 million and the disposal of StePac for US$31 million took place after the year-end.
DefinitionFree cash flow before tax, net interest, growth capex, pension payments and exceptional cash flows as a percentage of earnings before interest, tax, amortisation and exceptional items.Why is it a KPI?We focus on cash conversion as part of our focus on capital management. The target of 120 per cent conversion was set five years ago, in the context of a business with high levels of working capital and immature cash control. Working capital as a percentage of revenue is now 2.7 per cent and the business is more mature. The Board have therefore decided to change the target to 100 per cent, for the year 2015/16 and onwards. PerformanceCash conversion has remained in line with the target.
DefinitionTotal CO2 equivalent (CO2e ) emissions per tonne of production.Why is it a KPI?We actively play our part in the drive to reduce CO2e emissions though investment in energy and material efficiency programmes.PerformanceCO2 e emissions have fallen 2 per cent in the year, in line with our 10 year target.
See p 33 for description of environmental performance
We have identified a number of key performance indicators to measure value creation, quantify our social impact and benchmark customer service. We have set testing medium-term targets. We aim to satisfy our four key stakeholders — customers, employees, shareholders and the environment — because we believe that this is the way to build a sustainable business.
13/14 14/1512/13
92%93%94%8.8%
7.6%6.8%
13/14 14/1512/13(1)
+3.1%
+0.6%
+2.2%
13/14 14/1512/13
+0.5%
+1.9%
+2.3%
13/14 14/1512/13
4.24.8
6.2
Strategic Report 21
dssmith.com
To delight our customers
To realise the potential of our people
To double the size and profitability of the business
To lead the way in recycling
On-time, in-full delivery Accident frequency rate (AFR)
Like-for-like corrugated volume growth
Return on sales Return on average capital employed (ROACE)
Net debt/EBITDA Cash conversion CO2 equivalent emissions
Weighted GDP +1% target 1 Restated for IAS 19 (Revised 2011) 1 Restated for IAS 19 (Revised 2011) 1 Restated for IAS 19 (Revised 2011)
Historic Target
120%New Target
100%
Historic target
7-9%New target
7-10%Target
97%Target
NilTarget
GDP+1%Target
12-15%Target
2.0xTarget
20%reduction over the 10 years to 2020
DefinitionProportion of orders fulfilled on-time, in-full, across all businesses.Why is it a KPI?This measures our commitment to high standards of service to customers. It is part of our aim to provide “more than a box”.PerformanceService levels have remained relatively flat year-on-year. We remain committed to improving service and quality.
DefinitionThe number of lost-time accidents (LTAs) per million hours worked.Why is it a KPI?Safety is our highest priority. We aim to provide employees with a safe, productive and rewarding workplace. PerformanceWe are very pleased to have achieved a further 13 per cent reduction in AFR. We have also reduced our number of LTAs by 15 per cent. 182 sites achieved our target of no LTAs in the year. We continue to strive to achieve this across the whole Group.
DefinitionVolume of corrugated box products sold (excluding the effect of acquisitions and disposals) measured by area.Why is it a KPI?We target volume growth above GDP because we expect the market to favour recycled packaging and because we aim to win market share by delivering value to our customers across their supply chain.PerformanceFor 2014/15, GDP for our regions, weighted by our sales in those regions, was 1.3 per cent (Source: Eurostat).We are pleased to have delivered box volume growth of 3.1 per cent, which out-performs our target and the market. This has been achieved by growth in all our reporting regions, with particularly strong growth in Central Europe and Italy, a region in which we have expanded with the addition of Duropack on 31 May 2015.
DefinitionEarnings before interest, tax, amortisation and exceptional items as a percentage of revenue.Why is it a KPI?The margin we achieve is a reflection of the value we deliver to our customers and our ability to charge for that value. It is also driven by our scale. A higher margin makes the profit more robust to adverse events. As set out in the Chief Executive’s Review, the Board has decided to raise this target by an additional 100 basis points for the year 2015/16 and onwards.
PerformanceThe business has achieved margin growth of 130 bps on a constant currency basis, or 120 bps on a reported basis, resulting in a margin at the top end of the historic target range.
DefinitionEarnings before interest, tax, amortisation and exceptional items as a percentage of average capital employed over the 12 month period.Why is it a KPI?Our target of 12–15 per cent, to be delivered throughout the economic cycle, is above our cost of capital. ROACE is a key measure of financial success and sustainability. ROACE reflects the returns available for investment in the business and servicing debt and equity. All investments and acquisition opportunities are assessed with reference to this target.PerformanceWe have delivered further improvement on ROACE to 14.6 per cent, reflecting both the growth in profitability and an on-going disciplined approach to capital shown in the continued reduction in our working capital.
DefinitionNet debt calculated at average FX rates for the year, over earnings before interest, tax, depreciation, amortisation and exceptional items for the preceding 12 month period.Why is it a KPI?Net debt/EBITDA is a key measure of balance sheet strength and financial stability.PerformanceThe group has deleveraged in the year to under 1.5 times EBITDA, comfortably in our target range. This frees up capital to invest in the business. The acquisition of Duropack for €305 million and the disposal of StePac for US$31 million took place after the year-end.
DefinitionFree cash flow before tax, net interest, growth capex, pension payments and exceptional cash flows as a percentage of earnings before interest, tax, amortisation and exceptional items.Why is it a KPI?We focus on cash conversion as part of our focus on capital management. The target of 120 per cent conversion was set five years ago, in the context of a business with high levels of working capital and immature cash control. Working capital as a percentage of revenue is now 2.7 per cent and the business is more mature. The Board have therefore decided to change the target to 100 per cent, for the year 2015/16 and onwards. PerformanceCash conversion has remained in line with the target.
DefinitionTotal CO2 equivalent (CO2e ) emissions per tonne of production.Why is it a KPI?We actively play our part in the drive to reduce CO2e emissions though investment in energy and material efficiency programmes.PerformanceCO2 e emissions have fallen 2 per cent in the year, in line with our 10 year target.
See p 33 for description of environmental performance
1.49x
1.96x1.97x
13/14 14/1512/13(1)
14.6%13.0%
12.2%
13/14 14/1512/13(1)
127%120%
171%
13/14 14/1512/13
206.8211.0
20142013
22 Strategic Report
Annual Report & Accounts 2015
Chief Executive's Review
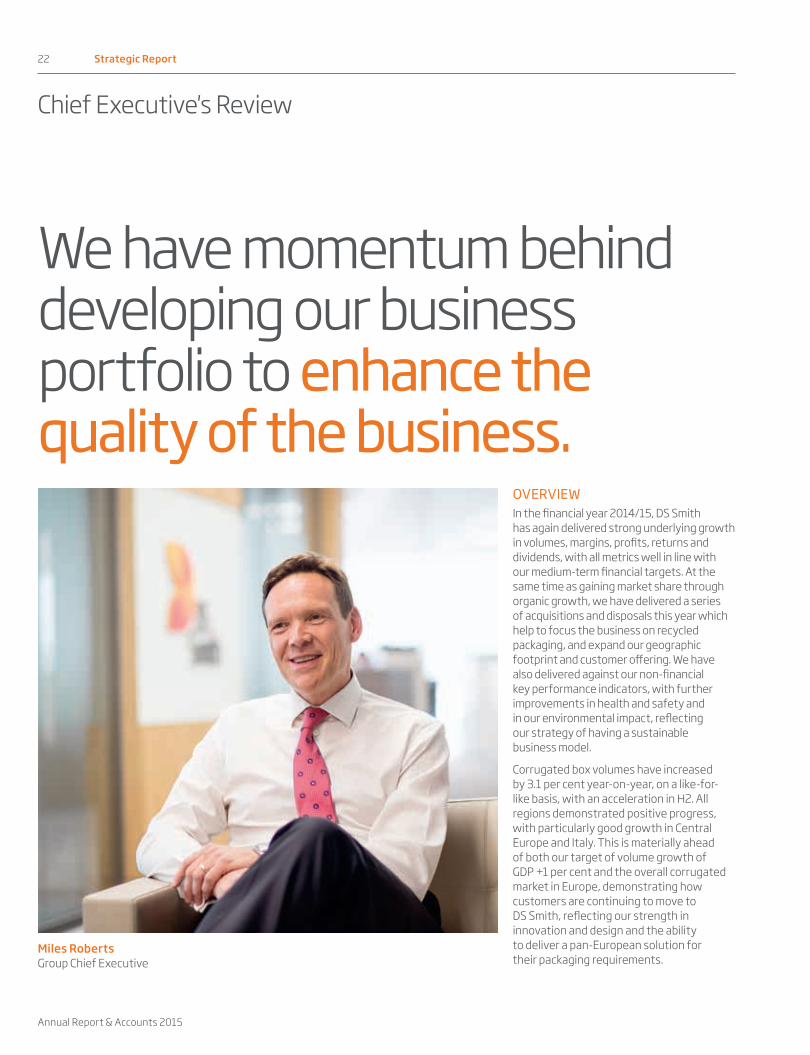
We have momentum behind developing our business portfolio to enhance the quality of the business.
OVERVIEWIn the financial year 2014/15, DS Smith has again delivered strong underlying growth in volumes, margins, profits, returns and dividends, with all metrics well in line with our medium-term financial targets. At the same time as gaining market share through organic growth, we have delivered a series of acquisitions and disposals this year which help to focus the business on recycled packaging, and expand our geographic footprint and customer offering. We have also delivered against our non-financial key performance indicators, with further improvements in health and safety and in our environmental impact, reflecting our strategy of having a sustainable business model.
Corrugated box volumes have increased by 3.1 per cent year-on-year, on a like-for-like basis, with an acceleration in H2. All regions demonstrated positive progress, with particularly good growth in Central Europe and Italy. This is materially ahead of both our target of volume growth of GDP +1 per cent and the overall corrugated market in Europe, demonstrating how customers are continuing to move to DS Smith, reflecting our strength in innovation and design and the ability to deliver a pan-European solution for their packaging requirements.
Miles RobertsGroup Chief Executive
Strategic Report 23
dssmith.com
In a market where the needs of consumers, retailers and our customers are constantly changing, we continue to focus on developing innovative solutions for our customers and the roll-out of our performance packaging programme. This utilises our unique proprietary technology, in order to provide high quality packaging for our customers on a consistent basis in the most cost-effective way.
For the full-year period, revenues increased by 1 per cent on a constant currency basis, despite a slight reduction from the net impact of acquisitions and disposals. Reported revenues reduced by 5 per cent due to foreign exchange (FX) translation of non-sterling revenues. Adjusted operating profit increased by 17 per cent on a constant currency basis to £335 million (9 per cent on a reported basis), driven by the contribution from the volume growth, our focus on higher value-added product and services to customers, together with the benefit of synergies from the SCA Packaging acquisition, where we have delivered the expected, final tranche of €40 million of synergies in the period.
We have continued our strategy to licence certain of our technologies in a number of geographies worldwide. During the period, we entered into an agreement with Georgia-Pacific Corrugated LLC (GP), a major packaging company in North America, whereby GP licenses our technology for real-time monitoring and measurement of the quality and performance of packaging.
We have an ongoing programme of opening our Impact and Packright design centres, where we bring together our innovation and design expertise to develop the best packaging solutions. The strength of our business model lies in our scale, as the design centres share expertise and a database of designs, which means customers receive the best solutions, while the cost of development is shared. To date we have rolled out 17 new or refurbished centres, which combined with existing design centres means we have 30 such centres across Europe. We expect to extend this to over 40 by the end of the 2015/16 financial year.
Earnings per share increased by 24 per cent on a constant currency basis to 24.5 pence (14 per cent on a reported basis) (2013/14: 21.4 pence). This result follows four prior years of consistent growth, with the 5-year compound annual growth rate for reported EPS being 34 per cent.
The Board considers the dividend to be an important component of shareholder returns and, as such, has a policy to deliver a progressive dividend, where dividend cover is between 2.0 and 2.5 times, through the cycle. For the year 2014/15, the Board recommends a final dividend of 7.7 pence, which together with the interim dividend of 3.7 pence gives a total dividend for the year of 11.4 pence per share (2013/14: 10.0 pence per share). This represents an increase of 14 per cent on the prior year and cover of 2.1 times in relation to earnings per share (before amortisation and exceptional items).
IMPROVING THE QUALITY OF THE BUSINESS BY INVESTMENT AND RESHAPING THE ASSET PORTFOLIODS Smith is ambitious to improve the quality and scale of our business. Scale is important as it allows us to invest in innovation and design, with the benefit shared throughout the business and across our customers. This results in a business that is able to lead the market in quality and innovation while remaining competitive on price and providing a full geographic reach, which together underpin our improvement in driving margins and returns. Allied to this is a focus on increasing the value-added products and services to our customers.
We have made significant further steps this year to expand our scale and improve the quality of the business through organic investment, acquisitions, and disposals.
We increased our interest in Italmaceri, a recycling business in Italy, from 50 to 100 per cent in July 2014, and bought a plastics manufacturing site in Croatia in September 2014.
In November 2014 we acquired Andopack, a corrugated packaging business in Spain. We have been delighted with the customer reaction and the performance of the business, with volume growth significantly ahead of the Group average.
Since the year end we have completed our acquisition of Duropack, a corrugated packaging business with a market leading position in south eastern Europe. The reaction from customers and employees has been very positive and we look forward to integrating the business into the Group.
See p 19-21 for more information on our strategy and key performance indicators.
24 Strategic Report
Annual Report & Accounts 2015
Chief Executive's Review continued
During the year we have also acquired a small packaging consultancy business, serving global customers with operations in Europe, US and Asia. This expands our global reach and increases our capabilities in the analysis of packaging and its interaction with supply chains. We are adding additional capability in the US to offer greater packaging design consultancy and procurement services, on the back of existing customer contracts and strong demand for our services beyond Europe. We are very pleased with the positive reaction from our global customers to this new initiative.
We have made a number of disposals of businesses that were not core to the Group’s strategy, including a Foams business in Scandinavia, in September 2014, and StePac, a specialist modified atmosphere packaging business, in May 2015, after the year end. We have also disposed of a paper mill at Nantes, France, in line with our strategy to reduce non-integrated paper manufacturing.
We have continued to invest in our assets ahead of depreciation, with net capex of £149 million (2013/14: £156 million). Approximately three quarters of this expenditure has been in the corrugated packaging business, with growth expenditure focused on the regions where there is the greatest opportunity. For example, in the year, approximately a third of the growth capex in the packaging business was spent in Central Europe, with investment in our sites in Poland, Hungary, Czech Republic and Romania.
DELIVERING ON OUR MEDIUM-TERM TARGETS AND KEY PERFORMANCE INDICATORSWe have made progress against our key performance indicators over the full-year with substantial improvement in our metrics. As set out above, corrugated box volumes grew by 3.1 per cent. This exceeded our target of GDP+1 per cent, with year-on-year GDP growth, weighted by our sales in the markets in which we operate, estimated at 1.3 per cent (Source: Eurostat) resulting in a target of 2.3 per cent. We have delivered this growth across all our regions with a particularly strong contribution from Central Europe and Italy, which has benefited from our investment in the region as well as good growth in the markets. This performance reinforces our confidence in our investment in the Duropack business, which expands our geographic reach in the region, with the new business expected to increase our corrugated volumes in the region by circa one third. As a consequence of our strong volume growth, DS Smith has gained market share across Europe, where the overall corrugated packaging market has shown volume growth of 1.5 per cent (Source: FEFCO, May 2014 – April 2015).
Adjusted return on sales has increased by 130 basis points on a constant currency basis to 8.8 per cent, at the upper end of our target range of 7 to 9 per cent, reflecting the improvement in profitability from our focus on higher value-added products and services, operational gearing and the final year of cost synergies from the acquisition of SCA Packaging, that have been achieved over the year as anticipated
Return on average capital employed has improved by 160 basis points to 14.6 per cent (2013/14: 13.0 per cent), toward the
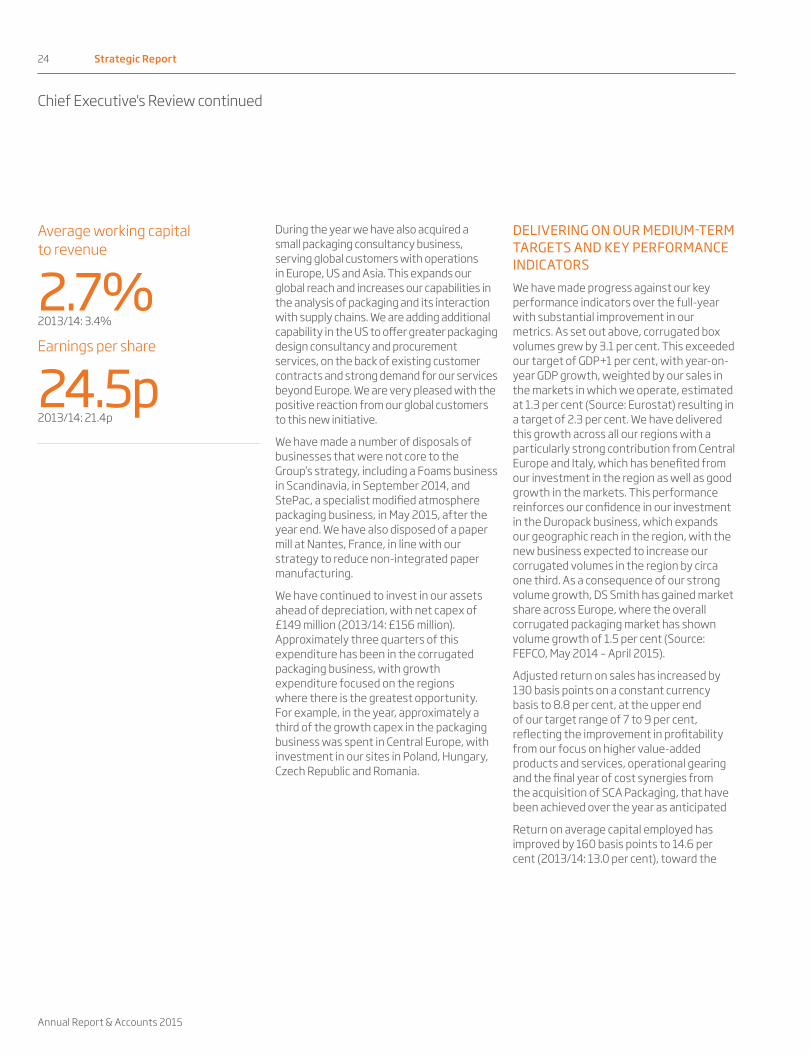
Average working capital to revenue
2.7%2013/14: 3.4%
Earnings per share
24.5p2013/14: 21.4p

Strategic Report 25
dssmith.com
upper end of our medium-term target range of 12 to 15 per cent and significantly above our cost of capital. The improvement is driven by our improved profitability and our continual focus on tight capital allocation and management within the business, including working capital, which has shown further improvement this year. Return on average capital employed is our primary financial measure of success, and is measured and calculated on a monthly basis. All senior management have part of their remuneration package linked to this measure.
Net debt has decreased to £651 million (2013/14: £827 million) while net debt/EBITDA (calculated in accordance with our banking covenant requirements) was 1.49 times (2013/14: 1.96 times), in line with our medium-term financial KPI of a ratio of 2.0 times or below and reflecting ongoing tight cash management and control throughout the business.
During the year the Group generated free cash flow of £307 million (2013/14: £140 million). Cash conversion was 127 per cent, in line with our target.
DS Smith is committed to providing all employees with a safe and productive working environment. We are pleased to report a further substantial improvement in our safety record, with our accident frequency rate reduced a further 13 per cent from 4.79 to 4.16, reflecting our ongoing commitment to best practice in health and safety. Our target is for zero accidents, which we are pleased to report that 182 sites achieved this year, up from 138 in 2013/14. We continue to strive to achieve zero accidents for the Group as a whole.
The Group has a target for customer service of 97 per cent on-time, in-full deliveries.
In the year we achieved 92 per cent, broadly similar to the level achieved in the prior year. Standards of service, quality and innovation are key to our differentiation in the market. We are investing significantly in these areas, from design centres throughout Europe, to the roll-out of our performance packaging methodology, in order to continue to lead the industry in this field.
DS Smith is part of the sustainable economy, with our principal product of corrugated packaging fully recyclable, and substantially constructed from recycled material, as are many of our plastic packaging products. Our Recycling business works with customers across Europe to improve their recycling operations and overall environmental performance. We have invested in improved environmental tracking systems with far more detail now available, as set out in greater detail in our Sustainability Report 2015. CO2 equivalent emissions, relative to production, have reduced by 2 per cent, and we are on target to achieve our 2010 commitment to a 20 per cent reduction by 2020.
UPDATED MEDIUM-TERM TARGETS AND FINANCIAL KEY PERFORMANCE INDICATORSWe believe that scale brings benefits for customers and for our shareholders. Five years ago, for the year ended 30 April 2010, DS Smith reported a return on sales of 4.5 per cent. In December 2010 the Board set a medium-term target of 6–8 per cent, and raised that to 7–9 per cent following the disposal of Spicers in 2011. Having achieved a full-year return on sales of 8.8 per cent this year, near the top of that range, the Board consider it appropriate to raise this sustainable medium-term target by an additional 100 basis points.
In relation to cash conversion, the target level of 120 per cent was also set in 2010, when, inter alia, working capital was a substantially higher proportion of revenue than its current level of 2.7 per cent. The Board therefore believes that the appropriate cash conversion ratio for the business going forward, having achieved the target of 120 per cent or above for the prior five years, is 100 per cent or above. This reflects the structural working capital reductions achieved and the maturity of the current business.
OUTLOOKThe current year has started well, with momentum in volumes continuing. We also have momentum behind developing our business portfolio to improve the quality of our business. We have been delighted with the positive customer reaction to our recent acquisitions. The progress we continue to make with global customers, together with the opportunities we see for growth as we expand our international reach and offering, gives us confidence to increase our medium-term margin target by 100 basis points, and, notwithstanding the continued challenging market environment, we remain excited about the prospects for the business.
Miles Roberts Group Chief Executive
26 Strategic Report
Annual Report & Accounts 2015
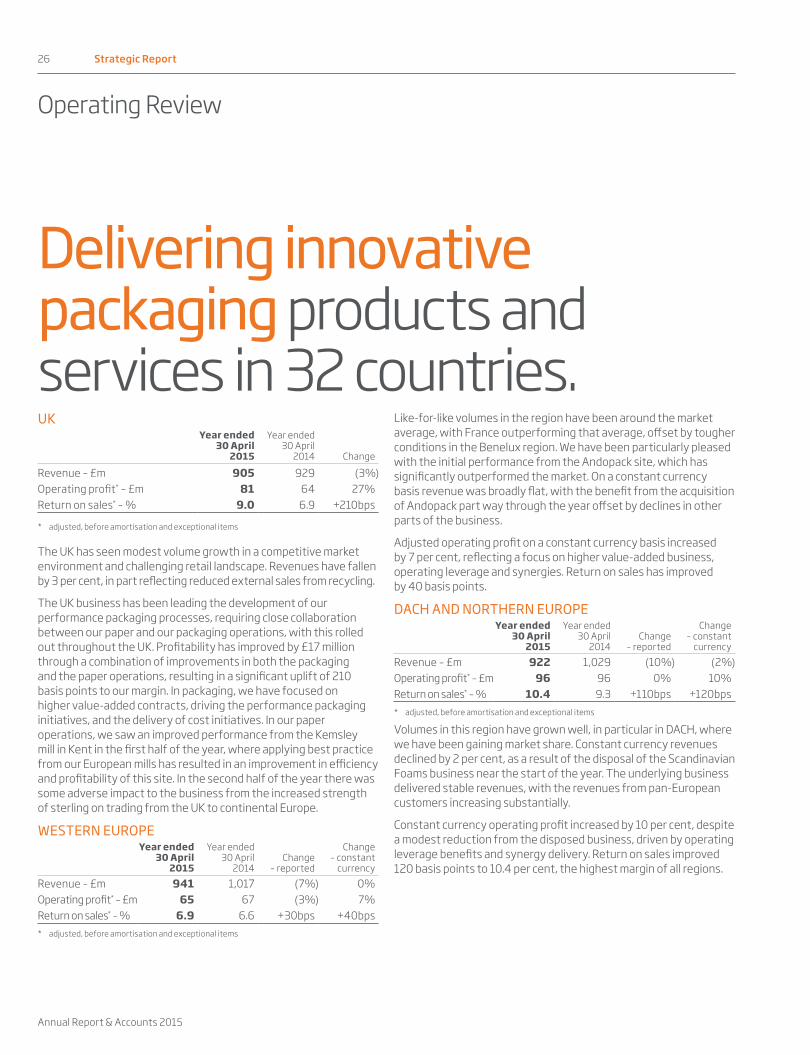
UKYear ended
30 April 2015
Year ended 30 April
2014 Change
Revenue – £m 905 929 (3%)Operating profit* – £m 81 64 27%Return on sales* – % 9.0 6.9 +210bps
* adjusted, before amortisation and exceptional items
The UK has seen modest volume growth in a competitive market environment and challenging retail landscape. Revenues have fallen by 3 per cent, in part reflecting reduced external sales from recycling.
The UK business has been leading the development of our performance packaging processes, requiring close collaboration between our paper and our packaging operations, with this rolled out throughout the UK. Profitability has improved by £17 million through a combination of improvements in both the packaging and the paper operations, resulting in a significant uplift of 210 basis points to our margin. In packaging, we have focused on higher value-added contracts, driving the performance packaging initiatives, and the delivery of cost initiatives. In our paper operations, we saw an improved performance from the Kemsley mill in Kent in the first half of the year, where applying best practice from our European mills has resulted in an improvement in efficiency and profitability of this site. In the second half of the year there was some adverse impact to the business from the increased strength of sterling on trading from the UK to continental Europe.
WESTERN EUROPEYear ended
30 April 2015
Year ended 30 April
2014Change
– reported
Change – constant
currencyRevenue – £m 941 1,017 (7%) 0%Operating profit* – £m 65 67 (3%) 7%Return on sales* – % 6.9 6.6 +30bps +40bps* adjusted, before amortisation and exceptional items
Like-for-like volumes in the region have been around the market average, with France outperforming that average, offset by tougher conditions in the Benelux region. We have been particularly pleased with the initial performance from the Andopack site, which has significantly outperformed the market. On a constant currency basis revenue was broadly flat, with the benefit from the acquisition of Andopack part way through the year offset by declines in other parts of the business.
Adjusted operating profit on a constant currency basis increased by 7 per cent, reflecting a focus on higher value-added business, operating leverage and synergies. Return on sales has improved by 40 basis points.
DACH AND NORTHERN EUROPEYear ended
30 April 2015
Year ended 30 April
2014Change
– reported
Change – constant
currencyRevenue – £m 922 1,029 (10%) (2%)Operating profit* – £m 96 96 0% 10%Return on sales* – % 10.4 9.3 +110bps +120bps* adjusted, before amortisation and exceptional items
Volumes in this region have grown well, in particular in DACH, where we have been gaining market share. Constant currency revenues declined by 2 per cent, as a result of the disposal of the Scandinavian Foams business near the start of the year. The underlying business delivered stable revenues, with the revenues from pan-European customers increasing substantially.
Constant currency operating profit increased by 10 per cent, despite a modest reduction from the disposed business, driven by operating leverage benefits and synergy delivery. Return on sales improved 120 basis points to 10.4 per cent, the highest margin of all regions.
Operating Review
Delivering innovative packaging products and services in 32 countries.

Strategic Report 27
dssmith.com
CENTRAL EUROPE AND ITALYYear ended
30 April 2015
Year ended 30 April
2014Change
– reported
Change – constant
currencyRevenue – £m 750 739 1% 11%Operating profit* – £m 65 53 23% 33%Return on sales* – % 8.7 7.2 +150bps +150bps* adjusted, before amortisation and exceptional items
Volumes in this region have been excellent, with both the business in Italy and in Central Europe substantially outperforming the market. Constant currency revenue growth of 11 per cent reflects the volume performance, delivered through above average market growth and significant market share development, plus a modest contribution from the acquired recycling business in Italy.
Adjusted operating profit grew by 33 per cent, with approximately half of the revenue growth in the region from pan-European customers with the remainder from the local markets. The region has seen significant investment in its plants over the period and we are continuing to invest in this exciting region.
PLASTICSYear ended
30 April 2015
Year ended 30 April
2014Change
– reported
Change – constant
currencyRevenue – £m 302 321 (6%) (2%)Operating profit* – £m 28 27 4% 8%Return on sales* – % 9.3 8.4 +90bps +90bps* adjusted, before amortisation and exceptional items
Constant currency revenue declined slightly, reflecting growth in the underlying business, offset by the disposal of two small non-core businesses. Adjusted operating profit grew by 8 per cent on a constant currency basis with a 90 basis point increase in margin, reflecting organic profit development as the investments made in the business in 2013/14 were put into service. In the flexible packaging segment of the business, continued double digit growth of the beverage dispensing tap business in the US was partially offset by the gradual start-up of new facilities in Europe. Demand for flexible packaging continues to grow through new product offerings and new markets served, in addition to a better service offering in Europe.
The rigid transit packaging segment, based in Europe, had a very strong year. Revenue increased by 8 per cent over the prior year on increased demand for most product lines and adjusted operating profit increased by 26 per cent as plant improvements and a favourable raw materials market increased the impact of the additional sales and more than offset the negative FX effects.
MARKET OVERVIEWPackagingEuropean market: 22.1 million tonnes/42.4 billion m2.
European corrugated packaging market (42.4 billion m2)
21%
15%
13%10%
GermanyItalyFranceSpain
UKPolandOther
10%
8%
23%
Source: FEFCO 2013
Corrugated packaging is typically produced within c. 200 km of its destination due to the requirements for just-in-time delivery and the relative bulkiness of the product.
Recycling
Total European market for fibre collection 57 million tonnes.
Total European market for OCC collection 29 million tonnes.
UK market for fibre collection 7.9 million tonnes.
UK market for OCC collection 3.8 million tonnes.
OCC is a traded within Europe and also exported around the world.
PaperEuropean market for recycled CCM: 22 million tonnes.
European market for kraftliner: 4 million tonnes.
Paper is readily transportable and is traded globally.
PlasticsGlobal market for flexible packaging and dispensing: £570 million.
The European market for rigid packaging is fragmented, comprising numerous specific niche markets.

28 Strategic Report
Annual Report & Accounts 2015
Financial Review
Delivering strong financial performance.
Effective cash management and delivery against financial metrics has remained our focus and once again, the Group has delivered against all of its financial measures:
• Earnings before interest, tax exceptionals and amortisation up 17 per cent on constant currency at £335 million (2013/14: £307 million)
• Like-for-like corrugated box volume growth of 3.1 per cent
• Return on sales1 of 8.8 per cent (2013/14: 7.6 per cent)
• Return on average capital employed1 of 14.6 per cent (2013/14: 13.0 per cent)
• Net debt/EBITDA of 1.49 times (2013/14: 1.96 times)
• Average working capital to sales 2.7 per cent (2013/14: 3.4 per cent)
OVERVIEWThe Group’s strong performance in 2014/15 was achieved against an ongoing backdrop of challenging economic and market conditions, particularly in continental Europe, where the euro has weakened by around 13 per cent and deflation has appeared in a number of our markets. The SCA Packaging business has now been fully integrated and the strength of our business model is a reflection of the efforts made by the whole team and the traction that this is having with our customers. This year we responded to customer demand and acquired the Andopack business in Spain in order to establish a manufacturing presence and position to grow from in the Iberian Peninsula. Shortly after the year end we completed the acquisition of the Duropack group of companies in south eastern Europe which has an established market leading position in these high growth economies.
In addition, we have continued to actively manage our asset base by disposing of a Foams business in Scandinavia, a paper mill in Nantes, France and the StePac business in Israel, which completed shortly after the year end. The disposals represent businesses which we have determined will either not grow further without significant investment or do not have natural synergies with our core portfolio and we can reinvest the proceeds in higher returning investments such as restructuring our manufacturing footprint in Germany and the UK, or relocating our European Flexible Plastics business to eastern Europe. During the year the Group refinanced the SCA Packaging acquisition finance, obtained an investment grade credit rating from Standard and Poor 's (BBB-Stable) and agreed with pension trustees to maintain contributions at current levels following the triennial valuation.
Adrian MarshGroup Finance Director
Income statement2014/15
£m2013/14
£mRevenue 3,820 4,035Operating profit1 335 307Return on sales1 8.8% 7.6%Net financing costs1 (38) (48)Profit before tax1 297 259Income tax expense1 (66) (59)Profit after tax1 231 200Minority interest – (1)Adjusted earnings1 231 199Basic adjusted earnings per share1 24.5p 21.4pAmortisation of intangible assets, before tax (46) (51)Exceptional items, before tax (51) (41)
1 Adjusted for amortisation and exceptional items

Strategic Report 29
dssmith.com
TRADING RESULTSAll numbers within this review are based on continuing operations before amortisation and exceptional items, with any comment and comparable analysis based on constant currency, unless otherwise stated.
Group revenue of £3,820 million was 5 per cent lower than the prior year (2013/14: £4,035 million) with exchange effects, particularly the weakening of the euro throughout the year, having a significant impact (£236 million). On a like-for-like constant currency basis, after adjusting for acquisitions and disposals, underlying revenue grew by £29 million, up 1 per cent.
The growth in revenue was underpinned by corrugated box volume growth across Europe of 3.1 per cent, partially offset by the effects of lower paper prices, particularly in the first half of the year. Plastics revenue declined by 2 per cent as the restructuring of the Flexibles business was implemented and a platform for future growth was established.
Adjusted operating profit rose by 9 per cent to £335 million (2013/14: £307 million), 17 per cent on a constant currency basis, with exchange effects estimated to have an impact of about £21 million. Whilst the business has benefitted from the balance of the SCA Packaging synergies of €40 million, or £31 million, bringing the total delivered to €120 million, as previously announced, it has also been impacted by deflation in a few markets. Input cost benefits were balanced by sales price reductions, with organic growth in corrugated box volumes contributing the majority of the further improvement in profit.
Amortisation for the year was £46 million (2013/14: £51 million). Depreciation of £117 million is slightly lower than the prior year (2013/14: £123 million) due to the impact of foreign exchange. New investments in machinery have increased depreciation and maintenance costs by around £13 million; these have been partially offset by a reduction from the finalisation of the SCA Packaging fair value work which culminated in a comprehensive review
of asset lives on a consistent basis, which had a c. £7 million impact.
The Group’s measures of return on sales and return on average capital employed have seen improvements in the current year and both are towards the top end of their target ranges. Return on sales is 8.8 per cent (target range of 7-9 per cent), whilst return on average capital employed is 14.6 per cent (target range of 12-15 per cent). As noted earlier, return on average capital employed is significantly above the Group cost of capital. The Board has reviewed the medium-term targets and has decided to raise the return on sales target by 100 basis point whilst retaining the return on average capital employed range as it is, to reflect the short-term impact which results from the acquisition of new businesses.
EXCEPTIONAL ITEMSExceptional items before tax and share of results of associates were £44 million (2013/14: £38 million).
Exceptional items comprise of restructuring initiatives totalling £47 million, which have been concentrated in UK and German Packaging businesses, and on the infrastructure necessary to support the Group’s growth and development. These costs have been partially offset by utilisation of provisions made on the
SCA Packaging acquisition. Acquisition and disposal activity has generated a further £4 million of exceptional costs. This charge also includes costs incurred in respect of the post-balance sheet date acquisition of Duropack.
Gains on the disposal of the Scandinavian Foam business and the step-up acquisition of the Italian recycling business amounted to £6 million, and were offset by the loss on disposal of the Nantes mill of £9 million and other costs of £2 million.
Unamortised finance costs amounting to £4 million relating to the refinancing of the SCA Packaging acquisition finance.
Exchange losses on the Ukrainian associate of £7 million, as the Hryvian weakened against the US dollar (the currency in which the associate's debt is denominated), have been recognised as exceptional.
In 2015/16, exceptional costs of £40 million are expected to be incurred, principally relating to the acquisition and integration of Duropack and other one-off restructuring projects in our packaging business.
INTEREST, TAX AND EARNINGS PER SHARENet interest expense before exceptionals has reduced from £41 million in 2013/14 to £32 million in 2014/15, due both to the refinancing and to the lower levels of debt
Cash flow2014/15
£m2013/14
£mCash generated from operations before exceptional cash items 518 394Capital expenditure (net of disposal of fixed assets) (149) (156)Tax paid (28) (55)Net interest paid (34) (43)Free cash flow 307 140Cash outflow for exceptional items (49) (78)Dividends (94) (74)Acquisition/divestments of subsidiary and associate businesses (10) (15)Net cash flow 154 (27)Other movements 22 21Net debt movement — continuing operations 176 (6)Net debt movement — discontinued operations — (4)Opening net debt (827) (817)Closing net debt (651) (827)

30 Strategic Report
Annual Report & Accounts 2015
Financial Review continued
On 10 July 2014 the 50 per cent of Italmaceri not previously owned was acquired. The Italmaceri recycling business operates in northern Italy with annual volumes of approximately 500k tonnes. On 9 September 2014 Kaplast, an injection-moulding business in Croatia, was acquired, to expand the returnable transit packaging element of the Plastics business. On 6 November 2014, the acquisition of Andopack, a corrugated manufacturing business in Spain, was completed for £39 million (including acquired debt of £28 million). The business operates from a single well-invested site with considerable scope to grow the business by serving the Group's pan-European customers based in this large market.
On 2 September 2014 the Scandinavian Foams business, which the Group had acquired as part of the SCA Packaging acquisition, was disposed of for £22 million, realising a gain of £3 million.
Following the binding offer received on 20 November 2014, the small paper mill in Nantes, France with annual capacity of c. 60k tonnes of testliner was disposed of, with a loss on disposal of £9 million. This disposal was in-line with our strategy to increase our “short” paper position.
Subsequent to the year end, on 31 May 2015, the acquisition of Duropack, a recycled corrugated packaging business with market-leading positions across south eastern Europe, was completed for €305 million, including debt acquired of €100 million, subject to post-closing working capital adjustments.
On 18 May 2015, the Group completed the sale of StePac, a specialist modified atmosphere packaging business based in Israel, for US$31 million, subject to post-closing working capital adjustments.
Adjusted earnings per share were 24.5 pence (2013/14: 21.4 pence), an increase of 14 per cent. Total earnings per share were 16.6 pence (2013/14: 15.0 pence).
DIVIDENDThe proposed final dividend is 7.7 pence (2013/14: 6.8 pence), giving a total dividend for the year of 11.4 pence (2013/14: 10.0 pence). Dividend cover before amortisation and exceptional items was 2.1 times in 2014/15 (2013/14: 2.1 times).
ACQUISITIONS AND DISPOSALSThe Group's strategic aim is to grow its consumer packaging businesses to meet the requirements of its major customers. The focus on the overall “short” paper position remains, with ongoing investment in paper mills which produce high quality lightweight papers and further reduction in exposure to those that do not. Acquisition and disposal activity has intensified in the year, with three acquisitions and two disposals. Since the year end a further acquisition and disposal have been completed.
as further working capital initiatives have delivered results. The employment benefit net finance expense was £6 million (2013/14: £7 million).
Profit before tax (excluding amortisation, exceptional items and share of profit of associates) was £297 million (2013/14: £259 million), an increase of 15 per cent on a reported basis.
The share of the results of equity accounted investments includes the previously described exceptional exchange loss of £7 million on US dollar denominated debt in the Ukrainian associate.
The Group’s effective tax rate, excluding amortisation, exceptional items and associates was 23 per cent, consistent with the prior year. The exceptional tax credit was £10 million.
Reported profit after tax after amortisation and exceptional items was £156 million (2013/14: £144 million).
Statement of financial position2014/15
£m2013/14
£mIntangible assets 855 961Property, plant and equipment 1,342 1,372Inventories 256 272Trade and other receivables 553 653Cash and cash equivalents 95 98Other 200 179Total assets 3,301 3,535
Bank overdrafts (13) (34)Interest bearing loans and borrowings (783) (882)Trade and other payables (932) (934)Provisions (41) (72)Employee benefits (200) (151)Other (314) (331)Total liabilities (2,283) (2,404)Shareholders’ funds 1,018 1,131
Net debt 651 (827)
Net debt to EBITDA ratio 1.49x 1.96x

Strategic Report 31
dssmith.com
EBITDA to net interest payable ratio of not less than 4.5 times, a maximum ratio of net debt to EBITDA of 3.25 times and net assets to exceed £360 million.
The covenant calculations exclude from the income statement exceptional items and any interest arising from the defined benefit pension schemes. The calculation of net assets excludes the net asset or liability arising from the defined benefit pension schemes. At 30 April 2015, the Group had substantial headroom under its covenants; the most sensitive covenant is net debt to EBITDA and this had an EBITDA headroom of £243 million.
ENERGY COSTSEnergy continued to be a significant cost for the Group in 2014/15. The Group’s total costs for gas, electricity and diesel decreased from £241 million in 2013/14 to £187 million in 2014/15, a 22 per cent decrease, with the benefits of capital invested in CHP facilities, currency translation, lower prices and energy efficiency initiatives all contributing. The Group continues to manage the risks associated with its purchases of energy through its Energy Procurement Group. By hedging energy costs with suppliers and financial institutions we aim to reduce the volatility of energy costs and to provide the Group with a degree of certainty over future energy costs. Given the significant reduction in spot natural gas prices, particularly last summer, the hedging strategy removed opportunities to benefit from the lowest possible prices.
CAPITAL STRUCTURE AND TREASURY MANAGEMENTThe Group funds its operations from the following sources of capital: operating cash flow, borrowings, finance and operating leases, shareholders’ equity and, where appropriate, disposals of non-core businesses. The Group’s objective is to achieve a capital structure that results in an appropriate cost of capital whilst providing flexibility in short and medium-term funding so as to accommodate material investments
of £28 million comprised Andopack, Italmaceri and the Kaplast businesses.
The dividend pay-out was £94 million, reflecting the payment in 2014/15 of the interim and final dividend for 2013/14.
Total Group cash inflow for the year was £154 million, compared to an outflow of £27 million in the prior year. Net debt acquired was £30 million. Exchange and other movements reduced net debt by £52 million.
STATEMENT OF FINANCIAL POSITIONShareholders’ funds of £1,018 million at 30 April 2015 have reduced from £1,131 million at 30 April 2014, principally due to exchange losses, actuarial losses and dividends, partially offset by retained profit for the year. Profit attributable to shareholders was £156 million (2013/14: £141 million) and dividends of £94 million (2013/14: £74 million) were paid during the year. In addition, actuarial losses of £65 million from the Group’s employee benefit schemes were charged to reserves. Other items recognised directly in reserves include currency translation losses of £105 million, favourable movements on cash flow hedges of £5 million and the related tax charge of £12 million.
At 30 April 2015, the Group’s net debt was £651 million (30 April 2014: £827 million). The Group improved its net debt to earnings before interest, tax, depreciation and amortisation (EBITDA) ratio from 1.96 times at 30 April 2014 to 1.49 times at 30 April 2015 and complied with all the covenants in its financing agreements. The Group’s financial covenants for the syndicated committed bank facilities specify an
CASH FLOWNet debt ended the year significantly lower than the prior year at £651 million (30 April 2014: £827 million). Working capital management continues to be a major focus for the business. The current year inflow of £101 million reflects a continuation of tight working capital management, particularly of trade receivables and trade payables. A number of inventory reduction initiatives have commenced, the results of which should flow through over the next 12 months. The structuring of the Group's debt to be aligned with the currency of operations benefited net debt by £68 million driven mainly by the weaker euro. The business has continued to invest in capital expenditure with net costs (after disposal proceeds of £18 million) of £149 million (2013/14: £156 million). The Group strikes a balance between expenditure on asset renewal/replacement and investment in growth and efficiency, with the latter amounting to about 52 per cent of the total expenditure. Disposals included £6 million of surplus property assets (2013/14: £3 million) realising profits of £6 million (2013/14: £5 million).
Net interest payments of £34 million were £9 million lower than the prior year and were broadly in line with the net finance expense. Tax paid of £28 million was significantly lower than the prior year (2013/14: £55 million) primarily due to refunds secured in a number of regions and a greater focus on the timing of payments.
Cash costs of exceptional items amounted to £49 million representing the cash investment in restructuring and infrastructure. Disposals of businesses realised £18 million, whilst acquisitions
Borrowing facilities at 30 April 2015
Facility
Committed funds
million Maturity£ million
equivalentSyndicated bank loan facility €300 2017 219Syndicated revolving credit facility £800 2020 800Private placement $95 2016 53Private placement €118 2018-20 86Private placement $400 2017-22 247
32 Strategic Report
Annual Report & Accounts 2015
or acquisitions. The Group also aims to maintain a strong balance sheet and to provide continuity of financing by having a range of maturities and borrowings from a variety of sources, supported by its investment grade credit rating.
The Group’s overall treasury objectives are to ensure that sufficient funds are available for the Group to carry out its strategy and to manage certain financial risks to which the Group is exposed.
The Group regularly reviews the level of cash and debt facilities required to fund its activities. At 30 April 2015, the Group’s committed borrowing facilities totalled c. £1.4 billion of which £649 million were undrawn. Total gross borrowings at 30 April 2015 were £783 million. At 30 April 2015, the Group’s committed borrowing facilities had a weighted-average maturity of 4.6 years (30 April 2014: 3.3 years).
During the year the Group refinanced its committed bank borrowing facilities. The syndicated term loan facility, under which €380 million was outstanding at 30 April 2014, was repaid on 23 May 2014, and replaced with a €300 million syndicated bank term loan facility maturing in May 2017. In addition, on the same date, the £610 million syndicated revolving credit facility was repaid and replaced with a £800 million syndicated bank revolving credit facility maturing in 2019, but with options to extend this facility to 2021. Since the year end the maturity of this facility has been extended to May 2020. The year-on-year interest saving, assuming the previous facilities were fully drawn at all times is £5 million.
The Group also obtained an investment grade credit rating from Standard and Poor's (BBB-Stable) which reflects the strong credit metrics of the Group and the financial discipline of management. This credit rating allows the Group to issue investment grade bonds in the public debt markets.
IMPAIRMENTWhen applying IAS 36 (Impairment of Assets), the Group compares the carrying amounts of goodwill and intangible assets with the higher of their net realisable value and their value-in-use to determine whether an impairment exists. The value-in-use is calculated by discounting the future cash flows expected to be generated by the assets or group of assets being tested for impairment. During April 2015 tests were undertaken to determine whether there had been any impairment to the balance sheet carrying values of goodwill and other intangible assets. The key assumptions behind the calculations are based on the regional long-term growth rates and a pre-tax discount rate of 9.5 per cent combined with the appropriate country risk premiums. No impairments were identified as a result of the testing.
The net book value of goodwill and other intangibles at 30 April 2015 was £855 million (30 April 2014: £961 million).
PENSIONSIAS 19 (Employee Benefits), requires the Group to make assumptions including, but not limited to, rates of inflation, discount rates and current and future life expectancies. The use of different assumptions could have a material effect on the accounting values of the relevant assets and liabilities, which in turn could result in a change to the cost of such liabilities as recognised in the income statement over time. The assumptions involved are subject to periodic review.
The Group’s principal funded, defined benefit pension scheme is in the UK and is closed to future accrual. The Group also operates various local post-retirement and other employee benefit arrangements for overseas operations, as well as a small UK unfunded scheme. The aggregate gross
assets of the schemes at 30 April 2015 were £1,002 million and the gross liabilities at 30 April 2015 were £1,202 million, resulting in the recognition of a gross balance sheet deficit of £200 million (30 April 2014: £151 million), a net deficit of £152 million (30 April 2014: £111 million) after a deferred tax asset of £48 million (30 April 2014: £40 million).
A triennial valuation of the main UK scheme was carried out at 30 April 2013 at which point the Group agreed to maintain cash contributions at £16 million per annum. Cash contributions into the Group pension schemes were £17 million in 2014/15 (2013/14: £19 million), principally comprising £16 million in respect of the agreed contributions to the pension scheme deficit (for the future financing of the pension scheme) and are included in cash generated from operations.
The increase in the gross balance sheet deficit of £49 million is principally attributable to a decrease in the discount rate. The main factor behind this decrease is the fall in corporate bond yields over the period.
Adrian MarshGroup Finance Director
Financial Review continued

Strategic Report 33
dssmith.com
Sustainability
SUSTAINABILITY AT DS SMITH The past year has been transformative in regard to DS Smith's capabilities in the sustainability sphere. Our business model has long been based on providing inherently sustainable packaging solutions for our customers; something we feel necessary for good corporate citizenship. Over the previous 12 months, we have aligned our activity and engagement more closely with the requirements of our customers, and we have recognised that as a B2B supplier to some of the world's most famous brands we have an opportunity to aid them achieve their environmental objectives and social purpose. We continue to emphasise the role that recycling has to play within a sustainable supply cycle. Our core business remains the design and manufacture of recycled packaging for consumer goods. We measure and report the direct environmental impacts of our factories and production facilities, however we are now better able to assess our indirect impacts: upstream through our sourcing activities, and downstream in the way our customers utilise our products and the way consumers dispose of them. We have expanded our capacity to work with our customers to reduce the carbon footprints of their products throughout their supply cycle by ensuring the right packaging solution is provided to them. We have also expanded our capacity to provide bespoke reporting on the role our products play in their supply cycles — both positive and negative — and in 2014 we published our inaugural Sustainability Report.
For an in-depth analysis of our material issues, and our environmental performance and policies, refer to our website dssmith.com/company/sustainability/
OUR PRINCIPLES We remain committed to conducting our business in a responsible manner. We believe that delighting our customers and ensuring our employees operate in a safe and productive workplace is the only sustainable route to the long-term creation of value for our shareholders. DS Smith subscribes to a number of international standards and guidelines relevant to corporate responsibility and business conduct, including:
• United Nations Global Compact;
• United Nations Declaration of Human Rights and the Convention on the Rights of the Child;
• International Labour Organisation eight Fundamental Conventions; and
• Organisation for Economic Co-operation and Development Guidelines for Multinational Enterprises.
In addition, DS Smith has reported its greenhouse gas emissions and climate change risks to CDP since 2006, and in February 2015 it became a corporate member of SEDEX.
SUSTAINABILITY GOVERNANCE The Board considers risks arising from sustainability issues as one of the key risks to the Group’s operations. It ensures that the Group has in place effective policies and procedures for managing any significant sustainability risks and it receives regular reports on performance. The Group Chief Executive is responsible for sustainability issues. The Group Sustainability Committee oversees the management of these processes, and establishes targets and strategies for sustainability risks and
opportunities. Through the Group Management Team, policy is communicated to the heads of each business unit, and compliance with these policies is monitored throughout the year.
ENVIRONMENTAL MANAGEMENT AND REGULATION The Group has a governance structure in place to consider carbon emissions, energy usage, water consumption, waste and product responsibility. Each production site is required to implement an environmental management system which is appropriate to its level of activity. At present, 119 manufacturing sites have an ISO 14001 certification. The Energy Efficiency Directive 2012/27/EU has led to many production sites in a number of regions pursuing the ISO 50001 certification for energy management. We are evaluating whether the benefits of such a programme extend beyond compliance, and if proven to be effective we will widen the scope of this initiative to all regions. Each production site that converts or trades in wood fibre or other wood derivative products is mandated to pursue a recognised certification programme leading to a chain of custody for responsible fibre sourcing. Once complete, this will result in 100 per cent of relevant production sites holding a certification from a credible external body.
FTSE Group confirms that DS Smith has been independently assessed according to the FTSE4Good criteria, and has satisfied the requirements to remain a constituent of the FTSE4Good Index Series. Companies in the FTSE4Good Index Series have met stringent environmental, social and governance criteria, and are positioned to capitalise on the benefits of responsible business practice.
Sustainable packaging solutions

34 Strategic Report
Annual Report & Accounts 2015
Sustainability continued
With the exception of one effluent spillage at our Clay Cross site on 3 February 2015, which resulted in a warning letter from the United Kingdom Environment Agency on 30 March 2015, no other major environmental incidents or incidents of significant impact reportable to local or national authorities, or incidents potentially resulting in legal prosecution have been reported for the period of this report.
OUR ENVIRONMENTAL TARGETS For 2014/15, our environmental targets have remained unchanged. Relative to production, we aim to:
• Reduce our CO2 equivalent (CO2 e) emissions from fossil fuels by 20 per cent over the 10 years to 2020;
• Reduce our water usage in our paper mills by 20 per cent over the 10 years to 2020; and
• Reduce the amount of production rejects sent to landfill by 20 per cent over the 10 years to 2020.
These targets are supported by ongoing action plans. Since 2013, we have incorporated additional greenhouse gases in our data in accordance with statutory requirements, and now express this target in terms of CO2e. We are pleased to have achieved a reduction in our overall CO2e emissions per tonne. Our scope 1 emissions have increased as a consequence of our acquisition of the Combined Heat and Power (CHP) installation at our paper mill in Italy, which resulted in a corresponding drop in scope 2 emissions. Another consequence
of this has been a greater power generation capacity, and a resultant increase in exports of electricity to the grid, which have also contributed to an overall reduction in absolute emissions apportioned to internal production. The large impact of the CHP installations at our paper mills masks the many improvements across our packaging and plastics plants which are of a smaller scale but are nevertheless important. Of the 155 sites where a year-on-year comparison is possible, 102 have achieved reductions in absolute scope 1 emissions. This is the consequence of greater production efficiency and continued investments in more efficient boilers. Analysis of our performance in reducing scope 2 emissions tells a similar story, with 79 sites achieving an absolute reduction. This has largely been driven by initiatives to replace halogen lighting with LED lighting.
The figure for total production volume, used to normalise our total emissions, water and waste figures, has reduced slightly since the previous year. This is primarily due to consolidation of our assets and a shift in business mix. A number of recycling depots were closed during 2014, and this has outweighed increases in production in our packaging and paper making businesses. As a result, our emissions per tonne figure is lower than the improvement in absolute values.
This has also affected the amount of effluent water we have discharged. In absolute terms, there was an increase due to record production across a number of paper mills, but the overall denominator of all production across the Group results in a
worsened figure for our target, taken on a like-for-like basis. As indicated last year, this particular target is becoming less relevant as we focus more closely on the role water and steam play as carriers and stores of thermal energy. Future efforts will concentrate on reducing water throughput per tonne of production, and in the coming year this is likely to result in a recalibrated target.
As our business mix across Europe continues to evolve, the impact of those operations which still rely on landfill will become even further diluted, and our original waste to landfill target will increasingly also lose its relevance at a Group level. For this reason, in our Sustainability Report we will publish absolute values, by country, and establish site-specific targets to achieve zero waste to landfill in a timeframe that is feasible based on local waste management capacity and legislative requirements.
ENVIRONMENTAL PERFORMANCE INDICATORS We collect environmental data on a monthly basis, and report this data for the previous calendar year in order to align with the generally accepted practice of industry peers and external stakeholders. This aids sector and industry benchmarking. Emissions figures given in this report are therefore all on a calendar year basis. The environmental performance data table overleaf displays the data for calendar year 2014 together with the data previously reported for calendar year 2013.
DS SMITH CHARITABLE FOUNDATIONDS Smith is proud to have established the DS Smith Charitable Foundation. The purpose of the Charitable Foundation is to support with donations, charities with values aligned to those of DS Smith, in particular, charities that support the environment. As a large employer with a responsibility to the communities in which we operate, the Charitable Foundation also supports charities which help train young people and assist them into work.
More information on the work of the Charitable Foundation, including details of charities that have been supported and also how to apply for funding, can be found at www.dssmith.com/company/sustainability/social-responsibility/charitable-trust/

Strategic Report 35
dssmith.com
ENVIRONMENTAL PERFORMANCE INDICATORSGlobal Greenhouse Gas Emissions(Data for period 1 January 2014 to 31 December 2014)
Unit of measure 2014 2013 2012 ChangeScope 1: Combustion of fuel and operation of facilities ktonnes of CO2e 1,281 1,215 n/a 5.4%Scope 2: Electricity, heat, steam and cooling purchased for own use ktonnes of CO2e 526 576 n/a (8.6%)CO2e impact of electricity, heat, and steam exported to third parties ktonnes of CO2e (584) (519) n/a 12.4%Total 1,223 1,272 n/a (3.8%)
Other environmental indicatorsUnit of measure 2014 2013 2012 Change
Total production ktonnes 5,916 6,027 5,322 (1.8%)Electricity, heat, and steam exported to third parties GWh 2,183 1,995 n/a 9.4%Total effluent water discharged Mm3 17.0 16.6 16.0 2.4%Total waste to landfill ktonnes 63 64 68 (2.1%)
Our environmental targetsUnit of measure 2014 2013 2012 Change
Emissions per tonne of production (CO2e net of energy exports) kg CO2e/tonne 206.8 211.0 n/a (2.0%)Total effluent water discharged per tonne of production m3/tonne 2.9 2.8 3.0 4.3%Total waste to landfill per tonne of production kg/tonne 10.5 10.6 12.8 (0.3%)
Methodology 1 DS Smith collects and reports environmental data in accordance with the guidelines of the Global Reporting Initiative and the Greenhouse Gas Protocol (GHGP), to the extent that this is practicable.2 The figures reported above include data from all the Group’s wholly-owned or majority-owned manufacturing operations. Of the 89 sites whose production process requires fossil fuels
(paper mills, corrugating plants and foam plants), actual consumption figures were available for all sites. The total figures also include emissions data from a further 81 smaller production facilities that use only grid electricity.
3 The CO2 and CO2e emissions were calculated using the UK Department for Environment, Food & Rural Affairs 2014 emissions factors. The factors used for converting grid electricity reflect the mix of fuels used for electricity generation in each country.
4 Scope 3 emissions, from sources external to DS Smith but involved in the supply chains for the Group’s products and services, are not included.5 The waste figures relate to waste generated by our operations; they do not include waste collected from third-parties as a raw material by our recycling operations.6 Production is defined as sum of the production output in tonnes from each site whose energy, waste and water consumption is reported above.7 The combined heat and power plant that supplies Witzenhausen with steam is fired predominantly by biogenic fuels. The emission factor for this site has been estimated as 92.019 kg/MWh of CO2e.
Verification Statement from Bureau Veritas UK Ltd
Bureau Veritas UK has been commissioned by DS Smith Plc. (DS Smith) for the seventh year to provide an independent opinion on the Environmental Performance Indicators presented on this page of its 2015 Annual Report. Having completed a process of assessment including site visits, document review and interrogation of associated management and reporting systems, Bureau Veritas concludes that there is no evidence to suggest that the data presented here is not a fair and
accurate representation of DS Smith’s performance.
DS Smith should be commended on its approach to consistent data collection and the work which has been undertaken this year to ensure that there is a good understanding of associated processes across the company both at a Group and a site level. It remains clear that DS Smith is constantly looking to improve its internal processes and has proactively engaged in the verification process.
A full verification statement including the methodology, basis for the opinion, additional recommendations, limitations and a statement of Bureau Veritas’s independence can be found on the DS Smith Plc website at: www.dssmith.com/company/sustainability/environment/performance
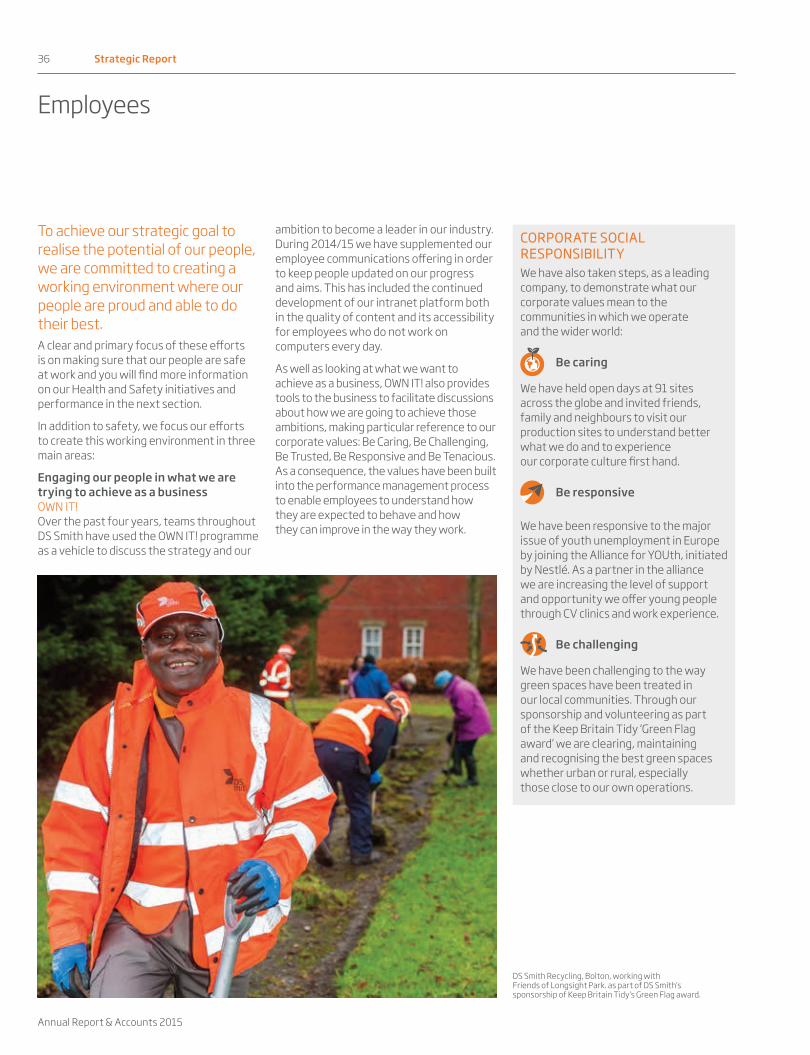
36 Strategic Report
Annual Report & Accounts 2015
To achieve our strategic goal to realise the potential of our people, we are committed to creating a working environment where our people are proud and able to do their best. A clear and primary focus of these efforts is on making sure that our people are safe at work and you will find more information on our Health and Safety initiatives and performance in the next section.
In addition to safety, we focus our efforts to create this working environment in three main areas:
Engaging our people in what we are trying to achieve as a businessOWN IT!Over the past four years, teams throughout DS Smith have used the OWN IT! programme as a vehicle to discuss the strategy and our
ambition to become a leader in our industry. During 2014/15 we have supplemented our employee communications offering in order to keep people updated on our progress and aims. This has included the continued development of our intranet platform both in the quality of content and its accessibility for employees who do not work on computers every day.
As well as looking at what we want to achieve as a business, OWN IT! also provides tools to the business to facilitate discussions about how we are going to achieve those ambitions, making particular reference to our corporate values: Be Caring, Be Challenging, Be Trusted, Be Responsive and Be Tenacious. As a consequence, the values have been built into the performance management process to enable employees to understand how they are expected to behave and how they can improve in the way they work.
CORPORATE SOCIAL RESPONSIBILITYWe have also taken steps, as a leading company, to demonstrate what our corporate values mean to the communities in which we operate and the wider world:
Be caring
We have held open days at 91 sites across the globe and invited friends, family and neighbours to visit our production sites to understand better what we do and to experience our corporate culture first hand.
Be responsive
We have been responsive to the major issue of youth unemployment in Europe by joining the Alliance for YOUth, initiated by Nestlé. As a partner in the alliance we are increasing the level of support and opportunity we offer young people through CV clinics and work experience.
Be challenging
We have been challenging to the way green spaces have been treated in our local communities. Through our sponsorship and volunteering as part of the Keep Britain Tidy ‘Green Flag award’ we are clearing, maintaining and recognising the best green spaces whether urban or rural, especially those close to our own operations.
Employees
DS Smith Recycling, Bolton, working with Friends of Longsight Park. as part of DS Smith's sponsorship of Keep Britain Tidy's Green Flag award.
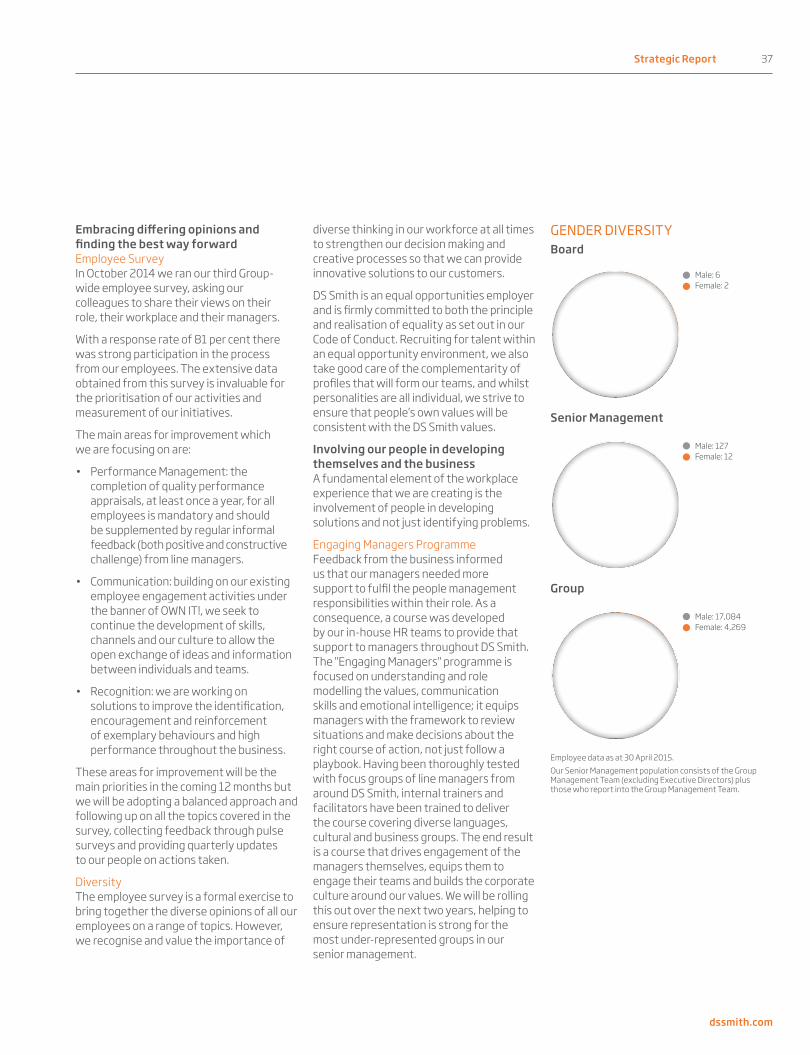
Strategic Report 37
dssmith.com
Embracing differing opinions and finding the best way forwardEmployee SurveyIn October 2014 we ran our third Group-wide employee survey, asking our colleagues to share their views on their role, their workplace and their managers.
With a response rate of 81 per cent there was strong participation in the process from our employees. The extensive data obtained from this survey is invaluable for the prioritisation of our activities and measurement of our initiatives.
The main areas for improvement which we are focusing on are:
• Performance Management: the completion of quality performance appraisals, at least once a year, for all employees is mandatory and should be supplemented by regular informal feedback (both positive and constructive challenge) from line managers.
• Communication: building on our existing employee engagement activities under the banner of OWN IT!, we seek to continue the development of skills, channels and our culture to allow the open exchange of ideas and information between individuals and teams.
• Recognition: we are working on solutions to improve the identification, encouragement and reinforcement of exemplary behaviours and high performance throughout the business.
These areas for improvement will be the main priorities in the coming 12 months but we will be adopting a balanced approach and following up on all the topics covered in the survey, collecting feedback through pulse surveys and providing quarterly updates to our people on actions taken.
DiversityThe employee survey is a formal exercise to bring together the diverse opinions of all our employees on a range of topics. However, we recognise and value the importance of
diverse thinking in our workforce at all times to strengthen our decision making and creative processes so that we can provide innovative solutions to our customers.
DS Smith is an equal opportunities employer and is firmly committed to both the principle and realisation of equality as set out in our Code of Conduct. Recruiting for talent within an equal opportunity environment, we also take good care of the complementarity of profiles that will form our teams, and whilst personalities are all individual, we strive to ensure that people’s own values will be consistent with the DS Smith values.
Involving our people in developing themselves and the businessA fundamental element of the workplace experience that we are creating is the involvement of people in developing solutions and not just identifying problems.
Engaging Managers ProgrammeFeedback from the business informed us that our managers needed more support to fulfil the people management responsibilities within their role. As a consequence, a course was developed by our in-house HR teams to provide that support to managers throughout DS Smith. The "Engaging Managers" programme is focused on understanding and role modelling the values, communication skills and emotional intelligence; it equips managers with the framework to review situations and make decisions about the right course of action, not just follow a playbook. Having been thoroughly tested with focus groups of line managers from around DS Smith, internal trainers and facilitators have been trained to deliver the course covering diverse languages, cultural and business groups. The end result is a course that drives engagement of the managers themselves, equips them to engage their teams and builds the corporate culture around our values. We will be rolling this out over the next two years, helping to ensure representation is strong for the most under-represented groups in our senior management.
GENDER DIVERSITYBoard
Senior Management
Group
Employee data as at 30 April 2015. Our Senior Management population consists of the Group Management Team (excluding Executive Directors) plus those who report into the Group Management Team.
75%
25%
Male: 6Female: 2
20%
Male: 17,084Female: 4,269
80%
9%Male: 127Female: 12
91%

38 Strategic Report
Annual Report & Accounts 2015
HEALTHY HEARTSSince DS Smith launched the “Healthy Heart Mark” employee campaign in the UK in January 2014, over 1,300 employees have received an individual lifestyle check providing workers with the opportunity to have their blood pressure, cholesterol levels, BMI and waist measurements checked and ask questions about their lifestyle habits.
In addition, four sites have already been presented with Bronze Awards in recognition of their efforts by Heart Research UK. To achieve the Bronze Award, sites have to demonstrate that they are promoting and educating their employees on the benefits of making the right lifestyle choices.
There are many initiatives being run at all the UK packaging sites but here are a few of them:
• At Belper they offer “healthy options” within their canteen and all sites now offer free fruit one day per week.
• Our Lockerbie site is running a Weight Loss Club.
• At our site in Crumlin they have placed “Fit to Work” notices around the site to highlight the benefits of different activities such as taking the stairs or walking to see a colleague rather than e-mailing.
• Hosting a DS Smith UK six-a-side football tournament — the Healthy Heart Cup!
The initiative is going from strength to strength and we are committed to supporting our employees to achieve sustained improvements in their heart health.
HEALTH AND SAFETYThe safety of our people remains a cornerstone of our business. We seek to improve our performance continuously as a Group and strive to ensure that our colleagues and the public are kept safe.
Health and Safety Key Performance Indicators
2014/15 2013/14 Variance
Total LTAs 146 171 (15%)AFR 4.16 4.79 (13%)
Definition: Lost Time Accident (LTA): number of accidents resulting in lost time of one shift or more.Accident Frequency Rate (AFR): number of LTAs per million hours worked.
We are delighted to report another year where our key safety measures of LTAs and of AFR, have both continued to improve. This has been the result of a programme of continuous improvement and the high priority assigned to safe working practices.
Our goal is for zero accidents. Any accident which causes injury and suffering is one too many. We are committed to achieving a zero accident culture and recognise that more work needs to be done on improving our sites, reducing risks and raising our safety awareness. We believe that this target, although challenging, is achievable. Our Benelux region had no LTAs for the whole year (having had six in the prior financial year) and 182 sites had no LTAs in the year, up from 132 in the prior year. It is our challenge to extend this to the full Group.
The Group Health and Safety Director leads the Safety Leadership Group (SLG), which coordinates Group policy and best practice from the various parts of the organisation and further raises the visibility of safety within the organisation. The SLG meets monthly to review major LTAs/high potential severity incidents, thus further improving the level of challenge on accident investigation.
The SLG has also set up working groups on specific topics such as machine guarding and workplace transport and is working to identify and share best practice across the Group. It has also revised the safety incident definitions and is in the process of revising the Group’s safety policies.
Going forward the business will continue to set stretching safety key performance indicators to act as milestones to a zero accident culture. These are tracked and
reported monthly to the Group Management Team, with quarterly reports to the Board as in previous years. The established Divisional safety audits will continue with support from external consultants as well as internal specialists. These audits assist the sites in reducing risks and establish greater consistency within the Group.
Employees continued

Strategic Report 39
dssmith.com
Principal Risks
Providing better risk insight each year.RISKS AND OUR BUSINESS MODELDS Smith has clear risk management objectives and an established strategy to deliver on these through its core, risk-managed processes. At a strategic level our risk management objectives are to identify the Group’s principal risks and to formulate actions to ensure that the Group’s Corporate Plan and strategic priorities are aligned with the Group’s appetite for, and ability to tolerate, these risks over a rolling five year period.
Risk identification and assessment is an integral part of our corporate planning process, with the objective that the Board continues to have improved visibility of the Group’s principal risks and uncertainties, the consequences of those risks and the controls in place to manage them.
The Group recognises it is subject to many general risks such as changes in socio-economic conditions, political, financial, general regulatory and legislative changes including events that the Group cannot influence, but whose effect can impact on its ability to deliver on the Corporate Plan.
The risks we face, in the markets we choose to operate in, do not change significantly from year to year, but their influence on our Corporate Plan can vary in magnitude and frequency and this influences the way we seek to reduce or exploit risks in the pursuit of our objectives. The relative influences of each principal risk on our Corporate Plan are reflected in the Board’s current view on the risk trends and are categorised as stable, increasing or decreasing; as shown in Figure 1.
STRATEGIC RISK-OPPORTUNITY TRENDS 2014/15
Risk descriptionX 2015 X 2014
1 Commercial differentiation risks
2 Integration risks
3 Acquisition strategy
4 Capital markets and liquidity risks
5 Eurozone macroeconomic and deflationary risk
6 Market consolidation risks
7 Legal/Regulatory/ Governance risks
8 Security of supply risks
9 Sustainability risks
* Bold text indicates those risks which have changed during 2014/15. Axes not to scale
1
6
9
7
3
5
2 3
261
9
4
4
Increasing OpportunityIncr
easi
ng R
isk
In 2015, consideration of our critical risks as well as our strategic priorities resulted in the inclusion of one additional risk classified within the context of European economic uncertainty (most notably Eurozone deflationary risks) and the separation of acquisition and market consolidation risks into two distinct risk categories.
A summary of the Group’s principal risks and uncertainties that are inherent to our business model and that can directly impact the successful execution of the Group’s strategy are shown in the following schedule. They are regularly monitored by the Board and the General Management Team (GMT) in terms of how they are managed and the mitigation strategies adopted to build greater resilience against risks that could disrupt achievement of our strategic priorities.
8
Figure 1

40 Strategic Report
Annual Report & Accounts 2015
Principal Risks continued
Size of circle = Risk impact
Line thickness = Strength of connection
Securities ofSupply Risks
IntegrationRisks
AcquisitionStrategy Risks
SustainabilityRisks
Commercial Business
Di�erentiation Risks
Market Consolidation
Risks
Legal / Regulatory / Governance
Risks
Capital Markets and
Liquidity Risks
Eurozone Macroeconomic and De�ationary
Risks
MANAGING OUR CONNECTED RISKSRISK APPETITE AND TOLERANCEThe principal risks within our business model reflect the Group’s view that risks, by their very nature, also bring the potential for reward, and that whilst there are some risks that the Group chooses to avoid, there are other risks that we choose to manage and others that the Group actively accepts and seeks in pursuit of our strategic priorities and targets. The Group heat map is a way of presenting how we balance risk and reward within the defined criteria of the Group risk appetite and tolerance statements. This allows the Group to take certain risks where it has management know-how, experience and the operational skill to manage them and thereby ensure the Group can deliver on its Corporate Plan.
RISK MANAGEMENT EFFECTIVENESSOur risk management process considers our principal risks within the context of a “portfolio” of connected risks. Members of our GMT take a lead sponsorship role in assessing each risk portfolio so that there remains a close connection between the potential disruption that could be caused by one or more of these risks transpiring and how our operations can adapt to avoid, manage or react to the consequences of changing events. The overall intention of our risk management efforts is to minimise the impact of any prolonged adverse risk materialising in our Corporate Plan period.
Our process, as defined last year in our Annual Report, remained in force during 2015 with Group risks being considered by the GMT, and risk dashboards maintained and reviewed by the Group, each Division, and, in the case of Packaging, each region. These risk dashboards are the result of input and challenge undertaken by the senior executives throughout the Group. They are maintained and revised by considering not only the risks that have the potential to disrupt the Group’s planned targets but also the potential opportunities available.
We continue to recognise the significant interdependencies between our principal risks. Our connections diagram (Figure 2)highlights how the Group considers the consequences of one risk as a potential trigger of, or influence on another. By understanding the relationships between our key risks, the Group considers it is better placed to ensure that the strategy and the
measures taken to manage the delivery of plan targets are robust and facilitates stronger GMT and Division-level discussions on risk and the appropriateness of our current controls.
Figure 2

Strategic Report 41
dssmith.com
To delight our customers
To realise the potential of our people
To double the size and profitability of the business
COMMERCIAL DIFFERENTIATION RISKS• We fail to anticipate and are
ill-equipped to meet the demand for new packaging services.
• Our customer base rejects our differentiated product and service offers.
• Differentiation fails to enhance volumes and margins.
INTEGRATION RISKS
• Business process failure and Group cultural disintegration.
• Failure to implement functional organisation hierarchy in order to support integration synergies as the Group expands into new geographies.
ACQUISITION STRATEGY RISKS
• Failure to target acceptable acquisition opportunities across Europe.
• Acquisitions do not deliver on the key corporate metrics.
Resilience• Long-term commitment to properly
resource research and development, taking concepts through to commercial implementation within a clear defined methodology.
• A shared strategy for innovation across our businesses which is rolled out via our systems and the network of design centres that we are investing in.
• A well-established process for the successful introduction and management of new products and services.
• Extending our product and services offering through the design and development of packaging consultancy services.
• Undertake extensive customer engagement work to ensure our innovation is aligned to future customer needs.
Board Risk Monitoring• Board review through presentations
on specific packaging sectors including a review of industrial and performance packaging strategy, risks and opportunities.
Resilience• Continuing to develop our talent,
strengthen our leadership capability, our employee skill base to connect all our people so we are seen as the employer of choice in our markets.
• Our OWN IT! employee communications campaign continues as the cornerstone of our cultural integration strategy.
• Establishing a process for embedding a world class employee safety culture, common reporting and strengthening our internal communications.
• Establishing a performance and talent management process where employees and management can gauge development opportunities, produce and review succession plans and monitor successes.
Board Risk Monitoring• Board review of the Group’s human resources
programme on talent management, embedding the performance reviews and competencies framework. The Board also reviewed the results of the employee opinion survey undertaken in 2014.
Resilience• Acquired additional management experience
and processes for sourcing, assessing and executing sound transactions.
• Country and market entry strategies based on a strategy to strengthen our supply cycle model.
• Improving internal processes using our acquisition pipeline and executing more efficiently.
• Acquisition execution team focused on effective “bolt-on" acquisition management and integration.
• Specific investments in mature markets.
• Targeted growth where higher than Eurozone benchmark.
Board Risk Monitoring• Regular reviews undertaken as part of
the Board’s review of the Corporate Plan. Regular updates of acquisition opportunities including evaluations and execution risk.

42 Strategic Report
Annual Report & Accounts 2015
Principal Risks continued
To double the size and profitability of the business continued
CAPITAL MARKET AND LIQUIDITY RISKS• Unable to meet funding
needs without incurring unacceptable costs.
• Unplanned decreases and/or changes in funding sources restricts our financial flexibility to meet plan targets.
EUROZONE MACRO-ECONOMIC AND DEFLATIONARY RISKS• Our relative market performance in
core Eurozone countries is affected by a prolonged ceiling on growth and an adverse foreign exchange position results in a disproportionate negative impact to earnings.
MARKET CONSOLIDATION RISKS• Our relative competitive position
is weakened by competitor and supplier influences and forces a material volume drop and prolonged margin squeeze in one or more of our principal territories.
Resilience• Activities are focused on securing
access to debt capital and active management of our bank relations and the bank market in general.
• Centralised treasury function continues to focus on cash and cash pooling so that surplus funds repay drawings under committed bank facilities to ensure adequate financial liquidity.
• Maintaining strong core banking relationships assures us that there are few limitations for raising additional financings for the Group.
• Strong engagement with providers of equity capital.
Board Risk Monitoring• Audit Committee review and
recommendation to the Board regarding “going concern”.
• Regular reviews of liquidity schedules, cash flows and covenant headroom.
Resilience• Management teams continue to
lead projects based on all forms of cost optimisation and operational efficiency improvement including rationalisation projects.
• Continue to invest in a strategy to address any long-term Eurozone currency imbalances within our portfolio by managing the potential impacts of short-term slower-growth markets with opportunities in other higher-growth geographies.
Board Risk Monitoring• Board meeting reviews on performance
and forecasts of the business activities in relation to the macroeconomic environment provided by the Group Chief Executive and Group Finance Director at each Board meeting.
Resilience• Experienced leadership team participates
in the review of consolidation implications and ready to react with contingency arrangements.
• Implementation of specific Divisional “competitiveness “ projects including cost optimisation, investment in new technology, site expansion and location realignment to support the volume and quality demands of our customer base.
Board Risk Monitoring• Regular Board updates provided as
part of acquisition reviews.
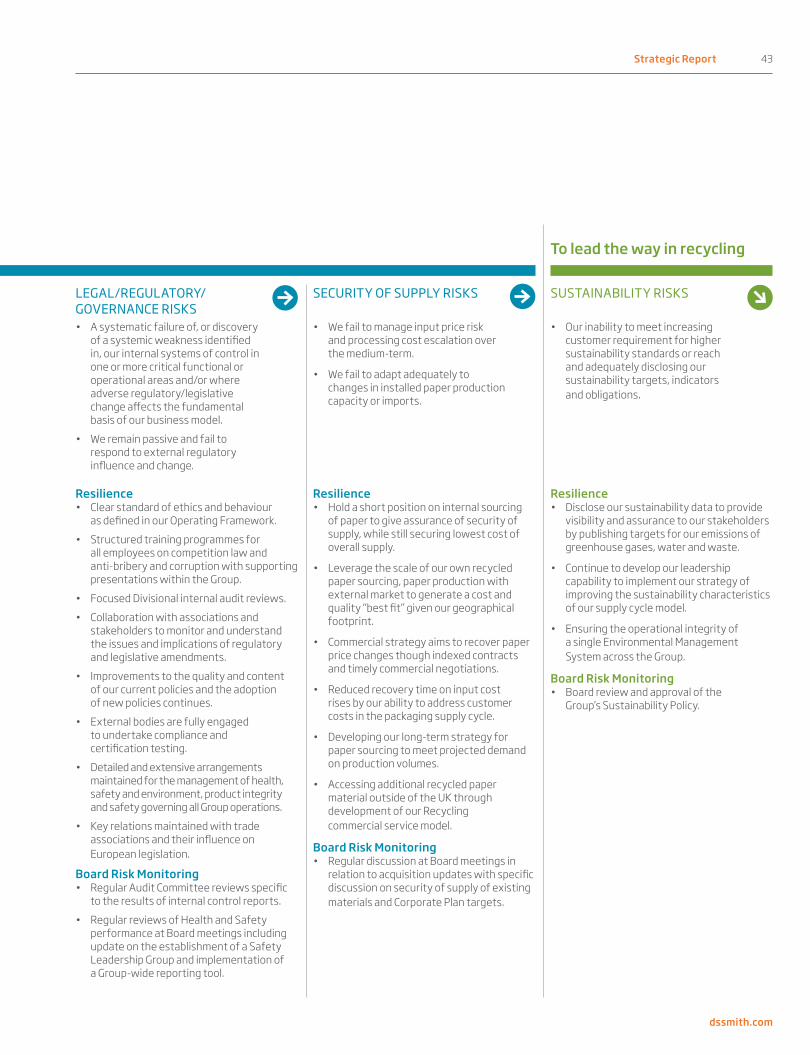
Strategic Report 43
dssmith.com
To lead the way in recycling
LEGAL/REGULATORY/ GOVERNANCE RISKS• A systematic failure of, or discovery
of a systemic weakness identified in, our internal systems of control in one or more critical functional or operational areas and/or where adverse regulatory/legislative change affects the fundamental basis of our business model.
• We remain passive and fail to respond to external regulatory influence and change.
SECURITY OF SUPPLY RISKS
• We fail to manage input price risk and processing cost escalation over the medium-term.
• We fail to adapt adequately to changes in installed paper production capacity or imports.
SUSTAINABILITY RISKS • Our inability to meet increasing
customer requirement for higher sustainability standards or reach and adequately disclosing our sustainability targets, indicators and obligations.
Resilience• Clear standard of ethics and behaviour
as defined in our Operating Framework.• Structured training programmes for
all employees on competition law and anti-bribery and corruption with supporting presentations within the Group.
• Focused Divisional internal audit reviews.• Collaboration with associations and
stakeholders to monitor and understand the issues and implications of regulatory and legislative amendments.
• Improvements to the quality and content of our current policies and the adoption of new policies continues.
• External bodies are fully engaged to undertake compliance and certification testing.
• Detailed and extensive arrangements maintained for the management of health, safety and environment, product integrity and safety governing all Group operations.
• Key relations maintained with trade associations and their influence on European legislation.
Board Risk Monitoring• Regular Audit Committee reviews specific
to the results of internal control reports.• Regular reviews of Health and Safety
performance at Board meetings including update on the establishment of a Safety Leadership Group and implementation of a Group-wide reporting tool.
Resilience• Hold a short position on internal sourcing
of paper to give assurance of security of supply, while still securing lowest cost of overall supply.
• Leverage the scale of our own recycled paper sourcing, paper production with external market to generate a cost and quality “best fit” given our geographical footprint.
• Commercial strategy aims to recover paper price changes though indexed contracts and timely commercial negotiations.
• Reduced recovery time on input cost rises by our ability to address customer costs in the packaging supply cycle.
• Developing our long-term strategy for paper sourcing to meet projected demand on production volumes.
• Accessing additional recycled paper material outside of the UK through development of our Recycling commercial service model.
Board Risk Monitoring• Regular discussion at Board meetings in
relation to acquisition updates with specific discussion on security of supply of existing materials and Corporate Plan targets.
Resilience• Disclose our sustainability data to provide
visibility and assurance to our stakeholders by publishing targets for our emissions of greenhouse gases, water and waste.
• Continue to develop our leadership capability to implement our strategy of improving the sustainability characteristics of our supply cycle model.
• Ensuring the operational integrity of a single Environmental Management System across the Group.
Board Risk Monitoring• Board review and approval of the
Group’s Sustainability Policy.

44 Governance
Annual Report & Accounts 2015
Introduction to Corporate Governance
Changing governance needs.DEAR SHAREHOLDERS The need for good governance has been highlighted frequently in the last year as board effectiveness and reputational risk continue to exercise the headline writers. No company can ever say it has the 'perfect Board' but we all know what 'good' looks like. Good governance is fundamental to the way we do business. We believe it is our governance structure that supports our ability to become the leading provider of corrugated packaging in Europe.
To build a strong, successful and enduring business, we must have policies, processes and systems in place which achieve the right balance between our stakeholders and our own short, medium and long-term objectives. We must provide acceptable returns to our investors, but our capacity to do this is underpinned by a strong and mutually beneficial relationship with all of our stakeholders. This includes our employees, customers, suppliers, regulators and the communities in which we operate.
In the following pages, we have outlined our approach to governance and explained some of the challenges and how we dealt with them. Significant changes have been made to the requirements to manage and report risk, which apply to listed companies for accounting periods beginning on or after 1 October 2014. Although these changes do not formally apply to DS Smith's Annual Report until next year, we have already begun addressing them, as you will see on pages 39 to 43.
Having the right culture is crucially important to enable us to create a working environment where our people are proud and able to do their best. As part of that, this year we refreshed our Data Protection and Social Media policies and rolled them out
across all our sites. These policies sit in our governance framework, which includes our Operating Framework and Code of Conduct together with our values. The Operating Framework is key to the way we work with our colleagues and with our customers and suppliers.
The Directors have stated on page 79 that they consider the Annual Report and Accounts, taken as a whole, to be fair, balanced and understandable. The processes which support the Directors’ confidence in making this statement are long established and embedded into our business. The Audit Committee considered the criteria for a fair, balanced and understandable Annual Report. With this in mind, the Audit Committee reviewed the processes supporting the compilation and assurance of the report, in relation to financial and non-financial management information. Our external Auditor reviews the narrative sections of the Annual Report and Accounts to identify any material inconsistencies with the financial statements. The Directors received drafts of the Annual Report and Accounts and reviewed them at the April and June Board meetings in 2015.
I am pleased to confirm that the Company has complied in full with the Code throughout this financial year. I can assure you that I, and all the Board, are committed to ensuring that DS Smith operates to the highest standards of corporate governance.
Gareth DavisChairman
Key Responsibilities of the Board• We are responsible and accountable
to our shareholders for the long-term sustainable success of the Group. We seek to achieve this through setting out our strategy, monitoring our strategic objectives and providing oversight of our implementation by the management team.
• We ensure that the Company remains at the forefront of developing and embedding best practice for risk management.
• We maintain and enhance DS Smith’s culture, ensuring that management operates responsibly within our governance framework while clearly demonstrating our values and high ethical standards.
• As part of the governance framework, we have adopted a schedule of matters on which we must make the final decision. These include the annual budget, substantial acquisitions and disposals, the approval of the full-year and half-year results and a review of the overall system of internal control and risk management.
• We are mindful of our legal duties to act in the way we consider, in good faith, will be most likely to promote the success of the Company for its shareholders and having regard also to the interests of other stakeholders.
• We continue to monitor senior executive talent management and development plans to provide succession for all key positions.

Governance 45
dssmith.com
Key activities in 2014/15 Key priorities in 2015/16
Strategy • Reviewed and approved the Corporate Plan.• Reviewed and approved a number of acquisitions and divestments.• Reviewed financial KPIs.• The Group’s dividend policy was debated and approved.
• Approve and keep under review the Corporate Plan.• Consider acquisitions and divestments as identified
and determine appropriate course of action.• Keep the financial KPIs under review.• Keep the Group’s dividend policy under review.
Risk and risk management
• Approved the updated social media and data protection policies.• Reviewed key risks (see pages 39 to 43) and monitored and reviewed the
internal controls process, and assessed the Group risk profile by identifying where the business’s key risks lay, aligning them with the risk appetite of the business and highlighting how to target effectively and mitigate those risks.
• Monitored compliance with the anti-bribery and anti-corruption policy and the competition law policy.
• Review key risks and ensure that the Company remains at the forefront of developing and embedding best practice for risk management.
• Continue to monitor compliance with the key policies, including anti-bribery and anti-corruption policy, competition law policy, social media policy and data protection policy.
Governance and values
Leadership and employees:• Considered the changes to the UK Corporate Governance Code in the
context of DS Smith’s governance practices.• Continued to focus on the composition, balance and effectiveness
of the Board.• Reviewed the key operational roles and identified gaps in experience
needed to deliver the strategy.• Reinforced compliance with DS Smith’s Code of Conduct and the Operating
Framework, a document which sets out the Group’s culture and values, as well as its key policies and procedures, all in accordance with the principles of good corporate governance.
Relations with shareholders:• Broker review.• Received shareholder approval for our remuneration policy.• Engaged with our retail shareholders at the AGM.• Actively engaged with institutional shareholders, investors and other
stakeholders throughout the year.
• Ensure that the Company remains at the forefront of developing and embedding best practice in responsible business behaviour.
• Maintain and enhance DS Smith’s culture and values and key policies and procedures and ensure these are rolled out to acquired businesses.
• Continue to strengthen internal controls and reporting.
• Review level of institutional holdings and consider actions to broaden further the Group’s shareholder base.
Organisational capacity
• Monitored health and safety performance across the Group and reviewed the lessons learned, ensuring we keep our employees and others affected by our operations safe.
• Held meetings between the Board and senior talent pipeline to further improve information flow.
• Reviewed the governance framework and continued training and awareness drives for key policies.
• Continue to monitor senior executive talent management and development plans to provide succession for all key positions.
• Continue to increase the diversity of the Board and management team.
Board development
• Continued to focus on the composition, balance and effectiveness of the Board. Reviewed Board composition and discussed and acted on the recommendations of the Nomination Committee.
• Undertook an evaluation, led by an external facilitator, of the Board and its Committees with the aim of becoming the best Board we can be. Following the evaluation an action plan was developed.
• Enhance the Board’s strategic understanding of geopolitical and economic risks in international markets.
• Use Board visits to promote understanding of markets and the business development opportunities they offer.
• Annual evaluation of Board performance – to be led internally.

46 Governance
Annual Report & Accounts 2015
Leading change through good governance
Board of Directors and Company Secretary
1 Gareth DavisChairman
Appointment: Appointed to the Board on 1 June 2010 as a non-Executive Director. He became Chairman of the Board on 4 January 2012 and is Chairman of the Nomination Committee.
Skills and experience: He is Chairman of both William Hill PLC and Wolseley plc. He was previously Group Chief Executive of Imperial Tobacco Group PLC.
2 Miles RobertsGroup Chief Executive
Appointment: Appointed to the Board on 4 May 2010 as Group Chief Executive.
Skills and experience: He is a non-Executive Director and Senior Independent Director of Poundland Group plc. He was previously Chief Executive of McBride plc, having originally joined as its Group Finance Director.
3 Adrian MarshGroup Finance Director
Appointment: Appointed to the Board on 24 September 2013 as Group Finance Director.
Skills and experience: He was previously Group Director of Tax, Treasury and Corporate Finance of Tesco PLC. Prior to this, he was European CFO at AstraZeneca plc and CFO Global Building Products at Pilkington plc.
4 Chris BrittonNon–Executive Director
Appointment: Appointed to the Board on 6 March 2013 as a non-Executive Director.
Skills and experience: He is Chairman of Graze, and was non-Executive Director of Alliance Boots GmbH for six years. Before co-founding B&B Investment Partners in 2013, a specialist Investment Fund, he was Chairman of Ella’s Kitchen, Chief Executive Officer of Findus Group, Executive Board member and President of the Baby Division of Royal Numico, and also worked for Diageo in various general management and marketing positions, latterly as Global Marketing Director.
5 Ian GriffithsNon–Executive Director
Appointment: Appointed to the Board on 23 June 2014 as a non-Executive Director.
Skills and experience: He is Group Finance Director of ITV plc. He was at Emap plc for 13 years in various senior finance positions including as Group Finance Director from 2005 to 2008. Prior to that, he was at Ernst & Young, where he worked in the corporate finance team.
6 Jonathan NichollsSenior Independent Director
Appointment: Appointed to the Board on 1 December 2009 as a non-Executive Director. He is the Senior Independent Director and is the Chairman of the Audit Committee.
Skills and experience: He was previously Group Finance Director of Hanson Plc and, most recently, Group Finance Director of Old Mutual Plc. He is a non-Executive Director, Senior Independent Director and Chairman of the Audit Committee of Great Portland Estates plc and a non-Executive Director
RN
N G
G
ARN
ARN
ARN
1 2 3
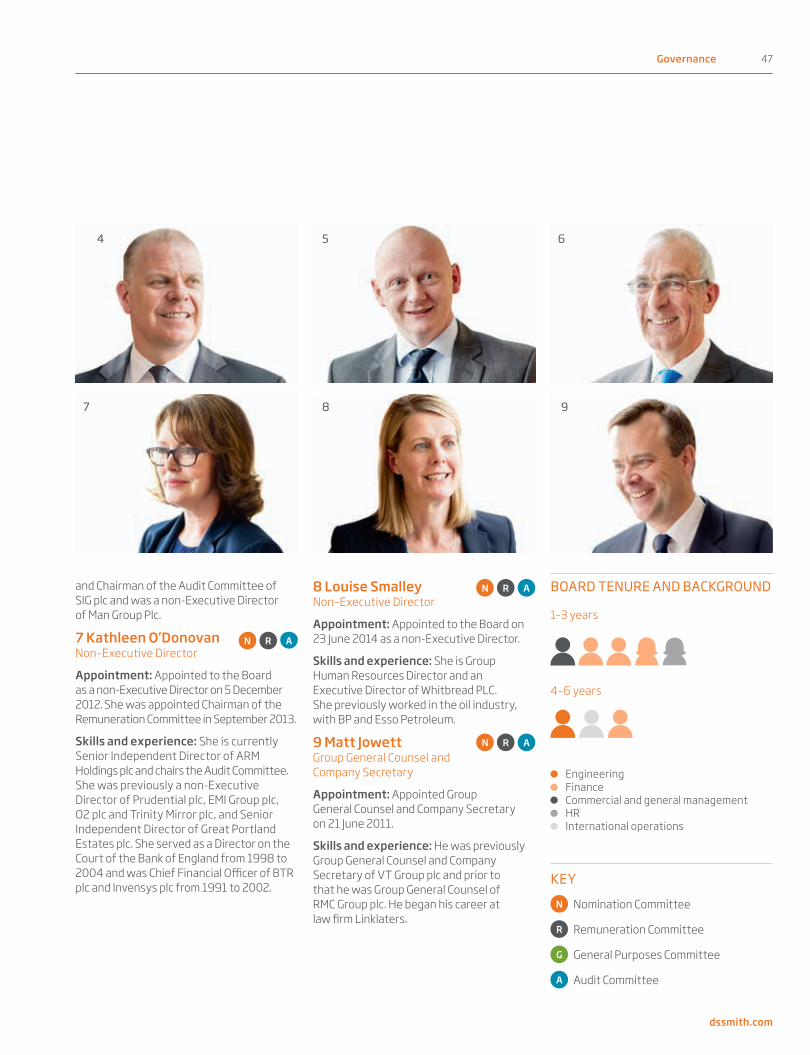
Governance 47
dssmith.com
BOARD TENURE AND BACKGROUND
1–3 years
4–6 years
EngineeringFinanceCommercial and general management
HRInternational operations
and Chairman of the Audit Committee of SIG plc and was a non-Executive Director of Man Group Plc.
7 Kathleen O’DonovanNon–Executive Director
Appointment: Appointed to the Board as a non-Executive Director on 5 December 2012. She was appointed Chairman of the Remuneration Committee in September 2013.
Skills and experience: She is currently Senior Independent Director of ARM Holdings plc and chairs the Audit Committee. She was previously a non-Executive Director of Prudential plc, EMI Group plc, O2 plc and Trinity Mirror plc, and Senior Independent Director of Great Portland Estates plc. She served as a Director on the Court of the Bank of England from 1998 to 2004 and was Chief Financial Officer of BTR plc and Invensys plc from 1991 to 2002.
8 Louise SmalleyNon–Executive Director
Appointment: Appointed to the Board on 23 June 2014 as a non-Executive Director.
Skills and experience: She is Group Human Resources Director and an Executive Director of Whitbread PLC. She previously worked in the oil industry, with BP and Esso Petroleum.
9 Matt JowettGroup General Counsel and Company Secretary
Appointment: Appointed Group General Counsel and Company Secretary on 21 June 2011.
Skills and experience: He was previously Group General Counsel and Company Secretary of VT Group plc and prior to that he was Group General Counsel of RMC Group plc. He began his career at law firm Linklaters.
ARN
ARN
ARN
KEYN Nomination Committee
R Remuneration Committee
G General Purposes Committee
A Audit Committee
4 6
7 8 9
5

48 Governance
Annual Report & Accounts 2015
Directors' Governance Report
GROUP ANNUAL REPORTING FRAMEWORK
Financial results and reports to investors • Full–year results• Half–year results• Trading updates
Board meetings • Seven Board meetings a year
Group Management Team (GMT) • Eleven GMT meetings a year
Trading meetings • Each division provides
monthly updates
Sustainability governance • Four Sustainability
Committee meetings
Talent and performance review process • Talent and
performance reviews• Bonus targets and payments• Salary reviews
Corporate planning cycle • Divisional strategy
development• Board approval
Budgetary process • Divisional budget
development• Board approval
JANUARY DECEMBER
NOVEMBER
OCT
OB
ER
SEPTEMBER
AUGUST
JULYJUNE
MAY
APR
IL
MA
RCH
FEBRUARY
mtg.Board
mtg.
Board m
tg.
Boar
d
Boardm
tg.
Boardmtg.Board
mtg.
Board
mtg
.
AGM
Budgetary process
Corporate planning cycleGMTmtg.
GMT
mtg.
GMT
mtg.
mtg.
GMT
mtg.GMT
mtg.
GMT
mtg.GMT
mtg.GMT
mtg
.GM
T
GMTmtg.
GMT
mtg
.
Tradingmtg.
Tradingmtg.
Tradingmtg.
Tradingm
tg.Trading
mtg.
Trading
mtg
.
Trad
ing
mtg
.
mtg.
Trading
mtg.
Trading
mtg.Trading
mtg.Trading
mtg.
Trading
mtg
.Tr
adin
g
Bonus targetLTI review Bonus payment
Salary review
perf
. rev
iew
Mid
-yea
r
Talent reviews
Performance review
s
Sustainability governance
Sustainability governance
resultsHalf year
resultsFull year
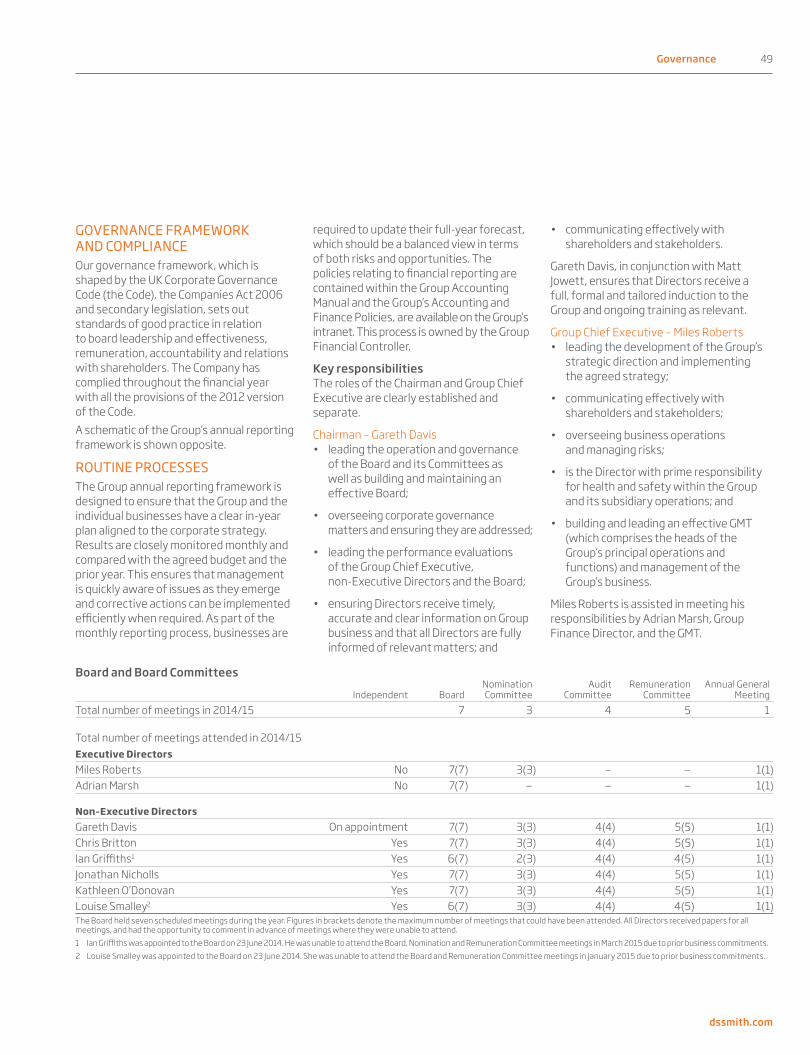
Governance 49
dssmith.com
GOVERNANCE FRAMEWORK AND COMPLIANCEOur governance framework, which is shaped by the UK Corporate Governance Code (the Code), the Companies Act 2006 and secondary legislation, sets out standards of good practice in relation to board leadership and effectiveness, remuneration, accountability and relations with shareholders. The Company has complied throughout the financial year with all the provisions of the 2012 version of the Code. A schematic of the Group’s annual reporting framework is shown opposite.
ROUTINE PROCESSESThe Group annual reporting framework is designed to ensure that the Group and the individual businesses have a clear in-year plan aligned to the corporate strategy. Results are closely monitored monthly and compared with the agreed budget and the prior year. This ensures that management is quickly aware of issues as they emerge and corrective actions can be implemented efficiently when required. As part of the monthly reporting process, businesses are
Board and Board Committees
Independent BoardNomination Committee
Audit Committee
Remuneration Committee
Annual General Meeting
Total number of meetings in 2014/15 7 3 4 5 1 Total number of meetings attended in 2014/15Executive DirectorsMiles Roberts No 7(7) 3(3) — — 1(1)Adrian Marsh No 7(7) — — — 1(1) Non–Executive DirectorsGareth Davis On appointment 7(7) 3(3) 4(4) 5(5) 1(1)Chris Britton Yes 7(7) 3(3) 4(4) 5(5) 1(1)Ian Griffiths1 Yes 6(7) 2(3) 4(4) 4(5) 1(1)Jonathan Nicholls Yes 7(7) 3(3) 4(4) 5(5) 1(1)Kathleen O’Donovan Yes 7(7) 3(3) 4(4) 5(5) 1(1)Louise Smalley2 Yes 6(7) 3(3) 4(4) 4(5) 1(1)The Board held seven scheduled meetings during the year. Figures in brackets denote the maximum number of meetings that could have been attended. All Directors received papers for all meetings, and had the opportunity to comment in advance of meetings where they were unable to attend.1 Ian Griffiths was appointed to the Board on 23 June 2014. He was unable to attend the Board, Nomination and Remuneration Committee meetings in March 2015 due to prior business commitments.2 Louise Smalley was appointed to the Board on 23 June 2014. She was unable to attend the Board and Remuneration Committee meetings in January 2015 due to prior business commitments.
required to update their full-year forecast, which should be a balanced view in terms of both risks and opportunities. The policies relating to financial reporting are contained within the Group Accounting Manual and the Group’s Accounting and Finance Policies, are available on the Group’s intranet. This process is owned by the Group Financial Controller.
Key responsibilitiesThe roles of the Chairman and Group Chief Executive are clearly established and separate.
Chairman – Gareth Davis • leading the operation and governance
of the Board and its Committees as well as building and maintaining an effective Board;
• overseeing corporate governance matters and ensuring they are addressed;
• leading the performance evaluations of the Group Chief Executive, non-Executive Directors and the Board;
• ensuring Directors receive timely, accurate and clear information on Group business and that all Directors are fully informed of relevant matters; and
• communicating effectively with shareholders and stakeholders.
Gareth Davis, in conjunction with Matt Jowett, ensures that Directors receive a full, formal and tailored induction to the Group and ongoing training as relevant.
Group Chief Executive – Miles Roberts• leading the development of the Group’s
strategic direction and implementing the agreed strategy;
• communicating effectively with shareholders and stakeholders;
• overseeing business operations and managing risks;
• is the Director with prime responsibility for health and safety within the Group and its subsidiary operations; and
• building and leading an effective GMT (which comprises the heads of the Group’s principal operations and functions) and management of the Group’s business.
Miles Roberts is assisted in meeting his responsibilities by Adrian Marsh, Group Finance Director, and the GMT.
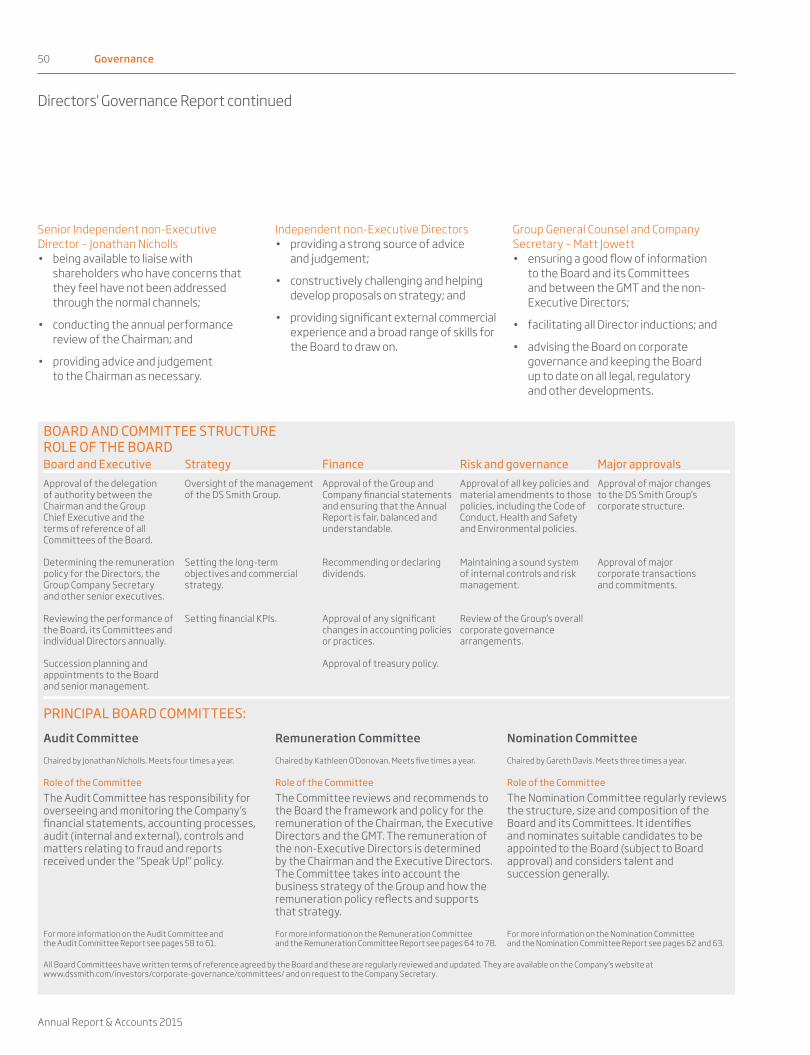
50 Governance
Annual Report & Accounts 2015
Directors' Governance Report continued
Senior Independent non-Executive Director – Jonathan Nicholls• being available to liaise with
shareholders who have concerns that they feel have not been addressed through the normal channels;
• conducting the annual performance review of the Chairman; and
• providing advice and judgement to the Chairman as necessary.
Independent non-Executive Directors• providing a strong source of advice
and judgement;
• constructively challenging and helping develop proposals on strategy; and
• providing significant external commercial experience and a broad range of skills for the Board to draw on.
Group General Counsel and Company Secretary – Matt Jowett• ensuring a good flow of information
to the Board and its Committees and between the GMT and the non-Executive Directors;
• facilitating all Director inductions; and
• advising the Board on corporate governance and keeping the Board up to date on all legal, regulatory and other developments.
BOARD AND COMMITTEE STRUCTURE ROLE OF THE BOARDBoard and Executive Strategy Finance Risk and governance Major approvalsApproval of the delegation of authority between the Chairman and the Group Chief Executive and the terms of reference of all Committees of the Board.
Oversight of the management of the DS Smith Group.
Approval of the Group and Company financial statements and ensuring that the Annual Report is fair, balanced and understandable.
Approval of all key policies and material amendments to those policies, including the Code of Conduct, Health and Safety and Environmental policies.
Approval of major changes to the DS Smith Group’s corporate structure.
Determining the remuneration policy for the Directors, the Group Company Secretary and other senior executives.
Setting the long-term objectives and commercial strategy.
Recommending or declaring dividends.
Maintaining a sound system of internal controls and risk management.
Approval of major corporate transactions and commitments.
Reviewing the performance of the Board, its Committees and individual Directors annually.
Setting financial KPIs. Approval of any significant changes in accounting policies or practices.
Review of the Group’s overall corporate governance arrangements.
Succession planning and appointments to the Board and senior management.
Approval of treasury policy.
PRINCIPAL BOARD COMMITTEES:
Audit Committee Remuneration Committee Nomination Committee
Chaired by Jonathan Nicholls. Meets four times a year. Chaired by Kathleen O'Donovan. Meets five times a year. Chaired by Gareth Davis. Meets three times a year.
Role of the Committee Role of the Committee Role of the CommitteeThe Audit Committee has responsibility for overseeing and monitoring the Company’s financial statements, accounting processes, audit (internal and external), controls and matters relating to fraud and reports received under the "Speak Up!" policy.
The Committee reviews and recommends to the Board the framework and policy for the remuneration of the Chairman, the Executive Directors and the GMT. The remuneration of the non-Executive Directors is determined by the Chairman and the Executive Directors. The Committee takes into account the business strategy of the Group and how the remuneration policy reflects and supports that strategy.
The Nomination Committee regularly reviews the structure, size and composition of the Board and its Committees. It identifies and nominates suitable candidates to be appointed to the Board (subject to Board approval) and considers talent and succession generally.
For more information on the Audit Committee and the Audit Committee Report see pages 58 to 61.
For more information on the Remuneration Committee and the Remuneration Committee Report see pages 64 to 78.
For more information on the Nomination Committee and the Nomination Committee Report see pages 62 and 63.
All Board Committees have written terms of reference agreed by the Board and these are regularly reviewed and updated. They are available on the Company’s website at www.dssmith.com/investors/corporate-governance/committees/ and on request to the Company Secretary.
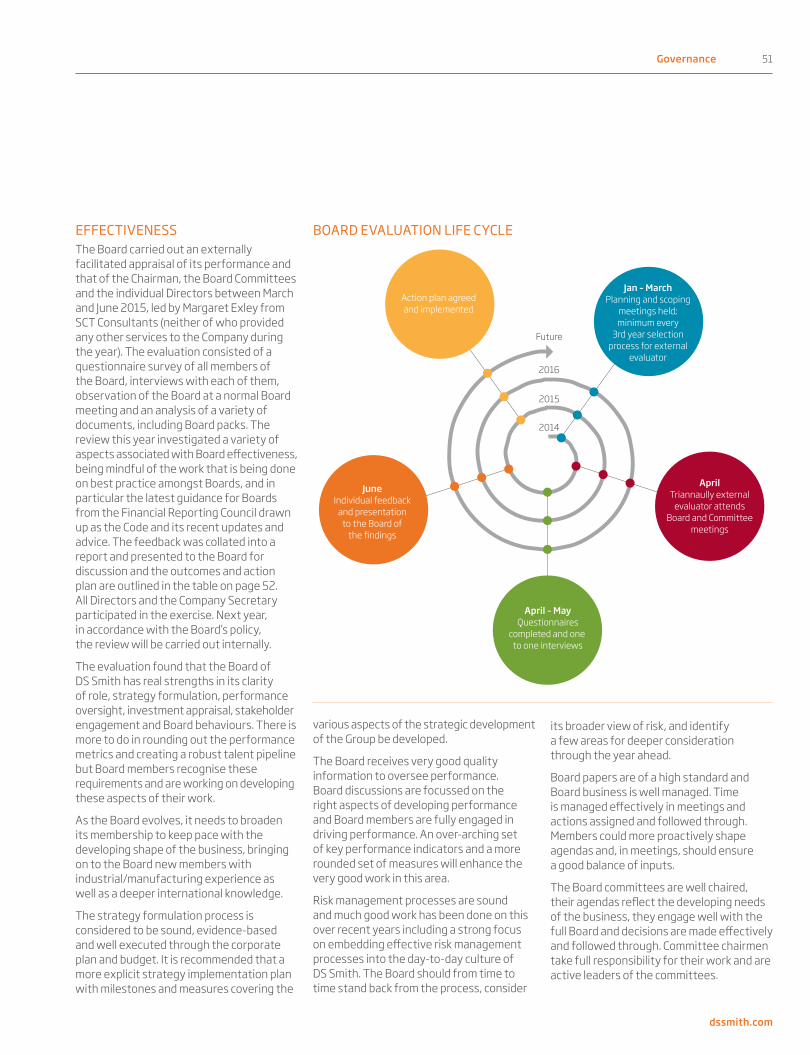
Governance 51
dssmith.com
2014
2015
2016
Future
Jan – MarchPlanning and scoping
meetings held; minimum every
3rd year selection process for external
evaluator
AprilTriannaully external
evaluator attends Board and Committee
meetings
April – MayQuestionnaires
completed and one to one interviews
JuneIndividual feedback
and presentation to the Board of
Action plan agreed and implemented
Planning and scoping meetings held;
minimum every 3rd year selection process for external evaluator
BOARD EVALUATION LIFE CYCLEEFFECTIVENESSThe Board carried out an externally facilitated appraisal of its performance and that of the Chairman, the Board Committees and the individual Directors between March and June 2015, led by Margaret Exley from SCT Consultants (neither of who provided any other services to the Company during the year). The evaluation consisted of a questionnaire survey of all members of the Board, interviews with each of them, observation of the Board at a normal Board meeting and an analysis of a variety of documents, including Board packs. The review this year investigated a variety of aspects associated with Board effectiveness, being mindful of the work that is being done on best practice amongst Boards, and in particular the latest guidance for Boards from the Financial Reporting Council drawn up as the Code and its recent updates and advice. The feedback was collated into a report and presented to the Board for discussion and the outcomes and action plan are outlined in the table on page 52. All Directors and the Company Secretary participated in the exercise. Next year, in accordance with the Board’s policy, the review will be carried out internally.
The evaluation found that the Board of DS Smith has real strengths in its clarity of role, strategy formulation, performance oversight, investment appraisal, stakeholder engagement and Board behaviours. There is more to do in rounding out the performance metrics and creating a robust talent pipeline but Board members recognise these requirements and are working on developing these aspects of their work.
As the Board evolves, it needs to broaden its membership to keep pace with the developing shape of the business, bringing on to the Board new members with industrial/manufacturing experience as well as a deeper international knowledge.
The strategy formulation process is considered to be sound, evidence-based and well executed through the corporate plan and budget. It is recommended that a more explicit strategy implementation plan with milestones and measures covering the
various aspects of the strategic development of the Group be developed.
The Board receives very good quality information to oversee performance. Board discussions are focussed on the right aspects of developing performance and Board members are fully engaged in driving performance. An over-arching set of key performance indicators and a more rounded set of measures will enhance the very good work in this area.
Risk management processes are sound and much good work has been done on this over recent years including a strong focus on embedding effective risk management processes into the day-to-day culture of DS Smith. The Board should from time to time stand back from the process, consider
its broader view of risk, and identify a few areas for deeper consideration through the year ahead.
Board papers are of a high standard and Board business is well managed. Time is managed effectively in meetings and actions assigned and followed through. Members could more proactively shape agendas and, in meetings, should ensure a good balance of inputs.
The Board committees are well chaired, their agendas reflect the developing needs of the business, they engage well with the full Board and decisions are made effectively and followed through. Committee chairmen take full responsibility for their work and are active leaders of the committees.

52 Governance
Annual Report & Accounts 2015
BOARD EVALUATION – ACTIONS AND OUTCOMES
Area Actions from 2014/15 Areas for consideration in 2015/16
Board role and composition
• A more formal annual agenda was developed for the Nomination Committee, to ensure that executive succession planning, diversity and internal support are properly considered.
• Over time the Board should consider seeking to re-balance towards industrial, manufacturing and international experience.
• The Board should consider holding a session on the strategic talent requirements of the business, to provide the basis for shaping the talent strategy.
Effectiveness • Training sessions were arranged for Directors, in particular the members of the Audit and Remuneration Committees.
• The membership of the Board committees was discussed. It was agreed that no changes were currently necessary but that this should be kept under review.
• The Board should consider establishing a more explicit strategy implementation plan with milestones and measures which will enable the Board to be absolutely sure that the strategy is being implemented to time and quality as agreed.
• The Board should consider developing performance reporting to include a broader set of lead and lag indicators of overall performance, with an overview of the key indicators.
• The Board should consider conducting an annual ‘zero-based’ discussion on risk, building into the Board’s agenda some ‘deep dive’ sessions on areas of risk.
Relations with stakeholders
• A programme of shareholder consultation meetings was held. • The Board should consider a potential prototype for broader stakeholder engagement, including sources of data, and objectives for key stakeholders with accountabilities identified.
Board behaviours and Committees
• The programme of more structured discussions at Board dinners, involving external contributors and other senior executives, was continued.
• Support for the various Board Committees, including the formal training sessions mentioned above, was reviewed to ensure that each Committee was getting the right level of help and assistance.
• The Board should continue to ensure the timeliness of the distribution of Board papers and that all agreed actions have time-scales where appropriate.
• Members should ‘self-regulate’ to ensure balanced input to discussions.
• Ways to improve informal communication between Board meetings, especially from the committee chairs and the Chairman, should be reviewed.
The independence of the non-Executive Directors was considered as part of the annual Board effectiveness review. The non-Executive Directors bring a strong independent oversight to the Board and following this year’s review the Board considers that all of the non-Executive Directors continue to demonstrate their independence. Biographical details of each Director can be found on pages 46 to 47.
ConflictsAs part of our annual review process, during the Board meeting in April 2015 we reviewed and reconsidered all situations entered in the conflicts register. Each of the Directors in office reviews their individual position regularly and new Directors review their individual positions prior to joining the Board. As a routine item, Directors are
asked, at the start of each Board meeting, to declare any interests that might conflict with the agenda items under discussion. The Company has also put procedures in place via the Company Secretary whereby the Directors can notify any future conflicts or potential conflicts of interest that may arise so that the Board can consider whether authorisation is appropriate. Any such notifications are reviewed at the next Board meeting and, if considered appropriate, authorised. Directors do not participate in the discussion, or vote regarding their own conflicts. If authorised, any conflicts are entered in the conflicts register.
Each Director has access to all information relating to the Group and to the advice and services of the Company Secretary (who is responsible for ensuring that Board
procedures are followed) and, as required, external advice at the expense of the Group.
Following this evaluation, the Board recommends the re-election of all the Directors at the 2015 Annual General Meeting (AGM).
In addition to formal Board meetings, the Chairman and Executive Directors maintain regular contact with all Directors and hold informal meetings with non-Executive Directors to discuss issues affecting the Company. Individual Directors are encouraged to make site visits during the year.
SITE VISITS In addition to the site visits which formed part of the induction programme (see case study on page 55), in July 2014 Miles Roberts and Jonathan Nicholls visited the CHP plant
Directors' Governance Report continued

Governance 53
dssmith.com
in Lucca, Italy for its open day. Guided site tours were organised for both mill and power plant. Open days offer the chance for employees to share their daily work with families and allow the community to learn more about the activities that happen each day on our sites.
In January 2015, Miles Roberts and Jonathan Nicholls visited the Ghent factory in Belgium.
They were given an overview of the business in the Benelux region and the recent investments there. During the factory tour, Miles and Jonathan were given an explanation about the progression in both structure and productivity and the important focal points such as waste, quality and services.
Jonathan Nicholls also visited the Livingston factory in the UK in January 2015. He met
with the managing director of UK Packaging for a presentation and discussion about business strategy for UK Packaging.
Site visits provide invaluable insight into the business for Directors.
OTHER BOARD COMMITTEESThe Board has delegated certain powers, mainly of a routine nature, to the General Purposes Committee, which comprises
RISK GOVERNANCE – READY TO LOOK AHEADThe Group continues to maintain rigorous procedures for understanding and managing its strategic risks. We recognise that risks, and the way we manage their potential consequences, are part of our day-to-day thinking and key to accomplishing our strategic priorities.
Our risk management framework and the processes we put in place last year are operating well and serve to identify, assess and consider the possible remedies and responses to the principal risks and uncertainties the Group faces. The Group continues to improve the management of its key risks and to hold a strong position to absorb the financial and operational impact should those risks materialise. In doing so, the Board is encouraged by the continuing work across the Group and its Divisions and the investments being made in risk management and to see the growing interest and skills of our employees in this area.
The Group’s risk and governance framework addresses two objectives:• Ensures the Group’s most significant risk exposures are
understood and managed in accordance with an agreed level of risk appetite and risk tolerance.
• Ensures regular reporting of both risk exposures and the operating effectiveness of the controls.
The Board The Audit Committee The Group The Divisions• Considers and defines the
nature and level of risk that the Group is prepared to accept in order to deliver its business strategies.
• The Board is responsible for maintaining the Group’s risk management systems and regularly reviews the Group’s key risks.
• Annually, the Board reviews and approves the internal statements on risk appetite and tolerance in relation to the Group’s principal risks and its strategic objectives.
• Annually reviews the adequacy and effectiveness of our risk management system in relation to the key risks and uncertainties and their influence on the strategic priorities of the Group.
• Continues to advocate the use of the General Management Team (GMT) as the Group’s risk committee. It is essential that the GMT fully understands what risks could affect the delivery of our Corporate Plan. The GMT is responsible for identifying, reviewing, evaluating and determining the actions necessary to manage the principal threats to and opportunities of Group objectives. It has the authority to prioritise risk related resources and set action plans in relation to the management of key risks. Each Division presents its risk management plans and resources to the GMT annually for critique and challenge for the proper allocation of resource.
• Continue to identify, assess, prioritise and manage risks on a daily basis as a source of sustainable business opportunity and competitive advantage. The responsibility for designing, operating, monitoring and maintaining effective risk management is delegated to the management of each Division. Divisional management teams apply judgement in the evaluation of the risks they face to achieve their objectives. They determine which risks are considered acceptable and assess the consequences of those risks while ensuring the costs of the relevant controls are proportionate to the benefits provided.

54 Governance
Annual Report & Accounts 2015
Directors' Governance Report continued
the Group Chief Executive and the Group Finance Director under the chairmanship of the Group Chief Executive.
RELATIONS WITH SHAREHOLDERSWe aim to provide balanced, clear and transparent communications which allow our shareholders to understand how we see our prospects and the market environments in which we operate.
The Company has a programme of regular meetings, site visits, results briefings and trading updates with its institutional shareholders, equity analysts and investors, which provide opportunities to discuss the progress of the business. All presentations given to institutional shareholders are made available on our website, www.dssmith.com, along with press releases, transcripts, audio files and current and historic Annual Reports. The Board also receives feedback from major shareholders following the full and half-year results. Together, the Chairman, the Executive Directors, the Group Communications Director and the Head of Investor Relations ensure the Board is briefed on shareholders’ views, such that any issues or concerns are fully understood and considered by the Board.
In order to assist in developing an understanding of the views of major shareholders, periodically the Company commissions a survey of investors undertaken by external consultants. The results of the survey are presented to the Board.
The Senior Independent Director is available to discuss with shareholders any major issues that cannot be resolved through normal channels.
The AGM is used as an opportunity to communicate with private shareholders, including a short presentation on the business and current trading position, as well as an opportunity for questions from investors to the Chairman of the Board and the chairmen of the Audit and Remuneration Committees. All Directors make themselves available to meet shareholders after the formal business
of the meeting. To ensure compliance with the Code, separate resolutions are proposed on each discrete subject. All Directors will retire and stand for re-election this year.
To reflect the voting preferences of all shareholders wishing to vote at the AGM, the Company will take a poll on all resolutions put to shareholders. We offer all our shareholders the choice of submitting proxy votes either electronically or in paper format. We also offer them the facility to abstain. The final results are published through a Regulatory Information Service and on the Company’s website following the AGM.
At our 2014 AGM, we received votes representing approximately 74% (2013: 70%) of our issued share capital.
Our next AGM will be held on Tuesday 8 September 2015. Full details are contained in the Notice of Meeting available on our website and, where applicable, posted with this Annual Report.
INTERNAL CONTROLThe Board has overall responsibility for the Group’s system of internal control, including financial, operational and compliance controls, and risk management systems, and for reviewing its effectiveness. Such a system, however, can only be designed to manage rather than to eliminate risk and therefore can provide only reasonable and not absolute assurance against material misstatement or loss. In accordance with the Turnbull guidance, the Company has in place the procedures necessary to ensure that there is an ongoing process for identifying, evaluating and managing the significant risks to the Group. These procedures have been in place throughout the year under review and up to the date of the approval of these financial statements. Our risk governance process, including how it is reviewed by the Board and the operation of the Group Risk Committee, is described in more detail on page 53.
The Board determines the objectives and broad policies of the Group. It meets regularly and there is a schedule of
matters which are required to be brought to it for decision. The Board has delegated to management the responsibility for establishing a system of internal control appropriate to the business environments in which the Group operates. Key elements of this system include:
• a clearly defined divisional organisation structure for monitoring the conduct and operations of individual business units;
• clear delegation of authority throughout the Group, starting with the matters reserved for the Board;
• a formal process for ensuring that key risks affecting all the Group’s operations are identified and assessed on a regular basis, together with the controls in place to mitigate those risks. Risk consideration is embedded in decision-making processes. The most significant risks are periodically reported to the Board and considered by it. The risk process is reviewed by the Audit Committee;
• the preparation and review of comprehensive annual divisional and Group budgets and an annual review and approval by the Board of the corporate strategy;
• the monthly reporting of actual results and their review against budget, forecasts (including bank covenant headroom) and the previous year, with explanations obtained for all significant variances;
• an Operating Framework laying down common control procedures and policies to apply throughout the Group. This includes clearly defined policies for capital expenditure and investment, including appropriate authorisation levels, with larger capital projects, acquisitions and disposals requiring Board approval;
• regular formal meetings between the Group Chief Executive, the Group Finance Director and divisional management to discuss strategic, operational and financial issues; and

Governance 55
dssmith.com
DIRECTOR INDUCTIONOn appointment, new Directors are given appropriate induction training, tailored to their specific needs, taking into account their individual qualifications and experience.
An induction programme for Ian Griffiths and Louise Smalley, who joined in June 2014, included the provision of information on the Group’s strategy, key risks and policies and procedures, individual time with the Chairman, Group Chief Executive, Group Finance Director, Company Secretary and key advisors, site visits to major business units and an opportunity to meet major shareholders.
" The induction process was very well structured and gave an introduction to all parts of the business, both with the central functions and opportunities to visit the business units. I received briefings from members of the executive team on key areas of the business including the internal audit function, the key risks facing the business, site visits and a briefing in respect of the corporate governance framework within which the Company operates."
" I particularly appreciated the chance to review the business strategy and to discuss with management the key issues and opportunities. I was impressed on my visit to the Impact and Innovation Centre when I was able to see how these plans are implemented and how they are able to delight their customers."
Ian Griffiths
" My induction programme took account of my experience and background. My meetings with the executive team and independent advisors focused on a number of core functions which allowed me to explore the strategic and financial priorities of the Group. My visit to the Fordham and Kemsley sites gave me a good perspective on how management operationalise strategy. I enjoyed meeting key talent within DS Smith, and the opportunity to deepen my understanding of key business issues and opportunities."
Louise Smalley
management in which they were asked to confirm that their divisions have complied with Group policies and procedures and to report any significant control weaknesses identified during the past year. In addition, it involved reviewing the results of the work of the Group’s Internal Audit function and the risk identification and management processes identified above.
DIVIDENDS An interim dividend of 3.7 pence net per ordinary share was paid on 1 May 2015 and the Directors recommend a final dividend of 7.7 pence net per ordinary share which, together with the interim dividend, increases the total dividend for the year to 11.4 pence (2013/14: 10.0 pence). Subject to approval of shareholders at the AGM to be held on 8 September 2015, the final dividend will be paid on 2 November 2015 to shareholders on the register at the close of business on 2 October 2015.
• communicating key corporate values through our Code of Conduct to all employees.
The Group’s Internal Audit function undertakes regular reviews of the individual businesses’ operations and their systems of internal control, makes recommendations to improve controls and follows up to ensure that management implements the recommendations made.
The Internal Audit plan is determined on a risk assessment basis and is reviewed and approved by the Audit Committee. Internal Audit’s findings are reported to Group and divisional business management as well as to the Audit Committee.
The Board can confirm that it has carried out an annual review of the overall effectiveness of the Group’s system of internal control and risk management procedures, during the year and up to the date of approval of this Annual Report. This included a process of self-certification by senior divisional
We have improved our dividend documentation for individual shareholders in order to alert them to any unclaimed dividends. This has enabled back payments to be made to a number of shareholders. Details of the Company’s dividends and how you can receive your dividend direct to your personal account can be found on the Company’s website www.dssmith.com/investors/shareholder-information/dividends/
ACQUISITIONS AND DIVESTMENTS DuropackOn 22 May 2015 we received unconditional competition clearance in relation to the acquisition of the Duropack business from all of the relevant authorities. The acquisition, which completed on 31 May 2015, had a total consideration of €305 million.
StePacOn 18 May 2015 we completed the sale of StePac, a non-core part of our plastics business based in Israel, for US $31 million.

56 Governance
Annual Report & Accounts 2015
OTHER DISCLOSURESThis Directors' Governance Report fulfils the requirements of the Directors' Report for the purposes of the Companies Act 2006. The Strategic Report can be found on pages 2 to 43, and encompasses our Corporate Social Responsibility Report.
We have chosen, in accordance with the Companies Act 2006 to include certain information in our Strategic Report or financial statements that would otherwise be required to be disclosed in the Directors' Report as follows:
Subject matter PageImportant events since the financial year-end
23-24
Likely future developments in the business
25
Research and development 23Use of financial instruments 31Employment of disabled persons 37Employee involvement 37Greenhouse gas emissions 35
The information that fulfils the requirements of the Corporate Governance Statement for the purposes of the Disclosure and Transparency Rules can be found on pages 44 to 63, and forms part of the Directors' Report.
.
Directors' Governance Report continued
2014/15During the current financial year, the Group completed various business combination transactions with total cash consideration of £28 million, and various business disposals with total cash consideration of £18 million which are not considered material to the Group individually or in aggregate.
2013/14 During the year ended 30 April 2014, the Group completed various business combination transactions with total cash consideration of £27 million, and various business disposals with total cash consideration of £12 million which are not considered material to the Group individually or in aggregate.
SHARE CAPITAL Details of the issued share capital and the rights and restrictions attached to the shares, together with details of movements in the Company’s issued share capital during the year, are shown in note 24. Pursuant to the Company’s employee share option schemes, 2,748,030 ordinary shares of 10 pence each were issued during the year. 12,318 shares pursuant to the Company’s employee share option schemes were issued between 1 May 2015 and 24 June 2015 inclusive. The Company has not utilised its authority to make market purchases of shares granted to it at the 2014 AGM but, in line with market practice, will be seeking to renew such authority at this year’s AGM.
POLITICAL DONATIONSNo political donations were made during the year ended 30 April 2015 (2013/14: nil). DS Smith has a policy of not making donations to political organisations or independent election candidates or incurring political expenditure anywhere in the world as defined in the Political Parties, Elections and Referendums Act 2000.
DIRECTORS’ AND OFFICERS’ LIABILITY INSURANCE The Company has purchased and maintains appropriate insurance cover in respect of Directors’ and Officers’ liabilities. The Company has also entered into qualifying third party indemnity arrangements for the benefit of all its Directors, in a form and scope which comply with the requirements of the Companies Act 2006. These indemnities were in force throughout the year and up to the date of this Annual Report.
GOING CONCERNIn considering the going concern basis for preparing the financial statements, the Directors have considered the Company’s objectives and strategy, risks and uncertainties in achieving its objectives and its review of business performance, which are all set out in the Strategic Report, Operating Review and Financial Review sections of this Annual Report and Accounts. The Group’s liquidity and funding arrangements are described in notes 18 and 20 to the financial statements, as well as in the capital structure and treasury management section of the Strategic Report, and the Directors consider that the Group has significant covenant and liquidity headroom in its borrowing facilities for the foreseeable future.
After reviewing the Company’s expenditure commitments, current financial projections and expected future cash flows (with appropriate sensitivities applied), together with the available cash resources and undrawn committed borrowing facilities, the Directors have considered that adequate resources exist for the Company to continue in operational existence for the foreseeable future. Accordingly, the Directors continue to adopt the going concern basis in preparing the financial statements.
Governance 15%Strategy 15%Financial Management 30%Operations 30%Health & Safety/Environment 10%
Topics discussed at 2014/15 Board meetings

Governance 57
dssmith.com
SUBSTANTIAL SHAREHOLDERSInformation provided to the Company pursuant to the Financial Conduct Authority’s (FCA) Disclosure and Transparency Rules (DTRs) is published on a Regulatory Information Service and on the Company’s website.
As at 30 April 2015, the following information has been received, in accordance with DTR5, from holders of notifiable interests in the Company’s issued share capital.
Ordinary shares held % Nature of holdingStandard Life Investments Limited 131,664,570 13.98 Direct & indirectOld Mutual plc 47,403,372 5.03 IndirectAmeriprise Financial, Inc. and its group 46,864,824 4.97 Direct & indirect
The UK Corporate Governance Code 2014 applies to the 2015/16 financial year and the Company will report on its application of this version of the Code in next year's Annual Report. The Code can be accessed at www.frc.org.uk.
The trustee of the Employee Benefit Trust (the Trust), which is used to purchase shares on behalf of the Company as described in note 24, has the power to vote or not vote, at its absolute discretion in respect of any shares in the Company held unallocated in the Trust. However, in accordance with good practice, the trustee adopts a policy of not voting in respect of such shares.
The trustee has a dividend waiver in place in respect of shares which are the beneficial property of the trust.
DISCLOSURE OF INFORMATION TO THE AUDITOR Each of the persons who is a Director at the date of the approval of this Annual Report confirms that:
(a) so far as the Director is aware, there is no relevant audit information of which the Company’s Auditor is unaware; and
(b) the Director has taken all the steps he/she ought to have taken as a Director in order to make him/herself aware of any relevant audit information and to establish that the Company’s Auditor is aware of that information.
This confirmation is given and should be interpreted in accordance with the provisions of section 418 of the Companies Act 2006.
Deloitte LLP have expressed their willingness to continue in office as Auditor and a resolution to reappoint them will be proposed at the forthcoming AGM.
By order of the Board
Matt JowettGroup General Counsel and Company Secretary
24 June 2015
58 Governance
Annual Report & Accounts 2015
Audit Committee
DEAR SHAREHOLDERS The Audit Committee’s work in the current year has been informed both by developments within the Group, including the increase in acquisition and divestment activities, and by high profile external events in corporate reporting.
Against this backdrop, the Committee has continued to conduct its usual oversight of financial results, internal audit reviews and the management of risk across the Group. Meetings are scheduled directly around or before the end of the half and full-year, as well as before the publication of the associated half and full-year financial reports, so as to ensure the Committee is informed fully, and on a timely basis, on areas of significant risks and judgement. The Committee has continued to monitor the evolution of the Group’s financial reporting and control framework as well as overseeing the risk management programme.
The UK Corporate Governance Code 2012 (the Code) requires the Board to confirm that the Annual Report presents a fair, balanced and understandable assessment of the Group’s performance, business model and strategy. Under its Terms of Reference, following a request from the Board, the Committee undertook procedures to advise on this matter, described in more detail on page 60.
Jonathan NichollsChairman of the Audit Committee
Under its terms of reference, the Audit Committee is empowered to seek independent external advice but did not do so during the year.
SIGNIFICANT MATTERS CONSIDERED IN 2014/15In 2014/15, the Audit Committee’s work on significant accounting and financial reporting issues included a focus on the key areas outlined as follows:
ClassificationThe Group has continued to initiate future work to restructure the business to evolve and optimise the operational footprint and the support infrastructure. The costs of these programmes, together with other elements of income and cost (including acquisition costs, impairments and gains or losses on business disposals), are classified as exceptional because of their nature, incidence or size. The Directors believe that such a classification assists in the understanding of the underlying trading and financial results of the Group.
Key responsibilities• The accounting principles, policies
and practices adopted in the Group’s accounts.
• External financial reporting and associated announcements.
• The appointment, independence, effectiveness and remuneration of the Group’s external Auditor.
• The resourcing, plans and effectiveness of Internal Audit performed on behalf of the Group by a major accountancy firm (currently KPMG), which is independent from the Group’s external Auditor.
• The adequacy and effectiveness of the internal control environment.
• The Group's risk management processes and performance.
• Review of matters relating to fraud and reports under the "Speak Up!" policy.
• The Group’s compliance with the Code.
The Audit Committee’s Terms of Reference can be found at www.dssmith.com/investors/ corporate-governance/committees
AUDIT COMMITTEE MEMBERSHIPChairman of the Committee Members
Jonathan Nicholls Chris Britton, Ian Griffiths1, Kathleen O’Donovan, Louise Smalley1
1 Ian Griffiths and Louise Smalley joined the Board on 23 June 2014.

Governance 59
dssmith.com
Taxation Taxation represents a significant cost to the business both in cash and accounting terms. The Group is exposed to differing tax regimes and risks, and these affect the carrying values of tax balances (including deferred tax) and the resultant income statement charges. The Audit Committee reviewed the tax charge, including the underlying tax effect, the appropriateness of tax provisions recognised, and the risks associated with them.
Working capitalThe Group operates from a large number of locations, particularly in Europe, and, as a consequence, has exposures to the carrying values of working capital, particularly inventory and trade debtors. The Group has operating procedures and financial controls to manage these balances and accounting policies to ensure that the carrying values are supportable. The Audit Committee reviews these policies and procedures to validate their appropriateness to the evolving nature of the Group’s business, paying particular attention to policies that have been expanded to address new circumstances. These assessments take place on a continuous basis throughout the year.
In addition to these key areas, the Audit Committee considered the Group's accounting response to its own development through, for example, acquisitions and disposals. The Audit Committee also addressed external events in corporate reporting including,
The Audit Committee has reviewed the appropriateness of the income and costs included in, and excluded from, exceptional items by challenging and seeking explanations from management. The Audit Committee reviewed reports prepared by management and the external Auditor. This work is a recurring agenda item in all Audit Committee meetings where the Audit Committee reviews reports prepared by management. The external Auditor reports on these matters at the half and full-year. The Audit Committee is satisfied with the resulting presentation.
GoodwillThe Group has significant goodwill and intangible fixed asset balances. Goodwill is subject to mandatory impairment testing, which is conducted at both the half-year and the year end. Intangible fixed assets, tangible fixed assets and other investments (such as associates) are subject to testing when there are indications of impairment. In undertaking the impairment testing, goodwill is allocated to the appropriate operating segments and the resulting carrying values are compared to the relevant value in use. The Audit Committee has reviewed the results of these tests, including an assessment of the robustness of the processes, the assumptions underpinning the values in use, and the appropriate sensitivities to changes in the assumptions. The impairment work, and the Audit Committee’s review thereon, also considered the carrying values of the individual cash generating units within the operating segments with their values in use.
in particular, supplier and customer rebates through routine reporting and specific internal audit work.
AUDIT EFFECTIVENESSThe Audit Committee meets with the external Auditor to determine annually their qualifications, expertise, resources, independence, objectivity and effectiveness. In addition, the performance of the external and Internal Audit functions is evaluated. The Audit Committee receives written confirmation from the external Auditor as to any relationships that might have a bearing on their independence, whether they consider themselves independent within the meaning of the UK regulatory and professional requirements, and on their quality control processes and ethical standards. The independence of the external Auditor was confirmed as part of the 2013/14 tender process discussed on page 61.
In addition, in order to ensure the independence and objectivity of the Auditor, the Audit Committee maintains and regularly reviews the Auditor Independence Policy which covers services which may be provided by, and fees paid to, auditors. The audit fee negotiations are approved by the Audit Committee. The Audit Committee is satisfied with Deloitte’s independence and effectiveness. Under professional standards, the partner responsible for the audit is generally changed every five years; the most recent rotation took place in the prior financial year.
Key activities in 2014/15 Key priorities in 2015/16
Significant accounting and financial reporting issues:• Classification and presentation of exceptional items.• The carrying values of goodwill, tangible and intangible fixed assets.• Taxation.• Adequacy of working capital.Other recurring responsibilities:• Effectiveness of the external Auditor and recommendation on reappointment. • Internal audit reports. • Review of risk management framework and reporting thereon. • Review of systems of internal control.Advice on whether the Annual Report is fair, balanced and understandable.
• Review of provision of non-audit services.• Carry out an assessment of the external Auditor’s effectiveness.• Test whether there has been any impairment to the balance sheet and
review going concern.• Review the Group’s Key Risks and the reporting thereon.• Review and approve the half-year and full-year results.• Review the Internal Audit report on internal control matters and review
management response.• Evaluate systems of internal control across the Group, including IT controls.• Support the Board in responding to the amendments to the Code published
in September 2014.
60 Governance
Annual Report & Accounts 2015
NON-AUDIT FEESThe policy on the supply of non-audit services by external auditors is as follows: The Group should not employ the Auditor to provide non-audit services where either the nature of the work or the extent of such services might impair the Auditor’s independence or objectivity. The external Auditor is permitted to undertake some non-audit services, providing it has the skill, competence and integrity to carry out the work in the best interests of the Group, on, for example, advisory services and due diligence activities associated with potential acquisitions and disposals and major changes in accounting regulations.
There are no contractual restrictions on the Group with regard to Deloitte’s appointment.
The Audit Committee is able to monitor the effectiveness of the external Auditor both through direct assessment and through recurring activities. The Audit Committee Chairman meets with the lead engagement partner regularly and individual committee members are encouraged to, and do, meet privately with Deloitte. The 2013/14 audit was subject to a review by the Financial Reporting Council’s audit quality review team, and required only limited improvements. The recommendations from the review have been acted upon.
Audit Committee continued
THE AUDIT COMMITTEE ADDRESSED THE FOLLOWING KEY MATTERS DURING THE YEAR:
June 2014 November 2014 December 2014 April 2015 June 2015
Key agenda items Key agenda items Key agenda items Key agenda items Key agenda items
• The Committee reviewed evaluations of going concern and sensitivity analysis and recommended to the Board that the preparation of the year-end financial statements on a going concern basis was appropriate.
• Working capital, cash flow and covenant headroom were reviewed.
• The Committee received reports from Internal Audit on internal control matters and from the external Auditor on the conduct of their audit, their review of accounting policies, areas of judgement and the financial statements and their comments concerning risk and internal control.
• The Group’s exceptional items policy was reviewed in order to ensure appropriateness and consistency of the approach.
• The Committee considered the effectiveness of systems for monitoring and reporting on risks faced by the Group, and reviewed the Group’s Key Risk paper.
• The Committee performed a preliminary assessment of significant accounting issues and judgements for the half-year, including classification, impairment, tax, going concern and pensions.
• Internal Audit findings and management responses to proposals made in the audit reports issued by the function during the year were reported, debated and management actions monitored for timely completion.
• Report from the Group Finance Director on the internal controls action plan.
• The Committee updated its review of significant accounting issues and judgements for the half-year, and confirmed the assessments of impairment and going concern.
• Non-audit fees were reviewed.
• The Internal Audit Operational Review, including the Audit plan for 2015/16, was considered.
• The Committee undertook the preliminary assessment of significant accounting issues and judgements for the full-year, including classification, impairment, tax, going concern and pensions.
• The Audit plan of the external Auditor was confirmed. The process was supported by a meeting in February 2015 between the chairman of the Audit Committee and the lead audit partner.
• The Committee received an update of the Group’s key risks and mitigation processes.
• The Committee received a report on 16 "Speak Up!" incidents, notified through the employee help line service, and the follow up actions taken.
• The Committee reviewed and approved the updated Terms of Reference.
• The Committee reviewed the Annual Report and Accounts in order to advise the Board in its assessment as to whether the documents were fair, balanced and understandable.
• Working capital, cash flow and covenant headroom were reviewed.
• The Committee received reports from Internal Audit on internal control matters and from the external Auditor on the conduct of their audit, their review of accounting policies, areas of judgement and the financial statements and their comments concerning risk and internal control.
• The Committee considered the effectiveness of the external audit.
• The Committee updated its review of significant accounting issues and judgements for the full- year, including classification, impairment, tax, going concern and pensions.
Non-audit services and fees are reported to the Audit Committee twice a year. For guidance, annual non-audit fees payable to the external Auditor should not exceed 75% of the annual Group audit fee without prior formal approval of the Audit Committee. During 2014/15, total non-audit fees were 25% of the annual Group audit fee (2013/14: 40%). In addition, £4.3 million was paid to other accounting firms for non-audit work, including £0.9 million for work relating to Internal Audit.
Governance 61
dssmith.com
AUDIT TENDER POLICYIn 2013/14, the Company carried out a competitive tender for the role of Statutory Auditor. Following the tender process, Deloitte LLP were reappointed. Deloitte were first appointed as external Auditor to the Group companies in 2006. The lead audit partner rotates every five years and Ian Waller, the current lead audit partner, has been in post since 2013/14. The Committee's policy is that the role of external Auditor will be put out to tender at least every 10 years in line with the EU and Competition Commission (now Competition and Markets Authority) rules or at other times should specific circumstances require this.
OPERATION OF THE AUDIT COMMITTEEDuring the year, the Audit Committee met four times and met privately with the external Auditor after each meeting. The Chairman of the Audit Committee also held separate private meetings during the year with the external Auditor, representatives from Internal Audit and the Group Finance Director and his team. The Audit Committee received sufficient, reliable and timely information from management to enable it to fulfil its responsibilities. The Audit Committee is satisfied that the Group’s executive compensation arrangements do not prejudice robust controls and good stewardship.
In addition to the Audit Committee members, the Chairman, the Group Chief Executive, the Group Finance Director, representatives from Internal Audit and the Group Financial Controller attend parts of these meetings by invitation. The Board is satisfied that Jonathan Nicholls and the members of the Audit Committee have both current and relevant financial experience (as set out on pages 46 to 47).
62 Governance
Annual Report & Accounts 2015
Nomination Committee
Board diversityWe have made good progress refreshing the Board during the year, which has resulted in an increase in the proportion of female directors on the Board, from 12.5% in 2013/14 to 25% in 2014/15. Our current Board gender and experience split is shown on page 47.
We remain committed to at least maintaining this level of female representation in the medium term, while ensuring that diversity in its broadest sense remains a central feature of the Board. The Committee will continue to consider diversity when recommending any future Board appointments. Final appointments will always be made on merit. Despite the progress that has been made, the Committee is conscious that the increase in the proportion of women on our Board has been driven by the appointment of non-Executive Directors. The Board remains
Key responsibilities• Reinforcing the cultural and
expertise diversity in the Board’s composition, and maintain ongoing succession plans.
• Considering ways to improve diversity in the pipeline for senior management roles.
• Further strengthening of the senior management team.
• Reviewing the Group’s talent management process.
The Nomination Committee’s Terms of Reference can be found at www.dssmith.com/investors/ corporate-governance/committees
DEAR SHAREHOLDERS The Nomination Committee has an important role to play in ensuring the Board has the right balance of experience and skills to support our strategy.
The Committee keeps under review and evaluates the composition of the Board and its Committees to maintain the appropriate balance of skills, knowledge, experience and independence to ensure their continued effectiveness. Appropriate succession plans for the non-Executive Directors, Executive Directors and the Group’s senior management are also kept under review.
The activities of the Committee are described in more detail below.
Gareth DavisChairman
NOMINATION COMMITTEE MEMBERSHIPChairman of the Committee Members
Gareth Davis Chris Britton, Ian Griffiths1, Jonathan Nicholls, Kathleen O’Donovan, Miles Roberts, Louise Smalley1
1 Ian Griffiths and Louise Smalley joined the Board on 23 June 2014.
committed to strengthening the pipeline of senior female executives within the business and is taking steps to ensure that there are no barriers to women succeeding at the highest levels within DS Smith. The Board believes that a diverse workforce and management team improve the culture of the organisation and add value to the business as a whole.
Executive search firms The Board supports the principles of the Executive Search Firms Voluntary Code of Conduct on gender diversity, and is committed to only engaging executive search firms which are signatories to this code. No executive search firm was retained during the year. In the prior year the Committee used the services of Spencer Stuart and The Inzito Partnership (who have no other connection with the Company).
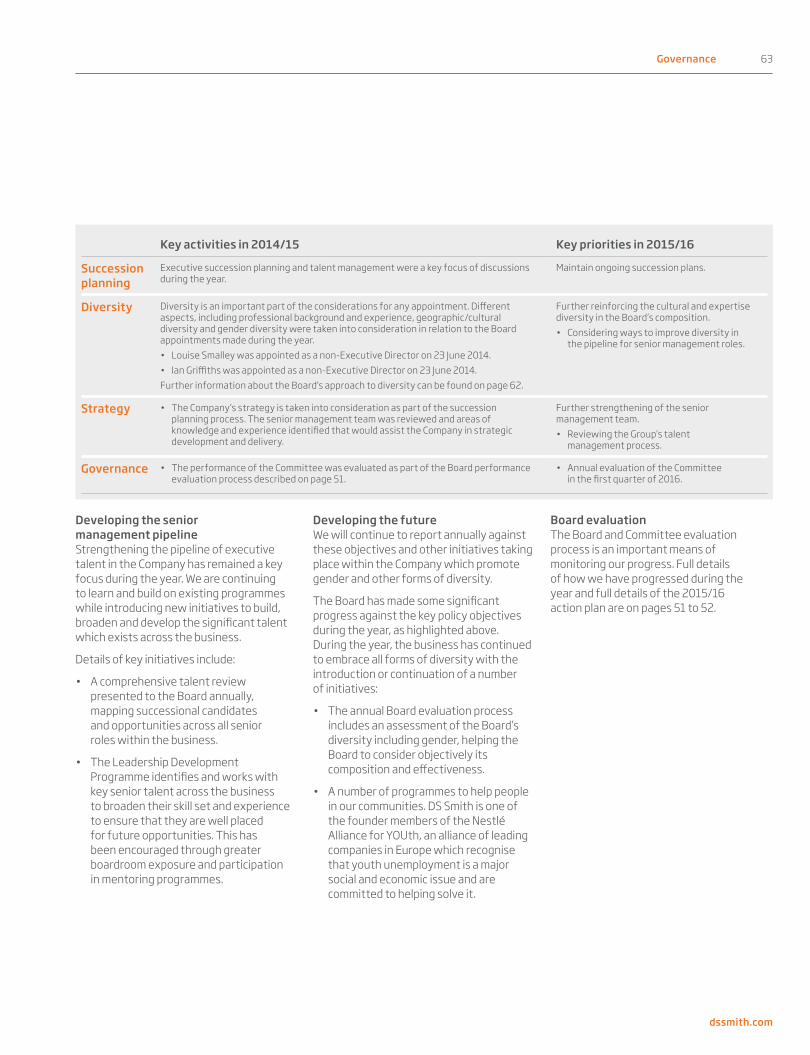
Governance 63
dssmith.com
Key activities in 2014/15 Key priorities in 2015/16
Succession planning
Executive succession planning and talent management were a key focus of discussions during the year.
Maintain ongoing succession plans.
Diversity Diversity is an important part of the considerations for any appointment. Different aspects, including professional background and experience, geographic/cultural diversity and gender diversity were taken into consideration in relation to the Board appointments made during the year. • Louise Smalley was appointed as a non-Executive Director on 23 June 2014.• Ian Griffiths was appointed as a non-Executive Director on 23 June 2014.Further information about the Board's approach to diversity can be found on page 62.
Further reinforcing the cultural and expertise diversity in the Board’s composition.• Considering ways to improve diversity in
the pipeline for senior management roles.
Strategy • The Company’s strategy is taken into consideration as part of the succession planning process. The senior management team was reviewed and areas of knowledge and experience identified that would assist the Company in strategic development and delivery.
Further strengthening of the senior management team.• Reviewing the Group’s talent
management process.
Governance • The performance of the Committee was evaluated as part of the Board performance evaluation process described on page 51.
• Annual evaluation of the Committee in the first quarter of 2016.
Developing the futureWe will continue to report annually against these objectives and other initiatives taking place within the Company which promote gender and other forms of diversity.
The Board has made some significant progress against the key policy objectives during the year, as highlighted above. During the year, the business has continued to embrace all forms of diversity with the introduction or continuation of a number of initiatives:
• The annual Board evaluation process includes an assessment of the Board’s diversity including gender, helping the Board to consider objectively its composition and effectiveness.
• A number of programmes to help people in our communities. DS Smith is one of the founder members of the Nestlé Alliance for YOUth, an alliance of leading companies in Europe which recognise that youth unemployment is a major social and economic issue and are committed to helping solve it.
Developing the senior management pipelineStrengthening the pipeline of executive talent in the Company has remained a key focus during the year. We are continuing to learn and build on existing programmes while introducing new initiatives to build, broaden and develop the significant talent which exists across the business.
Details of key initiatives include:
• A comprehensive talent review presented to the Board annually, mapping successional candidates and opportunities across all senior roles within the business.
• The Leadership Development Programme identifies and works with key senior talent across the business to broaden their skill set and experience to ensure that they are well placed for future opportunities. This has been encouraged through greater boardroom exposure and participation in mentoring programmes.
Board evaluationThe Board and Committee evaluation process is an important means of monitoring our progress. Full details of how we have progressed during the year and full details of the 2015/16 action plan are on pages 51 to 52.

64 Governance
Annual Report & Accounts 2015
Remuneration Committee
DEAR SHAREHOLDERS I am pleased to be able to write to you this year, to demonstrate the continued alignment of the interests of the Executive Directors with shareholders through the implementation of our remuneration policy, approved by shareholders at the AGM last year, and to show how this is closely linked to the Group's performance.
Linking remuneration with strategyDS Smith has continued to deliver sustainable returns and growth for its shareholders. We have achieved this by focusing on delivering our key strategic goals, incentivised by our remuneration policy, as this is key to maximising long–term returns to shareholders.
Strategic priorities
To delight our customers
To realise the potential of our people
To double the size and profitability of our business
To lead the way in recycling
Alignment with our strategy Alignment with our shareholdersThis is supported by the inclusion of the drivers of return on average capital employed (ROACE) and earnings per share (EPS) growth within our variable remuneration. Stretching performance targets incentivise the delivery of our goals and the creation of shareholder value.
Managing our costs, cash flows and capital are the other elements of our strategic focus. Profitability forms a major part of the measurement in both the annual bonus and the share–based incentive plans.
Employees at all levels are encouraged to have an interest in the Company’s shares through both direct shareholdings and through our award-winning Sharesave Plan, which had a take-up rate in the UK of 53%. For our more senior employees, their interests are aligned to shareholders through their shareholding requirements and through our share–based incentive plans. Employees at all levels have an interest in the performance of the share price.
The market assessment of our share performance is reflected in total shareholder return (TSR).
Key responsibilities• Ensuring the Group’s remuneration
arrangements support its strategy, align with its values and drive performance.
• Maintaining a competitive remuneration policy appropriate to the business environment of the countries in which we operate, thereby ensuring we can attract and retain talented individuals.
• Aligning senior executives’ remuneration with the interests of long–term shareholders while ensuring that remuneration is fair but not excessive.
• Making recommendations to the Board in respect of the Chairman’s fees.
• Setting targets for the performance–related elements of remuneration packages.
• Oversight of our overall policy for senior management remuneration and of our employee share plans.
• Ensuring appropriate independent advisors are appointed to provide relevant advice and guidance to the Remuneration Committee.
The Remuneration Committee’s Terms of Reference can be found at www.dssmith.com/investors/corporate–governance/committees
£335madjusted
operating profit up by 17%
24.5padjusted EPS
up from 21.4p
160basis point growth in
ROACE
343%TSR over last
5 years
These results demonstrate that once again our experienced management team has driven significant performance improvements during the year.
DS Smith's strategy to deliver long-term sustainable and profitable growth remains paramount and our remuneration policy is designed to support this strategy. The Company’s continued strong financial performance and consistent year-on-year incremental improvement in key financial measures demonstrate the importance of management’s continuing focus on delivering against a clear strategy supported by a remuneration policy which provides an appropriate balance between fixed and variable pay.

Governance 65
dssmith.com
Aligning remuneration policy with Group valuesDS Smith is founded on the following values:
Be caring Be challenging Be trusted
Be responsive Be tenacious
The Remuneration Committee believes that these values underpin our approach to remuneration. The Remuneration Committee cares about aligning performance with reward.
The Committee understands the trust placed in it by shareholders not to reward failure. Challenging performance conditions, which are aligned with the strategic objectives of the Group, have to be met before our share-based incentive plans can vest. This ensures that when the strategic objectives are met, an appropriate level of remuneration follows. Our incentive plans have recovery and withholding provisions.
Last year, the Committee was responsive, engaging extensively with our major shareholders and their representative bodies regarding our remuneration policy. We also received feedback and views from shareholders on matters related to remuneration during the year. Shareholders do not speak with a single voice and, as a Committee, we have to be challenging and balance individual perspectives with our overall responsibility to ensure that remuneration arrangements enable us to attract and retain talented employees to deliver sustainable shareholder returns.
In the interests of the Group, we have reviewed the effectiveness of the application of our remuneration policy to date and continue to be satisfied that the overall approach provides good alignment of executive behaviour with shareholder interests and does not encourage excessive risk taking. The executives have been tenacious in achieving sustainable returns and growth for shareholders.
Approach for 2015/16We have set out in this report the key elements of the implementation in 2014/15 of the shareholder-approved remuneration policy. Having simplified our remuneration policy last year, the Share Matching Plan (SMP) has been discontinued and no further awards will be made under th SMP. Full details of the policy can be found in our 2013/14 Annual Report available on our website.
The Committee has reviewed the operation of our remuneration policy for 2015/16 and has concluded that the policy should be implemented on an unchanged basis. The following key decisions were taken during the year:
• The Group Chief Executive's salary will be increased by 2.5%, in line with the average increase for the workforce generally.
• In line with our stated policy to move the Group Finance Director's salary to a mid-market level over time and subject to satisfactory performance, his salary will be increased by 5%.
• These increases will take effect from 1 August 2015.
• The fee payable to the non-Executive Chairman will be increased by 2.5% and the non-Executive Directors' base fees by 2.5%.
• Targets for the 2015/16 annual bonus plan have been set in line with the financial plan. Due to their commercial sensitivity, they are not disclosed within this report, but will be disclosed retrospectively in next year's report to the extent that they do not remain commercially sensitive.
• Under the Performance Share Plan (PSP), the Committee has considered the performance conditions and has determined that an equal mix of EPS, TSR and ROACE remains appropriate and these are fully disclosed in the annual report on remuneration.
• Shares that vest under the PSP awarded this year to Executive Directors must be retained for a further two years before they can be sold.
The annual report on remuneration explains how our policy has been implemented during the year under review and, alongside this letter, will be subject to an advisory vote at our AGM (resolution 3). We hope that you will support it.
Kathleen O’DonovanChairman of the Remuneration Committee 24 June 2015
Key activities in 2014/15 Key priorities in 2015/16
• Reviewed the design of long-term incentives with the main objectives being simplification and responding to concerns previously raised by some investors.
• Drafted the remuneration policy for up to the next three years.
• Consulted with shareholders and other key stakeholders on the draft remuneration policy.
• Implemented the policy, approved by shareholders at the 2014 AGM, during the year under review.
• As the Group’s business, its markets and the executive remuneration landscape continue to evolve, the Committee will continue to review the approach to remuneration to ensure that it remains appropriate and highly relevant. We recognise the need to continue to attract management with skills and experience which reflect current and future developments in the markets in which the Group's businesses operate.
• The Committee will continue its regular dialogue with shareholders and will hold meetings with the largest investors to listen to their views and feedback.
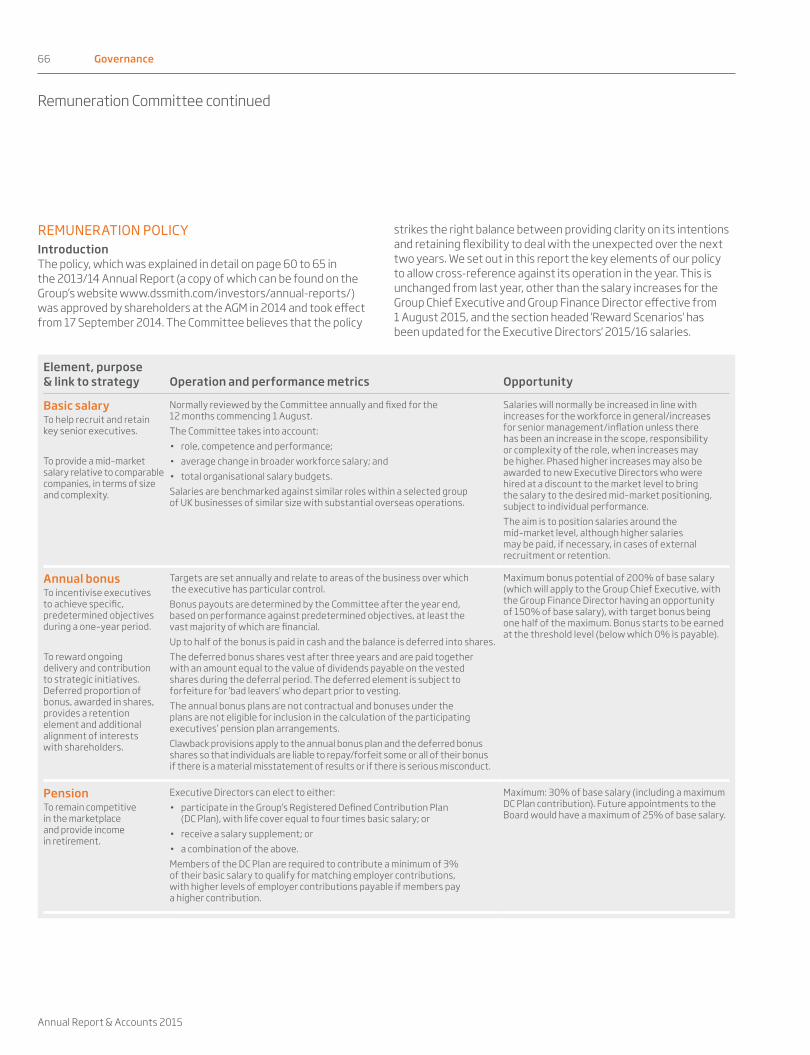
66 Governance
Annual Report & Accounts 2015
Remuneration Committee continued
REMUNERATION POLICYIntroductionThe policy, which was explained in detail on page 60 to 65 in the 2013/14 Annual Report (a copy of which can be found on the Group’s website www.dssmith.com/investors/annual-reports/) was approved by shareholders at the AGM in 2014 and took effect from 17 September 2014. The Committee believes that the policy
strikes the right balance between providing clarity on its intentions and retaining flexibility to deal with the unexpected over the next two years. We set out in this report the key elements of our policy to allow cross-reference against its operation in the year. This is unchanged from last year, other than the salary increases for the Group Chief Executive and Group Finance Director effective from 1 August 2015, and the section headed 'Reward Scenarios' has been updated for the Executive Directors' 2015/16 salaries.
Element, purpose & link to strategy Operation and performance metrics Opportunity
Basic salary To help recruit and retain key senior executives.
To provide a mid–market salary relative to comparable companies, in terms of size and complexity.
Normally reviewed by the Committee annually and fixed for the 12 months commencing 1 August.The Committee takes into account:• role, competence and performance;• average change in broader workforce salary; and• total organisational salary budgets.Salaries are benchmarked against similar roles within a selected group of UK businesses of similar size with substantial overseas operations.
Salaries will normally be increased in line with increases for the workforce in general/increases for senior management/inflation unless there has been an increase in the scope, responsibility or complexity of the role, when increases may be higher. Phased higher increases may also be awarded to new Executive Directors who were hired at a discount to the market level to bring the salary to the desired mid–market positioning, subject to individual performance.The aim is to position salaries around the mid–market level, although higher salaries may be paid, if necessary, in cases of external recruitment or retention.
Annual bonusTo incentivise executives to achieve specific, predetermined objectives during a one–year period.
To reward ongoing delivery and contribution to strategic initiatives. Deferred proportion of bonus, awarded in shares, provides a retention element and additional alignment of interests with shareholders.
Targets are set annually and relate to areas of the business over which the executive has particular control.Bonus payouts are determined by the Committee after the year end, based on performance against predetermined objectives, at least the vast majority of which are financial.Up to half of the bonus is paid in cash and the balance is deferred into shares.The deferred bonus shares vest after three years and are paid together with an amount equal to the value of dividends payable on the vested shares during the deferral period. The deferred element is subject to forfeiture for 'bad leavers' who depart prior to vesting.The annual bonus plans are not contractual and bonuses under the plans are not eligible for inclusion in the calculation of the participating executives’ pension plan arrangements.Clawback provisions apply to the annual bonus plan and the deferred bonus shares so that individuals are liable to repay/forfeit some or all of their bonus if there is a material misstatement of results or if there is serious misconduct.
Maximum bonus potential of 200% of base salary (which will apply to the Group Chief Executive, with the Group Finance Director having an opportunity of 150% of base salary), with target bonus being one half of the maximum. Bonus starts to be earned at the threshold level (below which 0% is payable).
PensionTo remain competitive in the marketplace and provide income in retirement.
Executive Directors can elect to either:• participate in the Group’s Registered Defined Contribution Plan
(DC Plan), with life cover equal to four times basic salary; or• receive a salary supplement; or• a combination of the above.Members of the DC Plan are required to contribute a minimum of 3% of their basic salary to qualify for matching employer contributions, with higher levels of employer contributions payable if members pay a higher contribution.
Maximum: 30% of base salary (including a maximum DC Plan contribution). Future appointments to the Board would have a maximum of 25% of base salary.
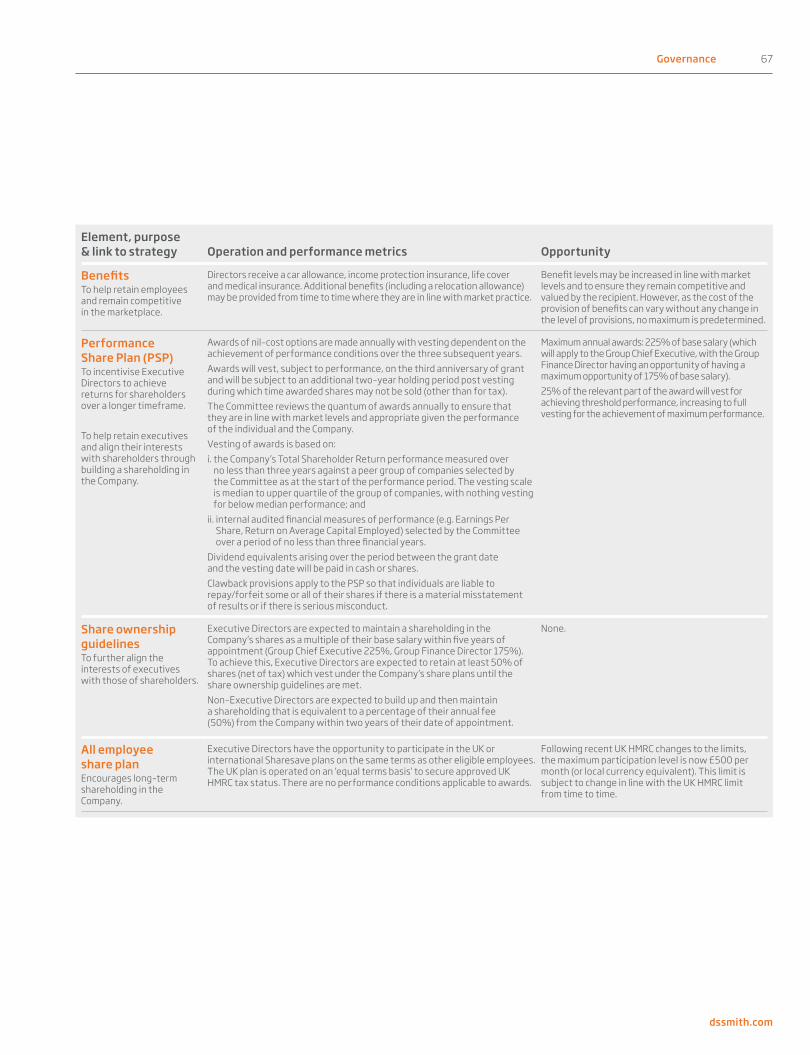
Governance 67
dssmith.com
Element, purpose & link to strategy Operation and performance metrics Opportunity
BenefitsTo help retain employees and remain competitive in the marketplace.
Directors receive a car allowance, income protection insurance, life cover and medical insurance. Additional benefits (including a relocation allowance) may be provided from time to time where they are in line with market practice.
Benefit levels may be increased in line with market levels and to ensure they remain competitive and valued by the recipient. However, as the cost of the provision of benefits can vary without any change in the level of provisions, no maximum is predetermined.
Performance Share Plan (PSP)To incentivise Executive Directors to achieve returns for shareholders over a longer timeframe.
To help retain executives and align their interests with shareholders through building a shareholding in the Company.
Awards of nil–cost options are made annually with vesting dependent on the achievement of performance conditions over the three subsequent years. Awards will vest, subject to performance, on the third anniversary of grant and will be subject to an additional two–year holding period post vesting during which time awarded shares may not be sold (other than for tax).The Committee reviews the quantum of awards annually to ensure that they are in line with market levels and appropriate given the performance of the individual and the Company.Vesting of awards is based on:i. the Company’s Total Shareholder Return performance measured over
no less than three years against a peer group of companies selected by the Committee as at the start of the performance period. The vesting scale is median to upper quartile of the group of companies, with nothing vesting for below median performance; and
ii. internal audited financial measures of performance (e.g. Earnings Per Share, Return on Average Capital Employed) selected by the Committee over a period of no less than three financial years.
Dividend equivalents arising over the period between the grant date and the vesting date will be paid in cash or shares.Clawback provisions apply to the PSP so that individuals are liable to repay/forfeit some or all of their shares if there is a material misstatement of results or if there is serious misconduct.
Maximum annual awards: 225% of base salary (which will apply to the Group Chief Executive, with the Group Finance Director having an opportunity of having a maximum opportunity of 175% of base salary). 25% of the relevant part of the award will vest for achieving threshold performance, increasing to full vesting for the achievement of maximum performance.
Share ownership guidelinesTo further align the interests of executives with those of shareholders.
Executive Directors are expected to maintain a shareholding in the Company’s shares as a multiple of their base salary within five years of appointment (Group Chief Executive 225%, Group Finance Director 175%). To achieve this, Executive Directors are expected to retain at least 50% of shares (net of tax) which vest under the Company’s share plans until the share ownership guidelines are met.Non–Executive Directors are expected to build up and then maintain a shareholding that is equivalent to a percentage of their annual fee (50%) from the Company within two years of their date of appointment.
None.
All employee share planEncourages long–term shareholding in the Company.
Executive Directors have the opportunity to participate in the UK or international Sharesave plans on the same terms as other eligible employees. The UK plan is operated on an ‘equal terms basis’ to secure approved UK HMRC tax status. There are no performance conditions applicable to awards.
Following recent UK HMRC changes to the limits, the maximum participation level is now £500 per month (or local currency equivalent). This limit is subject to change in line with the UK HMRC limit from time to time.

68 Governance
Annual Report & Accounts 2015
Reward scenariosThe balance between fixed and variable 'at risk' elements of remuneration changes with performance. The Company’s remuneration policy results in a significant proportion of remuneration received by Executive Directors being dependent on Company performance. The total remuneration of the Executive Directors for a minimum, target and maximum performance is presented in the charts below:
Fixed payBonusShare-based payments
Maximum
Target
Minimum
Maximum£932,60024.9%
£932,60047.0%
£932,600100%
£702,00035.4%
£351,00017.7%
£1,404,00037.5%
£1,404,00037.5%
£546,70027.6%
£546,70051.1%
£330,75030.9%
£546,700100%
£192,93818.0%
£661,50033.4%
£771,75039.0%
Target
Minimum
Total remunerationMiles Roberts Adrian Marsh
The charts illustrate the remuneration policy from 1 August 2015. The charts are indicative as share price movement and dividend accrual have been excluded. Assumptions made for each scenario are as follows:
• Minimum: fixed remuneration only (i.e. latest known salary, benefits and pension).
• Target: fixed remuneration plus half of maximum annual bonus opportunity plus 25% vesting of performance shares. Note that the Company does not have a stated target for its financial measures or incentive payouts.
• Maximum: fixed remuneration plus maximum annual bonus opportunity plus 100% vesting of performance shares.
Service contracts and payment for loss of office The Committee’s policy is that the notice periods for Executive Directors appointed in future will not exceed one year. Service contracts may be terminated without notice and without payment or compensation, except for sums earned up to the date of cessation, on the occurrence of certain events, such as gross misconduct. The Committee’s normal policy on termination is to make phased compensatory payments and to reduce or stop such payments to former Executive Directors where they receive remuneration from other employment during the notice period (where this is consistent with local employment legislation and market practice). Termination payments will not exceed contractual entitlements. For future Directors’ contracts, if the Company exercises its right to make a payment in lieu of notice (PILON), these such payments will not exceed an amount equal to basic salary for any unexpired notice period.
Date of contract Notice period1
Group Chief Executive Miles Roberts
4 May 2010 The service contract may be terminated by 12 months’ notice by the Company, and by the Executive Director. The Company may terminate the contract with immediate effect by making a payment equal to basic salary and pension allowance for any unexpired period of notice.
Group Finance Director Adrian Marsh
24 September 2013 The service contract may be terminated by 12 months’ notice by the Company, and by the Executive Director. The Company may terminate the contract with immediate effect by making a payment equal to basic salary for any unexpired period of notice.
1 Any such termination payment may be made in a lump sum or in monthly instalments from the termination date. These monthly payments will be reduced to take account of any alternative employment or consultancy income during the period over which such instalments are payable.
In the case of a “good leaver”:
• annual cash bonus will be paid out, subject to Company performance, on the normal payment date unless the Committee determines that the payment will be made early on the date of cessation of employment. The payout will be reduced on a pro–rata basis to reflect the proportion of the performance period served;
• deferred bonus shares will vest in full on the date of cessation of employment; and
Remuneration Committee continued

Governance 69
dssmith.com
• PSP and SMP awards will vest, subject to performance, on the normal vesting date unless the Committee determines that the awards will vest early on the date of cessation of employment (in exceptional circumstances only). Awards will be reduced on a pro–rata basis.
For all other leavers:
• all performance–related elements of pay will lapse immediately.
For all leavers, the Committee may also determine to make a payment in reimbursement of a reasonable level of legal fees in connection with a settlement agreement.
Recruitment (and appointment) policyThe remuneration package for a new Executive Director would be set in accordance with the terms of the Company’s approved remuneration policy in force at the time of appointment.
In exceptional circumstances, the Committee may offer additional cash or share–based elements. Any such payments would be for the specific purpose of recruiting an Executive Director key to the operation of the Group. They would not exceed what is felt to be a fair estimate of remuneration lost when leaving the former employer and would reflect (as far as possible) the nature and time horizons attaching to that remuneration and the impact of any performance conditions. Shareholders will be informed of any such payments on appointment.
In the case of an internal executive appointment, any variable salary element awarded in respect of the prior role would be allowed to pay out according to its existing terms, adjusted as relevant to take into account the appointment. In addition, any other ongoing remuneration obligations existing prior to appointment would continue.
Policy for non–Executive Directors and the Chairman
ElementPurpose and link to strategy Operation Maximum opportunity
Fees Attract and retain high performing individuals.
Reviewed annually by the Board (after recommendation by the Committee in respect of the Chairman).Fee increases, if applicable, are normally effective from 1 August.The Board and, where appropriate, the Committee, considers pay data at comparator companies of similar scale.The Senior Independent Director and the chairmen of the Audit and Remuneration Committees receive additional fees.No eligibility for participation in bonuses, retirement plans or share plans but limited benefits may be delivered in relation to the performance of their duties as Director (e.g. hospitality, communication and travel–related benefits).
No prescribed maximum annual increase.Aggregate annual fees limited to £750,000 by Articles of Association.
Non–Executive Directors have letters of appointment for a term of three years whereupon they are normally renewed, but generally for no more than three terms in aggregate. In each case, the notice period is one month by the Company or the Director. Non–Executive Directors are not eligible for payments on termination. In line with the Code, all non-Executive Directors are subject to annual re-election by shareholders at our AGM.
Date of contract Unexpired period at date of reportGareth Davis Chairman 22 April 2013 Eight monthsChris Britton 22 January 2013 Seven monthsIan Griffiths 14 April 2014 Two yearsJonathan Nicholls Senior Independent Director 3 September 2012 Four monthsKathleen O’Donovan 10 September 2012 Four monthsLouise Smalley 14 April 2014 Two years
The letters of appointment detail the time commitment expected of each non–Executive Director and are available for viewing at the registered office during normal business hours and prior to and at the AGM.
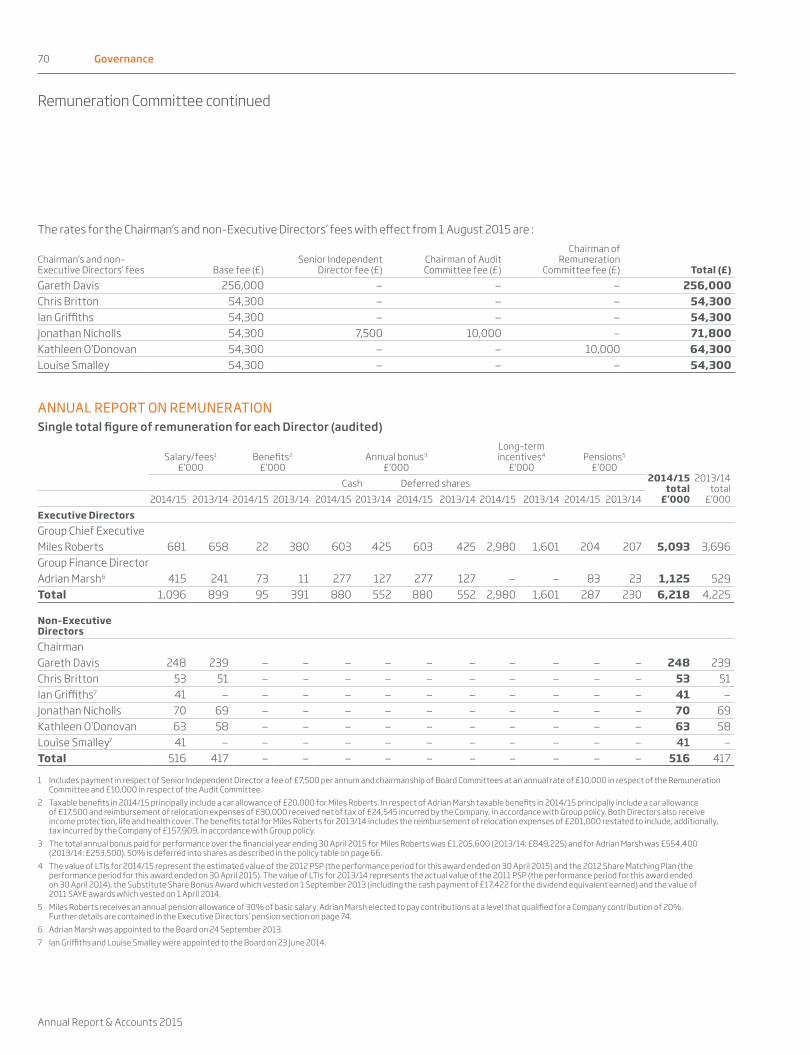
70 Governance
Annual Report & Accounts 2015
The rates for the Chairman’s and non–Executive Directors’ fees with effect from 1 August 2015 are :
Chairman’s and non–Executive Directors’ fees Base fee (£)
Senior Independent Director fee (£)
Chairman of Audit Committee fee (£)
Chairman of Remuneration
Committee fee (£) Total (£)Gareth Davis 256,000 — — — 256,000Chris Britton 54,300 — — — 54,300Ian Griffiths 54,300 — — — 54,300Jonathan Nicholls 54,300 7,500 10,000 — 71,800Kathleen O’Donovan 54,300 — — 10,000 64,300Louise Smalley 54,300 — — — 54,300
ANNUAL REPORT ON REMUNERATION Single total figure of remuneration for each Director (audited)
Salary/fees1 £’000
Benefits2 £’000
Annual bonus3 £’000
Long–term incentives4
£’000Pensions5
£’0002014/15
total £’000
2013/14 total
£’000Cash Deferred shares
2014/15 2013/14 2014/15 2013/14 2014/15 2013/14 2014/15 2013/14 2014/15 2013/14 2014/15 2013/14Executive DirectorsGroup Chief ExecutiveMiles Roberts 681 658 22 380 603 425 603 425 2,980 1,601 204 207 5,093 3,696Group Finance DirectorAdrian Marsh6 415 241 73 11 277 127 277 127 — — 83 23 1,125 529Total 1,096 899 95 391 880 552 880 552 2,980 1,601 287 230 6,218 4,225 Non–Executive DirectorsChairmanGareth Davis 248 239 — — — — — — — — — — 248 239Chris Britton 53 51 — — — — — — — — — — 53 51Ian Griffiths7 41 — — — — — — — — — — — 41 —Jonathan Nicholls 70 69 — — — — — — — — — — 70 69Kathleen O’Donovan 63 58 — — — — — — — — — — 63 58Louise Smalley7 41 — — — — — — — — — — — 41 —Total 516 417 — — — — — — — — — — 516 417
1 Includes payment in respect of Senior Independent Director a fee of £7,500 per annum and chairmanship of Board Committees at an annual rate of £10,000 in respect of the Remuneration Committee and £10,000 in respect of the Audit Committee.
2 Taxable benefits in 2014/15 principally include a car allowance of £20,000 for Miles Roberts. In respect of Adrian Marsh taxable benefits in 2014/15 principally include a car allowance of £17,500 and reimbursement of relocation expenses of £30,000 received net of tax of £24,545 incurred by the Company, in accordance with Group policy. Both Directors also receive income protection, life and health cover. The benefits total for Miles Roberts for 2013/14 includes the reimbursement of relocation expenses of £201,000 restated to include, additionally, tax incurred by the Company of £157,909, in accordance with Group policy.
3 The total annual bonus paid for performance over the financial year ending 30 April 2015 for Miles Roberts was £1,205,600 (2013/14: £849,225) and for Adrian Marsh was £554,400 (2013/14: £253,500). 50% is deferred into shares as described in the policy table on page 66.
4 The value of LTIs for 2014/15 represent the estimated value of the 2012 PSP (the performance period for this award ended on 30 April 2015) and the 2012 Share Matching Plan (the performance period for this award ended on 30 April 2015). The value of LTIs for 2013/14 represents the actual value of the 2011 PSP (the performance period for this award ended on 30 April 2014), the Substitute Share Bonus Award which vested on 1 September 2013 (including the cash payment of £17,422 for the dividend equivalent earned) and the value of 2011 SAYE awards which vested on 1 April 2014.
5 Miles Roberts receives an annual pension allowance of 30% of basic salary. Adrian Marsh elected to pay contributions at a level that qualified for a Company contribution of 20%. Further details are contained in the Executive Directors’ pension section on page 74.
6 Adrian Marsh was appointed to the Board on 24 September 2013.7 Ian Griffiths and Louise Smalley were appointed to the Board on 23 June 2014.
Remuneration Committee continued

Governance 71
dssmith.com
Determination of annual bonus (audited)Annual bonus payments were determined with reference to performance over the financial year ended 30 April 2015. The bonus vested on a straight–line basis of 95% – 105% of the budget as approved by the Board, split 50/50 between budgeted ROACE (14.0%) and budgeted earnings before tax and amortisation (EBTA) (£285 million). In assessing the actual performance achieved the Committee assesses and may make an adjustment for the impact of events that were not envisaged in the budget. These might include, for example, acquisitions and disposals, changes to accounting standards, and ensuring the same exchange rates are used for actual and budget performance. The bonus was calculated using EBTA of £311 million and ROACE of 14.4%. No element of the annual bonus is guaranteed.
The annual bonus is designed to drive the achievement of the Group’s annual financial and strategic business targets. The annual bonus opportunity is based on a formal review of performance against stretching financial targets.
Annual bonus2014/15
Miles Roberts Adrian MarshMaximum potential bonus is 200% of basic annual salary, of which half will be deferred in shares.
Maximum potential bonus is 150% of basic annual salary, of which half will be deferred in shares.
Targets adjusted EBTA growth and improved ROACE.At target, 50% of maximum bonus will be payable.
Targets adjusted EBTA growth and improved ROACE.At target 50% of maximum bonus will be payable.
Bonus earned 176% – £1,205,600 Bonus earned 132% – £554,4002015/16 bonus will operate on the same basis as for 2014/15.
The annual bonus plan for the Executive Directors and other senior executives is operated as shown in the policy table on page 66. Bonus results are determined by the Committee after the year end, based on performance against targets. Bonus awards are measured against the achievement of Group objectives. Maximum bonus for 2014/15 is shown above for the Executive Directors and is generally between 70% and 100% for the other most senior executives.
In the event of an acquisition in the year, the Committee will assess whether the financial performance of the acquired business should be included and targets adjusted accordingly or simply excluded. Adjustments to targets will continue to be disclosed in the relevant Directors' Remuneration Report.
LONG-TERM INCENTIVE PLANS (AUDITED)Performance Share PlanVesting of awardsThe PSP award granted on 16 July 2012 is based on performance to the year ended 30 April 2015. The performance conditions attached to this award and actual performance against these conditions are as follows:
Metric Performance condition Threshold target Stretch targetActual
performance Vesting levelReturn on average capital employed (25%)
Average of three years 11.6% 13.3% 13.3% 100%
Earnings per share (25%)
Average fully diluted, adjusted EPS over three years
19.2p 23.0p 21.3p 66%
Total shareholder return (50%)
Relative TSR performance against the constituents of the FTSE 250 Industrial Goods and Services Supersector
Median Upper quartile >Upper quartile 100%
Total vesting 91.5%
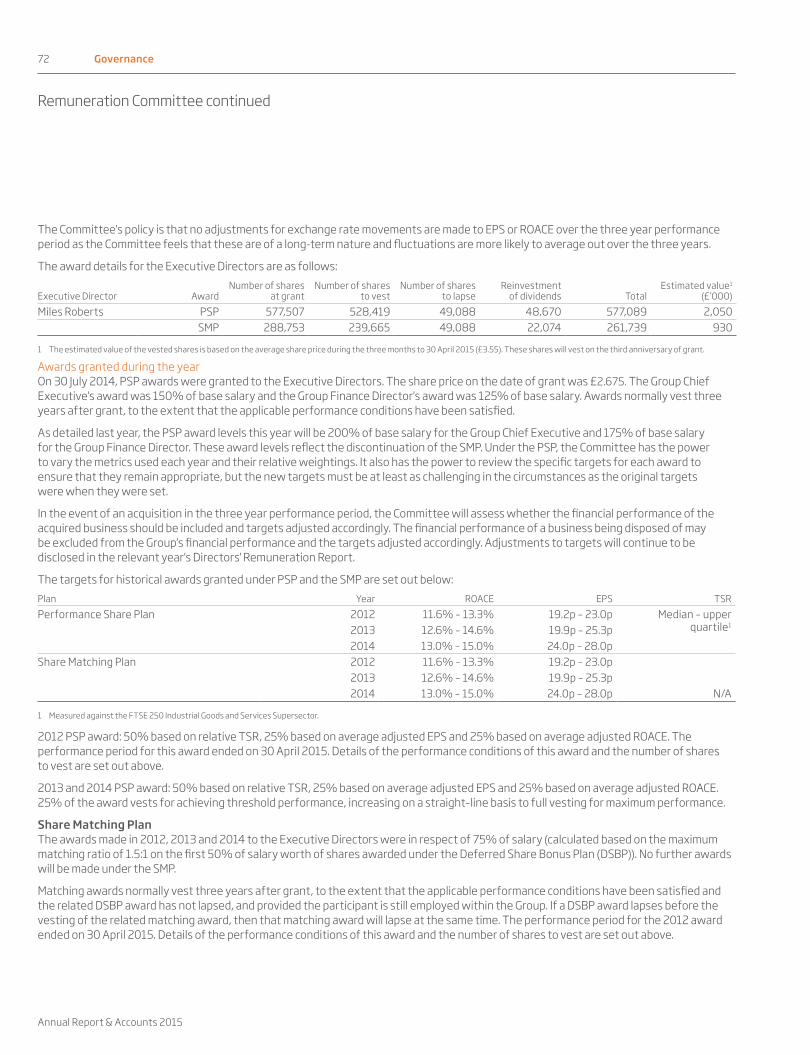
72 Governance
Annual Report & Accounts 2015
The Committee's policy is that no adjustments for exchange rate movements are made to EPS or ROACE over the three year performance period as the Committee feels that these are of a long-term nature and fluctuations are more likely to average out over the three years.
The award details for the Executive Directors are as follows:
Executive Director AwardNumber of shares
at grantNumber of shares
to vestNumber of shares
to lapseReinvestment
of dividends TotalEstimated value1
(£’000)Miles Roberts PSP 577,507 528,419 49,088 48,670 577,089 2,050
SMP 288,753 239,665 49,088 22,074 261,739 930
1 The estimated value of the vested shares is based on the average share price during the three months to 30 April 2015 (£3.55). These shares will vest on the third anniversary of grant.
Awards granted during the yearOn 30 July 2014, PSP awards were granted to the Executive Directors. The share price on the date of grant was £2.675. The Group Chief Executive's award was 150% of base salary and the Group Finance Director's award was 125% of base salary. Awards normally vest three years after grant, to the extent that the applicable performance conditions have been satisfied.
As detailed last year, the PSP award levels this year will be 200% of base salary for the Group Chief Executive and 175% of base salary for the Group Finance Director. These award levels reflect the discontinuation of the SMP. Under the PSP, the Committee has the power to vary the metrics used each year and their relative weightings. It also has the power to review the specific targets for each award to ensure that they remain appropriate, but the new targets must be at least as challenging in the circumstances as the original targets were when they were set.
In the event of an acquisition in the three year performance period, the Committee will assess whether the financial performance of the acquired business should be included and targets adjusted accordingly. The financial performance of a business being disposed of may be excluded from the Group's financial performance and the targets adjusted accordingly. Adjustments to targets will continue to be disclosed in the relevant year's Directors' Remuneration Report.
The targets for historical awards granted under PSP and the SMP are set out below:Plan Year ROACE EPS TSRPerformance Share Plan 2012 11.6% – 13.3% 19.2p – 23.0p Median – upper
quartile12013 12.6% – 14.6% 19.9p – 25.3p2014 13.0% – 15.0% 24.0p – 28.0p
Share Matching Plan 2012 11.6% – 13.3% 19.2p – 23.0p
N/A2013 12.6% – 14.6% 19.9p – 25.3p2014 13.0% – 15.0% 24.0p – 28.0p
1 Measured against the FTSE 250 Industrial Goods and Services Supersector.
2012 PSP award: 50% based on relative TSR, 25% based on average adjusted EPS and 25% based on average adjusted ROACE. The performance period for this award ended on 30 April 2015. Details of the performance conditions of this award and the number of shares to vest are set out above.
2013 and 2014 PSP award: 50% based on relative TSR, 25% based on average adjusted EPS and 25% based on average adjusted ROACE. 25% of the award vests for achieving threshold performance, increasing on a straight–line basis to full vesting for maximum performance.
Share Matching PlanThe awards made in 2012, 2013 and 2014 to the Executive Directors were in respect of 75% of salary (calculated based on the maximum matching ratio of 1.5:1 on the first 50% of salary worth of shares awarded under the Deferred Share Bonus Plan (DSBP)). No further awards will be made under the SMP.
Matching awards normally vest three years after grant, to the extent that the applicable performance conditions have been satisfied and the related DSBP award has not lapsed, and provided the participant is still employed within the Group. If a DSBP award lapses before the vesting of the related matching award, then that matching award will lapse at the same time. The performance period for the 2012 award ended on 30 April 2015. Details of the performance conditions of this award and the number of shares to vest are set out above.
Remuneration Committee continued
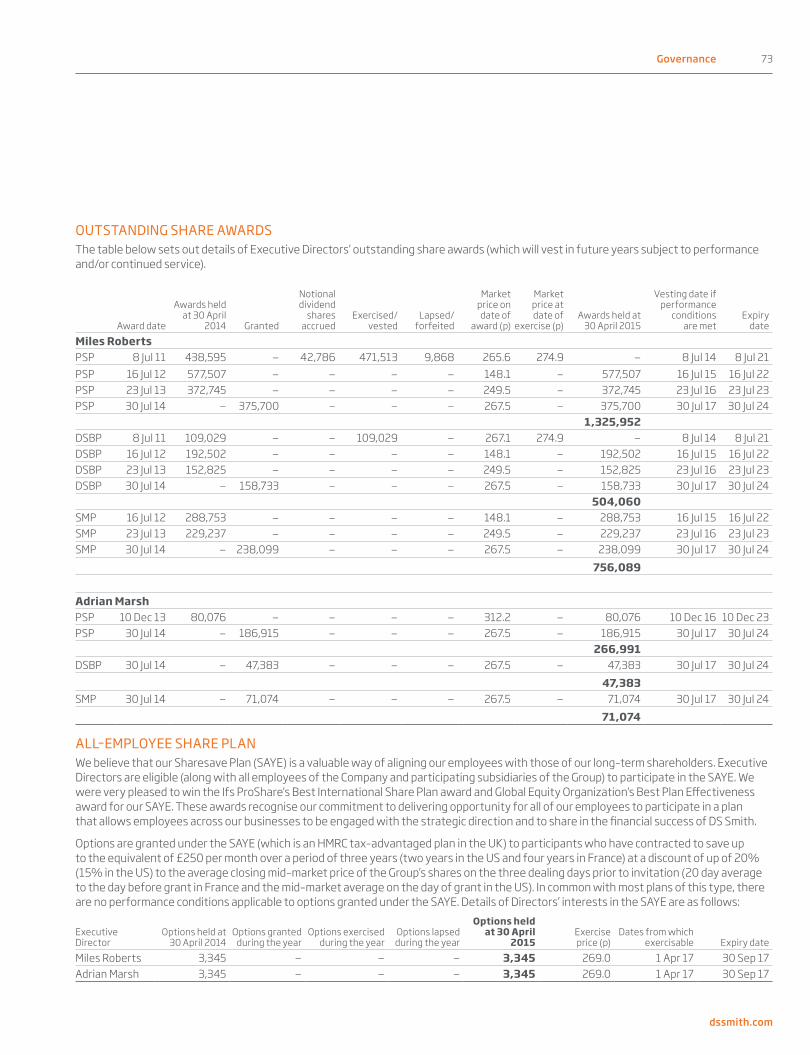
Governance 73
dssmith.com
OUTSTANDING SHARE AWARDSThe table below sets out details of Executive Directors’ outstanding share awards (which will vest in future years subject to performance and/or continued service).
Award date
Awards held at 30 April
2014 Granted
Notional dividend
shares accrued
Exercised/vested
Lapsed/forfeited
Market price on date of
award (p)
Market price at date of
exercise (p)Awards held at
30 April 2015
Vesting date if performance
conditions are met
Expiry date
Miles RobertsPSP 8 Jul 11 438,595 — 42,786 471,513 9,868 265.6 274.9 — 8 Jul 14 8 Jul 21PSP 16 Jul 12 577,507 — — — — 148.1 — 577,507 16 Jul 15 16 Jul 22PSP 23 Jul 13 372,745 — — — — 249.5 — 372,745 23 Jul 16 23 Jul 23PSP 30 Jul 14 — 375,700 — — — 267.5 — 375,700 30 Jul 17 30 Jul 24
1,325,952DSBP 8 Jul 11 109,029 — — 109,029 — 267.1 274.9 — 8 Jul 14 8 Jul 21DSBP 16 Jul 12 192,502 — — — — 148.1 — 192,502 16 Jul 15 16 Jul 22DSBP 23 Jul 13 152,825 — — — — 249.5 — 152,825 23 Jul 16 23 Jul 23DSBP 30 Jul 14 — 158,733 — — — 267.5 — 158,733 30 Jul 17 30 Jul 24
504,060SMP 16 Jul 12 288,753 — — — — 148.1 — 288,753 16 Jul 15 16 Jul 22SMP 23 Jul 13 229,237 — — — — 249.5 — 229,237 23 Jul 16 23 Jul 23SMP 30 Jul 14 — 238,099 — — — 267.5 — 238,099 30 Jul 17 30 Jul 24
756,089
Adrian MarshPSP 10 Dec 13 80,076 — — — — 312.2 — 80,076 10 Dec 16 10 Dec 23PSP 30 Jul 14 — 186,915 — — — 267.5 — 186,915 30 Jul 17 30 Jul 24
266,991DSBP 30 Jul 14 — 47,383 — — — 267.5 — 47,383 30 Jul 17 30 Jul 24
47,383SMP 30 Jul 14 — 71,074 — — — 267.5 — 71,074 30 Jul 17 30 Jul 24
71,074
ALL–EMPLOYEE SHARE PLANWe believe that our Sharesave Plan (SAYE) is a valuable way of aligning our employees with those of our long–term shareholders. Executive Directors are eligible (along with all employees of the Company and participating subsidiaries of the Group) to participate in the SAYE. We were very pleased to win the Ifs ProShare's Best International Share Plan award and Global Equity Organization's Best Plan Effectiveness award for our SAYE. These awards recognise our commitment to delivering opportunity for all of our employees to participate in a plan that allows employees across our businesses to be engaged with the strategic direction and to share in the financial success of DS Smith.
Options are granted under the SAYE (which is an HMRC tax–advantaged plan in the UK) to participants who have contracted to save up to the equivalent of £250 per month over a period of three years (two years in the US and four years in France) at a discount of up of 20% (15% in the US) to the average closing mid–market price of the Group’s shares on the three dealing days prior to invitation (20 day average to the day before grant in France and the mid–market average on the day of grant in the US). In common with most plans of this type, there are no performance conditions applicable to options granted under the SAYE. Details of Directors’ interests in the SAYE are as follows:
Executive Director
Options held at 30 April 2014
Options granted during the year
Options exercised during the year
Options lapsed during the year
Options held at 30 April
2015Exercise price (p)
Dates from which exercisable Expiry date
Miles Roberts 3,345 — — — 3,345 269.0 1 Apr 17 30 Sep 17Adrian Marsh 3,345 — — — 3,345 269.0 1 Apr 17 30 Sep 17

74 Governance
Annual Report & Accounts 2015
EXTERNAL APPOINTMENTS The Board supports Executive Directors taking up appointments outside the Company to broaden their knowledge and experience. Each Executive Director is permitted to accept one non-Executive appointment from which they may retain any fee (or in exceptional circumstances two appointments). Any external appointment must not conflict with a Director’s duties and commitments to DS Smith.
Miles Roberts was appointed a non-Executive Director of Poundland Group plc on 30 October 2014 and retained fees of £23,340 for the period from appointment to 30 April 2015. Adrian Marsh does not currently have any external appointments.
PAYMENTS TO PAST DIRECTORS OR FOR LOSS OF OFFICE (AUDITED)No payments were made to past Executive Directors during the year ended 30 April 2015 (2013/14: Nil). No payments were made in respect of loss of office during the year ended 30 April 2015 (2013/14: Nil).
PENSION AND OTHER BENEFITSMiles Roberts receives an annual pension allowance of 30% of basic salary, in lieu of pension benefits. This payment is not considered to be salary for the purpose of calculating any bonus payment.
Adrian Marsh elected to pay contributions at a level that qualifies for a Company contribution of 20% or he can receive an equivalent cash supplement. This payment is not pensionable and is not considered to be salary for the purpose of calculating any bonus payment.
Other benefits:As previously disclosed, Adrian Marsh was reimbursed £30,000 for his relocation expenses in the year under review. This payment was in line with the head office relocation policy rules (that apply to all employees) and the payment is subject to clawback if he should leave within two years.
Other benefits include car allowance, taxable fuel, income protection, life and health cover.
STATEMENT OF CHANGE IN PAY OF GROUP CHIEF EXECUTIVE COMPARED WITH OTHER EMPLOYEES (AUDITED)The table below shows the percentage year-on-year change in the historic base salary and benefits received and annual bonus earned between the year ended 30 April 2015 and the previous financial year for the Group Chief Executive compared to the average of the Group’s employees. As stated earlier, his salary increase effective from 1 August 2015 will be in line with the average increase for the workforce generally at 2.5%.
Group Chief Executive All employees1
Percentage change 2014
to 2015
Percentage change 2014
to 2015Salary 3.5% 2.3%Benefits2 (94.2%) 0.0%Bonus 41.8% 0.5%1 Represents approximately three quarters of the Group’s employees, taken mainly from the countries with the largest employee populations.2 The prior year benefits figure included a payment reimbursing for relocation expenses of £201,000. Excluding this payment, there was no year–on–year change to benefits for the
Group Chief Executive.
Relative importance of spend on payThe table below shows the expenditure and percentage change in overall spend on employee remuneration and dividends.
£ million unless otherwise stated 2015 2014Percentage
changeOverall expenditure on pay1 845 883 (4.3%)Dividend paid in the year 94 74 27.0%
1 Total remuneration reflects overall employee costs. See financial statements note 6 for further information.
Remuneration Committee continued
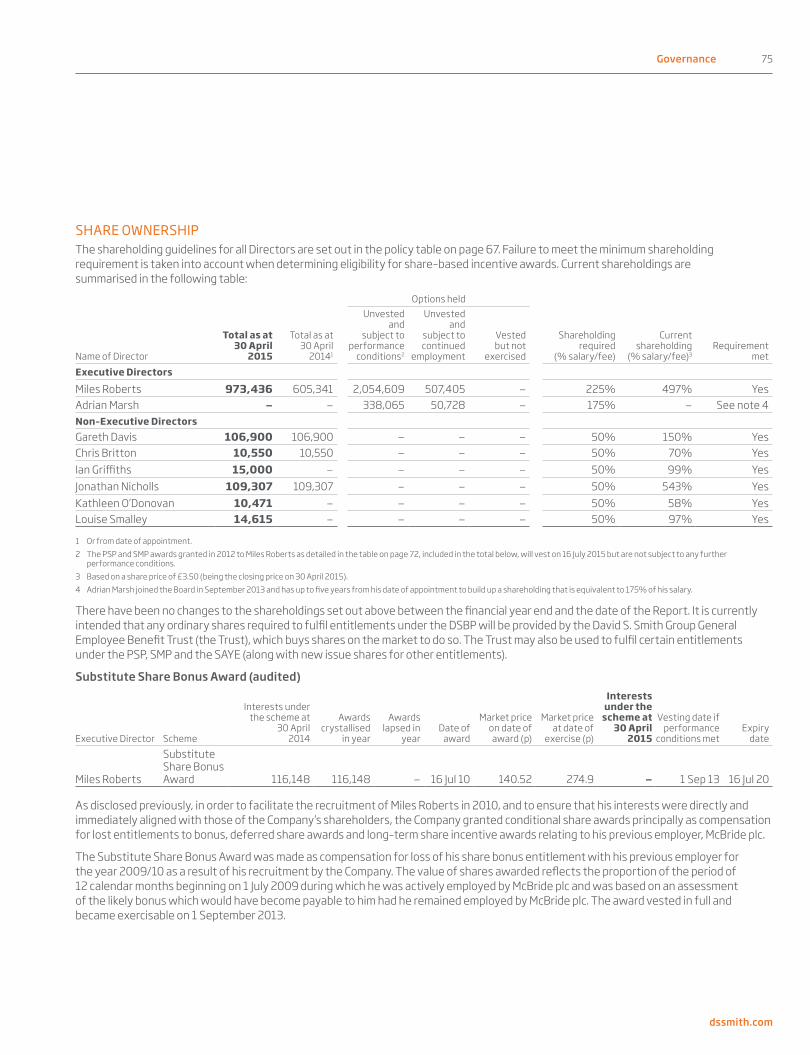
Governance 75
dssmith.com
SHARE OWNERSHIPThe shareholding guidelines for all Directors are set out in the policy table on page 67. Failure to meet the minimum shareholding requirement is taken into account when determining eligibility for share–based incentive awards. Current shareholdings are summarised in the following table:
Options held
Name of Director
Total as at 30 April
2015
Total as at 30 April
20141
Unvested and
subject to performance
conditions2
Unvested and
subject to continued
employment
Vested but not
exercised
Shareholding required
(% salary/fee)
Current shareholding
(% salary/fee)3Requirement
metExecutive Directors
Miles Roberts 973,436 605,341 2,054,609 507,405 — 225% 497% YesAdrian Marsh — — 338,065 50,728 — 175% — See note 4Non–Executive DirectorsGareth Davis 106,900 106,900 — — — 50% 150% YesChris Britton 10,550 10,550 — — — 50% 70% YesIan Griffiths 15,000 — — — — 50% 99% YesJonathan Nicholls 109,307 109,307 — — — 50% 543% YesKathleen O’Donovan 10,471 — — — — 50% 58% YesLouise Smalley 14,615 — — — — 50% 97% Yes
1 Or from date of appointment.2 The PSP and SMP awards granted in 2012 to Miles Roberts as detailed in the table on page 72, included in the total below, will vest on 16 July 2015 but are not subject to any further
performance conditions.3 Based on a share price of £3.50 (being the closing price on 30 April 2015).4 Adrian Marsh joined the Board in September 2013 and has up to five years from his date of appointment to build up a shareholding that is equivalent to 175% of his salary.
There have been no changes to the shareholdings set out above between the financial year end and the date of the Report. It is currently intended that any ordinary shares required to fulfil entitlements under the DSBP will be provided by the David S. Smith Group General Employee Benefit Trust (the Trust), which buys shares on the market to do so. The Trust may also be used to fulfil certain entitlements under the PSP, SMP and the SAYE (along with new issue shares for other entitlements).
Substitute Share Bonus Award (audited)
Executive Director Scheme
Interests under the scheme at
30 April 2014
Awards crystallised
in year
Awards lapsed in
yearDate of
award
Market price on date of award (p)
Market price at date of
exercise (p)
Interests under the
scheme at 30 April
2015
Vesting date if performance
conditions metExpiry
date
Miles Roberts
Substitute Share Bonus Award 116,148 116,148 — 16 Jul 10 140.52 274.9 — 1 Sep 13 16 Jul 20
As disclosed previously, in order to facilitate the recruitment of Miles Roberts in 2010, and to ensure that his interests were directly and immediately aligned with those of the Company’s shareholders, the Company granted conditional share awards principally as compensation for lost entitlements to bonus, deferred share awards and long–term share incentive awards relating to his previous employer, McBride plc.
The Substitute Share Bonus Award was made as compensation for loss of his share bonus entitlement with his previous employer for the year 2009/10 as a result of his recruitment by the Company. The value of shares awarded reflects the proportion of the period of 12 calendar months beginning on 1 July 2009 during which he was actively employed by McBride plc and was based on an assessment of the likely bonus which would have become payable to him had he remained employed by McBride plc. The award vested in full and became exercisable on 1 September 2013.

76 Governance
Annual Report & Accounts 2015
Review of past performance – total shareholder return graphThe following graph illustrates the Company’s TSR performance since 1 May 2009, relative to the FTSE 250 Index. The Company is a member of the FTSE 250 Index and, accordingly, this index is considered to be the most appropriate comparator group for this purpose. This graph looks at the value, by 30 April 2015, of £100 invested in DS Smith over the last six financial years compared with that of £100 invested in the FTSE 250 Index. The other points plotted are the values at intervening financial year ends.
Remuneration of the Chief ExecutiveThe table below shows the total remuneration figure for the Chief Executive during each of those financial years. The total remuneration figure includes the annual bonus and LTIP awards which vested based on performance in those years. The annual bonus and LTIP percentages show the payout for each year as a percentage of the maximum available for the financial year.
2009/101 2010/11 2011/12 2012/13 2013/14 2014/15Total remuneration (£’000) 1,499 1,796 2,170 6,057 3,696 5,093Annual bonus (%) 100% 100% 100% 82% 85% 88%LTIP vesting (%) 28% 100% 100% 100% 98% 92%
1 2009/10 figures relate to the previous Group Chief Executive, Tony Thorne.
Remuneration Committee continued
DS Smith FTSE 250 Index
(Value £)
201520142013
Source: Thomson Reuters
2012201120102009
Total shareholder return
0
100
200
300
400
500
600
700
+699%
+173%
THE COMMITTEE ADDRESSED THE FOLLOWING MAIN MATTERS DURING THE YEAR:June 2014 September 2014 January 2015 March 2015 April 2015
Key agenda item Key agenda item Key agenda item Key agenda item Key agenda item
• Authorised 2013/14 bonus payments.• Approved targets for 2014/15 bonus plan.• Approved 2013/14 Directors’
Remuneration Report.• Reviewed the Executive Directors’ and senior
executives’ pay/incentive arrangements.• Had oversight of remuneration policy for
senior management and employees.• 2013/14 PSP award – TSR, EPS and
ROACE target proposals.
• Reviewed emerging trends.
• Training on approaches to remuneration "hot topics".
• Received an update on 2014/15 annual bonus plan.
• Considered the approach to 2015 share incentive awards.
• Set the annual agenda for 2015/16 for the Committee.
• Reviewed applicability of remuneration policy.
• Reviewed the targets for existing awards.
• Reviewed senior executive remuneration benchmarking.
• Reviewed draft 2014/15 Directors’ Remuneration Report.
• Reviewed performance targets for 2015/16 bonus and PSP awards.
• Approved updated terms of reference.
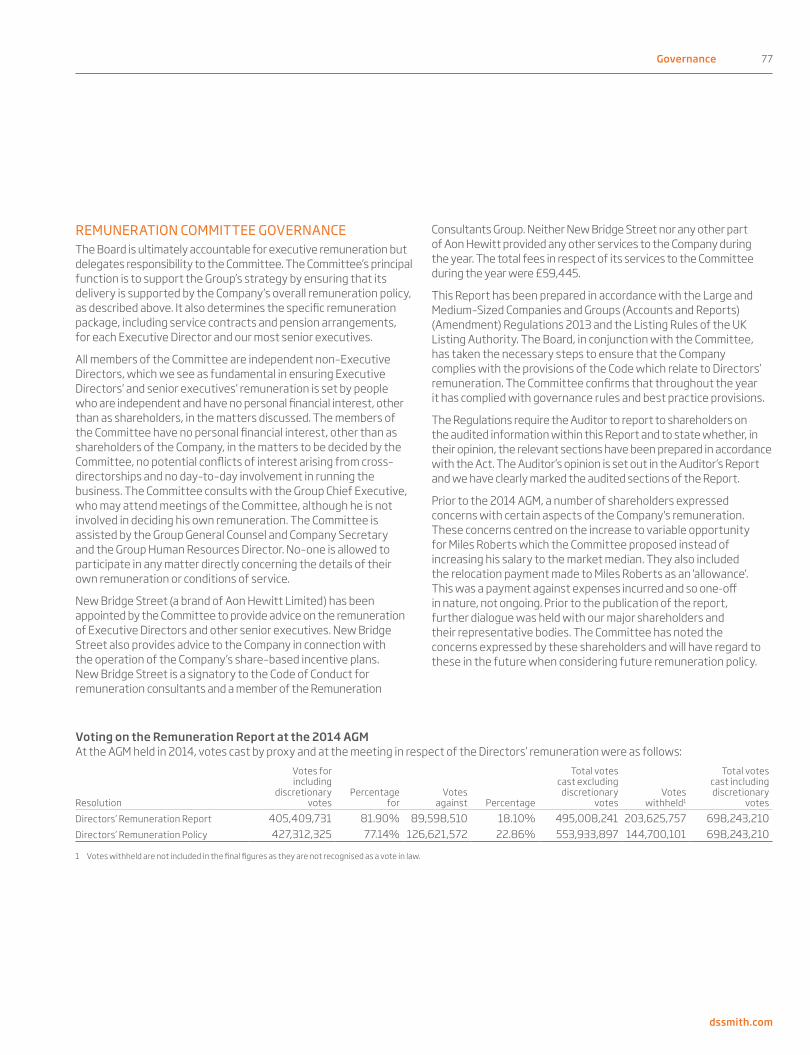
Governance 77
dssmith.com
REMUNERATION COMMITTEE GOVERNANCEThe Board is ultimately accountable for executive remuneration but delegates responsibility to the Committee. The Committee’s principal function is to support the Group’s strategy by ensuring that its delivery is supported by the Company’s overall remuneration policy, as described above. It also determines the specific remuneration package, including service contracts and pension arrangements, for each Executive Director and our most senior executives.
All members of the Committee are independent non–Executive Directors, which we see as fundamental in ensuring Executive Directors’ and senior executives’ remuneration is set by people who are independent and have no personal financial interest, other than as shareholders, in the matters discussed. The members of the Committee have no personal financial interest, other than as shareholders of the Company, in the matters to be decided by the Committee, no potential conflicts of interest arising from cross–directorships and no day–to–day involvement in running the business. The Committee consults with the Group Chief Executive, who may attend meetings of the Committee, although he is not involved in deciding his own remuneration. The Committee is assisted by the Group General Counsel and Company Secretary and the Group Human Resources Director. No–one is allowed to participate in any matter directly concerning the details of their own remuneration or conditions of service.
New Bridge Street (a brand of Aon Hewitt Limited) has been appointed by the Committee to provide advice on the remuneration of Executive Directors and other senior executives. New Bridge Street also provides advice to the Company in connection with the operation of the Company’s share–based incentive plans. New Bridge Street is a signatory to the Code of Conduct for remuneration consultants and a member of the Remuneration
Consultants Group. Neither New Bridge Street nor any other part of Aon Hewitt provided any other services to the Company during the year. The total fees in respect of its services to the Committee during the year were £59,445.
This Report has been prepared in accordance with the Large and Medium–Sized Companies and Groups (Accounts and Reports) (Amendment) Regulations 2013 and the Listing Rules of the UK Listing Authority. The Board, in conjunction with the Committee, has taken the necessary steps to ensure that the Company complies with the provisions of the Code which relate to Directors’ remuneration. The Committee confirms that throughout the year it has complied with governance rules and best practice provisions.
The Regulations require the Auditor to report to shareholders on the audited information within this Report and to state whether, in their opinion, the relevant sections have been prepared in accordance with the Act. The Auditor’s opinion is set out in the Auditor’s Report and we have clearly marked the audited sections of the Report.
Prior to the 2014 AGM, a number of shareholders expressed concerns with certain aspects of the Company's remuneration. These concerns centred on the increase to variable opportunity for Miles Roberts which the Committee proposed instead of increasing his salary to the market median. They also included the relocation payment made to Miles Roberts as an 'allowance'. This was a payment against expenses incurred and so one-off in nature, not ongoing. Prior to the publication of the report, further dialogue was held with our major shareholders and their representative bodies. The Committee has noted the concerns expressed by these shareholders and will have regard to these in the future when considering future remuneration policy.
Voting on the Remuneration Report at the 2014 AGMAt the AGM held in 2014, votes cast by proxy and at the meeting in respect of the Directors’ remuneration were as follows:
Resolution
Votes for including
discretionary votes
Percentage for
Votes against Percentage
Total votes cast excluding
discretionary votes
Votes withheld1
Total votes cast including discretionary
votes Directors’ Remuneration Report 405,409,731 81.90% 89,598,510 18.10% 495,008,241 203,625,757 698,243,210Directors’ Remuneration Policy 427,312,325 77.14% 126,621,572 22.86% 553,933,897 144,700,101 698,243,210
1 Votes withheld are not included in the final figures as they are not recognised as a vote in law.

78 Governance
Annual Report & Accounts 2015
IMPLEMENTATION OF POLICY FOR 2015/16Base salariesIn determining base salaries for 2015/16, the Remuneration Committee has taken into consideration, particularly, the experience, performance, and the internal and external relative positioning for total reward of the individuals, and has also taken into account the average budgeted increase in base salaries of the Group’s workforce in 2015/16. Salaries are being increased from 1 August 2015 as follows:
Salaries effective from:1 August 2014 1 August 2015
Miles Roberts £685,000 £702,000 Adrian Marsh £420,000 £441,000
Annual bonusThe maximum annual bonus opportunity for 2015/16 will remain unchanged at 200% and 150% of salary for the Group Chief Executive and Group Finance Director respectively. The target bonus will also remain at the same level as a percentage of salary at half of the maximum.
For 2015/16, the annual bonus plan will comprise two discrete elements for the Executive Directors:
• 50% on EBTA performance; and
• 50% on ROACE performance.
The targets are challenging relative to the 2015/16 business plan and show growth over 2014/15. They are deemed by the Committee to be commercially sensitive so will be disclosed retrospectively (along with performance against them) in next year’s remuneration report to the extent that they do not remain commercially sensitive at that time.
Long–term incentivesAs explained in last year's report, linked to the discontinuation of the SMP, the PSP opportunity for the Group Chief Executive would increase to 225% of salary, phased over two years. The award to be made in July 2015 will be at 200% of salary for the Group Chief Executive. The award to be made to the Group Finance Director will be at 175% of salary. The Committee will continue to review the award level to ensure it remains appropriate. The awards will continue to be granted as nil–cost options.
The PSP will continue to be subject to three performance measures: relative TSR, EPS and ROACE with equal weighting on each element. The respective targets for the 2015 award will be:
% vesting as Relative TSR1 Average EPS2Average adjusted
ROACE3
a proportion 1/3rd 1/3rd 1/3rd 100% Upper quartile 30.4p 15%Between 25% and 100%
Between median and upper quartile 26.6 p – 30.4p 13% – 15%
25% Median 26.6p 13%
1 Relative TSR performance measured over three years against a group of 44 companies within the Industrial Goods & Services Supersector within the FTSE 250 as at the start of the performance period.
2 Average adjusted EPS, as disclosed in the Annual Report, over the forthcoming three financial years, commencing with the financial year starting immediately prior to the award.
3 Average adjusted ROACE over the forthcoming three financial years, commencing with the financial year starting immediately prior to the award.
4 Targets may be adjusted by the Committee (for example, to reflect the impact of acquisitions and disposals) to ensure that the conditions achieve their original purpose.
5 The adjusted EPS/ROACE for all three years will be added up, divided by three and compared to the targets above. For a growing business these targets are more demanding than if only the third year's performance is compared to these targets.
These targets will require management to deliver a strong, sustainable performance over the three year period.
On behalf of the Board
Kathleen O’DonovanChairman of the Remuneration Committee 24 June 2015
REMUNERATION COMMITTEE MEMBERSHIPChairman of the Committee MembersKathleen O’Donovan Chris Britton, Gareth Davis, Ian Griffiths1,
Jonathan Nicholls, Louise Smalley1
1 Ian Griffiths and Louise Smalley joined the Board on 23 June 2014.
Remuneration Committee continued

Governance 79
dssmith.com
The Directors are responsible for preparing the Annual Report and the financial statements in accordance with applicable law and regulations.
Company law requires the Directors to prepare financial statements for each financial year. Under that law, the Directors are required to prepare the Group financial statements in accordance with International Financial Reporting Standards (IFRSs) as adopted by the European Union and Article 4 of the IAS Regulation and have chosen to prepare the parent Company financial statements in accordance with United Kingdom Generally Accepted Accounting Practice (United Kingdom Accounting Standards and applicable law). Under company law, the Directors must not approve the accounts unless they are satisfied that they give a true and fair view of the state of affairs of the Company and of the profit or loss of the Company for that period.
In preparing the parent Company financial statements, the Directors are required to:
• select suitable accounting policies and then apply them consistently;
• make judgements and accounting estimates that are reasonable and prudent;
• state whether applicable UK Accounting Standards have been followed, subject to any material departures disclosed and explained in the financial statements; and
• prepare the financial statements on the going concern basis unless it is inappropriate to presume that the Company will continue in business.
Responsibility statementWe confirm that to the best of our knowledge:
• the financial statements, prepared in accordance with the relevant financial reporting framework, give a true and fair view of the assets, liabilities, financial position and profit or loss of the Company and the undertakings included in the consolidation taken as a whole; and
• the management report, which is incorporated into the Directors’ Report, includes a fair review of the development and performance of the business and the position of the Company and the undertakings included in the consolidation taken as a whole, together with a description of the principal risks and uncertainties that they face.
In addition, we confirm that the Annual Report and Accounts, taken as a whole, is fair, balanced and understandable and provides the information necessary for shareholders to assess the performance, strategy and business model of the Company.
By Order of the Board
Miles RobertsGroup Chief Executive 24 June 2015
Adrian MarshGroup Finance Director 24 June 2015
In preparing the Group financial statements, International Accounting Standard 1 requires that Directors:
• properly select and apply accounting policies;
• present information, including accounting policies, in a manner that provides relevant, reliable, comparable and understandable information;
• provide additional disclosures when compliance with the specific requirements in IFRSs is insufficient to enable users to understand the impact of particular transactions, other events and conditions on the entity’s financial position and financial performance; and
• make an assessment of the Company’s ability to continue as a going concern.
The Directors are responsible for keeping adequate accounting records that are sufficient to show and explain the Company’s transactions and disclose with reasonable accuracy at any time the financial position of the Company and enable them to ensure that the financial statements comply with the Companies Act 2006. They are also responsible for safeguarding the assets of the Company and hence for taking reasonable steps for the prevention and detection of fraud and other irregularities.
The Directors are responsible for the maintenance and integrity of the corporate and financial information included on the Company’s website. Legislation in the United Kingdom governing the preparation and dissemination of financial statements may differ from legislation in other jurisdictions.
Directors’ Responsibilities Statement

80 Financial Statements
Annual Report & Accounts 2015
80 Financial Statements
Independent Auditor’s Report to the members of DS Smith Plc
OPINION ON FINANCIAL STATEMENTS OF DS SMITH PLC In our opinion:
the financial statements give a true and fair view of the state of the Group’s and of the parent Company’s affairs as at 30 April 2015 and of the Group’s profit for the year then ended;
the Group financial statements have been properly prepared in accordance with International Financial Reporting Standards (IFRSs) as adopted by the European Union;
the parent Company financial statements have been properly prepared in accordance with United Kingdom Generally Accepted Accounting Practice; and the financial statements have been prepared in accordance with the requirements of the Companies Act 2006 and, as regards the Group financial
statements, Article 4 of the IAS Regulation. The financial statements comprise the Consolidated Income Statement, the Consolidated Statement of Comprehensive Income, Consolidated Statement of Financial Position, Consolidated Statement of Changes in Equity, Consolidated Statement of Cash Flows, Company Balance Sheet and the related notes 1 to 34 to the Consolidated Financial Statements and the related notes 1 to 12 to the Company Balance Sheet. The financial reporting framework that has been applied in the preparation of the Group financial statements is applicable law and IFRSs as adopted by the European Union. The financial reporting framework that has been applied in the preparation of the parent Company financial statements is applicable law and United Kingdom Accounting Standards (United Kingdom Generally Accepted Accounting Practice).
GOING CONCERN As required by the Listing Rules we have reviewed the Directors’ statement on page 56 that the Group is a going concern. We confirm that:
we have concluded that the Directors’ use of the going concern basis of accounting in the preparation of the financial statements is appropriate; and we have not identified any material uncertainties that may cast significant doubt on the Group’s ability to continue as a going concern. However, because not all future events or conditions can be predicted, this statement is not a guarantee as to the Group’s ability to continue as a going concern.

Financial Statements 81
dssmith.com
80 Financial Statements
Independent Auditor’s Report to the members of DS Smith Plc
OPINION ON FINANCIAL STATEMENTS OF DS SMITH PLC In our opinion:
the financial statements give a true and fair view of the state of the Group’s and of the parent Company’s affairs as at 30 April 2015 and of the Group’s profit for the year then ended;
the Group financial statements have been properly prepared in accordance with International Financial Reporting Standards (IFRSs) as adopted by the European Union;
the parent Company financial statements have been properly prepared in accordance with United Kingdom Generally Accepted Accounting Practice; and the financial statements have been prepared in accordance with the requirements of the Companies Act 2006 and, as regards the Group financial
statements, Article 4 of the IAS Regulation. The financial statements comprise the Consolidated Income Statement, the Consolidated Statement of Comprehensive Income, Consolidated Statement of Financial Position, Consolidated Statement of Changes in Equity, Consolidated Statement of Cash Flows, Company Balance Sheet and the related notes 1 to 34 to the Consolidated Financial Statements and the related notes 1 to 12 to the Company Balance Sheet. The financial reporting framework that has been applied in the preparation of the Group financial statements is applicable law and IFRSs as adopted by the European Union. The financial reporting framework that has been applied in the preparation of the parent Company financial statements is applicable law and United Kingdom Accounting Standards (United Kingdom Generally Accepted Accounting Practice).
GOING CONCERN As required by the Listing Rules we have reviewed the Directors’ statement on page 56 that the Group is a going concern. We confirm that:
we have concluded that the Directors’ use of the going concern basis of accounting in the preparation of the financial statements is appropriate; and we have not identified any material uncertainties that may cast significant doubt on the Group’s ability to continue as a going concern. However, because not all future events or conditions can be predicted, this statement is not a guarantee as to the Group’s ability to continue as a going concern.
Financial Statements 81
OUR ASSESSMENT OF RISKS OF MATERIAL MISSTATEMENT The assessed risks of material misstatement described below are those that had the greatest effect on our audit strategy, the allocation of resources in the audit and directing the efforts of the engagement team:
Risk How the scope of our audit responded to the risk
Classification and presentation of exceptional items The presentation and consistency of costs and income within exceptional items is a key determinant in the assessment of the quality of the Group’s underlying earnings. Management judgement is required in determining whether an item is exceptional. For the year ended 30 April 2015, the Group incurred exceptional and acquisition related costs of £51 million. Refer to note 4 for details of the exceptional items in the year.
Exceptional items have been evaluated as to their nature in order to assess whether their classification and presentation are in line with the Group’s accounting policy and guidance from the Financial Reporting Council. The quantification of such items has been assessed by agreeing to supporting source documentation. We have reviewed management’s application of the policy for consistency with previous accounting periods. We also assessed whether the disclosures within the financial statements in note 4 provide sufficient detail for the reader to understand the nature of these items.
Tax The value of the tax provisions recorded in respect of a number of uncertain tax positions require judgements in respect of the likely outcome of negotiations with various tax authorities. Refer to note 1(u) for management’s process for estimating and recording tax provisions.
We worked with our tax audit specialists including those in required local jurisdictions to challenge the estimates and judgements made by management when calculating the income tax payable in each territory and the associated provisions held. We reviewed the correspondence with the taxation authorities in significant locations, as well as reviewing the support or opinions received from external counsel or other advisors where management has utilised such opinions to appraise the likely outcome of technical tax treatments and assessing the reasonableness of the provisions made.
Carrying value of goodwill, tangible and intangible assets and investment balances The key assumptions used in the assessment of the carrying value of goodwill and intangible assets are determined with reference to judgemental factors such as the projected cash flows, discount rate and perpetuity growth rates. As at the year end, the Group held an aggregate of £2,214 million of goodwill, tangible and intangible assets and investments. Refer to notes 1(i), 10, 11 and 12 for details of these balances.
We assessed the assumptions used in the impairment model, specifically the cash flow projections, discount rates and perpetuity growth rates. Our procedures included challenging forecast cash flows with reference to historical trading performance, benchmarking assumptions, such as the perpetual growth rate and discount rate, to external macro-economic and market data and consulting with our valuation specialists. Additionally, we considered the likelihood of change in management’s assumptions and assessed the sensitivity of management’s base case impairment review to a change in the key assumptions both individually and collectively.
Adequacy of working capital provisions Management judgement is required in determining the appropriate level of provision to be held in respect of non-recoverable trade receivables and inventories. At the year end, the Group held trade receivables of £424 million (net of £26 million provision) and inventories of £256 million (net of £22 million provision). Refer to notes 14 and 15 for details of these balances.
We evaluated management’s assumptions used in calculating the bad debt provision and checked the calculations supporting the amount of provision including testing the integrity of the ageing reports used as a basis to calculate the provisions. In order to assess the reasonableness of the provision, we reviewed the ageing of receivables in comparison to previous years, reviewed the level of bad debt write offs in the current year and the prior year and checked the recoverability of outstanding debtors through examination of subsequent cash receipts. We assessed the reasonableness of the recorded level of inventory provision with reference to ageing of inventories and the level of inventory written off during the year. We evaluated the appropriateness of the percentages applied and tested the integrity of the inventory ageing analysis. We compared the actual sales value of a sample of inventory items to their book value to ascertain that the carrying value of inventories does not exceed their net realisable value. We evaluated the adequacy of provision for damaged stock during our observation of annual and perpetual inventory counts.
Last year our report included one other risk which is not included in our report this year: SCA Packaging acquisition accounting. The risk of any further fair value adjustments arising since acquisition is no longer considered to be material to the Group financial statements.
The description of risks above should be read in conjunction with the significant issues considered by the Audit Committee discussed on page 58.
Our audit procedures relating to these matters were designed in the context of our audit of the financial statements as a whole, and not to express an opinion on individual accounts or disclosures. Our opinion on the financial statements is not modified with respect to any of the risks described above, and we do not express an opinion on these individual matters.
82 Financial Statements
Annual Report & Accounts 2015
82 Financial Statements
Independent Auditor’s Report to the members of DS Smith Plc continued
OUR APPLICATION OF MATERIALITY We define materiality as the magnitude of misstatement in the financial statements that makes it probable that the economic decisions of a reasonably knowledgeable person would be changed or influenced. We use materiality both in planning the scope of our audit work and in evaluating the results of our work.
We determined materiality for the Group to be £12 million (2013/14: £10 million), which is approximately 5% (2013/14: 5%) of profit before tax and exceptional items. We exclude the effect of exceptional items to provide a stable basis for materiality, as these items are expected to be volatile year on year. Refer to note 4 for details of exceptional items.
We agreed with the Audit Committee that we would report to the Committee all audit differences in excess of £240,000 (2013/14: £200,000), as well as differences below that threshold that, in our view, warranted reporting on qualitative grounds. We also report to the Audit Committee on disclosure matters that we identified when assessing the overall presentation of the financial statements.
Audits of all components are performed at a materiality level up to 50% of Group materiality.
AN OVERVIEW OF THE SCOPE OF OUR AUDIT Our Group audit was scoped by obtaining an understanding of the Group and its environment, including Group-wide controls and assessing the risks of material misstatement at the Group level.
Based on that assessment, we focused our Group audit scope primarily on the audit work at seven components located in the United Kingdom, France, Germany, Italy and Netherlands which was consistent with the prior year. The component auditors provided an audit clearance to the Senior statutory auditor for each component. These seven components represent the principal business units within the Group’s key reportable segments and accordingly provide an appropriate basis for undertaking audit work to address the risks of material misstatement identified above. The Group audit team takes an active part in the conduct of the audits at these seven components and follows a programme of planned site visits that is designed to ensure that the Senior statutory auditor or another senior member of the Group audit team visits each of the full scope components or attends close out meetings. This year, the Group audit team visited all of the full scope components or attended close out meetings. These components accounted for 51% of revenue and 52% of profit before tax and exceptional items.
For the remaining locations the component auditor provided reporting to the Senior statutory auditor on the significant risks and material balances. In line with our programme of rotational visits, senior members of our audit team visited four components located in Denmark, United States, Spain and Slovakia. These remaining locations accounted for 43% of revenue and 42% of profit before tax and exceptional items.
Where no visits were carried out, the Senior statutory auditor or another senior member of the Group audit team held discussions with the local audit partner in the current year.
At the parent entity level we also tested the consolidation process and carried out analytical procedures to confirm our conclusion that there were no significant risks of material misstatement of the aggregated financial information of the remaining components not subject to audit or audit of significant risks and material balances.
OPINION ON OTHER MATTERS PRESCRIBED BY THE COMPANIES ACT 2006 In our opinion:
the part of the Directors’ Remuneration Report to be audited has been properly prepared in accordance with the Companies Act 2006; and the information given in the Strategic Report and the Directors’ Report for the financial year for which the financial statements are prepared is consistent
with the financial statements.
MATTERS ON WHICH WE ARE REQUIRED TO REPORT BY EXCEPTION Adequacy of explanations received and accounting records Under the Companies Act 2006 we are required to report to you if, in our opinion:
we have not received all the information and explanations we require for our audit; or adequate accounting records have not been kept by the parent Company, or returns adequate for our audit have not been received from branches not
visited by us; or the parent Company financial statements are not in agreement with the accounting records and returns. We have nothing to report in respect of these matters.
Directors’ remuneration Under the Companies Act 2006 we are also required to report if in our opinion certain disclosures of directors’ remuneration have not been made or the part of the Directors’ Remuneration Report to be audited is not in agreement with the accounting records and returns. We have nothing to report arising from these matters.

Financial Statements 83
dssmith.com
82 Financial Statements
Independent Auditor’s Report to the members of DS Smith Plc continued
OUR APPLICATION OF MATERIALITY We define materiality as the magnitude of misstatement in the financial statements that makes it probable that the economic decisions of a reasonably knowledgeable person would be changed or influenced. We use materiality both in planning the scope of our audit work and in evaluating the results of our work.
We determined materiality for the Group to be £12 million (2013/14: £10 million), which is approximately 5% (2013/14: 5%) of profit before tax and exceptional items. We exclude the effect of exceptional items to provide a stable basis for materiality, as these items are expected to be volatile year on year. Refer to note 4 for details of exceptional items.
We agreed with the Audit Committee that we would report to the Committee all audit differences in excess of £240,000 (2013/14: £200,000), as well as differences below that threshold that, in our view, warranted reporting on qualitative grounds. We also report to the Audit Committee on disclosure matters that we identified when assessing the overall presentation of the financial statements.
Audits of all components are performed at a materiality level up to 50% of Group materiality.
AN OVERVIEW OF THE SCOPE OF OUR AUDIT Our Group audit was scoped by obtaining an understanding of the Group and its environment, including Group-wide controls and assessing the risks of material misstatement at the Group level.
Based on that assessment, we focused our Group audit scope primarily on the audit work at seven components located in the United Kingdom, France, Germany, Italy and Netherlands which was consistent with the prior year. The component auditors provided an audit clearance to the Senior statutory auditor for each component. These seven components represent the principal business units within the Group’s key reportable segments and accordingly provide an appropriate basis for undertaking audit work to address the risks of material misstatement identified above. The Group audit team takes an active part in the conduct of the audits at these seven components and follows a programme of planned site visits that is designed to ensure that the Senior statutory auditor or another senior member of the Group audit team visits each of the full scope components or attends close out meetings. This year, the Group audit team visited all of the full scope components or attended close out meetings. These components accounted for 51% of revenue and 52% of profit before tax and exceptional items.
For the remaining locations the component auditor provided reporting to the Senior statutory auditor on the significant risks and material balances. In line with our programme of rotational visits, senior members of our audit team visited four components located in Denmark, United States, Spain and Slovakia. These remaining locations accounted for 43% of revenue and 42% of profit before tax and exceptional items.
Where no visits were carried out, the Senior statutory auditor or another senior member of the Group audit team held discussions with the local audit partner in the current year.
At the parent entity level we also tested the consolidation process and carried out analytical procedures to confirm our conclusion that there were no significant risks of material misstatement of the aggregated financial information of the remaining components not subject to audit or audit of significant risks and material balances.
OPINION ON OTHER MATTERS PRESCRIBED BY THE COMPANIES ACT 2006 In our opinion:
the part of the Directors’ Remuneration Report to be audited has been properly prepared in accordance with the Companies Act 2006; and the information given in the Strategic Report and the Directors’ Report for the financial year for which the financial statements are prepared is consistent
with the financial statements.
MATTERS ON WHICH WE ARE REQUIRED TO REPORT BY EXCEPTION Adequacy of explanations received and accounting records Under the Companies Act 2006 we are required to report to you if, in our opinion:
we have not received all the information and explanations we require for our audit; or adequate accounting records have not been kept by the parent Company, or returns adequate for our audit have not been received from branches not
visited by us; or the parent Company financial statements are not in agreement with the accounting records and returns. We have nothing to report in respect of these matters.
Directors’ remuneration Under the Companies Act 2006 we are also required to report if in our opinion certain disclosures of directors’ remuneration have not been made or the part of the Directors’ Remuneration Report to be audited is not in agreement with the accounting records and returns. We have nothing to report arising from these matters.
Financial Statements 83
MATTERS ON WHICH WE ARE REQUIRED TO REPORT BY EXCEPTION CONTINUED Corporate Governance Statement Under the Listing Rules we are also required to review the part of the Corporate Governance Statement relating to the Company’s compliance with ten provisions of the UK Corporate Governance Code. We have nothing to report arising from our review.
Our duty to read other information in the Annual Report Under International Standards on Auditing (UK and Ireland), we are required to report to you if, in our opinion, information in the Annual Report is:
materially inconsistent with the information in the audited financial statements; or apparently materially incorrect based on, or materially inconsistent with, our knowledge of the Group acquired in the course of performing our audit; or otherwise misleading. In particular, we are required to consider whether we have identified any inconsistencies between our knowledge acquired during the audit and the Directors’ statement that they consider the Annual Report is fair, balanced and understandable and whether the Annual Report appropriately discloses those matters that we communicated to the Audit Committee which we consider should have been disclosed. We confirm that we have not identified any such inconsistencies or misleading statements.
RESPECTIVE RESPONSIBILITIES OF DIRECTORS AND AUDITOR As explained more fully in the Directors’ Responsibilities Statement, the Directors are responsible for the preparation of the financial statements and for being satisfied that they give a true and fair view. Our responsibility is to audit and express an opinion on the financial statements in accordance with applicable law and International Standards on Auditing (UK and Ireland). Those standards require us to comply with the Auditing Practices Board’s Ethical Standards for Auditors. We also comply with International Standard on Quality Control 1 (UK and Ireland). Our audit methodology and tools aim to ensure that our quality control procedures are effective, understood and applied. Our quality controls and systems include our dedicated professional standards review team and independent partner reviews.
This report is made solely to the Company’s members, as a body, in accordance with Chapter 3 of Part 16 of the Companies Act 2006. Our audit work has been undertaken so that we might state to the Company’s members those matters we are required to state to them in an auditor’s report and for no other purpose. To the fullest extent permitted by law, we do not accept or assume responsibility to anyone other than the Company and the Company’s members as a body, for our audit work, for this report, or for the opinions we have formed.
SCOPE OF THE AUDIT OF THE FINANCIAL STATEMENTS An audit involves obtaining evidence about the amounts and disclosures in the financial statements sufficient to give reasonable assurance that the financial statements are free from material misstatement, whether caused by fraud or error. This includes an assessment of: whether the accounting policies are appropriate to the Group and the parent Company’s circumstances and have been consistently applied and adequately disclosed; the reasonableness of significant accounting estimates made by the Directors; and the overall presentation of the financial statements. In addition, we read all the financial and non-financial information in the Annual Report to identify material inconsistencies with the audited financial statements and to identify any information that is apparently materially incorrect based on, or materially inconsistent with, the knowledge acquired by us in the course of performing the audit. If we become aware of any apparent material misstatements or inconsistencies we consider the implications for our report.
Ian Waller FCA (Senior statutory auditor) for and on behalf of Deloitte LLP Chartered Accountants and Statutory Auditor London, United Kingdom 24 June 2015

84 Financial Statements
Annual Report & Accounts 2015
84 Financial Statements
Consolidated Income Statement Year ended 30 April 2015
Continuing operations Note
Beforeexceptional
items 2015
£m
Exceptional items
(note 4) 2015
£m
After exceptional
items 2015
£m
Before exceptional
items 2014
£m
Exceptionalitems
(note 4) 2014
£m
After exceptional
items2014
£mRevenue 2 3,820 – 3,820 4,035 – 4,035Operating costs 3, 4 (3,485) (31) (3,516) (3,728) (35) (3,763)Operating profit before amortisation, acquisitions and disposals and SCA Packaging related costs 2 335 (31) 304 307 (35) 272Amortisation of intangible assets and acquisitions and disposals 4, 10 (46) (9) (55) (51) – (51)SCA Packaging related exceptional costs 4 – – – – (3) (3)
Operating profit 289 (40) 249 256 (38) 218Finance income 5 3 – 3 3 – 3Finance costs 4, 5 (35) (4) (39) (44) – (44)Employment benefit net finance expense 25 (6) – (6) (7) – (7)Net financing costs (38) (4) (42) (48) – (48)Profit after financing costs 251 (44) 207 208 (38) 170Share of profit/(loss) of equity accounted investments, net of tax 4, 12 – (7) (7) – (3) (3)Profit before income tax 251 (51) 200 208 (41) 167Income tax (expense)/credit 4, 7 (54) 10 (44) (45) 22 (23) Profit for the year from continuing operations 197 (41) 156 163 (19) 144Discontinued operations Loss for the year from discontinued operations 7 – – – (3) – (3)Profit for the year 197 (41) 156 160 (19) 141 Profit for the year attributable to: Owners of the parent 197 (41) 156 159 (19) 140Non-controlling interests – – – 1 – 1
Earnings per share Adjusted from continuing operations1 Basic 8 24.5p 21.4p Diluted 8 24.3p 21.1p From continuing operations Basic 8 16.6p 15.3pDiluted 8 16.4p 15.2pFrom continuing and discontinued operations Basic 16.6p 15.0pDiluted 16.4p 14.9p1 Adjusted for amortisation and exceptional items.

Financial Statements 85
dssmith.com
84 Financial Statements
Consolidated Income Statement Year ended 30 April 2015
Continuing operations Note
Beforeexceptional
items 2015
£m
Exceptional items
(note 4) 2015
£m
After exceptional
items 2015
£m
Before exceptional
items 2014
£m
Exceptionalitems
(note 4) 2014
£m
After exceptional
items2014
£mRevenue 2 3,820 – 3,820 4,035 – 4,035Operating costs 3, 4 (3,485) (31) (3,516) (3,728) (35) (3,763)Operating profit before amortisation, acquisitions and disposals and SCA Packaging related costs 2 335 (31) 304 307 (35) 272Amortisation of intangible assets and acquisitions and disposals 4, 10 (46) (9) (55) (51) – (51)SCA Packaging related exceptional costs 4 – – – – (3) (3)
Operating profit 289 (40) 249 256 (38) 218Finance income 5 3 – 3 3 – 3Finance costs 4, 5 (35) (4) (39) (44) – (44)Employment benefit net finance expense 25 (6) – (6) (7) – (7)Net financing costs (38) (4) (42) (48) – (48)Profit after financing costs 251 (44) 207 208 (38) 170Share of profit/(loss) of equity accounted investments, net of tax 4, 12 – (7) (7) – (3) (3)Profit before income tax 251 (51) 200 208 (41) 167Income tax (expense)/credit 4, 7 (54) 10 (44) (45) 22 (23) Profit for the year from continuing operations 197 (41) 156 163 (19) 144Discontinued operations Loss for the year from discontinued operations 7 – – – (3) – (3)Profit for the year 197 (41) 156 160 (19) 141 Profit for the year attributable to: Owners of the parent 197 (41) 156 159 (19) 140Non-controlling interests – – – 1 – 1
Earnings per share Adjusted from continuing operations1 Basic 8 24.5p 21.4p Diluted 8 24.3p 21.1p From continuing operations Basic 8 16.6p 15.3pDiluted 8 16.4p 15.2pFrom continuing and discontinued operations Basic 16.6p 15.0pDiluted 16.4p 14.9p1 Adjusted for amortisation and exceptional items.
Financial Statements 85
Consolidated Statement of Comprehensive Income Year ended 30 April 2015
Note2015
£m2014
£m Profit for the year 156 141Items which will not be reclassified subsequently to profit or loss
Actuarial (losses)/gains on employee benefits 25 (65) 57Income tax on items which will not be reclassified subsequently to profit or loss 7 10 (18)
Items which may be reclassified subsequently to profit or lossForeign currency translation differences (105) (55)Movements in cash flow hedges 5 (16)Income tax on items which may be reclassified subsequently to profit or loss 7 (22) (4)
Other comprehensive expense for the year, net of tax (177) (36) Total comprehensive (expense)/income for the year (21) 105 Total comprehensive (expense)/income attributable to: Owners of the parent (21) 104 Non-controlling interests – 1

86 Financial Statements
Annual Report & Accounts 2015
86 Financial Statements
Consolidated Statement of Financial Position At 30 April 2015
Note 2015
£m2014
£mAssets Non-current assets Intangible assets 10 855 961Property, plant and equipment 11 1,342 1,372Equity accounted investments 12 17 24Other investments 13 3 8Deferred tax assets 22 58 84Other receivables 15 5 3Derivative financial instruments 21 24 4Total non-current assets 2,304 2,456Current assets Inventories 14 256 272Other investments 13 1 1Income tax receivable 38 11Trade and other receivables 15 548 650Cash and cash equivalents 19 95 98Derivative financial instruments 21 13 2Assets held for sale 17 46 45Total current assets 997 1,079Total assets 3,301 3,535Liabilities Non-current liabilities Interest-bearing loans and borrowings 20 (781) (786)Employee benefits 25 (200) (151)Other payables 16 (5) (4)Provisions 23 (7) (23)Deferred tax liabilities 22 (121) (163)Derivative financial instruments 21 (13) (40)Total non-current liabilities (1,127) (1,167)Current liabilities Bank overdrafts 19 (13) (34)Interest-bearing loans and borrowings 20 (2) (96)Trade and other payables 16 (927) (930)Income tax liabilities (147) (90)Provisions 23 (34) (49)Derivative financial instruments 21 (18) (20)Liabilities held for sale 17 (15) (18)Total current liabilities (1,156) (1,237)Total liabilities (2,283) (2,404)Net assets 1,018 1,131Equity Issued capital 24 94 94Share premium 715 715Reserves 210 323Total equity attributable to owners of the parent 1,019 1,132Non-controlling interests (1) (1)Total equity 1,018 1,131
Approved by the Board of Directors of DS Smith Plc on 24 June 2015 and signed on its behalf by
M W Roberts A R T Marsh Director Director
The accompanying notes are an integral part of these consolidated financial statements.
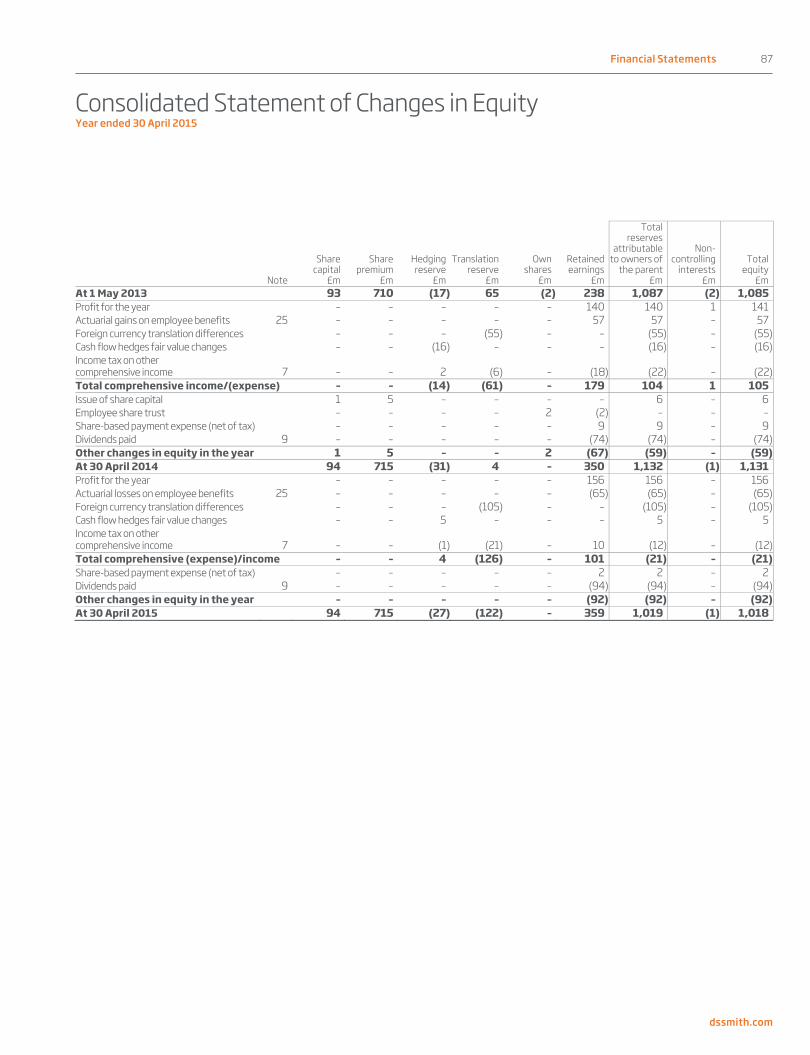
Financial Statements 87
dssmith.com
86 Financial Statements
Consolidated Statement of Financial Position At 30 April 2015
Note 2015
£m2014
£mAssets Non-current assets Intangible assets 10 855 961Property, plant and equipment 11 1,342 1,372Equity accounted investments 12 17 24Other investments 13 3 8Deferred tax assets 22 58 84Other receivables 15 5 3Derivative financial instruments 21 24 4Total non-current assets 2,304 2,456Current assets Inventories 14 256 272Other investments 13 1 1Income tax receivable 38 11Trade and other receivables 15 548 650Cash and cash equivalents 19 95 98Derivative financial instruments 21 13 2Assets held for sale 17 46 45Total current assets 997 1,079Total assets 3,301 3,535Liabilities Non-current liabilities Interest-bearing loans and borrowings 20 (781) (786)Employee benefits 25 (200) (151)Other payables 16 (5) (4)Provisions 23 (7) (23)Deferred tax liabilities 22 (121) (163)Derivative financial instruments 21 (13) (40)Total non-current liabilities (1,127) (1,167)Current liabilities Bank overdrafts 19 (13) (34)Interest-bearing loans and borrowings 20 (2) (96)Trade and other payables 16 (927) (930)Income tax liabilities (147) (90)Provisions 23 (34) (49)Derivative financial instruments 21 (18) (20)Liabilities held for sale 17 (15) (18)Total current liabilities (1,156) (1,237)Total liabilities (2,283) (2,404)Net assets 1,018 1,131Equity Issued capital 24 94 94Share premium 715 715Reserves 210 323Total equity attributable to owners of the parent 1,019 1,132Non-controlling interests (1) (1)Total equity 1,018 1,131
Approved by the Board of Directors of DS Smith Plc on 24 June 2015 and signed on its behalf by
M W Roberts A R T Marsh Director Director
The accompanying notes are an integral part of these consolidated financial statements.
Financial Statements 87
Consolidated Statement of Changes in Equity Year ended 30 April 2015
Note
Sharecapital
£m
Sharepremium
£m
Hedgingreserve
£m
Translationreserve
£m
Ownshares
£m
Retained earnings
£m
Total reserves
attributableto owners of
the parent£m
Non-controlling
interests£m
Total equity
£mAt 1 May 2013 93 710 (17) 65 (2) 238 1,087 (2) 1,085Profit for the year – – – – – 140 140 1 141Actuarial gains on employee benefits 25 – – – – – 57 57 – 57Foreign currency translation differences – – – (55) – – (55) – (55)Cash flow hedges fair value changes – – (16) – – – (16) – (16)Income tax on other comprehensive income 7 – – 2 (6) – (18) (22) – (22)Total comprehensive income/(expense) – – (14) (61) – 179 104 1 105Issue of share capital 1 5 – – – – 6 – 6Employee share trust – – – – 2 (2) – – –Share-based payment expense (net of tax) – – – – – 9 9 – 9Dividends paid 9 – – – – – (74) (74) – (74)Other changes in equity in the year 1 5 – – 2 (67) (59) – (59)At 30 April 2014 94 715 (31) 4 – 350 1,132 (1) 1,131Profit for the year – – – – – 156 156 – 156Actuarial losses on employee benefits 25 – – – – – (65) (65) – (65)Foreign currency translation differences – – – (105) – – (105) – (105)Cash flow hedges fair value changes – – 5 – – – 5 – 5Income tax on other comprehensive income 7 – – (1) (21) – 10 (12) – (12)Total comprehensive (expense)/income – – 4 (126) – 101 (21) – (21)Share-based payment expense (net of tax) – – – – – 2 2 – 2Dividends paid 9 – – – – – (94) (94) – (94)Other changes in equity in the year – – – – – (92) (92) – (92)At 30 April 2015 94 715 (27) (122) – 359 1,019 (1) 1,018

88 Financial Statements
Annual Report & Accounts 2015
88 Financial Statements
Consolidated Statement of Cash Flows Year ended 30 April 2015
Continuing operations Note 2015
£m2014
£mOperating activities Cash generated from operations 27 463 309Interest received 3 3Interest paid (37) (46)Tax paid (28) (55)Cash flows from operating activities 401 211Investing activities Acquisition of subsidiary businesses, net of cash and cash equivalents 31 (28) (27)Divestment of subsidiary and equity accounted businesses, net of cash and cash equivalents 31 18 12Capital expenditure (167) (174)Proceeds from sale of property, plant and equipment and intangible assets 18 18Decrease in restricted cash 3 16Loan to associate (2) –Cash flows used in investing activities (158) (155)Financing activities Proceeds from issue of share capital – 6Decrease in borrowings (352) –Increase in borrowings 233 8Repayment of finance lease obligations – (2)Dividends paid to Group shareholders 9 (94) (74)Cash flows used in financing activities (213) (62)Increase/(decrease) in cash and cash equivalents from continuing operations 30 (6)Discontinued operations Cash used in discontinued operations – (4)Increase/(decrease) in cash and cash equivalents 30 (10)Net cash and cash equivalents at 1 May 64 78Reclassification to held for sale (6) –Exchange losses on cash and cash equivalents (6) (4)Net cash and cash equivalents at 30 April 19 82 64

Financial Statements 89
dssmith.com
88 Financial Statements
Consolidated Statement of Cash Flows Year ended 30 April 2015
Continuing operations Note 2015
£m2014
£mOperating activities Cash generated from operations 27 463 309Interest received 3 3Interest paid (37) (46)Tax paid (28) (55)Cash flows from operating activities 401 211Investing activities Acquisition of subsidiary businesses, net of cash and cash equivalents 31 (28) (27)Divestment of subsidiary and equity accounted businesses, net of cash and cash equivalents 31 18 12Capital expenditure (167) (174)Proceeds from sale of property, plant and equipment and intangible assets 18 18Decrease in restricted cash 3 16Loan to associate (2) –Cash flows used in investing activities (158) (155)Financing activities Proceeds from issue of share capital – 6Decrease in borrowings (352) –Increase in borrowings 233 8Repayment of finance lease obligations – (2)Dividends paid to Group shareholders 9 (94) (74)Cash flows used in financing activities (213) (62)Increase/(decrease) in cash and cash equivalents from continuing operations 30 (6)Discontinued operations Cash used in discontinued operations – (4)Increase/(decrease) in cash and cash equivalents 30 (10)Net cash and cash equivalents at 1 May 64 78Reclassification to held for sale (6) –Exchange losses on cash and cash equivalents (6) (4)Net cash and cash equivalents at 30 April 19 82 64
Financial Statements 89
Notes to the Consolidated Financial Statements
1. SIGNIFICANT ACCOUNTING POLICIES (a) Basis of preparation These financial statements are consolidated financial statements for the Group consisting of DS Smith Plc, a company registered in the UK, and all its subsidiaries. The consolidated financial statements have been prepared and approved by the Directors in accordance with International Financial Reporting Standards as adopted by the EU (‘adopted IFRSs’), and with those parts of the Companies Act 2006 applicable to companies reporting under IFRS. The consolidated financial statements are also in compliance with IFRSs as issued by the International Accounting Standards Board (IASB). The Company has elected to prepare its parent Company financial statements in accordance with UK Generally Accepted Accounting Practice (UK GAAP); these are presented on pages 130 to 134.
The consolidated financial statements are prepared on the historical cost basis with the exception of assets and liabilities of certain financial instruments, employee benefit plans and share-based payments that are stated at their fair value.
The consolidated financial statements have been prepared on a going concern basis as set out on page 56 of the Directors’ Governance Report. The Directors consider that adequate resources exist for the Company to continue in operational existence for the foreseeable future.
The preparation of consolidated financial statements requires management to make judgements, estimates and assumptions that affect whether and how policies are applied and the reported amounts of assets and liabilities, income and expenses. Judgements made by management in the application of adopted IFRSs that have a significant effect on the financial statements and estimates with a significant risk of material adjustment are discussed in accounting policy (x).
No changes have been made to the Group’s accounting policies in the year ended 30 April 2015.
The accounting policies set out below have been applied consistently in all periods presented in these consolidated financial statements. The accounting policies have been applied consistently by all Group entities.
(b) Basis of consolidation (i) Subsidiaries The financial statements of subsidiaries are included in the consolidated financial statements from the date that control commences until the date that control ceases. Control is achieved where the Company has the power to govern the financial and operating policies of an investee entity so as to obtain benefits from its activities. The results of subsidiaries acquired or disposed of during the year are included in the consolidated income statement from the effective date of acquisition or up to the effective date of disposal, as appropriate. Intra-group balances and any unrealised gains and losses or income and expenses arising from intra-group transactions are eliminated in preparing the consolidated financial statements. A list of key subsidiaries is included note 34.
(ii) Interests in equity accounted investments The Group’s interests in equity accounted investments comprise of interests in associates and joint ventures. An associate is an entity over which the Group has significant influence, but not control or joint control, over the financial and operating policy decisions of the investment. A joint venture
is an entity in which the Group has joint control, whereby the Group has rights to the net assets of the entity, rather than rights to its assets and obligations for its liabilities.
Interests in associates and the joint venture are accounted for using the equity method. They are recognised initially at cost, which includes transaction costs. Subsequent to initial recognition the consolidated financial statements include the Group’s share of the profit or loss and other comprehensive income of equity accounted investments, until the date on which significant influence or joint control ceases.
(iii) Non-controlling interests Non-controlling interests are shown as a component of equity in the Consolidated Statement of Financial Position net of the value of options over interests held by non-controlling interests in the Group’s subsidiaries.
(iv) Business Combinations The acquisition method is used to account for the acquisition of subsidiaries. Identifiable net assets acquired (including intangibles) in a business combination are measured initially at their fair values at the acquisition date.
Where the measurement of the fair value of identifiable net assets acquired is incomplete at the end of the reporting period in which the combination occurs, the Group will report provisional fair values. Final fair values are determined within a year of the acquisition date and retrospectively applied.
The excess of the consideration transferred and the amount of any non-controlling interest over the fair value of the identifiable assets (including intangibles), liabilities and contingent liabilities acquired is recorded as goodwill.
The consideration transferred is measured as the fair value of the assets given, equity instruments issued (if any), and liabilities assumed or incurred at the date of acquisition.
Acquisition related costs are expensed as incurred.
The results of the subsidiaries acquired are included in the consolidated financial statements from the acquisition date.
(c) Revenue Revenue comprises the fair value of the sale of goods and services, net of value added tax and other sales taxes, rebates and discounts and after eliminating sales within the Group.
Revenue from the sale of goods is recognised when:
the Group has transferred the significant risks and rewards of ownership to the buyer;
all significant performance obligations have been met; the Group retains neither continuing managerial involvement
nor effective control over the goods sold; it is probable that the economic benefits associated with the
transaction will flow to the Group; and the amount of revenue can be measured reliably.
This is typically when either the goods are loaded onto the collection vehicle if the buyer is collecting them, or when the goods are unloaded at the delivery address if the Group is responsible for delivery.
90 Financial Statements
Annual Report & Accounts 2015
90 Financial Statements
Notes to the Consolidated Financial Statements continued
1. SIGNIFICANT ACCOUNTING POLICIES CONTINUED (d) Supplier rebates The Group receives income from its suppliers, mainly in the form of volume based rebates and early settlement discounts. They are recognised as a reduction in operating costs in the year to which they relate. At the period end the Group is sometimes required to estimate supplier income due from annual agreements for volume rebates.
Included in the Consolidated Statement of Financial Position are amounts receivable of £5m in respect of supplier rebates.
(e) Government grants (i) Emission quotas The Group participates in Phase II of the EU Emissions Trading Scheme. Emission quotas received in a period are initially recognised at a nominal value of nil. As a result, no asset or liability is initially recognised in the statement of financial position. A provision is recognised if there is any anticipated shortfall in the level of quotas received or purchased when compared with actual emissions in any given period, measured at the market price of such quotas at the reporting date. Excess emission quotas acquired as part of a business combination are recognised as intangible assets at their fair value on the date of acquisition.
(ii) Other Other government grants are recognised in the statement of financial position initially as deferred income when there is reasonable assurance that they will be received and that the Group will comply with the conditions attached to them. Grants that compensate the Group for expenses incurred are offset against the expenses in the same periods in which the expenses are incurred. Grants relating to assets are released to the income statement over the expected useful life of the asset to which it relates on a basis consistent with the depreciation policy. Depreciation is provided on the full cost of the assets before deducting grants.
(f) Dividends Dividends attributable to the equity holders of the Company paid during the year are recognised directly in equity.
(g) Foreign currency translation The consolidated financial statements are presented in sterling, which is the Group’s presentational currency. Transactions in foreign currencies are translated into the respective functional currencies of Group companies at the foreign exchange rates ruling at the dates of the transactions. Monetary assets and liabilities denominated in foreign currencies at the reporting date are translated into the functional currency at the foreign exchange rates ruling at that date. Foreign exchange differences arising on translation of monetary assets and liabilities are recognised in the Consolidated Income Statement. Non-monetary assets and liabilities that are measured at historical cost in a foreign currency are translated using the exchange rates at the dates of the transactions.
The assets and liabilities of all the Group entities that have a functional currency other than sterling are translated at the closing exchange rate at the reporting date. Income and expenses for each income statement are translated at average exchange rates (unless this average is not a reasonable approximation of the cumulative effect of the rates prevailing on the transaction dates, in which case income and expenses are translated at the date of the transactions).
On consolidation, exchange differences arising from the translation of the net investment in foreign entities, borrowings, and other financial instruments designated as hedges of such investments, are recognised in the translation reserve. On the disposal of foreign currency entities, the cumulative exchange difference recorded in the translation reserve is taken to the Consolidated Income Statement as part of the gain or loss on disposal.
(h) Intangible assets (i) Goodwill The recognition of business combinations requires the excess of the purchase price of acquisitions over the net book value of identifiable assets acquired to be allocated to the assets and liabilities of the acquired entity. The Group makes judgements and estimates in relation to the fair value allocation of the purchase price.
Goodwill is stated at cost less accumulated impairment losses. The useful life of goodwill is considered to be indefinite. Goodwill is allocated to the cash generating units (CGUs), or groups of CGUs, that are expected to benefit from the synergies of the combination and is tested annually for impairment; or more frequently if impairment is indicated.
On disposal of a subsidiary or a jointly controlled entity, the attributable amount of goodwill is included in the determination of the profit or loss recognised in the Consolidated Income Statement.
(ii) Intellectual property Intellectual property is stated at cost less accumulated amortisation and impairment losses.
(iii) Computer software Computer software that is integral to a related item of hardware is included within property, plant and equipment. All other computer software is treated as an intangible asset.
(iv) Customer related Customer relationships, acquired as part of a business combination, are capitalised separately from goodwill and are carried at cost less accumulated amortisation and impairment.
(v) Other intangible assets Other intangible assets that are acquired by the Group are stated at cost less accumulated amortisation and impairment losses.
Financial Statements 91
dssmith.com
90 Financial Statements
Notes to the Consolidated Financial Statements continued
1. SIGNIFICANT ACCOUNTING POLICIES CONTINUED (d) Supplier rebates The Group receives income from its suppliers, mainly in the form of volume based rebates and early settlement discounts. They are recognised as a reduction in operating costs in the year to which they relate. At the period end the Group is sometimes required to estimate supplier income due from annual agreements for volume rebates.
Included in the Consolidated Statement of Financial Position are amounts receivable of £5m in respect of supplier rebates.
(e) Government grants (i) Emission quotas The Group participates in Phase II of the EU Emissions Trading Scheme. Emission quotas received in a period are initially recognised at a nominal value of nil. As a result, no asset or liability is initially recognised in the statement of financial position. A provision is recognised if there is any anticipated shortfall in the level of quotas received or purchased when compared with actual emissions in any given period, measured at the market price of such quotas at the reporting date. Excess emission quotas acquired as part of a business combination are recognised as intangible assets at their fair value on the date of acquisition.
(ii) Other Other government grants are recognised in the statement of financial position initially as deferred income when there is reasonable assurance that they will be received and that the Group will comply with the conditions attached to them. Grants that compensate the Group for expenses incurred are offset against the expenses in the same periods in which the expenses are incurred. Grants relating to assets are released to the income statement over the expected useful life of the asset to which it relates on a basis consistent with the depreciation policy. Depreciation is provided on the full cost of the assets before deducting grants.
(f) Dividends Dividends attributable to the equity holders of the Company paid during the year are recognised directly in equity.
(g) Foreign currency translation The consolidated financial statements are presented in sterling, which is the Group’s presentational currency. Transactions in foreign currencies are translated into the respective functional currencies of Group companies at the foreign exchange rates ruling at the dates of the transactions. Monetary assets and liabilities denominated in foreign currencies at the reporting date are translated into the functional currency at the foreign exchange rates ruling at that date. Foreign exchange differences arising on translation of monetary assets and liabilities are recognised in the Consolidated Income Statement. Non-monetary assets and liabilities that are measured at historical cost in a foreign currency are translated using the exchange rates at the dates of the transactions.
The assets and liabilities of all the Group entities that have a functional currency other than sterling are translated at the closing exchange rate at the reporting date. Income and expenses for each income statement are translated at average exchange rates (unless this average is not a reasonable approximation of the cumulative effect of the rates prevailing on the transaction dates, in which case income and expenses are translated at the date of the transactions).
On consolidation, exchange differences arising from the translation of the net investment in foreign entities, borrowings, and other financial instruments designated as hedges of such investments, are recognised in the translation reserve. On the disposal of foreign currency entities, the cumulative exchange difference recorded in the translation reserve is taken to the Consolidated Income Statement as part of the gain or loss on disposal.
(h) Intangible assets (i) Goodwill The recognition of business combinations requires the excess of the purchase price of acquisitions over the net book value of identifiable assets acquired to be allocated to the assets and liabilities of the acquired entity. The Group makes judgements and estimates in relation to the fair value allocation of the purchase price.
Goodwill is stated at cost less accumulated impairment losses. The useful life of goodwill is considered to be indefinite. Goodwill is allocated to the cash generating units (CGUs), or groups of CGUs, that are expected to benefit from the synergies of the combination and is tested annually for impairment; or more frequently if impairment is indicated.
On disposal of a subsidiary or a jointly controlled entity, the attributable amount of goodwill is included in the determination of the profit or loss recognised in the Consolidated Income Statement.
(ii) Intellectual property Intellectual property is stated at cost less accumulated amortisation and impairment losses.
(iii) Computer software Computer software that is integral to a related item of hardware is included within property, plant and equipment. All other computer software is treated as an intangible asset.
(iv) Customer related Customer relationships, acquired as part of a business combination, are capitalised separately from goodwill and are carried at cost less accumulated amortisation and impairment.
(v) Other intangible assets Other intangible assets that are acquired by the Group are stated at cost less accumulated amortisation and impairment losses.
Financial Statements 91
1. SIGNIFICANT ACCOUNTING POLICIES CONTINUED (h) Intangible assets continued (vi) Amortisation Amortisation of intangible assets (excluding goodwill) is charged to the income statement on a straight-line basis over the estimated useful lives of intangible assets unless such lives are indefinite. Intangible assets (other than goodwill) are amortised from the date they are available for use.
The estimated useful lives are as follows:
Intellectual property Up to 20 yearsComputer software 3-5 yearsCustomer relationships 5-15 years
(i) Property, plant and equipment and other investments Items of property, plant and equipment are stated at cost less accumulated depreciation and impairment losses.
Depreciation is charged to the income statement on a straight-line basis over the estimated useful lives of each item of property, plant and equipment, and major components that are accounted for separately (or in the case of leased assets, the lease period, if shorter). Land is not depreciated.
The estimated useful lives are as follows:
Freehold and long leasehold properties 10-50 yearsPlant and equipment, fixtures and fittings (including IT hardware)
2-25 years
Motor vehicles 3-5 years
During the year, the estimated useful lives were reviewed and aligned, and the fair value exercise on the acquisition of SCA Packaging finalised. As a result, depreciation in the year was reduced by £7 million.
Other investments consist of available for sale investments in unquoted equity and debt securities which are carried at cost, less any impairment, and restricted cash.
Gains or losses arising on the sale of surplus property assets are recorded through operating profit before exceptional items. For further information on current year gains or losses, see note 27.
(j) Impairment The carrying amounts of the Group’s assets, including tangible and intangible non-current assets, are reviewed at each reporting date to determine whether there are any indicators of impairment. If any such indicators exist, the asset’s recoverable amount is estimated. Goodwill is tested for impairment annually at the same time, regardless of the presence of an impairment indicator. An impairment loss is recognised whenever the carrying amount of an asset, collection of assets or its CGU exceeds its recoverable amount. Impairment losses are recognised in the income statement.
(i) Cash generating units For the purposes of impairment testing, each segment, split by process, is a separate CGU. Impairment testing of property, plant and equipment and other intangibles is carried out at an individual CGU level. Goodwill impairment testing is carried out based on regional groupings of CGUs as illustrated in note 10, as this is the lowest level at which goodwill is monitored for internal management purposes.
(ii) Calculation of recoverable amount The recoverable amount of the Group’s assets is calculated as the value-in-use of the CGU to which the assets are attributed or the net selling price, if greater. Value-in-use is calculated by discounting the cash flows expected to be generated by the CGU/group of CGUs being tested for evidence of impairment. This is done using a pre-tax discount rate that reflects the current assessment of the time value of money, and the country specific risks for which the cash flows have not been adjusted. For an asset that does not generate largely independent cash inflows, the recoverable amount is determined for the CGU to which the asset belongs.
(iii) Reversals of impairment Impairment losses in respect of goodwill are not reversed. In respect of other assets, an impairment loss is reversed if there has been a change in the estimates used to determine the recoverable amount. An impairment loss is reversed only to the extent that the asset’s carrying amount does not exceed the carrying amount that would have been determined, net of depreciation or amortisation, if no impairment loss had been recognised.
(k) Derivative financial instruments The Group uses derivative financial instruments, primarily interest rate, currency and commodity swaps, to manage interest rate, currency and commodity risks associated with the Group’s underlying business activities and the financing of these activities. The Group has a policy not to, and does not, undertake any speculative activity in these instruments.
Such derivative financial instruments are initially recognised at fair value on the date on which a derivative contract is entered into and are subsequently remeasured at fair value. Derivatives are carried as assets when the fair value is positive and as liabilities when the fair value is negative.
Derivative financial instruments are accounted for as hedges when designated as hedges at the inception of the contract and when the financial instruments provide an effective hedge of the underlying risk.
For the purpose of hedge accounting, hedges are classified as:
fair value hedges when hedging the exposure to changes in the fair value of a recognised asset or liability;
cash flow hedges when hedging exposure to variability in cash flows that is attributable to a particular risk associated with either a statement of financial position item or a highly probable forecast transaction; or
hedges of the net investment in a foreign entity. The treatment of gains and losses arising from revaluing derivatives designated as hedging instruments depends on the nature of the hedging relationship as follows:
Fair value hedges: the carrying amount of the hedged item is adjusted for gains or losses attributable to the risk being hedged and the derivative is remeasured at fair value. Gains and losses from both the hedged item and the fair value of derivatives are taken to the income statement. The Group discontinues fair value hedge accounting if the hedging instrument expires or is sold, terminated or exercised, the hedge no longer meets the criteria for hedge accounting or the Group revokes the designation.

92 Financial Statements
Annual Report & Accounts 2015
92 Financial Statements
Notes to the Consolidated Financial Statements continued
1. SIGNIFICANT ACCOUNTING POLICIES CONTINUED (k) Derivative financial instruments continued Cash flow hedges: the effective portion of the gain or loss on the hedging instrument is recognised directly in equity, while the ineffective portion is recognised in the income statement. Amounts taken to equity are transferred to the income statement in the same period during which the hedged transaction affects profit or loss, such as when a forecast sale or purchase occurs. Where the hedged item is the cost of a non-financial asset or liability, the amounts taken to equity are transferred to the initial carrying amount of the non-financial asset or liability.
If the hedging instrument expires or is sold, terminated or exercised without replacement or roll-over, the hedged transaction ceases to be highly probable, or if its designation as a hedge is revoked, amounts previously recognised in equity remain in equity until the forecast transaction occurs and are transferred to the income statement or to the initial carrying amount of a non-financial asset or liability as above. If a forecast transaction is no longer expected to occur, amounts previously recognised in equity are transferred to the income statement.
Hedges of net investment in a foreign entity: the effective portion of the gain or loss on the hedging instrument is recognised directly in equity, while the ineffective portion is recognised in the income statement. Amounts taken to equity are transferred to the income statement when the foreign entity is sold.
Any gains or losses arising from changes in the fair value of all other derivatives are taken to the income statement. These may arise from derivatives for which hedge accounting is not applied because they are not effective as hedging instruments.
The net present value of the expected future payments under options over interests held by non-controlling interests in the Group’s subsidiaries are shown as a financial liability. At the end of each period, the valuation of the liability is reassessed with any changes recognised in profit or loss for the period.
(l) Treasury shares When share capital recognised as equity is repurchased, the amount of the consideration paid, including directly attributable costs, is recognised as a change in equity. Repurchased shares are classified as treasury shares and are presented as a deduction from total equity.
(m) Trade and other receivables Trade and other receivables are stated at their cost less impairment provisions.
(n) Inventories Inventories are stated at the lower of cost and net realisable value. Net realisable value is the estimated selling price in the ordinary course of business, less the estimated costs of completion and selling expenses. The cost of inventories is based on the first-in first-out principle and includes expenditure incurred in acquiring the inventories and bringing them to their existing location and condition. In the case of manufactured inventories and work in progress, cost includes an appropriate share of overheads based on normal operating capacity.
(o) Cash and cash equivalents and restricted cash Cash and cash equivalents comprise cash balances and call deposits. Bank overdrafts that are repayable on demand and form an integral part of the Group’s cash management are included as a component of cash and cash
equivalents for the purpose of the statement of cash flows. Cash and cash equivalents are stated at amortised cost.
Cash subject to contractual restrictions on use by the Group is excluded from cash and cash equivalents in the consolidated financial statements and presented within other investments in the Consolidated Statement of Financial Position. Restricted cash is stated at amortised cost.
(p) Borrowings Borrowings are recognised initially at fair value, less attributable transaction costs. Subsequent to initial recognition, interest-bearing borrowings are stated at amortised cost unless designated in a fair value hedge relationship, with borrowing costs being accounted for on an accruals basis in the income statement using the effective interest method.
At the reporting date, accrued interest is recorded separately from the associated borrowings within current liabilities.
(q) Employee benefits (i) Defined contribution schemes Contributions to defined contribution pension schemes are recognised as an employee benefit expense within personnel expenses in the income statement, as incurred.
(ii) Defined benefit schemes The Group’s net obligation in respect of defined benefit pension schemes is calculated separately for each scheme by estimating the amount of future benefit that employees have earned in return for their service in the current and prior periods; that benefit is discounted to its present value amount and recognised in the income statement as personnel expense; a corresponding liability for all future benefits is established on the statement of financial position and the fair value of any schemes’ assets is deducted.
The discount rate is the yield at the reporting date on AA credit rated bonds that have maturity dates approximating to the duration of the schemes’ obligations. The calculation is performed by a qualified actuary using the projected unit method. Actuarial gains and losses are recognised immediately in the statement of comprehensive income.
(iii) Share-based payment transactions The Group operates equity-settled share-based compensation plans. The fair value of the employee services received in exchange for the grant of the options is recognised as personnel expense, with a corresponding increase in equity, over the period that the employees unconditionally become entitled to the awards. The fair value of the options granted is measured using a stochastic model, taking into account the terms and conditions upon which the options were granted. The total amount to be expensed over the vesting period is determined by reference to the fair value of the options granted, excluding the impact of any non-market vesting conditions.
At each reporting date, the entity revises its estimates of the number of options that are expected to become exercisable. It recognises the impact of the revision of original estimates, if any, in the income statement, and a corresponding adjustment to equity.
(r) Provisions A provision is recognised in the statement of financial position when the Group has a present legal or constructive obligation as a result of a past event, a reliable estimate can be made of the amount of the obligation and it is probable that an outflow of economic benefits will be required to settle the obligation. Provisions are discounted to present value where the effect is material.
Financial Statements 93
dssmith.com
92 Financial Statements
Notes to the Consolidated Financial Statements continued
1. SIGNIFICANT ACCOUNTING POLICIES CONTINUED (k) Derivative financial instruments continued Cash flow hedges: the effective portion of the gain or loss on the hedging instrument is recognised directly in equity, while the ineffective portion is recognised in the income statement. Amounts taken to equity are transferred to the income statement in the same period during which the hedged transaction affects profit or loss, such as when a forecast sale or purchase occurs. Where the hedged item is the cost of a non-financial asset or liability, the amounts taken to equity are transferred to the initial carrying amount of the non-financial asset or liability.
If the hedging instrument expires or is sold, terminated or exercised without replacement or roll-over, the hedged transaction ceases to be highly probable, or if its designation as a hedge is revoked, amounts previously recognised in equity remain in equity until the forecast transaction occurs and are transferred to the income statement or to the initial carrying amount of a non-financial asset or liability as above. If a forecast transaction is no longer expected to occur, amounts previously recognised in equity are transferred to the income statement.
Hedges of net investment in a foreign entity: the effective portion of the gain or loss on the hedging instrument is recognised directly in equity, while the ineffective portion is recognised in the income statement. Amounts taken to equity are transferred to the income statement when the foreign entity is sold.
Any gains or losses arising from changes in the fair value of all other derivatives are taken to the income statement. These may arise from derivatives for which hedge accounting is not applied because they are not effective as hedging instruments.
The net present value of the expected future payments under options over interests held by non-controlling interests in the Group’s subsidiaries are shown as a financial liability. At the end of each period, the valuation of the liability is reassessed with any changes recognised in profit or loss for the period.
(l) Treasury shares When share capital recognised as equity is repurchased, the amount of the consideration paid, including directly attributable costs, is recognised as a change in equity. Repurchased shares are classified as treasury shares and are presented as a deduction from total equity.
(m) Trade and other receivables Trade and other receivables are stated at their cost less impairment provisions.
(n) Inventories Inventories are stated at the lower of cost and net realisable value. Net realisable value is the estimated selling price in the ordinary course of business, less the estimated costs of completion and selling expenses. The cost of inventories is based on the first-in first-out principle and includes expenditure incurred in acquiring the inventories and bringing them to their existing location and condition. In the case of manufactured inventories and work in progress, cost includes an appropriate share of overheads based on normal operating capacity.
(o) Cash and cash equivalents and restricted cash Cash and cash equivalents comprise cash balances and call deposits. Bank overdrafts that are repayable on demand and form an integral part of the Group’s cash management are included as a component of cash and cash
equivalents for the purpose of the statement of cash flows. Cash and cash equivalents are stated at amortised cost.
Cash subject to contractual restrictions on use by the Group is excluded from cash and cash equivalents in the consolidated financial statements and presented within other investments in the Consolidated Statement of Financial Position. Restricted cash is stated at amortised cost.
(p) Borrowings Borrowings are recognised initially at fair value, less attributable transaction costs. Subsequent to initial recognition, interest-bearing borrowings are stated at amortised cost unless designated in a fair value hedge relationship, with borrowing costs being accounted for on an accruals basis in the income statement using the effective interest method.
At the reporting date, accrued interest is recorded separately from the associated borrowings within current liabilities.
(q) Employee benefits (i) Defined contribution schemes Contributions to defined contribution pension schemes are recognised as an employee benefit expense within personnel expenses in the income statement, as incurred.
(ii) Defined benefit schemes The Group’s net obligation in respect of defined benefit pension schemes is calculated separately for each scheme by estimating the amount of future benefit that employees have earned in return for their service in the current and prior periods; that benefit is discounted to its present value amount and recognised in the income statement as personnel expense; a corresponding liability for all future benefits is established on the statement of financial position and the fair value of any schemes’ assets is deducted.
The discount rate is the yield at the reporting date on AA credit rated bonds that have maturity dates approximating to the duration of the schemes’ obligations. The calculation is performed by a qualified actuary using the projected unit method. Actuarial gains and losses are recognised immediately in the statement of comprehensive income.
(iii) Share-based payment transactions The Group operates equity-settled share-based compensation plans. The fair value of the employee services received in exchange for the grant of the options is recognised as personnel expense, with a corresponding increase in equity, over the period that the employees unconditionally become entitled to the awards. The fair value of the options granted is measured using a stochastic model, taking into account the terms and conditions upon which the options were granted. The total amount to be expensed over the vesting period is determined by reference to the fair value of the options granted, excluding the impact of any non-market vesting conditions.
At each reporting date, the entity revises its estimates of the number of options that are expected to become exercisable. It recognises the impact of the revision of original estimates, if any, in the income statement, and a corresponding adjustment to equity.
(r) Provisions A provision is recognised in the statement of financial position when the Group has a present legal or constructive obligation as a result of a past event, a reliable estimate can be made of the amount of the obligation and it is probable that an outflow of economic benefits will be required to settle the obligation. Provisions are discounted to present value where the effect is material.
Financial Statements 93
1. SIGNIFICANT ACCOUNTING POLICIES CONTINUED (s) Trade and other payables Trade and other payables are stated at their cost.
(t) Leases (i) Finance leases Assets held under finance leases are recognised as assets of the Group at the inception of the lease at the lower of their fair value and the present value of the minimum lease payments. Depreciation on leased assets is charged to the income statement on the same basis as owned assets. Leasing payments are treated as consisting of capital and interest elements and the interest is charged to the income statement so that a constant periodic rate of interest is recognised on the outstanding balance of the liability.
(ii) Operating leases Operating lease rentals are charged to the Consolidated Income Statement on a straight-line basis over the lease term. Any premium or discount on the acquisition of a lease is spread over the life of the lease on a straight-line basis.
(u) Taxation Income tax on the profit or loss for the year comprises current and deferred tax. Income tax is recognised in profit or loss except to the extent that it relates to items recognised directly in equity, in which case it is recognised in equity.
Current tax is the expected tax payable on the taxable income for the year, using tax rates enacted in each jurisdiction at the reporting date, and any adjustment to tax payable in respect of previous years.
The Group is subject to corporate taxes in a number of different jurisdictions and judgement is required in determining the appropriate provision for transactions where the ultimate tax determination is uncertain. In such circumstances, the Group recognises liabilities for anticipated taxes based on the best information available and where the anticipated liability is both probable and estimable. Such liabilities are classified as current when the Group expects to settle the liability within 12 months with the remainder as non-current. Any interest and penalties accrued are included in income taxes both in the Consolidated Income Statement and Consolidated Statement of Financial Position. Where the final outcome of such matters differs from the amount recorded, any differences may impact the income tax and deferred tax provisions in the period in which the final determination is made.
Deferred tax is provided for using the balance sheet liability method, providing for temporary differences between the carrying amounts of assets and liabilities for financial reporting purposes and the amounts used for taxation purposes.
The tax effect of certain temporary differences is not recognised, principally with respect to goodwill; temporary differences arising on the initial recognition of assets or liabilities (other than those arising in a business combination or in a manner that initially impacts accounting or taxable profit); and temporary differences relating to investment in subsidiaries and equity accounted investees to the extent that they will probably not reverse in the foreseeable future and the Group is able to control the reversal of such temporary differences. The amount of deferred tax provided is based on the expected manner of realisation or settlement of the carrying amount of assets and liabilities, using tax rates enacted or substantively enacted at the reporting date.
A deferred tax asset is recognised only to the extent that it is probable that future taxable profits will be available against which the asset can
be utilised. Deferred tax assets are reduced to the extent that it is no longer probable that the related tax benefit will be realised.
(v) Assets held for sale Non-current assets, or disposal groups comprising assets and liabilities that are expected to be recovered primarily through sale rather than through continuing use, are classified as held for sale. Immediately before classification as held for sale, the assets, or components of a disposal group, are remeasured in accordance with the Group’s accounting policies. Thereafter, generally the assets, or disposal group, are measured at the lower of their carrying amount and fair value less cost to sell. Any impairment loss on a disposal group is first allocated to goodwill, and then to the remaining assets and liabilities on a pro rata basis, except that no loss is allocated to inventories, financial assets, deferred tax assets and employee benefit assets, which continue to be measured in accordance with the Group’s accounting policies. Impairment losses on initial classification as held for sale and subsequent gains or losses on remeasurement are recognised in the income statement. Gains are not recognised in excess of any cumulative impairment loss.
(w) Exceptional items Items of income or expenditure that are significant by their nature, size or incidence, and for which separate presentation would assist in the understanding of the trading and financial results of the Group, are classified and disclosed as exceptional items. Such items include business disposals, restructuring and optimisation, acquisition related and integration costs, and impairments.
(x) Critical accounting policies The application of the Group’s accounting policies requires management to make estimates and assumptions. These estimates and assumptions affect the reported assets and liabilities and financial results of the Group. Actual outcomes could differ from the estimates and assumptions used.
The Group’s accounting policies that are most critical to an understanding of the results and position of the Group, and the judgements involved in their application, are as follows:
(i) Impairments When applying IAS 36 Impairment of Assets, the Group compares the carrying value of tangible and intangible non-current assets with the higher of their net realisable value and value-in-use to determine whether an impairment exists. Impairment testing is an area requiring management judgement.
To determine the present value of expected future cash flows, certain assumptions have to be made in respect of uncertain matters including management’s expectations of (a) the discount rates reflecting the risks involved, (b) the timing and quantum of capital expenditure, (c) short and long-term growth rates and (d) the future development of the business. Whilst the Directors consider their assumptions to be realistic, if actual results differ from expectations the Group’s impairment evaluation could be affected. In addition, the use of different estimates, assumptions and judgements, in particular those involved in (a) determining a value based on our current expectations of future conditions and the associated cash flows from the Group’s operations, (b) our determination of the level at which groups of assets can be reasonably tested for impairment separately from other parts of the business, and (c) our treatment of centrally held assets, could each result in material differences in the carrying values of assets and assessments of impairment. See note 10 for additional information.
94 Financial Statements
Annual Report & Accounts 2015
94 Financial Statements
Notes to the Consolidated Financial Statements continued
1. SIGNIFICANT ACCOUNTING POLICIES CONTINUED (x) Critical accounting policies continued (ii) Pensions and other employee benefits IAS 19 Employee Benefits (Revised 2011) requires the Group to make assumptions including, but not limited to, rates of inflation, discount rates and life expectancies. The use of different assumptions, in any of the above calculations, could have a material effect on the accounting values of the relevant statement of financial position assets and liabilities which could also result in a change to the cost of such liabilities as recognised in profit or loss over time. These assumptions are subject to periodic review. See note 25 for additional information.
(iii) Provisions The Group measures provisions at the Directors’ best estimate of the expenditure required to settle the obligation at the reporting date. These estimates are made, taking account of information available and different possible outcomes, and are reviewed on a regular basis.
(iv) Taxation The Group’s tax payable on profits is determined based on tax laws and regulations that apply in each of the numerous jurisdictions in which the Group operates. The Group is required to exercise judgement in determining income tax provisions, along with the recognition of deferred tax assets/liabilities. While the Group aims to ensure that estimates recorded are accurate, the actual amounts could be different from those expected.
(y) IFRS standards and interpretations in issue but not yet effective The International Accounting Standards Board (IASB) and International Financial Reporting Interpretations Committee (IFRIC) have issued new standards and interpretations with an effective date after the date of these financial statements.
International Financial Reporting Standards (IFRS/IAS) Effective date –
financial year endingIFRS 9 Financial Instruments 30 April 2019IFRS 15 Revenue from Contracts with Customers 30 April 2018
Amendments to IFRS 10 and IAS 28 Sale or Contribution of Assets between an Investor and its Associate or Joint Venture 30 April 2017
Amendments to IAS 19 Defined Benefit Plans: Employee Contributions 30 April 2016Amendments to IAS 27 Equity Method in Separate Financial Statements 30 April 2017Amendments to IAS 16 and IAS 38 Acceptable Methods of Depreciation and Amortisation 30 April 2017
Of these, IFRS 9 Financial Instruments is expected to have the most significant effect. IFRS 9 will replace IAS 39 Financial Instruments: Recognition and Measurement. IFRS 9 concerns the classification and measurement of financial assets and financial liabilities, the de-recognition of financial instruments and hedge accounting.
The Group does not anticipate that the adoption of the remaining standards and interpretations that are effective for the year ending 30 April 2016 will have a material effect on its financial statements. These standards have all been endorsed by the EU, with the exception of IFRS 9 and Amendments to IFRS 10 and IAS 28.
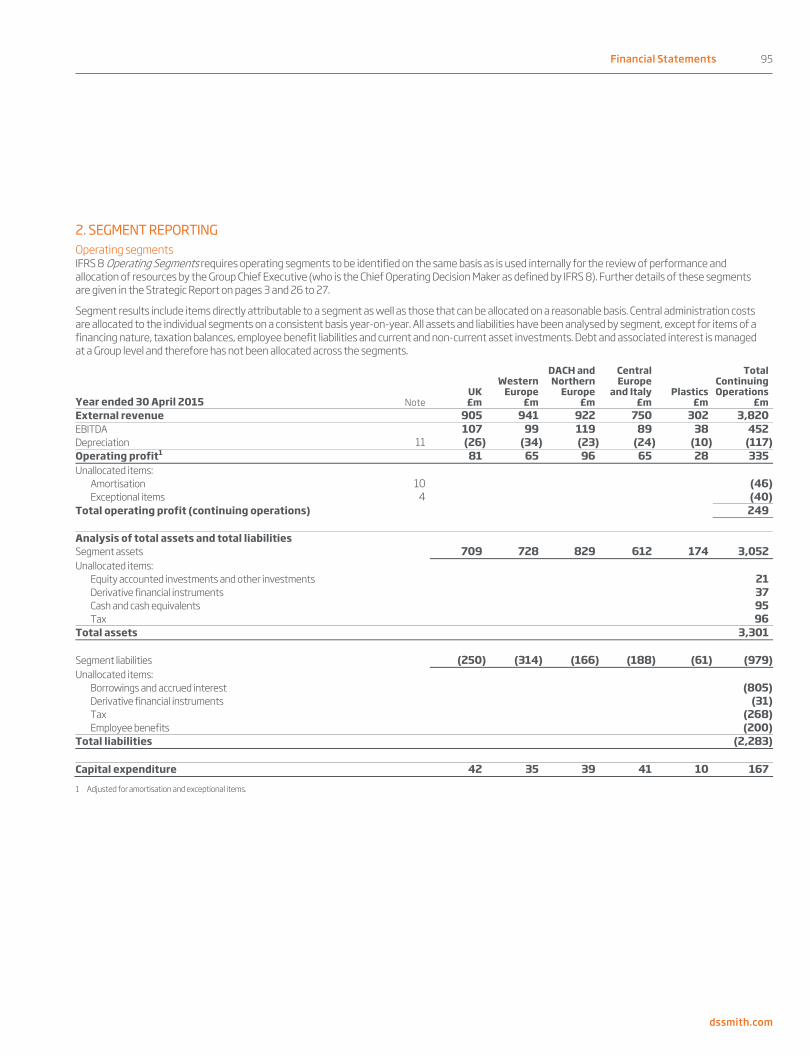
Financial Statements 95
dssmith.com
94 Financial Statements
Notes to the Consolidated Financial Statements continued
1. SIGNIFICANT ACCOUNTING POLICIES CONTINUED (x) Critical accounting policies continued (ii) Pensions and other employee benefits IAS 19 Employee Benefits (Revised 2011) requires the Group to make assumptions including, but not limited to, rates of inflation, discount rates and life expectancies. The use of different assumptions, in any of the above calculations, could have a material effect on the accounting values of the relevant statement of financial position assets and liabilities which could also result in a change to the cost of such liabilities as recognised in profit or loss over time. These assumptions are subject to periodic review. See note 25 for additional information.
(iii) Provisions The Group measures provisions at the Directors’ best estimate of the expenditure required to settle the obligation at the reporting date. These estimates are made, taking account of information available and different possible outcomes, and are reviewed on a regular basis.
(iv) Taxation The Group’s tax payable on profits is determined based on tax laws and regulations that apply in each of the numerous jurisdictions in which the Group operates. The Group is required to exercise judgement in determining income tax provisions, along with the recognition of deferred tax assets/liabilities. While the Group aims to ensure that estimates recorded are accurate, the actual amounts could be different from those expected.
(y) IFRS standards and interpretations in issue but not yet effective The International Accounting Standards Board (IASB) and International Financial Reporting Interpretations Committee (IFRIC) have issued new standards and interpretations with an effective date after the date of these financial statements.
International Financial Reporting Standards (IFRS/IAS) Effective date –
financial year endingIFRS 9 Financial Instruments 30 April 2019IFRS 15 Revenue from Contracts with Customers 30 April 2018
Amendments to IFRS 10 and IAS 28 Sale or Contribution of Assets between an Investor and its Associate or Joint Venture 30 April 2017
Amendments to IAS 19 Defined Benefit Plans: Employee Contributions 30 April 2016Amendments to IAS 27 Equity Method in Separate Financial Statements 30 April 2017Amendments to IAS 16 and IAS 38 Acceptable Methods of Depreciation and Amortisation 30 April 2017
Of these, IFRS 9 Financial Instruments is expected to have the most significant effect. IFRS 9 will replace IAS 39 Financial Instruments: Recognition and Measurement. IFRS 9 concerns the classification and measurement of financial assets and financial liabilities, the de-recognition of financial instruments and hedge accounting.
The Group does not anticipate that the adoption of the remaining standards and interpretations that are effective for the year ending 30 April 2016 will have a material effect on its financial statements. These standards have all been endorsed by the EU, with the exception of IFRS 9 and Amendments to IFRS 10 and IAS 28.
Financial Statements 95
2. SEGMENT REPORTING Operating segments IFRS 8 Operating Segments requires operating segments to be identified on the same basis as is used internally for the review of performance and allocation of resources by the Group Chief Executive (who is the Chief Operating Decision Maker as defined by IFRS 8). Further details of these segments are given in the Strategic Report on pages 3 and 26 to 27.
Segment results include items directly attributable to a segment as well as those that can be allocated on a reasonable basis. Central administration costs are allocated to the individual segments on a consistent basis year-on-year. All assets and liabilities have been analysed by segment, except for items of a financing nature, taxation balances, employee benefit liabilities and current and non-current asset investments. Debt and associated interest is managed at a Group level and therefore has not been allocated across the segments.
Year ended 30 April 2015 NoteUK£m
Western Europe
£m
DACH and Northern
Europe £m
Central Europe
and Italy £m
Plastics£m
TotalContinuing Operations
£mExternal revenue 905 941 922 750 302 3,820EBITDA 107 99 119 89 38 452Depreciation 11 (26) (34) (23) (24) (10) (117)Operating profit1 81 65 96 65 28 335Unallocated items:
Amortisation 10 (46)Exceptional items 4 (40)
Total operating profit (continuing operations) 249 Analysis of total assets and total liabilities Segment assets 709 728 829 612 174 3,052Unallocated items:
Equity accounted investments and other investments 21Derivative financial instruments 37Cash and cash equivalents 95Tax 96
Total assets 3,301 Segment liabilities (250) (314) (166) (188) (61) (979)Unallocated items:
Borrowings and accrued interest (805)Derivative financial instruments (31)Tax (268)Employee benefits (200)
Total liabilities (2,283) Capital expenditure 42 35 39 41 10 1671 Adjusted for amortisation and exceptional items.

96 Financial Statements
Annual Report & Accounts 2015
96 Financial Statements
Notes to the Consolidated Financial Statements continued
2. SEGMENT REPORTING CONTINUED
Year ended 30 April 2014 NoteUK£m
Western Europe
£m
DACH and Northern
Europe£m
Central Europe
and Italy £m
Plastics£m
TotalContinuing Operations
£mExternal revenue 929 1,017 1,029 739 321 4,035EBITDA 92 102 126 73 37 430Depreciation 11 (28) (35) (30) (20) (10) (123)Operating profit1 64 67 96 53 27 307Unallocated items:
Amortisation 10 (51)Exceptional items 4 (38)
Total operating profit (continuing operations) 218 Analysis of total assets and total liabilities Segment assets 708 790 981 641 183 3,303Unallocated items:
Equity accounted investments and other investments 33Derivative financial instruments 6Cash and cash equivalents 98Tax 95
Total assets 3,535 Segment liabilities (230) (319) (192) (196) (76) (1,013)Unallocated items:
Borrowings and accrued interest (927)Derivative financial instruments (60)Tax (253)Employee benefits (151)
Total liabilities (2,404) Capital expenditure 40 41 47 35 11 1741 Adjusted for amortisation and exceptional items.
Geographical areas In presenting information by geographical area, external revenue is based on the geographical location of customers. Non-current assets are based on the geographical location of assets and exclude investments, deferred tax assets, derivative financial instruments and intangible assets (which are monitored at the operating segment level, not at a country level).
External revenue Non-current assets Capital expenditure
Continuing operations 2015
£m2014
£m2015
£m2014
£m 2015
£m2014
£mUK 879 933 357 346 42 43France 620 688 211 221 27 32Germany 579 613 241 260 28 27Italy 429 433 161 169 19 16Rest of the World 1,313 1,368 377 379 51 56 3,820 4,035 1,347 1,375 167 174
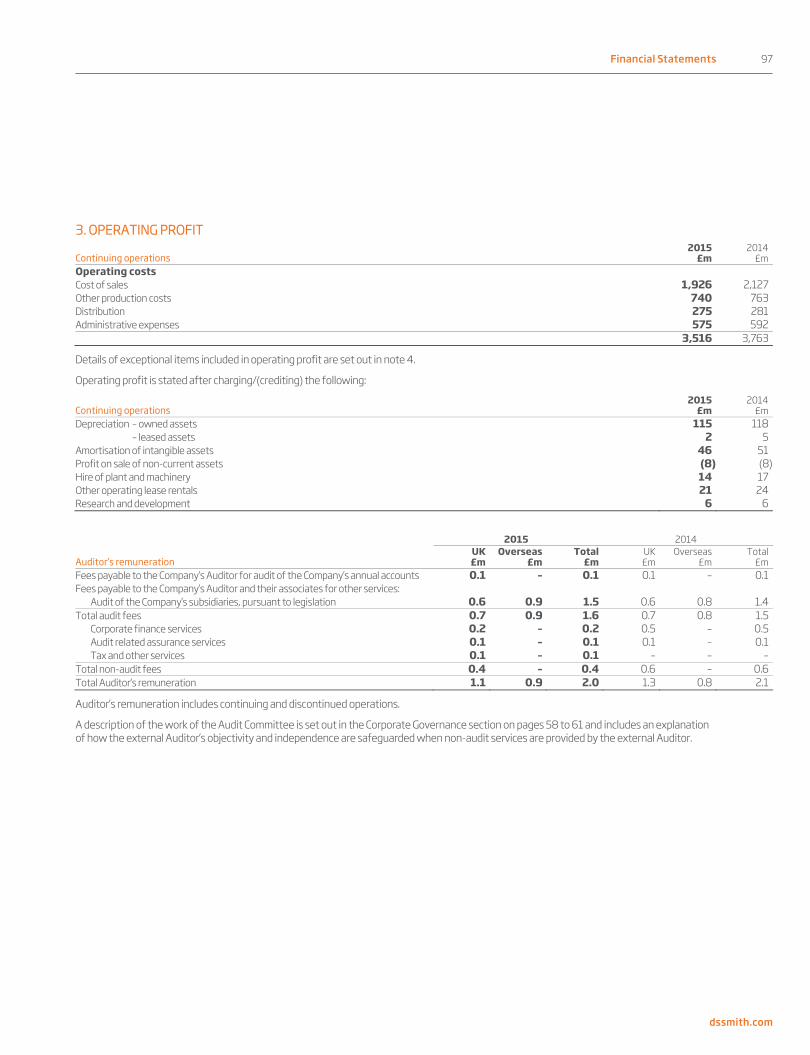
Financial Statements 97
dssmith.com
96 Financial Statements
Notes to the Consolidated Financial Statements continued
2. SEGMENT REPORTING CONTINUED
Year ended 30 April 2014 NoteUK£m
Western Europe
£m
DACH and Northern
Europe£m
Central Europe
and Italy £m
Plastics£m
TotalContinuing Operations
£mExternal revenue 929 1,017 1,029 739 321 4,035EBITDA 92 102 126 73 37 430Depreciation 11 (28) (35) (30) (20) (10) (123)Operating profit1 64 67 96 53 27 307Unallocated items:
Amortisation 10 (51)Exceptional items 4 (38)
Total operating profit (continuing operations) 218 Analysis of total assets and total liabilities Segment assets 708 790 981 641 183 3,303Unallocated items:
Equity accounted investments and other investments 33Derivative financial instruments 6Cash and cash equivalents 98Tax 95
Total assets 3,535 Segment liabilities (230) (319) (192) (196) (76) (1,013)Unallocated items:
Borrowings and accrued interest (927)Derivative financial instruments (60)Tax (253)Employee benefits (151)
Total liabilities (2,404) Capital expenditure 40 41 47 35 11 1741 Adjusted for amortisation and exceptional items.
Geographical areas In presenting information by geographical area, external revenue is based on the geographical location of customers. Non-current assets are based on the geographical location of assets and exclude investments, deferred tax assets, derivative financial instruments and intangible assets (which are monitored at the operating segment level, not at a country level).
External revenue Non-current assets Capital expenditure
Continuing operations 2015
£m2014
£m2015
£m2014
£m 2015
£m2014
£mUK 879 933 357 346 42 43France 620 688 211 221 27 32Germany 579 613 241 260 28 27Italy 429 433 161 169 19 16Rest of the World 1,313 1,368 377 379 51 56 3,820 4,035 1,347 1,375 167 174
Financial Statements 97
3. OPERATING PROFIT
Continuing operations 2015
£m2014
£mOperating costs Cost of sales 1,926 2,127Other production costs 740 763Distribution 275 281Administrative expenses 575 592 3,516 3,763
Details of exceptional items included in operating profit are set out in note 4.
Operating profit is stated after charging/(crediting) the following:
Continuing operations 2015
£m2014
£mDepreciation – owned assets 115 118 – leased assets 2 5Amortisation of intangible assets 46 51Profit on sale of non-current assets (8) (8)Hire of plant and machinery 14 17Other operating lease rentals 21 24Research and development 6 6
2015 2014
Auditor’s remuneration UK£m
Overseas£m
Total £m
UK£m
Overseas£m
Total£m
Fees payable to the Company’s Auditor for audit of the Company’s annual accounts 0.1 – 0.1 0.1 – 0.1Fees payable to the Company’s Auditor and their associates for other services:
Audit of the Company’s subsidiaries, pursuant to legislation 0.6 0.9 1.5 0.6 0.8 1.4Total audit fees 0.7 0.9 1.6 0.7 0.8 1.5
Corporate finance services 0.2 – 0.2 0.5 – 0.5Audit related assurance services 0.1 – 0.1 0.1 – 0.1Tax and other services 0.1 – 0.1 – – –
Total non-audit fees 0.4 – 0.4 0.6 – 0.6Total Auditor’s remuneration 1.1 0.9 2.0 1.3 0.8 2.1
Auditor’s remuneration includes continuing and discontinued operations.
A description of the work of the Audit Committee is set out in the Corporate Governance section on pages 58 to 61 and includes an explanation of how the external Auditor’s objectivity and independence are safeguarded when non-audit services are provided by the external Auditor.

98 Financial Statements
Annual Report & Accounts 2015
98 Financial Statements
Notes to the Consolidated Financial Statements continued
4. EXCEPTIONAL ITEMS Items are presented as exceptional in the financial statements where they are significant items of financial performance that the Directors consider should be separately disclosed to assist in the understanding of the trading and financial results of the Group. Such items include business disposals, restructuring and optimisation, acquisition related and integration costs, and impairments.
Continuing operations 2015
£m2014
£mSCA Packaging integration costs – (42)SCA Packaging acquisition finalisation – 39SCA Packaging related exceptional costs – (3)Acquisition related costs (4) (4)Other restructuring costs (31) (29)Impairment of assets (4) (5)Rebranding – (4)(Loss)/gain on divestments (5) 4Other 4 3Total pre-tax exceptional items (recognised in operating profit) (40) (38)Income tax credit on exceptional items 10 22Share of exceptional loss of associate, net of tax (7) (3)Exceptional finance costs (4) –Total post-tax exceptional items (41) (19)
2014/15 Acquisition costs of £4m relate to professional advisory, legal and consultancy fees relating to the review of potential deals, and deals completed during the year.
Of the £31m other restructuring costs, £10m relates to UK site closures and reorganisations, £11m relates to restructuring of businesses in the DACH and Northern Europe region and £3m relates to restructuring of businesses in the Recycling division.
Impairment of assets of £4m relate to the impairment of assets in UK Packaging and France Packaging.
The loss on divestments of £5m comprises a £3m gain on the disposal of the Foam business in Denmark and Sweden in September 2014, a gain of £2m on the step acquisition of the Italian Recycling business from 50% to 100% in July 2014, offset by a loss of £9m on the divestment of the Nantes paper mill in France in January 2015 and other losses on divestment of £1m.
Other exceptional items of £4m principally relate to the release of acquisition related provisions of £16m, partially offset by the costs of continuing UK centralisation projects of £9m.
The share of exceptional loss of associate relates to the Group’s share of post-tax foreign exchange losses recognised in the Group’s Ukrainian associate Rubezhansk as a result of the significant decline in the value of the Ukrainian currency, Hryvnia, during the local geopolitical crisis (note 12).
Exceptional finance costs of £4m relate to the write-off of unamortised finance costs relating to the SCA Packaging acquisition following the refinancing of borrowings in May 2014.
The above items give rise to a net income tax credit at the local applicable tax rate with the exception of gains and losses on some of the divestments which are not subject to tax under local rules, impairments not deductible for tax purposes, and non-tax deductible deal related advisory fees in relation to acquisitions and disposals.
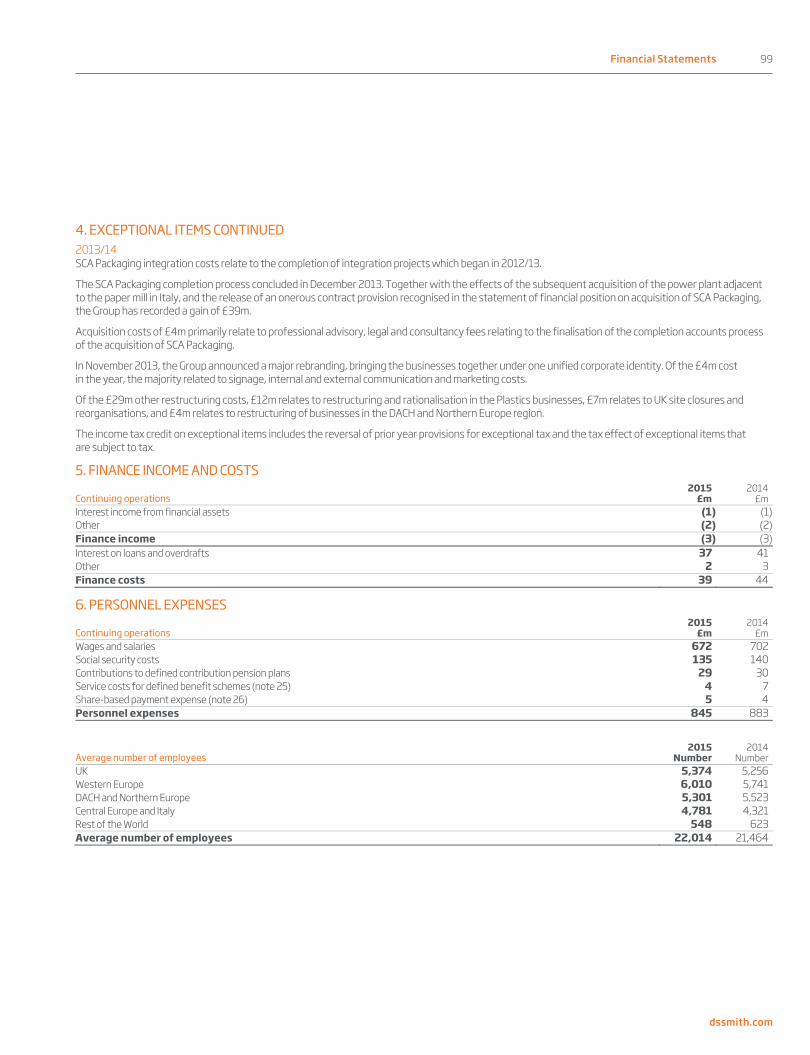
Financial Statements 99
dssmith.com
98 Financial Statements
Notes to the Consolidated Financial Statements continued
4. EXCEPTIONAL ITEMS Items are presented as exceptional in the financial statements where they are significant items of financial performance that the Directors consider should be separately disclosed to assist in the understanding of the trading and financial results of the Group. Such items include business disposals, restructuring and optimisation, acquisition related and integration costs, and impairments.
Continuing operations 2015
£m2014
£mSCA Packaging integration costs – (42)SCA Packaging acquisition finalisation – 39SCA Packaging related exceptional costs – (3)Acquisition related costs (4) (4)Other restructuring costs (31) (29)Impairment of assets (4) (5)Rebranding – (4)(Loss)/gain on divestments (5) 4Other 4 3Total pre-tax exceptional items (recognised in operating profit) (40) (38)Income tax credit on exceptional items 10 22Share of exceptional loss of associate, net of tax (7) (3)Exceptional finance costs (4) –Total post-tax exceptional items (41) (19)
2014/15 Acquisition costs of £4m relate to professional advisory, legal and consultancy fees relating to the review of potential deals, and deals completed during the year.
Of the £31m other restructuring costs, £10m relates to UK site closures and reorganisations, £11m relates to restructuring of businesses in the DACH and Northern Europe region and £3m relates to restructuring of businesses in the Recycling division.
Impairment of assets of £4m relate to the impairment of assets in UK Packaging and France Packaging.
The loss on divestments of £5m comprises a £3m gain on the disposal of the Foam business in Denmark and Sweden in September 2014, a gain of £2m on the step acquisition of the Italian Recycling business from 50% to 100% in July 2014, offset by a loss of £9m on the divestment of the Nantes paper mill in France in January 2015 and other losses on divestment of £1m.
Other exceptional items of £4m principally relate to the release of acquisition related provisions of £16m, partially offset by the costs of continuing UK centralisation projects of £9m.
The share of exceptional loss of associate relates to the Group’s share of post-tax foreign exchange losses recognised in the Group’s Ukrainian associate Rubezhansk as a result of the significant decline in the value of the Ukrainian currency, Hryvnia, during the local geopolitical crisis (note 12).
Exceptional finance costs of £4m relate to the write-off of unamortised finance costs relating to the SCA Packaging acquisition following the refinancing of borrowings in May 2014.
The above items give rise to a net income tax credit at the local applicable tax rate with the exception of gains and losses on some of the divestments which are not subject to tax under local rules, impairments not deductible for tax purposes, and non-tax deductible deal related advisory fees in relation to acquisitions and disposals.
Financial Statements 99
4. EXCEPTIONAL ITEMS CONTINUED 2013/14 SCA Packaging integration costs relate to the completion of integration projects which began in 2012/13.
The SCA Packaging completion process concluded in December 2013. Together with the effects of the subsequent acquisition of the power plant adjacent to the paper mill in Italy, and the release of an onerous contract provision recognised in the statement of financial position on acquisition of SCA Packaging, the Group has recorded a gain of £39m.
Acquisition costs of £4m primarily relate to professional advisory, legal and consultancy fees relating to the finalisation of the completion accounts process of the acquisition of SCA Packaging.
In November 2013, the Group announced a major rebranding, bringing the businesses together under one unified corporate identity. Of the £4m cost in the year, the majority related to signage, internal and external communication and marketing costs.
Of the £29m other restructuring costs, £12m relates to restructuring and rationalisation in the Plastics businesses, £7m relates to UK site closures and reorganisations, and £4m relates to restructuring of businesses in the DACH and Northern Europe region.
The income tax credit on exceptional items includes the reversal of prior year provisions for exceptional tax and the tax effect of exceptional items that are subject to tax.
5. FINANCE INCOME AND COSTS
Continuing operations 2015
£m2014
£mInterest income from financial assets (1) (1)Other (2) (2)Finance income (3) (3)Interest on loans and overdrafts 37 41Other 2 3Finance costs 39 44
6. PERSONNEL EXPENSES
Continuing operations 2015
£m2014
£mWages and salaries 672 702Social security costs 135 140Contributions to defined contribution pension plans 29 30Service costs for defined benefit schemes (note 25) 4 7Share-based payment expense (note 26) 5 4Personnel expenses 845 883
Average number of employees 2015
Number2014
NumberUK 5,374 5,256Western Europe 6,010 5,741DACH and Northern Europe 5,301 5,523Central Europe and Italy 4,781 4,321Rest of the World 548 623Average number of employees 22,014 21,464

100 Financial Statements
Annual Report & Accounts 2015
100 Financial Statements
Notes to the Consolidated Financial Statements continued
7. INCOME TAX EXPENSE
Continuing operations 2015
£m2014
£mCurrent tax expense Current year (73) (61)Adjustment in respect of prior years 1 6 (72) (55)Deferred tax expense Origination and reversal of temporary differences 10 1Reduction in UK tax rate – 2Adjustment in respect of prior years 8 7 18 10Total income tax expense before exceptional items (54) (45)Tax relating to exceptional items (note 4) 10 22Total income tax expense in the income statement from continuing operations (44) (23)Discontinued operations Current tax expense adjustment in respect of prior years – (3)Total income tax expense in the income statement from discontinued operations – (3)
The tax credit on amortisation was £12m (2013/14: £14m).
The reconciliation of the actual tax charge to that at the domestic corporation tax rate is as follows:
2015
£m2014
£mProfit before income tax 200 167Share of (profit)/loss of associates 7 3Profit before tax and share of (profit)/loss of associates 207 170 Income tax at the domestic corporation tax rate of 20.92% (2013/14: 22.83%) (43) (39)Effect of additional taxes and tax rates in overseas jurisdictions (19) (14)Additional items deductible for tax purposes 18 35Non-deductible expenses (17) (25)Non-taxable gains 3 –Release of prior year provisions in relation to acquired businesses 2 –Change in unrecognised deferred tax assets in relation to acquired businesses 6 –Adjustment in respect of prior years 9 15Effect of change in corporation tax rates (3) 2Income tax expense – total Group (44) (26)Income tax expense from continuing operations (44) (23)Income tax expense from discontinued operations – (3)
The Finance Act 2013 included a staged 3% reduction to the main UK Corporation tax rate to 20% effective 1 April 2015. Accordingly, the rate applied to UK deferred tax assets and liabilities is 20% (2013/14: 20%). There have been no further indications of additional changes to the rate of corporation tax from 20%.
Tax on other comprehensive income and equity
Gross2015
£m
Tax credit/
(charge)2015
£m
Net2015
£m
Gross 2014
£m
Tax credit/(charge)
2014 £m
Net2014
£mActuarial (losses)/gains on employee benefits (65) 10 (55) 57 (18) 39Foreign currency translation differences and reclassification from translation reserve to income statement arising on divestment (105) (21) (126) (55) (6) (61)Movements in cash flow hedges 5 (1) 4 (16) 2 (14)Other comprehensive expense for the year, net of tax (165) (12) (177) (14) (22) (36)Issue of share capital – – – 6 – 6Share-based payment expense 5 (3) 2 4 5 9Dividends paid to Group shareholders (94) – (94) (74) – (74)Other comprehensive expense and changes in equity (254) (15) (269) (78) (17) (95)

Financial Statements 101
dssmith.com
100 Financial Statements
Notes to the Consolidated Financial Statements continued
7. INCOME TAX EXPENSE
Continuing operations 2015
£m2014
£mCurrent tax expense Current year (73) (61)Adjustment in respect of prior years 1 6 (72) (55)Deferred tax expense Origination and reversal of temporary differences 10 1Reduction in UK tax rate – 2Adjustment in respect of prior years 8 7 18 10Total income tax expense before exceptional items (54) (45)Tax relating to exceptional items (note 4) 10 22Total income tax expense in the income statement from continuing operations (44) (23)Discontinued operations Current tax expense adjustment in respect of prior years – (3)Total income tax expense in the income statement from discontinued operations – (3)
The tax credit on amortisation was £12m (2013/14: £14m).
The reconciliation of the actual tax charge to that at the domestic corporation tax rate is as follows:
2015
£m2014
£mProfit before income tax 200 167Share of (profit)/loss of associates 7 3Profit before tax and share of (profit)/loss of associates 207 170 Income tax at the domestic corporation tax rate of 20.92% (2013/14: 22.83%) (43) (39)Effect of additional taxes and tax rates in overseas jurisdictions (19) (14)Additional items deductible for tax purposes 18 35Non-deductible expenses (17) (25)Non-taxable gains 3 –Release of prior year provisions in relation to acquired businesses 2 –Change in unrecognised deferred tax assets in relation to acquired businesses 6 –Adjustment in respect of prior years 9 15Effect of change in corporation tax rates (3) 2Income tax expense – total Group (44) (26)Income tax expense from continuing operations (44) (23)Income tax expense from discontinued operations – (3)
The Finance Act 2013 included a staged 3% reduction to the main UK Corporation tax rate to 20% effective 1 April 2015. Accordingly, the rate applied to UK deferred tax assets and liabilities is 20% (2013/14: 20%). There have been no further indications of additional changes to the rate of corporation tax from 20%.
Tax on other comprehensive income and equity
Gross2015
£m
Tax credit/
(charge)2015
£m
Net2015
£m
Gross 2014
£m
Tax credit/(charge)
2014 £m
Net2014
£mActuarial (losses)/gains on employee benefits (65) 10 (55) 57 (18) 39Foreign currency translation differences and reclassification from translation reserve to income statement arising on divestment (105) (21) (126) (55) (6) (61)Movements in cash flow hedges 5 (1) 4 (16) 2 (14)Other comprehensive expense for the year, net of tax (165) (12) (177) (14) (22) (36)Issue of share capital – – – 6 – 6Share-based payment expense 5 (3) 2 4 5 9Dividends paid to Group shareholders (94) – (94) (74) – (74)Other comprehensive expense and changes in equity (254) (15) (269) (78) (17) (95)
Financial Statements 101
8. EARNINGS PER SHARE Basic earnings per share from continuing operations 2015 2014Profit from continuing operations attributable to ordinary shareholders £156m £143mWeighted average number of ordinary shares 941m 932mBasic earnings per share 16.6p 15.3p
Diluted earnings per share from continuing operations 2015 2014Profit from continuing operations attributable to ordinary shareholders £156m £143mWeighted average number of ordinary shares 941m 932mPotentially dilutive shares issuable under share-based payment arrangements 9m 8mWeighted average number of ordinary shares (diluted) 950m 940mDiluted earnings per share 16.4p 15.2p
Basic earnings per share from discontinued operations 2015 2014Loss attributable to ordinary shareholders – (£3m)Weighted average number of ordinary shares 941m 932mBasic earnings per share – (0.3p)
Diluted earnings per share from discontinued operations 2015 2014Loss attributable to ordinary shareholders – (£3m)Weighted average number of ordinary shares 941m 932mPotentially dilutive shares issuable under share-based payment arrangements n/a n/aWeighted average number of ordinary shares (diluted) 941m 932mDiluted earnings per share – (0.3p)
The number of shares excludes the weighted average number of the Company’s own shares held as treasury shares during the year of nil (2013/14: 1m).
Adjusted earnings per share from continuing operations The Directors believe that the presentation of an adjusted earnings per share, being the basic earnings per share adjusted for exceptional items and amortisation of intangible assets, better explains the underlying performance of the Group. A reconciliation of basic to adjusted earnings per share is as follows:
2015 2014
£m
Basic –pence
per share
Diluted – pence
per share £m
Basic –pence
per share
Diluted –pence
per shareBasic earnings 156 16.6p 16.4p 143 15.3p 15.2pAdd back amortisation, after tax 34 3.6p 3.6p 37 4.1p 4.0pAdd back exceptional items, after tax 41 4.3p 4.3p 19 2.0p 1.9pAdjusted earnings 231 24.5p 24.3p 199 21.4p 21.1p

102 Financial Statements
Annual Report & Accounts 2015
102 Financial Statements
Notes to the Consolidated Financial Statements continued
9. DIVIDENDS PROPOSED AND PAID 2015 2014
Pence
per share £m Pence
per share £m 2013/14 interim dividend – paid – – 3.2p 302013/14 final dividend – paid – – 6.8p 642014/15 interim dividend – paid 3.7p 35 – –2014/15 final dividend – proposed 7.7p 73 – –
2015
£m2014
£mPaid during the year 94 74
The interim dividend in respect of 2014/15 of 3.7 pence per share (£35m) was paid after the year end on 1 May 2015. The 2013/14 interim and final dividends were paid during the 2014/15 financial year. A final dividend in respect of 2014/15 of 7.7 pence per share (£73m) has been proposed by the Directors after the reporting date.
10. INTANGIBLE ASSETS
Goodwill£m
Software£m
Intellectual property
£m
Customer related
£m Other
£mTotal
£mCost At 1 May 2014 631 35 26 373 53 1,118Acquisitions 15 – – 8 – 23Additions – 5 – – 3 8Divestments (6) – – – (2) (8)Disposals – (1) (2) – (2) (5)Reclassification to held for sale (1) – – – – (1)Other reclassifications – 3 – – – 3Currency translation (51) (4) (2) (41) (4) (102)At 30 April 2015 588 38 22 340 48 1,036 Amortisation and impairment At 1 May 2014 (27) (25) (14) (76) (15) (157)Amortisation – (3) (2) (39) (2) (46)Disposals – 1 2 – 1 4Currency translation 2 2 1 11 2 18At 30 April 2015 (25) (25) (13) (104) (14) (181) Carrying amount At 1 May 2014 604 10 12 297 38 961At 30 April 2015 563 13 9 236 34 855
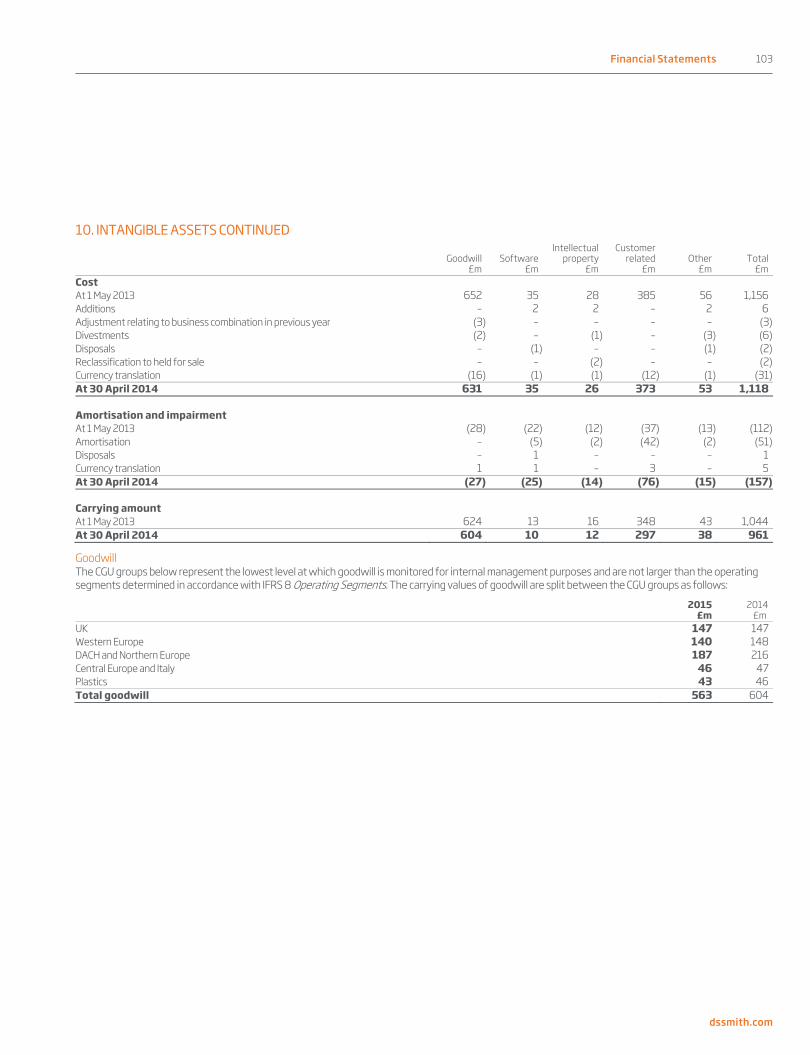
Financial Statements 103
dssmith.com
102 Financial Statements
Notes to the Consolidated Financial Statements continued
9. DIVIDENDS PROPOSED AND PAID 2015 2014
Pence
per share £m Pence
per share £m 2013/14 interim dividend – paid – – 3.2p 302013/14 final dividend – paid – – 6.8p 642014/15 interim dividend – paid 3.7p 35 – –2014/15 final dividend – proposed 7.7p 73 – –
2015
£m2014
£mPaid during the year 94 74
The interim dividend in respect of 2014/15 of 3.7 pence per share (£35m) was paid after the year end on 1 May 2015. The 2013/14 interim and final dividends were paid during the 2014/15 financial year. A final dividend in respect of 2014/15 of 7.7 pence per share (£73m) has been proposed by the Directors after the reporting date.
10. INTANGIBLE ASSETS
Goodwill£m
Software£m
Intellectual property
£m
Customer related
£m Other
£mTotal
£mCost At 1 May 2014 631 35 26 373 53 1,118Acquisitions 15 – – 8 – 23Additions – 5 – – 3 8Divestments (6) – – – (2) (8)Disposals – (1) (2) – (2) (5)Reclassification to held for sale (1) – – – – (1)Other reclassifications – 3 – – – 3Currency translation (51) (4) (2) (41) (4) (102)At 30 April 2015 588 38 22 340 48 1,036 Amortisation and impairment At 1 May 2014 (27) (25) (14) (76) (15) (157)Amortisation – (3) (2) (39) (2) (46)Disposals – 1 2 – 1 4Currency translation 2 2 1 11 2 18At 30 April 2015 (25) (25) (13) (104) (14) (181) Carrying amount At 1 May 2014 604 10 12 297 38 961At 30 April 2015 563 13 9 236 34 855
Financial Statements 103
10. INTANGIBLE ASSETS CONTINUED
Goodwill
£mSoftware
£m
Intellectual property
£m
Customer related
£mOther
£mTotal
£mCost At 1 May 2013 652 35 28 385 56 1,156Additions – 2 2 – 2 6Adjustment relating to business combination in previous year (3) – – – – (3)Divestments (2) – (1) – (3) (6)Disposals – (1) – – (1) (2)Reclassification to held for sale – – (2) – – (2)Currency translation (16) (1) (1) (12) (1) (31)At 30 April 2014 631 35 26 373 53 1,118 Amortisation and impairment At 1 May 2013 (28) (22) (12) (37) (13) (112)Amortisation – (5) (2) (42) (2) (51)Disposals – 1 – – – 1Currency translation 1 1 – 3 – 5At 30 April 2014 (27) (25) (14) (76) (15) (157) Carrying amount At 1 May 2013 624 13 16 348 43 1,044At 30 April 2014 604 10 12 297 38 961
Goodwill The CGU groups below represent the lowest level at which goodwill is monitored for internal management purposes and are not larger than the operating segments determined in accordance with IFRS 8 Operating Segments. The carrying values of goodwill are split between the CGU groups as follows:
2015
£m2014
£mUK 147 147Western Europe 140 148DACH and Northern Europe 187 216Central Europe and Italy 46 47Plastics 43 46Total goodwill 563 604
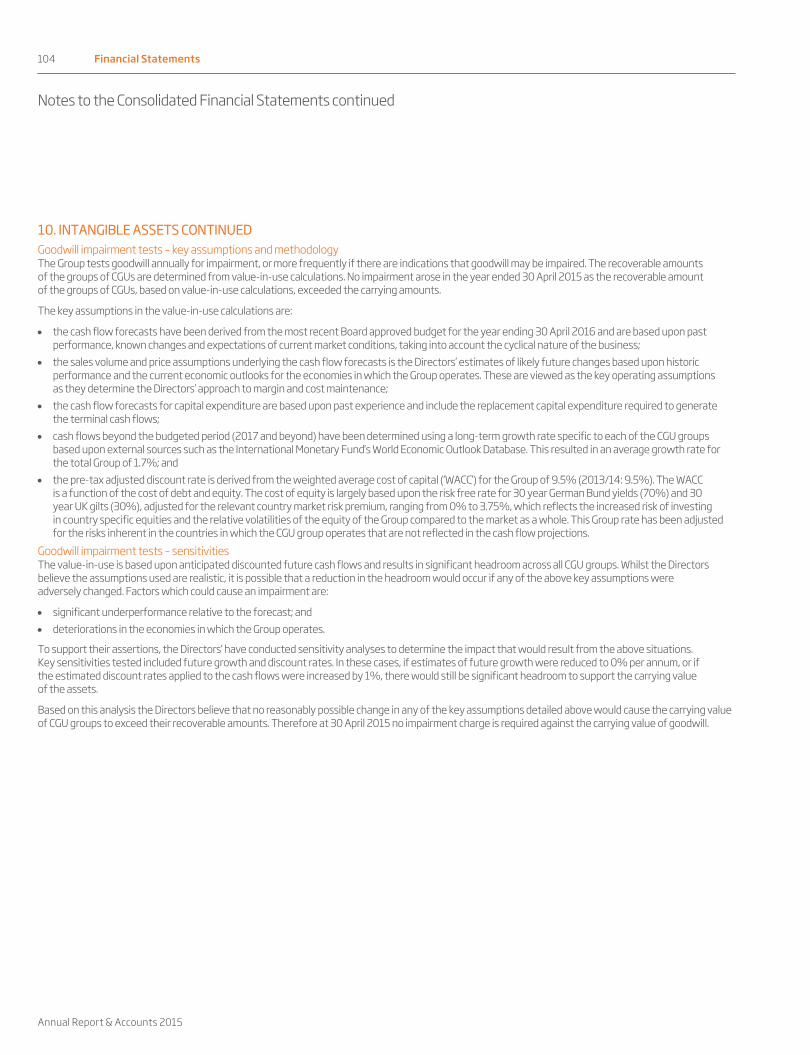
104 Financial Statements
Annual Report & Accounts 2015
104 Financial Statements
Notes to the Consolidated Financial Statements continued
10. INTANGIBLE ASSETS CONTINUED Goodwill impairment tests – key assumptions and methodology The Group tests goodwill annually for impairment, or more frequently if there are indications that goodwill may be impaired. The recoverable amounts of the groups of CGUs are determined from value-in-use calculations. No impairment arose in the year ended 30 April 2015 as the recoverable amount of the groups of CGUs, based on value-in-use calculations, exceeded the carrying amounts.
The key assumptions in the value-in-use calculations are:
the cash flow forecasts have been derived from the most recent Board approved budget for the year ending 30 April 2016 and are based upon past performance, known changes and expectations of current market conditions, taking into account the cyclical nature of the business;
the sales volume and price assumptions underlying the cash flow forecasts is the Directors’ estimates of likely future changes based upon historic performance and the current economic outlooks for the economies in which the Group operates. These are viewed as the key operating assumptions as they determine the Directors’ approach to margin and cost maintenance;
the cash flow forecasts for capital expenditure are based upon past experience and include the replacement capital expenditure required to generate the terminal cash flows;
cash flows beyond the budgeted period (2017 and beyond) have been determined using a long-term growth rate specific to each of the CGU groups based upon external sources such as the International Monetary Fund’s World Economic Outlook Database. This resulted in an average growth rate for the total Group of 1.7%; and
the pre-tax adjusted discount rate is derived from the weighted average cost of capital (‘WACC’) for the Group of 9.5% (2013/14: 9.5%). The WACC is a function of the cost of debt and equity. The cost of equity is largely based upon the risk free rate for 30 year German Bund yields (70%) and 30 year UK gilts (30%), adjusted for the relevant country market risk premium, ranging from 0% to 3.75%, which reflects the increased risk of investing in country specific equities and the relative volatilities of the equity of the Group compared to the market as a whole. This Group rate has been adjusted for the risks inherent in the countries in which the CGU group operates that are not reflected in the cash flow projections.
Goodwill impairment tests – sensitivities The value-in-use is based upon anticipated discounted future cash flows and results in significant headroom across all CGU groups. Whilst the Directors believe the assumptions used are realistic, it is possible that a reduction in the headroom would occur if any of the above key assumptions were adversely changed. Factors which could cause an impairment are:
significant underperformance relative to the forecast; and deteriorations in the economies in which the Group operates.
To support their assertions, the Directors’ have conducted sensitivity analyses to determine the impact that would result from the above situations. Key sensitivities tested included future growth and discount rates. In these cases, if estimates of future growth were reduced to 0% per annum, or if the estimated discount rates applied to the cash flows were increased by 1%, there would still be significant headroom to support the carrying value of the assets.
Based on this analysis the Directors believe that no reasonably possible change in any of the key assumptions detailed above would cause the carrying value of CGU groups to exceed their recoverable amounts. Therefore at 30 April 2015 no impairment charge is required against the carrying value of goodwill.

Financial Statements 105
dssmith.com
104 Financial Statements
Notes to the Consolidated Financial Statements continued
10. INTANGIBLE ASSETS CONTINUED Goodwill impairment tests – key assumptions and methodology The Group tests goodwill annually for impairment, or more frequently if there are indications that goodwill may be impaired. The recoverable amounts of the groups of CGUs are determined from value-in-use calculations. No impairment arose in the year ended 30 April 2015 as the recoverable amount of the groups of CGUs, based on value-in-use calculations, exceeded the carrying amounts.
The key assumptions in the value-in-use calculations are:
the cash flow forecasts have been derived from the most recent Board approved budget for the year ending 30 April 2016 and are based upon past performance, known changes and expectations of current market conditions, taking into account the cyclical nature of the business;
the sales volume and price assumptions underlying the cash flow forecasts is the Directors’ estimates of likely future changes based upon historic performance and the current economic outlooks for the economies in which the Group operates. These are viewed as the key operating assumptions as they determine the Directors’ approach to margin and cost maintenance;
the cash flow forecasts for capital expenditure are based upon past experience and include the replacement capital expenditure required to generate the terminal cash flows;
cash flows beyond the budgeted period (2017 and beyond) have been determined using a long-term growth rate specific to each of the CGU groups based upon external sources such as the International Monetary Fund’s World Economic Outlook Database. This resulted in an average growth rate for the total Group of 1.7%; and
the pre-tax adjusted discount rate is derived from the weighted average cost of capital (‘WACC’) for the Group of 9.5% (2013/14: 9.5%). The WACC is a function of the cost of debt and equity. The cost of equity is largely based upon the risk free rate for 30 year German Bund yields (70%) and 30 year UK gilts (30%), adjusted for the relevant country market risk premium, ranging from 0% to 3.75%, which reflects the increased risk of investing in country specific equities and the relative volatilities of the equity of the Group compared to the market as a whole. This Group rate has been adjusted for the risks inherent in the countries in which the CGU group operates that are not reflected in the cash flow projections.
Goodwill impairment tests – sensitivities The value-in-use is based upon anticipated discounted future cash flows and results in significant headroom across all CGU groups. Whilst the Directors believe the assumptions used are realistic, it is possible that a reduction in the headroom would occur if any of the above key assumptions were adversely changed. Factors which could cause an impairment are:
significant underperformance relative to the forecast; and deteriorations in the economies in which the Group operates.
To support their assertions, the Directors’ have conducted sensitivity analyses to determine the impact that would result from the above situations. Key sensitivities tested included future growth and discount rates. In these cases, if estimates of future growth were reduced to 0% per annum, or if the estimated discount rates applied to the cash flows were increased by 1%, there would still be significant headroom to support the carrying value of the assets.
Based on this analysis the Directors believe that no reasonably possible change in any of the key assumptions detailed above would cause the carrying value of CGU groups to exceed their recoverable amounts. Therefore at 30 April 2015 no impairment charge is required against the carrying value of goodwill.
Financial Statements 105
11. PROPERTY, PLANT AND EQUIPMENT
Land and buildings
£m
Plant and equipment
£m
Fixtures and fittings
£m
Under construction
£mTotal
£mCost At 1 May 2014 589 1,713 47 86 2,435Acquisitions 10 23 2 – 35Additions 11 71 3 93 178Divestments (4) (12) – – (16)Disposals (9) (37) (2) (1) (49)Transfers 11 69 (3) (77) –Reclassification to held for sale – (8) – – (8)Currency translation (49) (125) (6) (7) (187)At 30 April 2015 559 1,694 41 94 2,388 Depreciation and impairment At 1 May 2014 (102) (938) (23) – (1,063)Depreciation charge (17) (97) (3) – (117)Impairment – (4) – – (4)Divestments 2 12 – – 14Disposals 2 35 2 – 39Reclassification to held for sale – 4 – – 4Currency translation 11 66 4 – 81At 30 April 2015 (104) (922) (20) – (1,046) Carrying amount At 1 May 2014 487 775 24 86 1,372At 30 April 2015 455 772 21 94 1,342
The amounts above include land and buildings held under finance lease agreements. At 30 April 2015, the carrying amount of land and buildings held under finance leases was £6m (30 April 2014: £4m).
Assets under construction mainly relate to production machines being built for various sites across the Group.

106 Financial Statements
Annual Report & Accounts 2015
106 Financial Statements
Notes to the Consolidated Financial Statements continued
11. PROPERTY, PLANT AND EQUIPMENT CONTINUED
Land and buildings
£m
Plant and equipment
£m
Fixtures and fittings
£m
Under construction
£mTotal
£mCost At 1 May 2013 640 1,718 50 69 2,477Acquisitions – 23 – – 23Additions 11 88 3 68 170Divestments – (1) – – (1)Disposals (9) (62) (2) – (73)Transfers (18) 67 – (49) –Reclassification to held for sale (15) (59) (1) – (75)Currency translation (20) (61) (3) (2) (86)At 30 April 2014 589 1,713 47 86 2,435 Depreciation and impairment At 1 May 2013 (113) (969) (23) (1) (1,106)Depreciation charge (20) (99) (4) – (123)Impairment – (2) – – (2)Disposals 6 57 1 – 64Transfers 9 (9) – – –Reclassification to held for sale 6 44 1 – 51Currency translation 10 40 2 1 53At 30 April 2014 (102) (938) (23) – (1,063)Carrying amount At 1 May 2013 527 749 27 68 1,371At 30 April 2014 487 775 24 86 1,372

Financial Statements 107
dssmith.com
106 Financial Statements
Notes to the Consolidated Financial Statements continued
11. PROPERTY, PLANT AND EQUIPMENT CONTINUED
Land and buildings
£m
Plant and equipment
£m
Fixtures and fittings
£m
Under construction
£mTotal
£mCost At 1 May 2013 640 1,718 50 69 2,477Acquisitions – 23 – – 23Additions 11 88 3 68 170Divestments – (1) – – (1)Disposals (9) (62) (2) – (73)Transfers (18) 67 – (49) –Reclassification to held for sale (15) (59) (1) – (75)Currency translation (20) (61) (3) (2) (86)At 30 April 2014 589 1,713 47 86 2,435 Depreciation and impairment At 1 May 2013 (113) (969) (23) (1) (1,106)Depreciation charge (20) (99) (4) – (123)Impairment – (2) – – (2)Disposals 6 57 1 – 64Transfers 9 (9) – – –Reclassification to held for sale 6 44 1 – 51Currency translation 10 40 2 1 53At 30 April 2014 (102) (938) (23) – (1,063)Carrying amount At 1 May 2013 527 749 27 68 1,371At 30 April 2014 487 775 24 86 1,372
Financial Statements 107
12. EQUITY ACCOUNTED INVESTMENTS
2015
£m2014
£mAt 1 May 24 24Disposal (3) –Adoption of IFRS 11 – 3Reclassification 4 –Share of Rubezhansk exceptional charge (7) (3)Currency translation (1) –At 30 April 17 24
In July 2014 the Group acquired the remaining 50% interest in Italmaceri S.r.l.. In accordance with IFRS 10 Consolidated Financial Statements the Group ceased equity accounting for its initial 50% interest on the transaction date when the Group gained control. At 30 April 2015 Italmaceri S.r.l. is accounted for as a 100% owned subsidiary and is fully consolidated into the Group financial statements.
During the year ended 30 April 2014, the Group adopted IFRS 11 Joint Arrangements. As such, the Group’s 50% interest in Italmaceri S.r.l. changed from proportionate consolidation to equity accounting in the prior period, as it was classified as a joint venture.
Principal equity accounted investments Principal country
of operation Ownership interest
Nature of business 2015 2014OJSC Rubezhansk Paper and Packaging Mill (Rubezhansk) Paper and packaging Ukraine 49.6% 49.6%Turkish Group Paper, packaging and recycling Turkey 49.0% 49.0%Lantero Group Packaging Spain 25.0% 25.0%Italmaceri S.r.l. Recycling Italy 100.0% 50.0%
The Group accounts for its investments in Rubezhansk and the Turkish Group using the equity method as associates because the Group has the ability to exercise significant influence over the investment due to the Group’s equity holdings.
Rubezhansk For four months during the year ended 30 April 2015, the foreign exchange rate between the Ukrainian Hryvnia weakened against the US dollar by over 10% in each month driven by the ongoing political unrest in Ukraine. The Group’s share of the resultant post-tax foreign exchange loss on retranslation of the associate’s US dollar loan liability has been classified as an exceptional item in the financial statements for the year (note 4). The Group continues to monitor the carrying values of its interest with particular reference to the ongoing political unrest.
Turkey The Group owns direct and indirect holdings in the following Turkish businesses: Yalova Ambalaj Sanayi ve Ticaret A.S; Kaplamin Ambalaj Sanayi ve Ticaret A. S; OVA Oluklu Mukavva Ambalaj Sanayi. ve Ticaret A. S; Atkasan Atık Değerlendireme San. Ve Tic. A. S and Selkasan Kağit ve Paketleme Malzemeleri Imalat San. Ve Tic. A. S. Direct holdings vary between 2.2% and 49.0%.
Summary of financial information of associates The following items are an aggregate of the financial statements of the Group’s main associates on a 100% basis.
2015
£m2014
£mAssets 304 427Liabilities (168) (185)Revenue 359 473Loss after tax (18) (5)
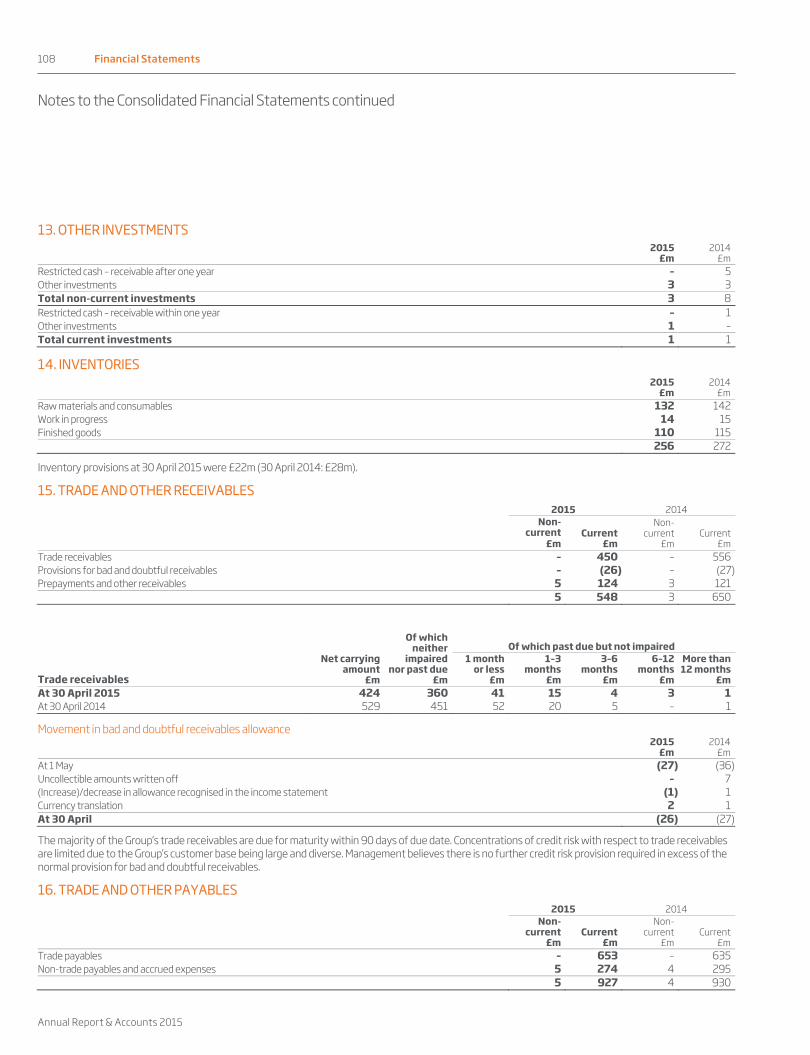
108 Financial Statements
Annual Report & Accounts 2015
108 Financial Statements
Notes to the Consolidated Financial Statements continued
13. OTHER INVESTMENTS
2015
£m2014
£mRestricted cash – receivable after one year – 5Other investments 3 3Total non-current investments 3 8Restricted cash – receivable within one year – 1Other investments 1 –Total current investments 1 1
14. INVENTORIES
2015
£m2014
£mRaw materials and consumables 132 142Work in progress 14 15Finished goods 110 115 256 272
Inventory provisions at 30 April 2015 were £22m (30 April 2014: £28m).
15. TRADE AND OTHER RECEIVABLES 2015 2014
Non-current
£mCurrent
£m
Non-current
£mCurrent
£mTrade receivables – 450 – 556Provisions for bad and doubtful receivables – (26) – (27)Prepayments and other receivables 5 124 3 121 5 548 3 650
Net carrying
amount£m
Of which neither
impaired nor past due
£m
Of which past due but not impaired
Trade receivables
1 monthor less
£m
1–3months
£m
3–6 months
£m
6–12 months
£m
More than12 months
£mAt 30 April 2015 424 360 41 15 4 3 1At 30 April 2014 529 451 52 20 5 – 1
Movement in bad and doubtful receivables allowance
2015
£m2014
£mAt 1 May (27) (36)Uncollectible amounts written off – 7(Increase)/decrease in allowance recognised in the income statement (1) 1Currency translation 2 1At 30 April (26) (27)
The majority of the Group’s trade receivables are due for maturity within 90 days of due date. Concentrations of credit risk with respect to trade receivables are limited due to the Group’s customer base being large and diverse. Management believes there is no further credit risk provision required in excess of the normal provision for bad and doubtful receivables.
16. TRADE AND OTHER PAYABLES 2015 2014
Non-current
£mCurrent
£m
Non-current
£mCurrent
£mTrade payables – 653 – 635Non-trade payables and accrued expenses 5 274 4 295 5 927 4 930

Financial Statements 109
dssmith.com
108 Financial Statements
Notes to the Consolidated Financial Statements continued
13. OTHER INVESTMENTS
2015
£m2014
£mRestricted cash – receivable after one year – 5Other investments 3 3Total non-current investments 3 8Restricted cash – receivable within one year – 1Other investments 1 –Total current investments 1 1
14. INVENTORIES
2015
£m2014
£mRaw materials and consumables 132 142Work in progress 14 15Finished goods 110 115 256 272
Inventory provisions at 30 April 2015 were £22m (30 April 2014: £28m).
15. TRADE AND OTHER RECEIVABLES 2015 2014
Non-current
£mCurrent
£m
Non-current
£mCurrent
£mTrade receivables – 450 – 556Provisions for bad and doubtful receivables – (26) – (27)Prepayments and other receivables 5 124 3 121 5 548 3 650
Net carrying
amount£m
Of which neither
impaired nor past due
£m
Of which past due but not impaired
Trade receivables
1 monthor less
£m
1–3months
£m
3–6 months
£m
6–12 months
£m
More than12 months
£mAt 30 April 2015 424 360 41 15 4 3 1At 30 April 2014 529 451 52 20 5 – 1
Movement in bad and doubtful receivables allowance
2015
£m2014
£mAt 1 May (27) (36)Uncollectible amounts written off – 7(Increase)/decrease in allowance recognised in the income statement (1) 1Currency translation 2 1At 30 April (26) (27)
The majority of the Group’s trade receivables are due for maturity within 90 days of due date. Concentrations of credit risk with respect to trade receivables are limited due to the Group’s customer base being large and diverse. Management believes there is no further credit risk provision required in excess of the normal provision for bad and doubtful receivables.
16. TRADE AND OTHER PAYABLES 2015 2014
Non-current
£mCurrent
£m
Non-current
£mCurrent
£mTrade payables – 653 – 635Non-trade payables and accrued expenses 5 274 4 295 5 927 4 930
Financial Statements 109
17. ASSETS AND LIABILITIES HELD FOR SALE
2015
£m2014
£mIntangible assets 1 2Property, plant and equipment 20 24Inventories 7 9Cash 6 –Trade and other receivables 12 10Total assets held for sale 46 45Trade and other payables (15) (18)Total liabilities held for sale (15) (18)
Assets and liabilities held for sale at 30 April 2015 primarily relate to assets in the UK Paper division and the StePac business in the Plastics division.
18. NET DEBT
2015
£m2014
£mNon-current liabilities (781) (786)Current liabilities (2) (96)Derivative financial instruments 17 (40)Net cash and cash equivalents 82 64Other investments – restricted cash – 6Other deposits 33 25Net debt (651) (827)
The movement in net debt is as follows:
At 1 May 2014
£mReclassification
£m
Continuing operations
cash flow£m
Acquisitions £m
Foreignexchange, fair
value and non-cash
movements£m
At 30 April 2015
£mCash and cash equivalents 98 (6) 10 – (7) 95Overdrafts (34) – 20 – 1 (13)Net cash and cash equivalents 64 (6) 30 – (6) 82Restricted cash – receivable after one year 5 (3) (2) – – –Restricted cash – receivable within one year 1 – (1) – – –Other deposits 25 – 8 – – 33Interest-bearing loans and borrowings due – after one year (782) – 10 (29) 25 (776)Interest-bearing loans and borrowings due – within one year (96) – 104 (1) (8) (1)Finance leases (4) – – – (2) (6)Derivative financial instruments
– assets 4 – – – 17 21– liabilities (44) – 5 – 35 (4)
(891) (3) 124 (30) 67 (733)Net debt (827) (9) 154 (30) 61 (651)
Derivative financial instruments above relate to interest rate and cross-currency swaps used to hedge the Group’s borrowings. The difference between the amounts shown above and the total derivative financial instrument assets and liabilities in the Consolidated Statement of Financial Position relates to derivative financial instruments that hedge forecast foreign currency transactions and the Group’s purchases of energy.
Non-cash movements relate to the write off of unamortised fees of £4m following the refinancing in May 2014, the ongoing amortisation of fees and a new finance lease entered in the year of £2m.
Certain other deposit balances are included, as these short-term receivables have the characteristics of net debt.

110 Financial Statements
Annual Report & Accounts 2015
110 Financial Statements
Notes to the Consolidated Financial Statements continued
19. CASH AND CASH EQUIVALENTS
2015
£m2014
£mBank balances 79 93Short-term deposits 16 5Cash and cash equivalents (Consolidated Statement of Financial Position) 95 98Bank overdrafts (13) (34)Net cash and cash equivalents (Consolidated Statement of Cash Flows) 82 64
20. INTEREST-BEARING LOANS AND BORROWINGS 2015 2014
Current
£m
Non-current
£mTotal
£m Current
£m
Non-current
£mTotal
£mBank and other loans (1) (367) (368) (33) (390) (423)Note purchase agreements
$105m USD private placement 5.66% coupon August 20141 – – – (63) – (63)$95m USD private placement 5.80% coupon August 20162 – (63) (63) – (56) (56)€59m euro private placement shelf facility 4.40% coupon August 2018 – (43) (43) – (49) (49)€59m euro private placement shelf facility 4.83% coupon August 2020 – (43) (43) – (49) (49)$400m USD private placement 4.48% weighted average coupon August 2017-20223 – (260) (260) – (238) (238)
Finance lease liabilities (1) (5) (6) – (4) (4) (2) (781) (783) (96) (786) (882)1 Swapped to floating-rate €87m based on 6 month EURIBOR plus a margin using a cross-currency interest rate swap. This was repaid during the year ended 30 April 2015. 2 Swapped to floating-rate €17m based on 6 month EURIBOR plus a margin, and fixed-rate £41m using cross-currency interest rate swaps. 3 Swapped to fixed-rate £130m and fixed-rate €160m using cross-currency interest rate swaps.
Borrowings are unsecured and measured at amortised cost, except for £14m of note purchase agreements in a fair value hedge relationship (30 April 2014: £77m).
In May 2014, the Group refinanced its committed bank borrowing facilities. The syndicated term loan facility, under which €380m was outstanding at 30 April 2014, was repaid on 23 May 2014, and replaced with a €300m syndicated bank term loan facility maturing in May 2017. This facility bears interest at a margin over EURIBOR. The Group has entered into interest rate swap derivatives with bank counterparties to fix a proportion of the interest on this facility in compliance with Group hedging policy on interest rate risk management.
In addition, on the same date, the £610m syndicated bank revolving credit facility was repaid and replaced with a £800m syndicated bank revolving credit facility maturing in 2019, but with options to extend this facility to 2021. Advances drawn down under the facility bear interest at a margin over the applicable LIBOR or EURIBOR rate. Since the year end the maturity of this facility has been extended to May 2020.
There have been no breaches of covenants during the year ended 30 April 2015 in relation to the above loans and borrowings.
Of the total borrowing facilities available to the Group, the undrawn committed facilities available at 30 April were as follows:
2015£m
2014£m
Expiring between two and five years 649 496
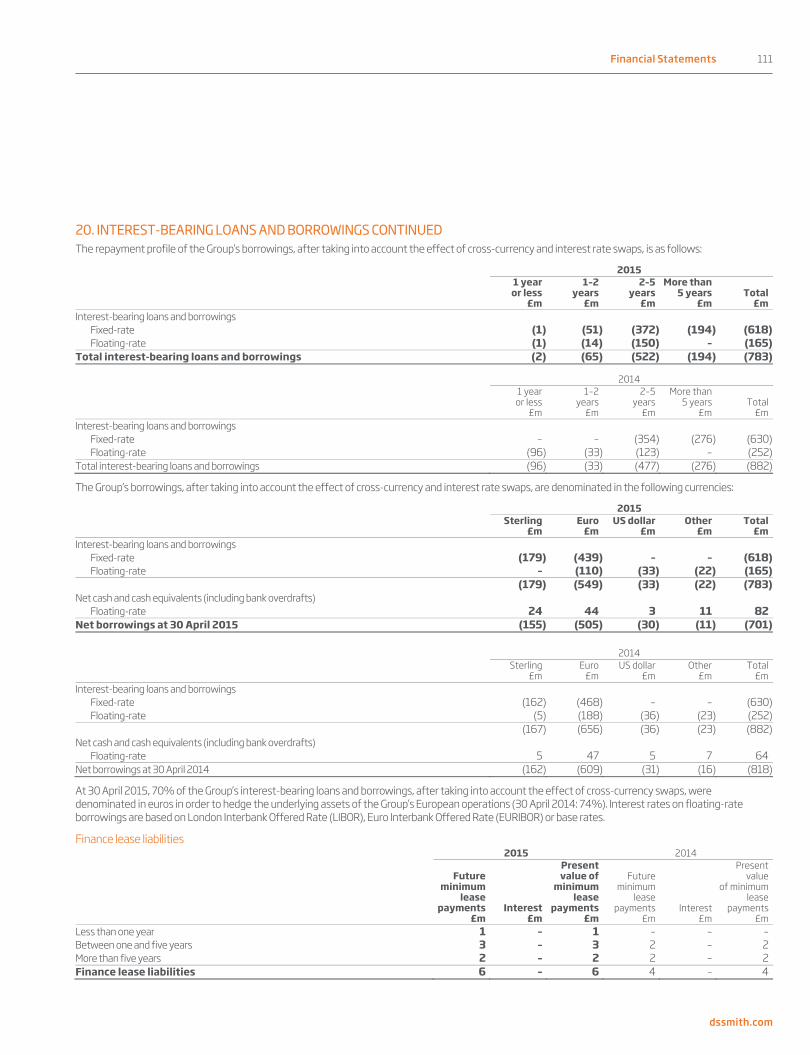
Financial Statements 111
dssmith.com
110 Financial Statements
Notes to the Consolidated Financial Statements continued
19. CASH AND CASH EQUIVALENTS
2015
£m2014
£mBank balances 79 93Short-term deposits 16 5Cash and cash equivalents (Consolidated Statement of Financial Position) 95 98Bank overdrafts (13) (34)Net cash and cash equivalents (Consolidated Statement of Cash Flows) 82 64
20. INTEREST-BEARING LOANS AND BORROWINGS 2015 2014
Current
£m
Non-current
£mTotal
£m Current
£m
Non-current
£mTotal
£mBank and other loans (1) (367) (368) (33) (390) (423)Note purchase agreements
$105m USD private placement 5.66% coupon August 20141 – – – (63) – (63)$95m USD private placement 5.80% coupon August 20162 – (63) (63) – (56) (56)€59m euro private placement shelf facility 4.40% coupon August 2018 – (43) (43) – (49) (49)€59m euro private placement shelf facility 4.83% coupon August 2020 – (43) (43) – (49) (49)$400m USD private placement 4.48% weighted average coupon August 2017-20223 – (260) (260) – (238) (238)
Finance lease liabilities (1) (5) (6) – (4) (4) (2) (781) (783) (96) (786) (882)1 Swapped to floating-rate €87m based on 6 month EURIBOR plus a margin using a cross-currency interest rate swap. This was repaid during the year ended 30 April 2015. 2 Swapped to floating-rate €17m based on 6 month EURIBOR plus a margin, and fixed-rate £41m using cross-currency interest rate swaps. 3 Swapped to fixed-rate £130m and fixed-rate €160m using cross-currency interest rate swaps.
Borrowings are unsecured and measured at amortised cost, except for £14m of note purchase agreements in a fair value hedge relationship (30 April 2014: £77m).
In May 2014, the Group refinanced its committed bank borrowing facilities. The syndicated term loan facility, under which €380m was outstanding at 30 April 2014, was repaid on 23 May 2014, and replaced with a €300m syndicated bank term loan facility maturing in May 2017. This facility bears interest at a margin over EURIBOR. The Group has entered into interest rate swap derivatives with bank counterparties to fix a proportion of the interest on this facility in compliance with Group hedging policy on interest rate risk management.
In addition, on the same date, the £610m syndicated bank revolving credit facility was repaid and replaced with a £800m syndicated bank revolving credit facility maturing in 2019, but with options to extend this facility to 2021. Advances drawn down under the facility bear interest at a margin over the applicable LIBOR or EURIBOR rate. Since the year end the maturity of this facility has been extended to May 2020.
There have been no breaches of covenants during the year ended 30 April 2015 in relation to the above loans and borrowings.
Of the total borrowing facilities available to the Group, the undrawn committed facilities available at 30 April were as follows:
2015£m
2014£m
Expiring between two and five years 649 496
Financial Statements 111
20. INTEREST-BEARING LOANS AND BORROWINGS CONTINUED The repayment profile of the Group’s borrowings, after taking into account the effect of cross-currency and interest rate swaps, is as follows:
2015
1 yearor less
£m
1–2 years
£m
2–5years
£m
More than5 years
£mTotal
£mInterest-bearing loans and borrowings
Fixed-rate (1) (51) (372) (194) (618)Floating-rate (1) (14) (150) – (165)
Total interest-bearing loans and borrowings (2) (65) (522) (194) (783)
2014
1 yearor less
£m
1–2 years
£m
2–5years
£m
More than5 years
£mTotal
£mInterest-bearing loans and borrowings
Fixed-rate – – (354) (276) (630)Floating-rate (96) (33) (123) – (252)
Total interest-bearing loans and borrowings (96) (33) (477) (276) (882)
The Group’s borrowings, after taking into account the effect of cross-currency and interest rate swaps, are denominated in the following currencies:
2015
Sterling
£mEuro
£m US dollar
£mOther
£mTotal
£mInterest-bearing loans and borrowings
Fixed-rate (179) (439) – – (618)Floating-rate – (110) (33) (22) (165)
(179) (549) (33) (22) (783)Net cash and cash equivalents (including bank overdrafts)
Floating-rate 24 44 3 11 82Net borrowings at 30 April 2015 (155) (505) (30) (11) (701) 2014
Sterling
£mEuro
£m US dollar
£mOther
£mTotal
£mInterest-bearing loans and borrowings
Fixed-rate (162) (468) – – (630)Floating-rate (5) (188) (36) (23) (252)
(167) (656) (36) (23) (882)Net cash and cash equivalents (including bank overdrafts)
Floating-rate 5 47 5 7 64Net borrowings at 30 April 2014 (162) (609) (31) (16) (818)
At 30 April 2015, 70% of the Group’s interest-bearing loans and borrowings, after taking into account the effect of cross-currency swaps, were denominated in euros in order to hedge the underlying assets of the Group’s European operations (30 April 2014: 74%). Interest rates on floating-rate borrowings are based on London Interbank Offered Rate (LIBOR), Euro Interbank Offered Rate (EURIBOR) or base rates.
Finance lease liabilities 2015 2014
Future minimum
leasepayments
£mInterest
£m
Present value of
minimum lease
payments £m
Future minimum
leasepayments
£mInterest
£m
Present value
of minimum lease
payments£m
Less than one year 1 – 1 – – –Between one and five years 3 – 3 2 – 2More than five years 2 – 2 2 – 2Finance lease liabilities 6 – 6 4 – 4

112 Financial Statements
Annual Report & Accounts 2015
112 Financial Statements
Notes to the Consolidated Financial Statements continued
21. FINANCIAL INSTRUMENTS The Group’s activities expose the Group to a number of key risks which have the potential to affect its ability to achieve its business objectives. A summary of the Group’s key financial risks and the policies and objectives in place to manage these risks is set out in the Financial Review and Principal Risk sections of the Strategic Report.
The derivative financial instruments set out in this note have been entered into in line with the Group’s risk management objectives.
The Group’s treasury policy prohibits entering into speculative transactions.
(a) Carrying amounts and fair values of financial assets and liabilities Set out below is the accounting classification of the carrying amounts and fair values of all of the Group’s financial assets and liabilities:
2015 2014
Carrying amount
£mFair value
£m
Carrying amount
£mFair value
£mFinancial assets
Cash and cash equivalents 95 95 98 98Other investments – restricted cash – – 6 6Available for sale – other investments 4 4 3 3Loans and receivables 553 553 653 653Derivative financial instruments 37 37 6 6
Total financial assets 689 689 766 766Financial liabilities
Trade and other payables (932) (932) (934) (934)Bank and other loans (368) (368) (423) (423)Note purchase agreements (409) (500) (455) (514)Finance lease liabilities (6) (6) (4) (4)Bank overdrafts (13) (13) (34) (34)Derivative financial instruments (31) (31) (60) (60)
Total financial liabilities (1,759) (1,850) (1,910) (1,969)
The fair value is the amount for which an asset or liability could be exchanged or settled on an arm’s-length basis. For financial instruments carried at fair value, market prices or rates are used to determine fair value where an active market exists. The Group uses forward prices for valuing forward foreign exchange and commodity contracts and uses valuation models with present value calculations based on market yield curves to value note purchase agreements, cross-currency swaps and interest rate swaps. All derivative financial instruments are shown at fair value in the Consolidated Statement of Financial Position.
Under IAS 39 Financial Instruments: Recognition and Measurement, only the portions of the note purchase agreements which form part of an effective fair value hedge are carried at fair value in the Consolidated Statement of Financial Position. The majority of the Group's note purchase agreements are in effective cash flow and net investment hedges and are therefore held at amortised cost. The fair values of financial assets and liabilities which bear floating rates of interest are estimated to be equivalent to their book values.
IFRS 7 Financial Instruments: Disclosures requires the classification of fair value measurements using the fair value hierarchy that reflects the significance of the inputs used in making the assessments.
All of the Group’s financial instruments are Level 2 financial instruments in accordance with the fair value hierarchy, where inputs are observable for the asset and liability, either directly (i.e. as prices) or indirectly (i.e. derived from prices).

Financial Statements 113
dssmith.com
112 Financial Statements
Notes to the Consolidated Financial Statements continued
21. FINANCIAL INSTRUMENTS The Group’s activities expose the Group to a number of key risks which have the potential to affect its ability to achieve its business objectives. A summary of the Group’s key financial risks and the policies and objectives in place to manage these risks is set out in the Financial Review and Principal Risk sections of the Strategic Report.
The derivative financial instruments set out in this note have been entered into in line with the Group’s risk management objectives.
The Group’s treasury policy prohibits entering into speculative transactions.
(a) Carrying amounts and fair values of financial assets and liabilities Set out below is the accounting classification of the carrying amounts and fair values of all of the Group’s financial assets and liabilities:
2015 2014
Carrying amount
£mFair value
£m
Carrying amount
£mFair value
£mFinancial assets
Cash and cash equivalents 95 95 98 98Other investments – restricted cash – – 6 6Available for sale – other investments 4 4 3 3Loans and receivables 553 553 653 653Derivative financial instruments 37 37 6 6
Total financial assets 689 689 766 766Financial liabilities
Trade and other payables (932) (932) (934) (934)Bank and other loans (368) (368) (423) (423)Note purchase agreements (409) (500) (455) (514)Finance lease liabilities (6) (6) (4) (4)Bank overdrafts (13) (13) (34) (34)Derivative financial instruments (31) (31) (60) (60)
Total financial liabilities (1,759) (1,850) (1,910) (1,969)
The fair value is the amount for which an asset or liability could be exchanged or settled on an arm’s-length basis. For financial instruments carried at fair value, market prices or rates are used to determine fair value where an active market exists. The Group uses forward prices for valuing forward foreign exchange and commodity contracts and uses valuation models with present value calculations based on market yield curves to value note purchase agreements, cross-currency swaps and interest rate swaps. All derivative financial instruments are shown at fair value in the Consolidated Statement of Financial Position.
Under IAS 39 Financial Instruments: Recognition and Measurement, only the portions of the note purchase agreements which form part of an effective fair value hedge are carried at fair value in the Consolidated Statement of Financial Position. The majority of the Group's note purchase agreements are in effective cash flow and net investment hedges and are therefore held at amortised cost. The fair values of financial assets and liabilities which bear floating rates of interest are estimated to be equivalent to their book values.
IFRS 7 Financial Instruments: Disclosures requires the classification of fair value measurements using the fair value hierarchy that reflects the significance of the inputs used in making the assessments.
All of the Group’s financial instruments are Level 2 financial instruments in accordance with the fair value hierarchy, where inputs are observable for the asset and liability, either directly (i.e. as prices) or indirectly (i.e. derived from prices).
Financial Statements 113
21. FINANCIAL INSTRUMENTS CONTINUED (b) Derivative financial instruments The Group enters into derivative financial instruments, primarily interest rate, foreign exchange and commodity contracts, to manage the risks associated with the Group’s underlying business activities and the financing of these activities. Derivatives designated as effective hedging instruments are carried at their fair value.
The assets and liabilities of the Group at 30 April in respect of derivative financial instruments are as follows:
Assets Liabilities Net
2015£m
2014£m
2015 £m
2014£m
2015£m
2014£m
Derivatives held to: Manage the interest rate and currency exposures on business activities, borrowings and net investments 21 4 (4) (44) 17 (40)
Derivative financial instruments included in net debt 21 4 (4) (44) 17 (40)Derivatives held to hedge future transactions
Energy costs 16 2 (27) (16) (11) (14)Total derivative financial instruments 37 6 (31) (60) 6 (54) Current 13 2 (18) (20) (5) (18)Non-current 24 4 (13) (40) 11 (36) 37 6 (31) (60) 6 (54)
(c) Cash flow, fair value and net investment hedges (i) Cash flow hedging reserve movements The following table identifies the movements in the cash flow hedging reserve during the year. All figures are post-tax.
2015
£m2014
£mAt 1 May (31) (17)Unrealised fair value gain/(loss) on designated cash flow hedges
Cross-currency and interest rate swaps 3 (4)Commodity contracts (22) (10)
Gain/(loss) recycled from equity to the income statement Commodity contracts 23 –
At 30 April (27) (31)
The gains and losses recycled to the income statement from the cash flow hedging reserve during the year are reflected in the following items in the income statement:
2015
£m2014
£mRevenue – –Cost of sales 23 –Total gain recycled from equity to the income statement during the year 23 –
(ii) Fair value hedges At 30 April 2015, the Group held interest rate and foreign exchange swap contracts as fair value hedges of the interest rate and foreign exchange risk on fixed rate debt payable by the Group. The receive leg of the swap contracts is identical in all critical aspects to the terms of the underlying debt and therefore the hedging is treated as highly effective. The pre-tax gain on hedging derivative instruments taken to the income statement during the year was £5m (2013/14: loss of £11m) offset by a pre-tax loss on the fair value of the debt of £5m (2013/14: gain of £12m).
(iii) Hedges of net investments in foreign operations The Group holds cross-currency interest rate swap contracts as hedges of long-term investments in foreign subsidiaries. The pre-tax gain on the hedges recognised in equity during the year was £30m (2013/14: gain of £7m). This gain is matched by a similar loss in equity on the retranslation of the hedged foreign subsidiary’s net assets resulting in a net gain of £nil (2013/14: net gain of £nil) treated as hedge ineffectiveness in the income statement.

114 Financial Statements
Annual Report & Accounts 2015
114 Financial Statements
Notes to the Consolidated Financial Statements continued
21. FINANCIAL INSTRUMENTS CONTINUED (d) Risk identification and risk management (i) Capital management The Group defines its managed capital as equity as presented in the Consolidated Statement of Financial Position and net debt (see note 18).
2015
£m2014
£mNet debt 651 827Total equity 1,018 1,131Managed capital 1,669 1,958
There have been no changes to the components of managed capital during the year. Managed capital is different from capital employed (defined as property, plant and equipment, goodwill and intangible assets, working capital, capital debtors/creditors, provisions and assets/liabilities held for sale). Managed capital relates to our sources of funding, whereas return on average capital employed is our measure of the level of return being generated by the asset base.
The Group funds its operations from the following sources of capital: operating cash flow, borrowings, shareholders’ equity and, where appropriate, disposals of non-core businesses. The Group’s objective is to achieve a capital structure that results in an appropriate cost of capital whilst providing flexibility in short and medium-term funding so as to accommodate significant investments or acquisitions. The Group also aims to maintain a strong balance sheet and to provide continuity of financing by having a range of maturities and borrowing from a variety of sources.
The Group’s overall treasury objectives are to ensure sufficient funds are available for the Group to carry out its strategy and to manage certain financial risks to which the Group is exposed, as described elsewhere in this note. The Group’s treasury strategy is controlled through the Balance Sheet Committee which meets regularly and includes the Group Finance Director, the Group General Counsel and Company Secretary, the Group Financial Controller, the Group Treasurer and the Group Tax Manager. The Group Treasury function operates in accordance with policies and procedures approved by the Board and controlled by the Group Treasurer. The function arranges funding for the Group, provides a service to operations and implements strategies for financial risk management.
(ii) Market risk Market risk is the risk that the fair value or future cash flows of a financial instrument fluctuate because of a change in market prices. The Group is exposed to changes in interest rates, foreign currency exchange rates and commodity prices.
Interest rate risk The Group is exposed to interest rate risk as borrowings are arranged at fixed interest rates exposing it to fair value risk and floating interest rates exposing it to future cash flow risk. The risk is managed by maintaining a mix of fixed and floating-rate borrowings and by the use of interest rate swap contracts which modify the interest payable on the Group’s underlying debt instruments. The Group’s exposures to interest rates on financial assets and financial liabilities are detailed in the liquidity risk management section of this note.
At 30 April 2015, 79% of the Group’s interest-bearing loans and borrowings were at fixed rates of interest (30 April 2014: 71%). The sensitivity analysis below shows the impact on profit and total equity of a 100 basis points rise in market interest rates (representing management’s assessment of the reasonably possible change in interest rates) in all currencies in which the Group had variable-rate borrowings at 30 April 2015.
To calculate the impact on the income statement for the year, the interest rates on all variable-rate external interest-bearing loans and cash deposits have been increased by 100 basis points, and the resulting increase in the net interest charge has been adjusted for the effect of the Group’s interest rate derivatives. Changes in the carrying value of derivative financial instruments only affect the Group’s income statement.
The results are presented before non-controlling interests and tax.
2015 2014
Impact onprofit
£m
Impact on total
equity £m
Impact onprofit
£m
Impact ontotal equity
£mIncrease in market interest rates by 100 basis points (5) (5) (5) (5)
Under interest rate swap contracts the Group agrees to exchange the difference between fixed and floating interest rate amounts calculated on agreed notional principal amounts. At 30 April 2015, losses of £17m (30 April 2014: losses of £20m) net of tax are deferred in equity in respect of cash flow hedges of interest rate risk. These will be recycled to the income statement in the period in which the hedged item also affects the income statement, which will be during the period to 2022.
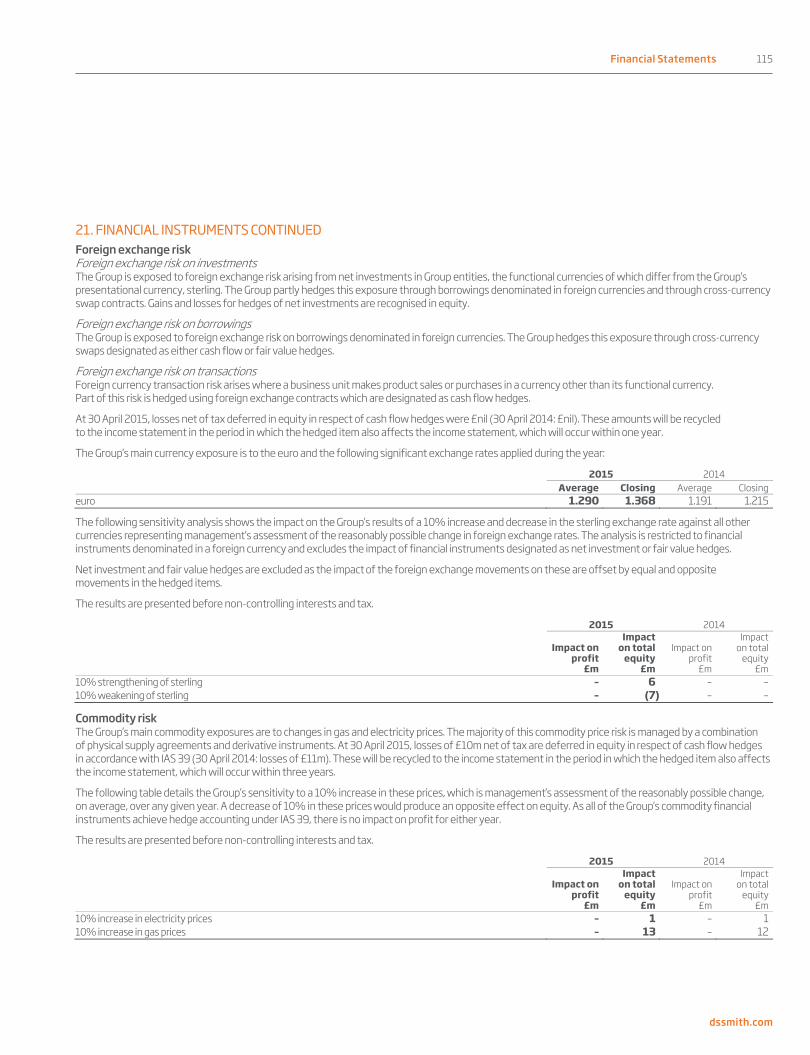
Financial Statements 115
dssmith.com
114 Financial Statements
Notes to the Consolidated Financial Statements continued
21. FINANCIAL INSTRUMENTS CONTINUED (d) Risk identification and risk management (i) Capital management The Group defines its managed capital as equity as presented in the Consolidated Statement of Financial Position and net debt (see note 18).
2015
£m2014
£mNet debt 651 827Total equity 1,018 1,131Managed capital 1,669 1,958
There have been no changes to the components of managed capital during the year. Managed capital is different from capital employed (defined as property, plant and equipment, goodwill and intangible assets, working capital, capital debtors/creditors, provisions and assets/liabilities held for sale). Managed capital relates to our sources of funding, whereas return on average capital employed is our measure of the level of return being generated by the asset base.
The Group funds its operations from the following sources of capital: operating cash flow, borrowings, shareholders’ equity and, where appropriate, disposals of non-core businesses. The Group’s objective is to achieve a capital structure that results in an appropriate cost of capital whilst providing flexibility in short and medium-term funding so as to accommodate significant investments or acquisitions. The Group also aims to maintain a strong balance sheet and to provide continuity of financing by having a range of maturities and borrowing from a variety of sources.
The Group’s overall treasury objectives are to ensure sufficient funds are available for the Group to carry out its strategy and to manage certain financial risks to which the Group is exposed, as described elsewhere in this note. The Group’s treasury strategy is controlled through the Balance Sheet Committee which meets regularly and includes the Group Finance Director, the Group General Counsel and Company Secretary, the Group Financial Controller, the Group Treasurer and the Group Tax Manager. The Group Treasury function operates in accordance with policies and procedures approved by the Board and controlled by the Group Treasurer. The function arranges funding for the Group, provides a service to operations and implements strategies for financial risk management.
(ii) Market risk Market risk is the risk that the fair value or future cash flows of a financial instrument fluctuate because of a change in market prices. The Group is exposed to changes in interest rates, foreign currency exchange rates and commodity prices.
Interest rate risk The Group is exposed to interest rate risk as borrowings are arranged at fixed interest rates exposing it to fair value risk and floating interest rates exposing it to future cash flow risk. The risk is managed by maintaining a mix of fixed and floating-rate borrowings and by the use of interest rate swap contracts which modify the interest payable on the Group’s underlying debt instruments. The Group’s exposures to interest rates on financial assets and financial liabilities are detailed in the liquidity risk management section of this note.
At 30 April 2015, 79% of the Group’s interest-bearing loans and borrowings were at fixed rates of interest (30 April 2014: 71%). The sensitivity analysis below shows the impact on profit and total equity of a 100 basis points rise in market interest rates (representing management’s assessment of the reasonably possible change in interest rates) in all currencies in which the Group had variable-rate borrowings at 30 April 2015.
To calculate the impact on the income statement for the year, the interest rates on all variable-rate external interest-bearing loans and cash deposits have been increased by 100 basis points, and the resulting increase in the net interest charge has been adjusted for the effect of the Group’s interest rate derivatives. Changes in the carrying value of derivative financial instruments only affect the Group’s income statement.
The results are presented before non-controlling interests and tax.
2015 2014
Impact onprofit
£m
Impact on total
equity £m
Impact onprofit
£m
Impact ontotal equity
£mIncrease in market interest rates by 100 basis points (5) (5) (5) (5)
Under interest rate swap contracts the Group agrees to exchange the difference between fixed and floating interest rate amounts calculated on agreed notional principal amounts. At 30 April 2015, losses of £17m (30 April 2014: losses of £20m) net of tax are deferred in equity in respect of cash flow hedges of interest rate risk. These will be recycled to the income statement in the period in which the hedged item also affects the income statement, which will be during the period to 2022.
Financial Statements 115
21. FINANCIAL INSTRUMENTS CONTINUED Foreign exchange risk Foreign exchange risk on investments The Group is exposed to foreign exchange risk arising from net investments in Group entities, the functional currencies of which differ from the Group’s presentational currency, sterling. The Group partly hedges this exposure through borrowings denominated in foreign currencies and through cross-currency swap contracts. Gains and losses for hedges of net investments are recognised in equity.
Foreign exchange risk on borrowings The Group is exposed to foreign exchange risk on borrowings denominated in foreign currencies. The Group hedges this exposure through cross-currency swaps designated as either cash flow or fair value hedges.
Foreign exchange risk on transactions Foreign currency transaction risk arises where a business unit makes product sales or purchases in a currency other than its functional currency. Part of this risk is hedged using foreign exchange contracts which are designated as cash flow hedges.
At 30 April 2015, losses net of tax deferred in equity in respect of cash flow hedges were £nil (30 April 2014: £nil). These amounts will be recycled to the income statement in the period in which the hedged item also affects the income statement, which will occur within one year.
The Group’s main currency exposure is to the euro and the following significant exchange rates applied during the year:
2015 2014 Average Closing Average Closingeuro 1.290 1.368 1.191 1.215
The following sensitivity analysis shows the impact on the Group’s results of a 10% increase and decrease in the sterling exchange rate against all other currencies representing management’s assessment of the reasonably possible change in foreign exchange rates. The analysis is restricted to financial instruments denominated in a foreign currency and excludes the impact of financial instruments designated as net investment or fair value hedges.
Net investment and fair value hedges are excluded as the impact of the foreign exchange movements on these are offset by equal and opposite movements in the hedged items.
The results are presented before non-controlling interests and tax.
2015 2014
Impact on profit
£m
Impacton total
equity£m
Impact onprofit
£m
Impact on total
equity£m
10% strengthening of sterling – 6 – –10% weakening of sterling – (7) – –
Commodity risk The Group’s main commodity exposures are to changes in gas and electricity prices. The majority of this commodity price risk is managed by a combination of physical supply agreements and derivative instruments. At 30 April 2015, losses of £10m net of tax are deferred in equity in respect of cash flow hedges in accordance with IAS 39 (30 April 2014: losses of £11m). These will be recycled to the income statement in the period in which the hedged item also affects the income statement, which will occur within three years.
The following table details the Group’s sensitivity to a 10% increase in these prices, which is management’s assessment of the reasonably possible change, on average, over any given year. A decrease of 10% in these prices would produce an opposite effect on equity. As all of the Group’s commodity financial instruments achieve hedge accounting under IAS 39, there is no impact on profit for either year.
The results are presented before non-controlling interests and tax.
2015 2014
Impact on profit
£m
Impacton total
equity£m
Impact onprofit
£m
Impact on total
equity£m
10% increase in electricity prices – 1 – 110% increase in gas prices – 13 – 12

116 Financial Statements
Annual Report & Accounts 2015
116 Financial Statements
Notes to the Consolidated Financial Statements continued
21. FINANCIAL INSTRUMENTS CONTINUED (d) Risk identification and risk management continued (iii) Credit risk Credit risk is the risk that a customer or counterparty to a financial instrument will fail to perform or fail to pay amounts due, causing financial loss to the Group. In the current economic environment, the Group has placed increased emphasis on the management of credit risk. The carrying amount of financial assets at 30 April 2015 was £689m and is analysed in note 21(a). This represents the maximum credit risk exposure.
Credit risk on financial instruments held with financial institutions is assessed and managed by reference to the long-term credit ratings assigned to that counterparty by Standard & Poor’s and Moody’s credit rating agencies. There are no significant concentrations of credit risk.
See note 15 for information on credit risk with respect to trade receivables.
(iv) Liquidity risk Liquidity risk is the risk that the Group, although solvent, will have difficulty in meeting its obligations associated with its financial liabilities as they fall due.
The Group manages its liquidity risk by maintaining a sufficient level of undrawn committed borrowing facilities. At 30 April 2015, the Group had £649m of undrawn committed borrowing facilities (30 April 2014: £496m). The Group mitigates its refinancing risk by raising its debt requirements from a number of different sources with a range of maturities.
The following table is an analysis of the undiscounted contractual maturities of financial liabilities (including the effect of cross-currency and interest rate swaps).
Contractual repayments
At 30 April 2015 Total
£m
1 year or less
£m
1–5years
£m
More than5 years
£mNon-derivative financial liabilities
Trade and other payables 932 927 5 –Bank and other loans 372 – 372 –Note purchase agreements 409 – 165 244Finance lease liabilities 6 2 3 1Bank overdrafts 13 13 – –Interest payments on borrowings 103 21 59 23
Total non-derivative financial liabilities 1,835 963 604 268
Contractual repayments
At 30 April 2014 Total
£m
1 year or less
£m
1–5years
£m
More than5 years
£mNon-derivative financial liabilities
Trade and other payables 934 930 4 –Bank and other loans 427 33 394 –Note purchase agreements 484 71 116 297Finance lease liabilities 4 – 1 3Bank overdrafts 34 34 – –Interest payments on borrowings 132 37 69 26
Total non-derivative financial liabilities 2,015 1,105 584 326
Refer to note 29 for an analysis of the Group’s future operating lease payments and to note 30 for a summary of the Group’s capital commitments.
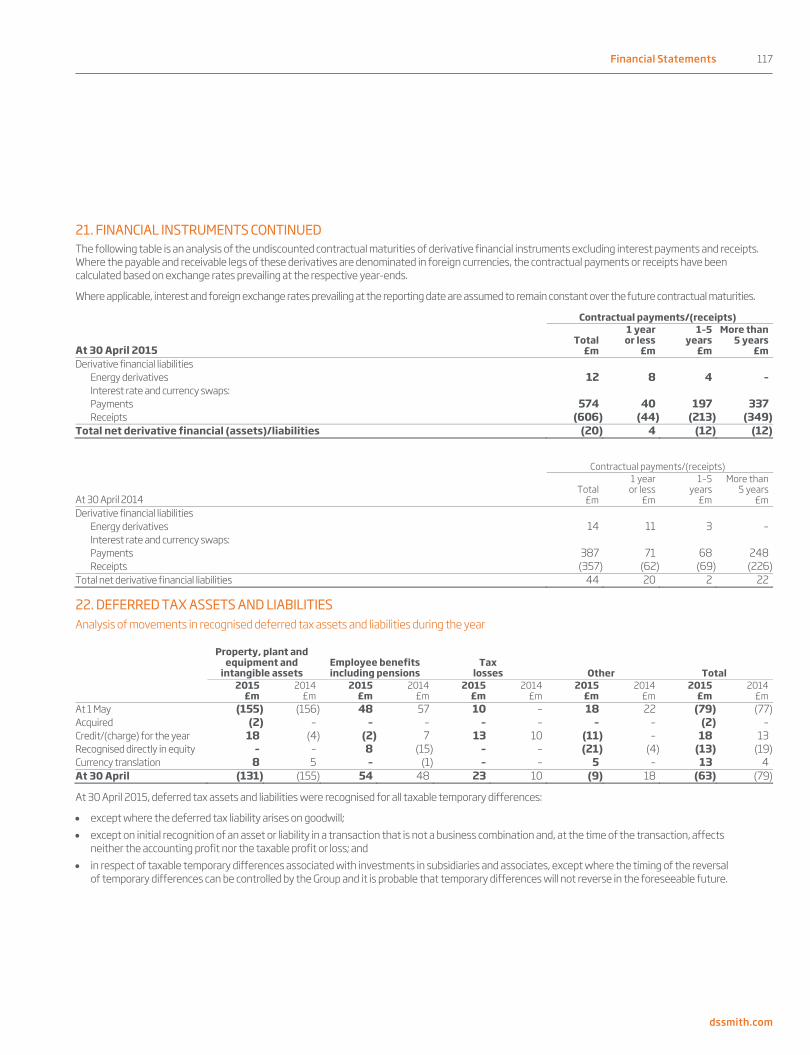
Financial Statements 117
dssmith.com
116 Financial Statements
Notes to the Consolidated Financial Statements continued
21. FINANCIAL INSTRUMENTS CONTINUED (d) Risk identification and risk management continued (iii) Credit risk Credit risk is the risk that a customer or counterparty to a financial instrument will fail to perform or fail to pay amounts due, causing financial loss to the Group. In the current economic environment, the Group has placed increased emphasis on the management of credit risk. The carrying amount of financial assets at 30 April 2015 was £689m and is analysed in note 21(a). This represents the maximum credit risk exposure.
Credit risk on financial instruments held with financial institutions is assessed and managed by reference to the long-term credit ratings assigned to that counterparty by Standard & Poor’s and Moody’s credit rating agencies. There are no significant concentrations of credit risk.
See note 15 for information on credit risk with respect to trade receivables.
(iv) Liquidity risk Liquidity risk is the risk that the Group, although solvent, will have difficulty in meeting its obligations associated with its financial liabilities as they fall due.
The Group manages its liquidity risk by maintaining a sufficient level of undrawn committed borrowing facilities. At 30 April 2015, the Group had £649m of undrawn committed borrowing facilities (30 April 2014: £496m). The Group mitigates its refinancing risk by raising its debt requirements from a number of different sources with a range of maturities.
The following table is an analysis of the undiscounted contractual maturities of financial liabilities (including the effect of cross-currency and interest rate swaps).
Contractual repayments
At 30 April 2015 Total
£m
1 year or less
£m
1–5years
£m
More than5 years
£mNon-derivative financial liabilities
Trade and other payables 932 927 5 –Bank and other loans 372 – 372 –Note purchase agreements 409 – 165 244Finance lease liabilities 6 2 3 1Bank overdrafts 13 13 – –Interest payments on borrowings 103 21 59 23
Total non-derivative financial liabilities 1,835 963 604 268
Contractual repayments
At 30 April 2014 Total
£m
1 year or less
£m
1–5years
£m
More than5 years
£mNon-derivative financial liabilities
Trade and other payables 934 930 4 –Bank and other loans 427 33 394 –Note purchase agreements 484 71 116 297Finance lease liabilities 4 – 1 3Bank overdrafts 34 34 – –Interest payments on borrowings 132 37 69 26
Total non-derivative financial liabilities 2,015 1,105 584 326
Refer to note 29 for an analysis of the Group’s future operating lease payments and to note 30 for a summary of the Group’s capital commitments.
Financial Statements 117
21. FINANCIAL INSTRUMENTS CONTINUED The following table is an analysis of the undiscounted contractual maturities of derivative financial instruments excluding interest payments and receipts. Where the payable and receivable legs of these derivatives are denominated in foreign currencies, the contractual payments or receipts have been calculated based on exchange rates prevailing at the respective year-ends.
Where applicable, interest and foreign exchange rates prevailing at the reporting date are assumed to remain constant over the future contractual maturities.
Contractual payments/(receipts)
At 30 April 2015 Total
£m
1 yearor less
£m
1–5 years
£m
More than5 years
£mDerivative financial liabilities
Energy derivatives 12 8 4 –Interest rate and currency swaps: Payments 574 40 197 337Receipts (606) (44) (213) (349)
Total net derivative financial (assets)/liabilities (20) 4 (12) (12)
Contractual payments/(receipts)
At 30 April 2014 Total
£m
1 yearor less
£m
1–5 years
£m
More than5 years
£mDerivative financial liabilities
Energy derivatives 14 11 3 –Interest rate and currency swaps: Payments 387 71 68 248Receipts (357) (62) (69) (226)
Total net derivative financial liabilities 44 20 2 22
22. DEFERRED TAX ASSETS AND LIABILITIES Analysis of movements in recognised deferred tax assets and liabilities during the year
Property, plant and equipment and
intangible assets Employee benefits including pensions
Tax losses Other Total
2015
£m 2014
£m 2015
£m2014
£m2015
£m2014
£m2015
£m 2014
£m2015
£m2014
£mAt 1 May (155) (156) 48 57 10 – 18 22 (79) (77)Acquired (2) – – – – – – – (2) –Credit/(charge) for the year 18 (4) (2) 7 13 10 (11) – 18 13Recognised directly in equity – – 8 (15) – – (21) (4) (13) (19)Currency translation 8 5 – (1) – – 5 – 13 4At 30 April (131) (155) 54 48 23 10 (9) 18 (63) (79)
At 30 April 2015, deferred tax assets and liabilities were recognised for all taxable temporary differences:
except where the deferred tax liability arises on goodwill; except on initial recognition of an asset or liability in a transaction that is not a business combination and, at the time of the transaction, affects
neither the accounting profit nor the taxable profit or loss; and in respect of taxable temporary differences associated with investments in subsidiaries and associates, except where the timing of the reversal
of temporary differences can be controlled by the Group and it is probable that temporary differences will not reverse in the foreseeable future.

118 Financial Statements
Annual Report & Accounts 2015
118 Financial Statements
Notes to the Consolidated Financial Statements continued
22. DEFERRED TAX ASSETS AND LIABILITIES CONTINUED Recognised deferred tax assets and liabilities Deferred tax assets and liabilities are offset where the Group has a legally enforceable right to do so. The following is the analysis of the deferred tax balances (after offset) for financial reporting purposes:
2015
£m2014
£mDeferred tax liabilities (121) (163)Deferred tax assets 58 84Net deferred tax (63) (79)
The Group has total unrecognised deferred tax assets relating to tax losses of £9m (30 April 2014: £13m). These losses do not expire under current tax legislation. Deferred tax assets have not been recognised in respect of these items because it is not probable that future taxable profit will be available against which the Group can utilise these benefits.
No deferred tax liability is recognised on temporary differences of £286m (30 April 2014: £206m) relating to unremitted earnings of overseas subsidiaries as the Group is able to control the timing of the reversal of these temporary differences and it is probable that they will not reverse in the foreseeable future. The temporary differences at 30 April 2015 represent only the unremitted earnings of those overseas subsidiaries where remittance to the UK of those earnings may still result in a tax liability, principally as a result of dividend withholding taxes levied by the overseas jurisdiction in which these subsidiaries operate.
23. PROVISIONS
Restructuring
£m Other
£mTotal
£mAt 1 May 2014 28 44 72Charged to income 30 14 44Credited to income (6) (1) (7)Utilised (42) (28) (70)Reclassification 6 – 6Currency translation (1) (3) (4)At 30 April 2015 15 26 41 Non-current 1 6 7Current 14 20 34 15 26 41
The restructuring provision includes amounts associated with the closures, restructuring and integration costs described in note 4. Other provisions mainly relate to site restorations and to provisions for vacant leaseholds and various legal claims. The timing of the utilisation of these provisions is uncertain, except where the associated costs are contractual, in which case the provision is utilised over the time period specified in the contract.
24. CAPITAL AND RESERVES Share capital Number of shares
2015
Millions2014
Millions 2015
£m2014
£mOrdinary equity shares of 10 pence each:
Issued, allotted, called up and fully paid 942 939 94 94
During the year ended 30 April 2015, 2,748,030 ordinary shares of 10 pence each were issued as a result of exercises of employee share options. The net movement in share capital and share premium is disclosed in the Consolidated Statement of Changes in Equity.
The holders of ordinary shares are entitled to receive dividends as declared from time to time and are entitled to one vote per share at meetings of the Company. In respect of the Company’s shares that are held by the Group (see overleaf), all rights are suspended until those shares are reissued.
Translation reserve The translation reserve comprises all foreign exchange differences arising from the translation of the financial statements of foreign operations and the translation of liabilities that hedge the Company’s net investment in a foreign subsidiary.

Financial Statements 119
dssmith.com
118 Financial Statements
Notes to the Consolidated Financial Statements continued
22. DEFERRED TAX ASSETS AND LIABILITIES CONTINUED Recognised deferred tax assets and liabilities Deferred tax assets and liabilities are offset where the Group has a legally enforceable right to do so. The following is the analysis of the deferred tax balances (after offset) for financial reporting purposes:
2015
£m2014
£mDeferred tax liabilities (121) (163)Deferred tax assets 58 84Net deferred tax (63) (79)
The Group has total unrecognised deferred tax assets relating to tax losses of £9m (30 April 2014: £13m). These losses do not expire under current tax legislation. Deferred tax assets have not been recognised in respect of these items because it is not probable that future taxable profit will be available against which the Group can utilise these benefits.
No deferred tax liability is recognised on temporary differences of £286m (30 April 2014: £206m) relating to unremitted earnings of overseas subsidiaries as the Group is able to control the timing of the reversal of these temporary differences and it is probable that they will not reverse in the foreseeable future. The temporary differences at 30 April 2015 represent only the unremitted earnings of those overseas subsidiaries where remittance to the UK of those earnings may still result in a tax liability, principally as a result of dividend withholding taxes levied by the overseas jurisdiction in which these subsidiaries operate.
23. PROVISIONS
Restructuring
£m Other
£mTotal
£mAt 1 May 2014 28 44 72Charged to income 30 14 44Credited to income (6) (1) (7)Utilised (42) (28) (70)Reclassification 6 – 6Currency translation (1) (3) (4)At 30 April 2015 15 26 41 Non-current 1 6 7Current 14 20 34 15 26 41
The restructuring provision includes amounts associated with the closures, restructuring and integration costs described in note 4. Other provisions mainly relate to site restorations and to provisions for vacant leaseholds and various legal claims. The timing of the utilisation of these provisions is uncertain, except where the associated costs are contractual, in which case the provision is utilised over the time period specified in the contract.
24. CAPITAL AND RESERVES Share capital Number of shares
2015
Millions2014
Millions 2015
£m2014
£mOrdinary equity shares of 10 pence each:
Issued, allotted, called up and fully paid 942 939 94 94
During the year ended 30 April 2015, 2,748,030 ordinary shares of 10 pence each were issued as a result of exercises of employee share options. The net movement in share capital and share premium is disclosed in the Consolidated Statement of Changes in Equity.
The holders of ordinary shares are entitled to receive dividends as declared from time to time and are entitled to one vote per share at meetings of the Company. In respect of the Company’s shares that are held by the Group (see overleaf), all rights are suspended until those shares are reissued.
Translation reserve The translation reserve comprises all foreign exchange differences arising from the translation of the financial statements of foreign operations and the translation of liabilities that hedge the Company’s net investment in a foreign subsidiary.
Financial Statements 119
24. CAPITAL AND RESERVES CONTINUED Hedging reserve The hedging reserve comprises the effective portion of the cumulative net change in the fair value of cash flow hedging instruments related to hedged transactions that have not yet occurred.
Share premium The share premium account represents the difference between the issue price and the nominal value of shares issued.
Own shares The reserve for the Company’s own shares comprises the cost of the Company’s shares held by the Group. The Group operates a General Employee Benefit Trust, which acquires shares in the Company that can be used to satisfy the requirements of the Performance Share Plan and the Share Matching Plan. At 30 April 2015, the Trust held 0.1m shares (30 April 2014: 0.5m shares). The market value of the shares at 30 April 2015 was £0.3m (30 April 2014: £2m). Dividends receivable on the shares owned by the Trust have been waived.
Non-controlling interests The Group has various put options in relation to subsidiaries with non-controlling interests. The Group records a liability at the net present value of the expected future payments, with a corresponding entry against non-controlling interests in respect of the non-controlling shareholders’ put option, measured at fair value. At the end of each period, the valuation of the liability is reassessed with any changes recorded within finance costs through the income statement and then transferred out of retained earnings into non-controlling interests.
25. EMPLOYEE BENEFITS Total UK Overseas
Balance sheet 2015
£m2014
£m2015
£m 2014
£m 2015
£m2014
£mPresent value of post-retirement obligations (1,197) (1,042) (1,063) (932) (134) (110) Fair value of plan assets Equities/multi-strategy 568 525 560 514 8 11Debt instruments 410 352 388 341 22 11Insurance contracts 6 21 – – 6 21Cash and cash equivalents 12 9 6 5 6 4Other 6 1 – – 6 1 1,002 908 954 860 48 48Net post-retirement plan deficit (195) (134) (109) (72) (86) (62)Other employee benefit liabilities (5) (17) – – (5) (17)Total employee benefit liabilities (200) (151) (109) (72) (91) (79)Related deferred tax asset 48 40 22 14 26 26Net employee benefit liabilities (152) (111) (87) (58) (65) (53)
Employee benefit schemes At 30 April 2015, the Group operated a number of employee benefit arrangements for the benefit of its employees throughout the world. The plans are provided through both defined benefit and defined contribution arrangements and their legal status and control vary depending on the conditions and practices in the countries concerned.
Pension scheme trustees and representatives of the Group work with those managing the employee benefit arrangements to monitor the effects on the arrangements of changes in financial markets and the impact of uncertainty in assumption, and to develop strategies that could mitigate the risks to which these employee benefit schemes expose the Group.
UK schemes The DS Smith Group Pension Scheme (the ‘Group Scheme’) is a UK funded final salary defined benefit scheme providing pensions and lump sum benefits to members and dependants. The Group Scheme closed to future accrual from 30 April 2011 with pensions calculated based on pensionable salaries up to the point of closure (or the date of leaving the Group Scheme, if earlier). The Group Scheme has a normal retirement age of 65 although some members are able to take their benefits earlier than this. Increases to pensions are affected by changes in the rate of inflation for the majority of members.
The Group Scheme is governed by a Trustee Company (DS Smith Pension Trustees Limited), which is comprised of a Board of Trustee Directors (the ‘Trustee Board’) and is independent of the Group. The Trustee Board is responsible for managing the operation, funding and investment strategy of the Group Scheme.

120 Financial Statements
Annual Report & Accounts 2015
120 Financial Statements
Notes to the Consolidated Financial Statements continued
25. EMPLOYEE BENEFITS CONTINUED UK schemes continued UK legislation requires the Trustee Board to carry out valuations at least every three years and to target full funding over an appropriate period of time, taking into account the current circumstances of the Group Scheme and employer on a basis that prudently reflects the risk to which the Group Scheme is exposed. The most recent valuation was carried out as at 30 April 2013, following which a deficit recovery plan was agreed with the Trustee Board on 18 July 2014. This recovery plan agreed that the Group would remove the deficit by paying annual contributions, starting at £15.7m in the year ended 30 April 2015 and increasing by 2% per annum, for a period of 8 years and 9 months, such that the final contribution is made by 31 January 2023.
As part of the 30 April 2010 valuation, the Trustee Board and the Group agreed to put in place a secondary Long-Term Funding Target (the ‘LTFT’), in addition to the statutory funding requirement, the purpose of which is to achieve material additional security for the Group Scheme’s members. The objective of the LTFT is for the Group Scheme to be funded to a level by 30 April 2035 that does not rely on contributions from the employer.
The Group Scheme’s assets are invested in a diversified range of assets, as noted above. A portion of the assets are invested in inflation-indexed bonds to provide a partial hedge against inflation and the Group Scheme has agreed a process that moves assets from corporate bonds to index-linked gilts when specific financial targets or triggers are met. If inflation increases, the Group Scheme’s obligation will be likely to increase more than the change in the fair value of the assets which would result in an increase in the net liability. The Group Scheme’s overseas equity is exposed to currency risk and approximately 50% of this exposure is hedged back to sterling. To help the Trustee Board to monitor, review and assess investment matters, the Investment and Funding Committee (the ‘IFC’), which consists of representatives from the Trustee Board and the Group, meets on a quarterly basis throughout the year.
The Group Scheme exposes the Group to risks, such as longevity risk, currency risk, inflation risk, interest rate risk and investment risk. As the Group Scheme’s obligation is to provide lifetime pension benefits to members upon retirement, increases in life expectancy will result in an increase in the Group Scheme’s liabilities. Other assumptions used to value the defined benefit obligation are also uncertain.
The largest defined contribution arrangement operated by the Group is in the UK. The UK defined contribution scheme is a trust-based arrangement offering members a range of investments. All assets are held independently from the Group. The Group also operates a small unfunded arrangement in the UK.
Overseas schemes The countries where the Group operates the most significant defined benefit post-retirement arrangements are:
France – various mandatory retirement indemnities, post-retirement medical plans and jubilee arrangements (benefits paid to employees after completion of a certain number of years of service) the majority of which are determined by the applicable Collective Bargaining Agreement;
Italy – mandatory end-of-service lump sum benefits in respect of pre-2007 service; Switzerland – funded scheme, affiliated to a fully insured joint foundation; Germany – jubilee arrangements and non-contributory defined benefit pension schemes; and Netherlands – transitional arrangements on closure of defined benefit scheme. In general, local trustees or similar bodies manage the post-retirement and medical plans in accordance with local regulations. Other employee benefits relate to pre-retirement benefits in Germany.
Overseas schemes expose the Group to risks such as longevity risk, currency risk, inflation risk, interest rate risk, investment risk, life expectancy risk and healthcare cost risk. Actions taken by the local regulator, or changes to legislation, could result in stronger local funding requirements for pension schemes, which could affect the Group’s future cash flow.
Movements in the liability for employee benefit plans’ obligations recognised in the Consolidated Statement of Financial Position
2015
£m2014
£mSchemes’ liabilities at 1 May (1,059) (1,146)Interest cost (43) (41)Service cost recognised in the Consolidated Income Statement (4) (7)Member contributions (1) (1)Settlement/curtailment 2 30Pension payments 40 41Unfunded benefits paid 6 1Actuarial (losses)/gains – financial assumptions (142) 69Actuarial gains/(losses)– experience 2 (8)Actuarial losses– demographic (6) (1)Currency translation 12 4Reclassification (9) –Schemes’ liabilities at 30 April (1,202) (1,059)

Financial Statements 121
dssmith.com
120 Financial Statements
Notes to the Consolidated Financial Statements continued
25. EMPLOYEE BENEFITS CONTINUED UK schemes continued UK legislation requires the Trustee Board to carry out valuations at least every three years and to target full funding over an appropriate period of time, taking into account the current circumstances of the Group Scheme and employer on a basis that prudently reflects the risk to which the Group Scheme is exposed. The most recent valuation was carried out as at 30 April 2013, following which a deficit recovery plan was agreed with the Trustee Board on 18 July 2014. This recovery plan agreed that the Group would remove the deficit by paying annual contributions, starting at £15.7m in the year ended 30 April 2015 and increasing by 2% per annum, for a period of 8 years and 9 months, such that the final contribution is made by 31 January 2023.
As part of the 30 April 2010 valuation, the Trustee Board and the Group agreed to put in place a secondary Long-Term Funding Target (the ‘LTFT’), in addition to the statutory funding requirement, the purpose of which is to achieve material additional security for the Group Scheme’s members. The objective of the LTFT is for the Group Scheme to be funded to a level by 30 April 2035 that does not rely on contributions from the employer.
The Group Scheme’s assets are invested in a diversified range of assets, as noted above. A portion of the assets are invested in inflation-indexed bonds to provide a partial hedge against inflation and the Group Scheme has agreed a process that moves assets from corporate bonds to index-linked gilts when specific financial targets or triggers are met. If inflation increases, the Group Scheme’s obligation will be likely to increase more than the change in the fair value of the assets which would result in an increase in the net liability. The Group Scheme’s overseas equity is exposed to currency risk and approximately 50% of this exposure is hedged back to sterling. To help the Trustee Board to monitor, review and assess investment matters, the Investment and Funding Committee (the ‘IFC’), which consists of representatives from the Trustee Board and the Group, meets on a quarterly basis throughout the year.
The Group Scheme exposes the Group to risks, such as longevity risk, currency risk, inflation risk, interest rate risk and investment risk. As the Group Scheme’s obligation is to provide lifetime pension benefits to members upon retirement, increases in life expectancy will result in an increase in the Group Scheme’s liabilities. Other assumptions used to value the defined benefit obligation are also uncertain.
The largest defined contribution arrangement operated by the Group is in the UK. The UK defined contribution scheme is a trust-based arrangement offering members a range of investments. All assets are held independently from the Group. The Group also operates a small unfunded arrangement in the UK.
Overseas schemes The countries where the Group operates the most significant defined benefit post-retirement arrangements are:
France – various mandatory retirement indemnities, post-retirement medical plans and jubilee arrangements (benefits paid to employees after completion of a certain number of years of service) the majority of which are determined by the applicable Collective Bargaining Agreement;
Italy – mandatory end-of-service lump sum benefits in respect of pre-2007 service; Switzerland – funded scheme, affiliated to a fully insured joint foundation; Germany – jubilee arrangements and non-contributory defined benefit pension schemes; and Netherlands – transitional arrangements on closure of defined benefit scheme. In general, local trustees or similar bodies manage the post-retirement and medical plans in accordance with local regulations. Other employee benefits relate to pre-retirement benefits in Germany.
Overseas schemes expose the Group to risks such as longevity risk, currency risk, inflation risk, interest rate risk, investment risk, life expectancy risk and healthcare cost risk. Actions taken by the local regulator, or changes to legislation, could result in stronger local funding requirements for pension schemes, which could affect the Group’s future cash flow.
Movements in the liability for employee benefit plans’ obligations recognised in the Consolidated Statement of Financial Position
2015
£m2014
£mSchemes’ liabilities at 1 May (1,059) (1,146)Interest cost (43) (41)Service cost recognised in the Consolidated Income Statement (4) (7)Member contributions (1) (1)Settlement/curtailment 2 30Pension payments 40 41Unfunded benefits paid 6 1Actuarial (losses)/gains – financial assumptions (142) 69Actuarial gains/(losses)– experience 2 (8)Actuarial losses– demographic (6) (1)Currency translation 12 4Reclassification (9) –Schemes’ liabilities at 30 April (1,202) (1,059)
Financial Statements 121
25. EMPLOYEE BENEFITS CONTINUED Movements in the fair value of employee benefit plans’ assets recognised in the Consolidated Statement of Financial Position
2015
£m2014
£mSchemes’ assets at 1 May 908 932Employer contributions 17 19Member contributions 1 1Settlement/curtailment (2) (30)Interest income 39 34Administration expenses paid from schemes assets – (1)Actuarial gains/(losses) 81 (3)Pension payments (40) (41)Currency translation (2) (3)Schemes’ assets at 30 April 1,002 908
Durations and expected payment profile The following table provides information on the distribution of the timing of expected benefit payments for the Group Scheme:
At 30 April 2015
Within 5 years
£m
6 to 10 years
£m
11 to 20 years
£m
21 to 30 years
£m
31 to 40 years
£m
41 to 50 years
£m
Over 50 years
£mProjected benefit payments 191 227 548 502 358 193 78
The weighted average duration for the Group Scheme is 17 years.
The Group made agreed contributions of £16m to the Group Scheme in 2014/15 (2013/14: £15m). A charge over certain assets of the Group has been made as security for certain unfunded arrangements. The Group’s current best estimate of contributions expected to the Group Scheme in the year ending 30 April 2016 is approximately £16m.
Significant actuarial assumptions Principal actuarial assumptions for the Group Scheme are as follows:
2015 2014Discount rate for scheme liabilities 3.5% 4.4%Inflation 2.1% 2.3%Pre-retirement pension increases 1.9% 2.3%Future pension increases for pre 30 April 2005 service 2.2% 2.3%Future pension increases for post 30 April 2005 service 1.8% 2.1%
For other overseas arrangements, the weighted average actuarial assumptions are a discount rate of 1.2% (30 April 2014: 2.7%) and an inflation rate of 1.4% (30 April 2014: 2.4%).
Assumptions regarding future mortality experience are set based on actuarial advice and in accordance with the relevant standard mortality tables in each country. For the Group Scheme at 30 April 2015, the mortality base table used is S1NMA/S1NFA (year of birth) with a +1 year age rating, with CMI 2014 projections with a 1.25% per annum long-term rate of improvement used for future longevity improvement. At 30 April 2014 the mortality base table used is S1NMA/S1NFA (year of birth) with a +1 year age rating, with CMI 2013 projections with a 1.25% per annum long-term rate of improvement used for future longevity improvement. As part of the Group Scheme actuarial valuation exercise the projected life expectancies were as follows:
2015 2014 Male Female Male FemaleLife expectancy at age 65 Member currently aged 65 21.5 23.9 21.4 23.8Member currently aged 45 23.1 25.7 23.2 25.7

122 Financial Statements
Annual Report & Accounts 2015
122 Financial Statements
Notes to the Consolidated Financial Statements continued
25. EMPLOYEE BENEFITS CONTINUED Sensitivity analysis The sensitivity of the liabilities in the Group Scheme to each significant actuarial assumption is summarised in the following table, showing the impact on the defined benefit obligation if each assumption is altered by the amount specified in isolation, whilst assuming that all other variables remain the same. In practice, this approach is not necessarily realistic since some assumptions are related. This sensitivity analysis applies to the defined benefit obligation only and not to the net defined benefit pension liability, the measurement of which depends on a number of factors including the fair value of plan assets.
Increase in pension liability
£m0.5% decrease in discount rate (93)0.5% increase in inflation (64)1 year increase in life expectancy (30)
Expense recognised in the Consolidated Income Statement Total
2015
£m2014
£mPost-retirement benefits current service cost (3) (5)Other employee benefit liabilities current service cost (1) (2)Total service cost (4) (7)Net interest cost on net pension liability (4) (6)Pension Protection Fund levy (2) (1)Employment benefit net finance expense (6) (7)Total expense recognised in the Consolidated Income Statement (10) (14)
Items recognised in other comprehensive (expense)/income Remeasurement of defined benefit obligation – effect of change in financial assumptions (146) 60Return on plan assets excluding amounts included in employment benefit net finance expense 81 (3)Total (losses)/gains recognised in other comprehensive (expense)/income (65) 57
26. SHARE-BASED PAYMENT EXPENSE The Group’s share-based payment arrangements are as follows:
(i) A Performance Share Plan (PSP). Awards under the PSP normally become exercisable after three years subject to remaining in service and the satisfaction of performance conditions measured over the three financial years commencing with the year of grant. Awards have been made under the PSP annually since 2008, originally based on the following performance measures, in the proportions shown below:
i. the Company’s total shareholder return (TSR) compared to the constituents of the Industrial Goods and Services Supersector within the FTSE 250;
ii. average adjusted earnings per share (EPS); and
iii. average adjusted return on average capital employed (ROACE).
Awards since 2010 are subject to three performance measures:
i. 50% of each award based on a TSR component;
ii. 25% of each award based on average adjusted EPS; and
iii. 25% of each award based on average adjusted ROACE.
The 2010 and 2011 awards have vested, but have not yet been fully exercised.
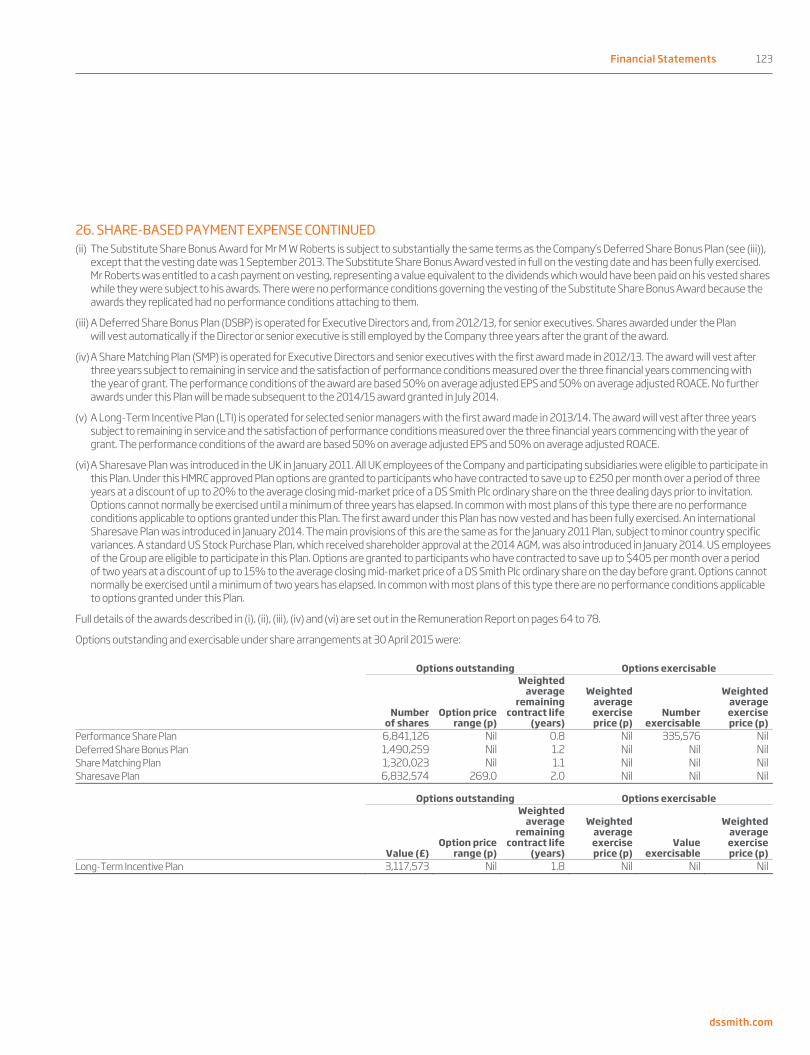
Financial Statements 123
dssmith.com
122 Financial Statements
Notes to the Consolidated Financial Statements continued
25. EMPLOYEE BENEFITS CONTINUED Sensitivity analysis The sensitivity of the liabilities in the Group Scheme to each significant actuarial assumption is summarised in the following table, showing the impact on the defined benefit obligation if each assumption is altered by the amount specified in isolation, whilst assuming that all other variables remain the same. In practice, this approach is not necessarily realistic since some assumptions are related. This sensitivity analysis applies to the defined benefit obligation only and not to the net defined benefit pension liability, the measurement of which depends on a number of factors including the fair value of plan assets.
Increase in pension liability
£m0.5% decrease in discount rate (93)0.5% increase in inflation (64)1 year increase in life expectancy (30)
Expense recognised in the Consolidated Income Statement Total
2015
£m2014
£mPost-retirement benefits current service cost (3) (5)Other employee benefit liabilities current service cost (1) (2)Total service cost (4) (7)Net interest cost on net pension liability (4) (6)Pension Protection Fund levy (2) (1)Employment benefit net finance expense (6) (7)Total expense recognised in the Consolidated Income Statement (10) (14)
Items recognised in other comprehensive (expense)/income Remeasurement of defined benefit obligation – effect of change in financial assumptions (146) 60Return on plan assets excluding amounts included in employment benefit net finance expense 81 (3)Total (losses)/gains recognised in other comprehensive (expense)/income (65) 57
26. SHARE-BASED PAYMENT EXPENSE The Group’s share-based payment arrangements are as follows:
(i) A Performance Share Plan (PSP). Awards under the PSP normally become exercisable after three years subject to remaining in service and the satisfaction of performance conditions measured over the three financial years commencing with the year of grant. Awards have been made under the PSP annually since 2008, originally based on the following performance measures, in the proportions shown below:
i. the Company’s total shareholder return (TSR) compared to the constituents of the Industrial Goods and Services Supersector within the FTSE 250;
ii. average adjusted earnings per share (EPS); and
iii. average adjusted return on average capital employed (ROACE).
Awards since 2010 are subject to three performance measures:
i. 50% of each award based on a TSR component;
ii. 25% of each award based on average adjusted EPS; and
iii. 25% of each award based on average adjusted ROACE.
The 2010 and 2011 awards have vested, but have not yet been fully exercised.
Financial Statements 123
26. SHARE-BASED PAYMENT EXPENSE CONTINUED (ii) The Substitute Share Bonus Award for Mr M W Roberts is subject to substantially the same terms as the Company’s Deferred Share Bonus Plan (see (iii)),
except that the vesting date was 1 September 2013. The Substitute Share Bonus Award vested in full on the vesting date and has been fully exercised. Mr Roberts was entitled to a cash payment on vesting, representing a value equivalent to the dividends which would have been paid on his vested shares while they were subject to his awards. There were no performance conditions governing the vesting of the Substitute Share Bonus Award because the awards they replicated had no performance conditions attaching to them.
(iii) A Deferred Share Bonus Plan (DSBP) is operated for Executive Directors and, from 2012/13, for senior executives. Shares awarded under the Plan will vest automatically if the Director or senior executive is still employed by the Company three years after the grant of the award.
(iv) A Share Matching Plan (SMP) is operated for Executive Directors and senior executives with the first award made in 2012/13. The award will vest after three years subject to remaining in service and the satisfaction of performance conditions measured over the three financial years commencing with the year of grant. The performance conditions of the award are based 50% on average adjusted EPS and 50% on average adjusted ROACE. No further awards under this Plan will be made subsequent to the 2014/15 award granted in July 2014.
(v) A Long-Term Incentive Plan (LTI) is operated for selected senior managers with the first award made in 2013/14. The award will vest after three years subject to remaining in service and the satisfaction of performance conditions measured over the three financial years commencing with the year of grant. The performance conditions of the award are based 50% on average adjusted EPS and 50% on average adjusted ROACE.
(vi) A Sharesave Plan was introduced in the UK in January 2011. All UK employees of the Company and participating subsidiaries were eligible to participate in this Plan. Under this HMRC approved Plan options are granted to participants who have contracted to save up to £250 per month over a period of three years at a discount of up to 20% to the average closing mid-market price of a DS Smith Plc ordinary share on the three dealing days prior to invitation. Options cannot normally be exercised until a minimum of three years has elapsed. In common with most plans of this type there are no performance conditions applicable to options granted under this Plan. The first award under this Plan has now vested and has been fully exercised. An international Sharesave Plan was introduced in January 2014. The main provisions of this are the same as for the January 2011 Plan, subject to minor country specific variances. A standard US Stock Purchase Plan, which received shareholder approval at the 2014 AGM, was also introduced in January 2014. US employees of the Group are eligible to participate in this Plan. Options are granted to participants who have contracted to save up to $405 per month over a period of two years at a discount of up to 15% to the average closing mid-market price of a DS Smith Plc ordinary share on the day before grant. Options cannot normally be exercised until a minimum of two years has elapsed. In common with most plans of this type there are no performance conditions applicable to options granted under this Plan.
Full details of the awards described in (i), (ii), (iii), (iv) and (vi) are set out in the Remuneration Report on pages 64 to 78.
Options outstanding and exercisable under share arrangements at 30 April 2015 were:
Options outstanding Options exercisable
Number
of sharesOption price
range (p)
Weighted average
remainingcontract life
(years)
Weighted average exercise price (p)
Numberexercisable
Weightedaverageexerciseprice (p)
Performance Share Plan 6,841,126 Nil 0.8 Nil 335,576 NilDeferred Share Bonus Plan 1,490,259 Nil 1.2 Nil Nil NilShare Matching Plan 1,320,023 Nil 1.1 Nil Nil NilSharesave Plan 6,832,574 269.0 2.0 Nil Nil Nil
Options outstanding Options exercisable
Value (£)Option price
range (p)
Weighted average
remainingcontract life
(years)
Weighted average exercise price (p)
Valueexercisable
Weightedaverageexerciseprice (p)
Long-Term Incentive Plan 3,117,573 Nil 1.8 Nil Nil Nil
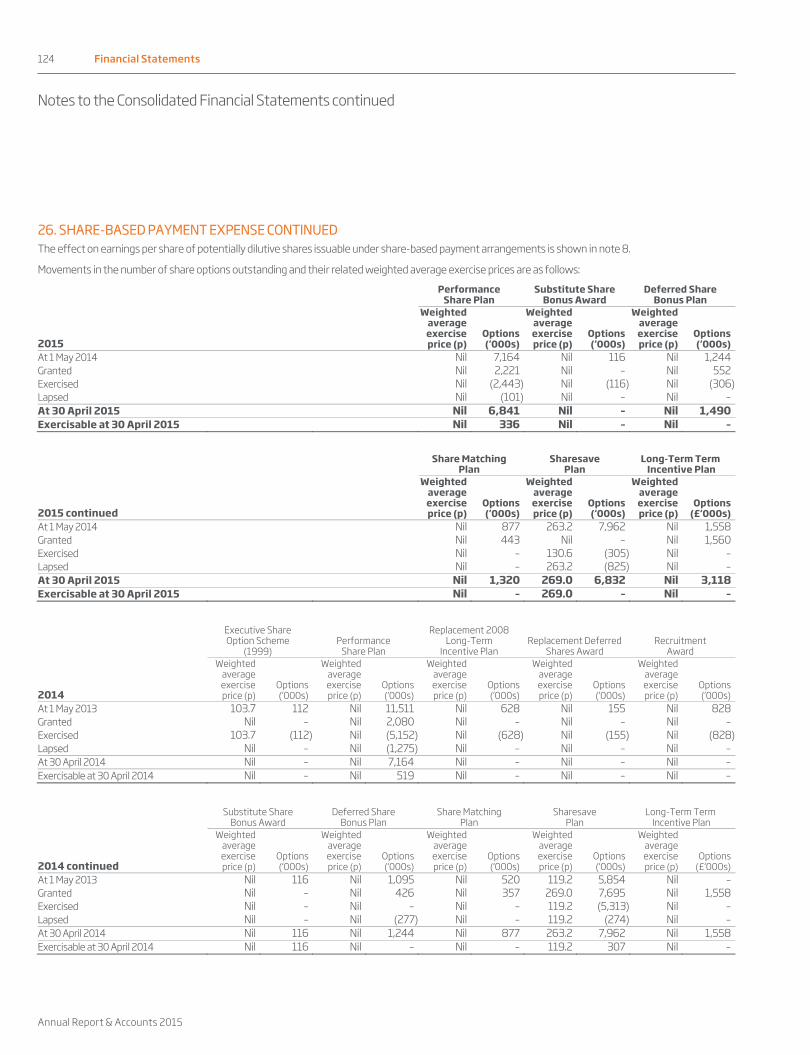
124 Financial Statements
Annual Report & Accounts 2015
124 Financial Statements
Notes to the Consolidated Financial Statements continued
26. SHARE-BASED PAYMENT EXPENSE CONTINUED The effect on earnings per share of potentially dilutive shares issuable under share-based payment arrangements is shown in note 8.
Movements in the number of share options outstanding and their related weighted average exercise prices are as follows:
PerformanceShare Plan
Substitute Share Bonus Award
Deferred Share Bonus Plan
2015
Weighted average exercise price (p)
Options(‘000s)
Weighted average exercise price (p)
Options (‘000s)
Weighted average exercise price (p)
Options(‘000s)
At 1 May 2014 Nil 7,164 Nil 116 Nil 1,244Granted Nil 2,221 Nil – Nil 552Exercised Nil (2,443) Nil (116) Nil (306)Lapsed Nil (101) Nil – Nil –At 30 April 2015 Nil 6,841 Nil – Nil 1,490Exercisable at 30 April 2015 Nil 336 Nil – Nil –
Share Matching
Plan Sharesave
Plan Long-Term Term
Incentive Plan
2015 continued
Weighted average exerciseprice (p)
Options(‘000s)
Weighted average exercise price (p)
Options (‘000s)
Weighted average exercise price (p)
Options(£‘000s)
At 1 May 2014 Nil 877 263.2 7,962 Nil 1,558Granted Nil 443 Nil – Nil 1,560Exercised Nil – 130.6 (305) Nil –Lapsed Nil – 263.2 (825) Nil –At 30 April 2015 Nil 1,320 269.0 6,832 Nil 3,118Exercisable at 30 April 2015 Nil – 269.0 – Nil –
Executive Share Option Scheme
(1999) Performance
Share Plan
Replacement 2008Long-Term
Incentive PlanReplacement Deferred
Shares Award Recruitment
Award
2014
Weighted average exercise price (p)
Options (‘000s)
Weighted average exerciseprice (p)
Options(‘000s)
Weighted average exercise price (p)
Options(‘000s)
Weighted average exercise price (p)
Options (‘000s)
Weighted average exercise price (p)
Options(‘000s)
At 1 May 2013 103.7 112 Nil 11,511 Nil 628 Nil 155 Nil 828Granted Nil – Nil 2,080 Nil – Nil – Nil –Exercised 103.7 (112) Nil (5,152) Nil (628) Nil (155) Nil (828)Lapsed Nil – Nil (1,275) Nil – Nil – Nil –At 30 April 2014 Nil – Nil 7,164 Nil – Nil – Nil –Exercisable at 30 April 2014 Nil – Nil 519 Nil – Nil – Nil –
Substitute Share
Bonus Award Deferred Share
Bonus PlanShare Matching
PlanSharesave
Plan Long-Term Term
Incentive Plan
2014 continued
Weighted average exercise price (p)
Options (‘000s)
Weighted average exercise price (p)
Options(‘000s)
Weighted average exerciseprice (p)
Options(‘000s)
Weighted average exercise price (p)
Options (‘000s)
Weighted average exercise price (p)
Options(£‘000s)
At 1 May 2013 Nil 116 Nil 1,095 Nil 520 119.2 5,854 Nil –Granted Nil – Nil 426 Nil 357 269.0 7,695 Nil 1,558Exercised Nil – Nil – Nil – 119.2 (5,313) Nil –Lapsed Nil – Nil (277) Nil – 119.2 (274) Nil –At 30 April 2014 Nil 116 Nil 1,244 Nil 877 263.2 7,962 Nil 1,558Exercisable at 30 April 2014 Nil 116 Nil – Nil – 119.2 307 Nil –
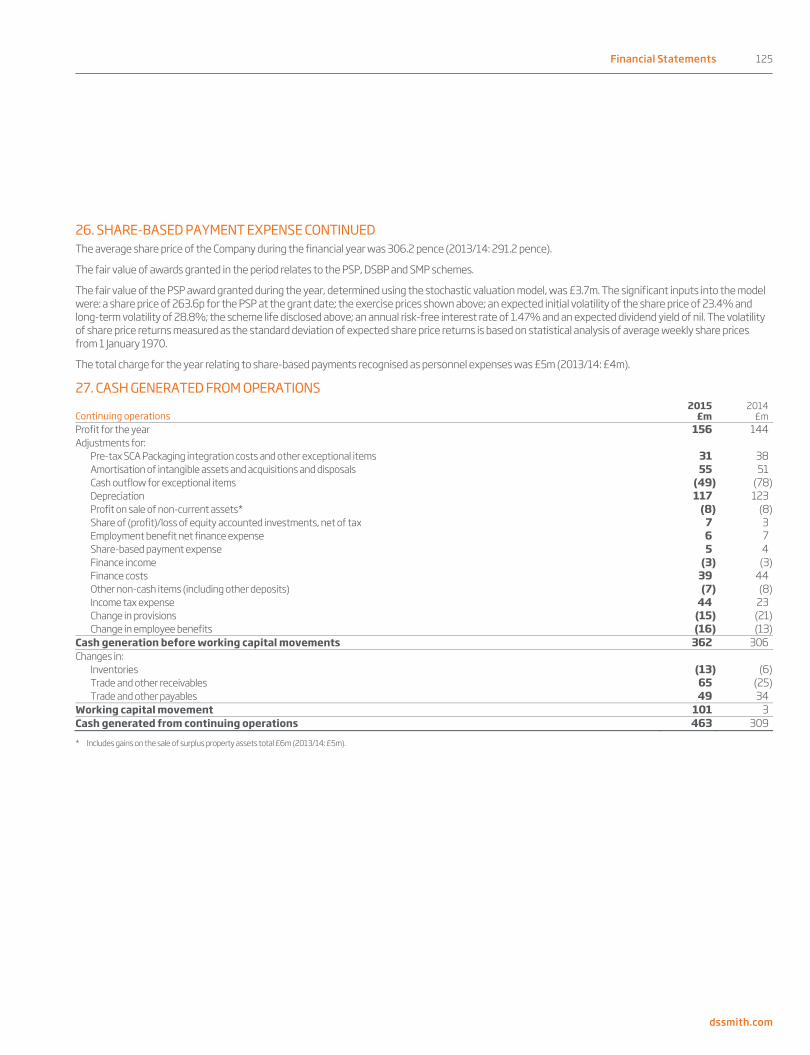
Financial Statements 125
dssmith.com
124 Financial Statements
Notes to the Consolidated Financial Statements continued
26. SHARE-BASED PAYMENT EXPENSE CONTINUED The effect on earnings per share of potentially dilutive shares issuable under share-based payment arrangements is shown in note 8.
Movements in the number of share options outstanding and their related weighted average exercise prices are as follows:
PerformanceShare Plan
Substitute Share Bonus Award
Deferred Share Bonus Plan
2015
Weighted average exercise price (p)
Options(‘000s)
Weighted average exercise price (p)
Options (‘000s)
Weighted average exercise price (p)
Options(‘000s)
At 1 May 2014 Nil 7,164 Nil 116 Nil 1,244Granted Nil 2,221 Nil – Nil 552Exercised Nil (2,443) Nil (116) Nil (306)Lapsed Nil (101) Nil – Nil –At 30 April 2015 Nil 6,841 Nil – Nil 1,490Exercisable at 30 April 2015 Nil 336 Nil – Nil –
Share Matching
Plan Sharesave
Plan Long-Term Term
Incentive Plan
2015 continued
Weighted average exerciseprice (p)
Options(‘000s)
Weighted average exercise price (p)
Options (‘000s)
Weighted average exercise price (p)
Options(£‘000s)
At 1 May 2014 Nil 877 263.2 7,962 Nil 1,558Granted Nil 443 Nil – Nil 1,560Exercised Nil – 130.6 (305) Nil –Lapsed Nil – 263.2 (825) Nil –At 30 April 2015 Nil 1,320 269.0 6,832 Nil 3,118Exercisable at 30 April 2015 Nil – 269.0 – Nil –
Executive Share Option Scheme
(1999) Performance
Share Plan
Replacement 2008Long-Term
Incentive PlanReplacement Deferred
Shares Award Recruitment
Award
2014
Weighted average exercise price (p)
Options (‘000s)
Weighted average exerciseprice (p)
Options(‘000s)
Weighted average exercise price (p)
Options(‘000s)
Weighted average exercise price (p)
Options (‘000s)
Weighted average exercise price (p)
Options(‘000s)
At 1 May 2013 103.7 112 Nil 11,511 Nil 628 Nil 155 Nil 828Granted Nil – Nil 2,080 Nil – Nil – Nil –Exercised 103.7 (112) Nil (5,152) Nil (628) Nil (155) Nil (828)Lapsed Nil – Nil (1,275) Nil – Nil – Nil –At 30 April 2014 Nil – Nil 7,164 Nil – Nil – Nil –Exercisable at 30 April 2014 Nil – Nil 519 Nil – Nil – Nil –
Substitute Share
Bonus Award Deferred Share
Bonus PlanShare Matching
PlanSharesave
Plan Long-Term Term
Incentive Plan
2014 continued
Weighted average exercise price (p)
Options (‘000s)
Weighted average exercise price (p)
Options(‘000s)
Weighted average exerciseprice (p)
Options(‘000s)
Weighted average exercise price (p)
Options (‘000s)
Weighted average exercise price (p)
Options(£‘000s)
At 1 May 2013 Nil 116 Nil 1,095 Nil 520 119.2 5,854 Nil –Granted Nil – Nil 426 Nil 357 269.0 7,695 Nil 1,558Exercised Nil – Nil – Nil – 119.2 (5,313) Nil –Lapsed Nil – Nil (277) Nil – 119.2 (274) Nil –At 30 April 2014 Nil 116 Nil 1,244 Nil 877 263.2 7,962 Nil 1,558Exercisable at 30 April 2014 Nil 116 Nil – Nil – 119.2 307 Nil –
Financial Statements 125
26. SHARE-BASED PAYMENT EXPENSE CONTINUED The average share price of the Company during the financial year was 306.2 pence (2013/14: 291.2 pence).
The fair value of awards granted in the period relates to the PSP, DSBP and SMP schemes.
The fair value of the PSP award granted during the year, determined using the stochastic valuation model, was £3.7m. The significant inputs into the model were: a share price of 263.6p for the PSP at the grant date; the exercise prices shown above; an expected initial volatility of the share price of 23.4% and long-term volatility of 28.8%; the scheme life disclosed above; an annual risk-free interest rate of 1.47% and an expected dividend yield of nil. The volatility of share price returns measured as the standard deviation of expected share price returns is based on statistical analysis of average weekly share prices from 1 January 1970.
The total charge for the year relating to share-based payments recognised as personnel expenses was £5m (2013/14: £4m).
27. CASH GENERATED FROM OPERATIONS
Continuing operations 2015
£m2014
£mProfit for the year 156 144Adjustments for:
Pre-tax SCA Packaging integration costs and other exceptional items 31 38Amortisation of intangible assets and acquisitions and disposals 55 51Cash outflow for exceptional items (49) (78)Depreciation 117 123Profit on sale of non-current assets* (8) (8)Share of (profit)/loss of equity accounted investments, net of tax 7 3Employment benefit net finance expense 6 7Share-based payment expense 5 4Finance income (3) (3)Finance costs 39 44Other non-cash items (including other deposits) (7) (8)Income tax expense 44 23Change in provisions (15) (21)Change in employee benefits (16) (13)
Cash generation before working capital movements 362 306Changes in:
Inventories (13) (6)Trade and other receivables 65 (25)Trade and other payables 49 34
Working capital movement 101 3Cash generated from continuing operations 463 309* Includes gains on the sale of surplus property assets total £6m (2013/14: £5m).

126 Financial Statements
Annual Report & Accounts 2015
126 Financial Statements
Notes to the Consolidated Financial Statements continued
28. RECONCILIATION OF NET CASH FLOW TO MOVEMENT IN NET DEBT
2015
£m2014
£mContinuing operations Operating profit before amortisation and exceptional items 335 307Depreciation 117 123Adjusted EBITDA 452 430Working capital movement 101 3Change in provisions (15) (21)Change in employee benefits (16) (13)Other (4) (5)Cash generated from operations before exceptional cash items 518 394Capital expenditure (167) (174)Proceeds from sale of property, plant and equipment and other investments 18 18Tax paid (28) (55)Net interest paid (34) (43)Free cash flow 307 140Cash outflow for exceptional items (49) (78)Dividends paid to Group shareholders (94) (74)Acquisition of subsidiary businesses, net of cash and cash equivalents (28) (27)Divestment of subsidiary and equity accounted businesses, net of cash and cash equivalents 18 12Net cash flow 154 (27)Proceeds from issue of share capital – 6Reclassification (9) –Loans and borrowings acquired (30) –Net movement on debt 115 (21)Foreign exchange, fair value and other non-cash movements (note 18) 61 15Net debt movement – continuing operations 176 (6)Net debt movement – discontinued operations – (4)Opening net debt (827) (817)Closing net debt (651) (827)
29. OPERATING LEASES Non-cancellable operating lease rentals are payable as follows:
2015
£m2014
£mLess than one year 27 20Between one and five years 45 37More than five years 11 11 83 68
Operating lease payments represent rentals payable by the Group for certain of its properties, machines, vehicles and office equipment.
30. CAPITAL COMMITMENTS AND CONTINGENCIES At 30 April 2015, the Group had committed to incur capital expenditure of £3m (30 April 2014: £3m).
The Group is not subject to a material litigation but has a number of contingent liabilities that arise in the ordinary course of business on behalf of trading subsidiaries including, inter alia, intellectual property disputes and regulatory enquiries on areas such as health and safety, environmental, and anti-trust. No losses are anticipated to arise on these contingent liabilities.
As a result of previous acquisitions, various contingent liabilities were identified and included within provisions, as required by IFRS 3 Business Combinations. Whilst it is difficult to reasonably estimate the ultimate outcome of these claims, the Directors’ best estimate has been updated and included in the closing provision balance at 30 April 2015.
At the reporting date the Group had committed to the acquisition of the Duropack group subject to competition clearance. Clearance was obtained on 31 May 2015. See note 33 for further information.

Financial Statements 127
dssmith.com
126 Financial Statements
Notes to the Consolidated Financial Statements continued
28. RECONCILIATION OF NET CASH FLOW TO MOVEMENT IN NET DEBT
2015
£m2014
£mContinuing operations Operating profit before amortisation and exceptional items 335 307Depreciation 117 123Adjusted EBITDA 452 430Working capital movement 101 3Change in provisions (15) (21)Change in employee benefits (16) (13)Other (4) (5)Cash generated from operations before exceptional cash items 518 394Capital expenditure (167) (174)Proceeds from sale of property, plant and equipment and other investments 18 18Tax paid (28) (55)Net interest paid (34) (43)Free cash flow 307 140Cash outflow for exceptional items (49) (78)Dividends paid to Group shareholders (94) (74)Acquisition of subsidiary businesses, net of cash and cash equivalents (28) (27)Divestment of subsidiary and equity accounted businesses, net of cash and cash equivalents 18 12Net cash flow 154 (27)Proceeds from issue of share capital – 6Reclassification (9) –Loans and borrowings acquired (30) –Net movement on debt 115 (21)Foreign exchange, fair value and other non-cash movements (note 18) 61 15Net debt movement – continuing operations 176 (6)Net debt movement – discontinued operations – (4)Opening net debt (827) (817)Closing net debt (651) (827)
29. OPERATING LEASES Non-cancellable operating lease rentals are payable as follows:
2015
£m2014
£mLess than one year 27 20Between one and five years 45 37More than five years 11 11 83 68
Operating lease payments represent rentals payable by the Group for certain of its properties, machines, vehicles and office equipment.
30. CAPITAL COMMITMENTS AND CONTINGENCIES At 30 April 2015, the Group had committed to incur capital expenditure of £3m (30 April 2014: £3m).
The Group is not subject to a material litigation but has a number of contingent liabilities that arise in the ordinary course of business on behalf of trading subsidiaries including, inter alia, intellectual property disputes and regulatory enquiries on areas such as health and safety, environmental, and anti-trust. No losses are anticipated to arise on these contingent liabilities.
As a result of previous acquisitions, various contingent liabilities were identified and included within provisions, as required by IFRS 3 Business Combinations. Whilst it is difficult to reasonably estimate the ultimate outcome of these claims, the Directors’ best estimate has been updated and included in the closing provision balance at 30 April 2015.
At the reporting date the Group had committed to the acquisition of the Duropack group subject to competition clearance. Clearance was obtained on 31 May 2015. See note 33 for further information.
Financial Statements 127
31. ACQUISITIONS AND DIVESTMENTS (a) 2014/15 acquisitions and disposals During the year ended 30 April 2015, the Group completed various business combination transactions with total cash consideration of £28m (including £1m bank overdraft acquired), and various business disposals with total cash consideration of £18m which are not considered material to the Group individually or in aggregate.
(b) 2013/14 acquisitions and disposals During the year ended 30 April 2014, the Group completed various business combination transactions with total cash consideration of £27m, and various business disposals with total cash consideration of £12m which are not considered material to the Group individually or in aggregate.
(c) Acquisition related costs The Group incurred acquisition related costs of £4m in 2014/15 (2013/14: £4m). In 2014/15 these primarily related to the acquisition of the Andopack Group, the Duropack Group and Italmaceri, as well as other deal costs relating to reviewing potential acquisitions. These costs have been included in administrative expenses in the Consolidated Income Statement within exceptional items.
32. RELATED PARTIES Identity of related parties In the normal course of business the Group undertakes a wide variety of transactions with certain of its subsidiaries and equity accounted investments.
The key management personnel of the Company comprise the Chairman, Executive Directors and non-Executive Directors. The compensation of key management personnel can be found in the Annual Remuneration Report. Certain key management also participate in the Group’s share-based incentive programme (note 26). Included within the share-based payment expense is a charge of £1m (2013/14: £1m) relating to key management.
Other related party transactions
2015
£m2014
£mSales to equity accounted investees 3 35Purchases from equity accounted investees 6 1Amounts due from equity accounted investees 2 10Advances to minority interest 3 3
33. SUBSEQUENT EVENTS (a) Acquisition of Duropack On 31 May 2015, the Group acquired the Duropack business. The acquisition was effected by the purchase of equity of the Duropack business for €305m on a cash, debt and, to the extent legally possible and commercially practicable, pension free basis. This is subject to customary post-completion adjustments.
Duropack, a recycled corrugated board packaging business, has market-leading positions across south eastern Europe, holding the number one or two position in many of the geographies in which it operates. It is well invested with high quality assets and operates a “short paper, long fibre” model similar to that of the Group.
The Group expects that this acquisition will improve its position in higher-growth south eastern European geographies, further strengthening pan-European capabilities to our existing customer base in addition to providing access to new customers.

128 Financial Statements
Annual Report & Accounts 2015
128 Financial Statements
Notes to the Consolidated Financial Statements continued
33. SUBSEQUENT EVENTS CONTINUED (a) Acquisition of Duropack continued The following table summarises the consideration paid for the Duropack business and provisional carrying values of identifiable assets and liabilities. The below values will be subject to a fair value review and finalised within a year of the acquisition date and retrospectively applied.
Provisional carrying values at
acquisition £m
Property, plant and equipment 103Other non-current assets 10Current assets 91Non-current liabilities (62)Current liabilities (46)Total identifiable net assets acquired 96Goodwill 50Total consideration 146Satisfied by: Cash consideration 146
Net cash flow arising on acquisition Cash consideration 146Cash and cash equivalents acquired (18)Total cash outflow 128
(b) Disposal of StePac On 18 May 2015 the Group completed the sale of StePac, classified as held for sale at 30 April 2015, for US$31m, subject to customary working capital adjustments. This disposal is consistent with the Group’s focus on investment and growth in consumer based packaging in strategic markets and will result in an exceptional gain in the forthcoming year.
(c) Other subsequent events There are no further events after the reporting date which require disclosure.

Financial Statements 129
dssmith.com
128 Financial Statements
Notes to the Consolidated Financial Statements continued
33. SUBSEQUENT EVENTS CONTINUED (a) Acquisition of Duropack continued The following table summarises the consideration paid for the Duropack business and provisional carrying values of identifiable assets and liabilities. The below values will be subject to a fair value review and finalised within a year of the acquisition date and retrospectively applied.
Provisional carrying values at
acquisition £m
Property, plant and equipment 103Other non-current assets 10Current assets 91Non-current liabilities (62)Current liabilities (46)Total identifiable net assets acquired 96Goodwill 50Total consideration 146Satisfied by: Cash consideration 146
Net cash flow arising on acquisition Cash consideration 146Cash and cash equivalents acquired (18)Total cash outflow 128
(b) Disposal of StePac On 18 May 2015 the Group completed the sale of StePac, classified as held for sale at 30 April 2015, for US$31m, subject to customary working capital adjustments. This disposal is consistent with the Group’s focus on investment and growth in consumer based packaging in strategic markets and will result in an exceptional gain in the forthcoming year.
(c) Other subsequent events There are no further events after the reporting date which require disclosure.
Financial Statements 129
34. DS SMITH GROUP COMPANIES Control of the Group The Group’s ultimate parent company is DS Smith Plc.
List of key consolidated companies
Country of incorporation
or registration
Ownership interest at
30 April 2015
UK DS Smith Holdings Limited UK 100%DS Smith Packaging Limited UK 100%*DS Smith Corrugated Packaging Limited UK 100%*DS Smith Paper Limited UK 100%*DS Smith Logistics Limited UK 100%*DS Smith Recycling UK Limited UK 100%*Western Europe DS Smith France S.A.S. France 100%*DS Smith Packaging France S.A.S. France 100%*Otor S.A. France 100%*DS Smith Packaging Services S.A.S. France 100%*DS Smith Packaging Consumer S.A.S. France 100%*DS Smith Chouanard S.A.S. France 100%*DS Smith Paper Kaysersberg S.A.S France 100%*Andorrana de Cajas De Cartón Ondulado S.A. Spain 100%*DS Smith Packaging Netherlands B.V. Netherlands 100%*DACH and Northern Europe DS Smith Packaging Deutschland Stiftung & Co.KG Germany 100%*DS Smith Recycling Deutschland GmbH Germany 100%*DS Smith Paper Deutschland GmbH Germany 100%*DS Smith Packaging Denmark A/S Denmark 100%*DS Smith Packaging Sweden AB Sweden 100%*Central Europe and Italy DS Smith Polska sp.z.o.o. Poland 100%*Toscana Ondulati SpA Italy 92%*DS Smith Packaging Italia SpA Italy 100%*Plastics DS Smith Plastics Limited UK 100%*DS Smith Cartón Plástico s.a. Spain 100%*D.W. Plastics NV Belgium 100%*DS Smith Ducaplast S.A.S. France 100%*DSS Rapak Inc. USA 100%*Rapak GmbH Germany 100%*Rapak Asia Pacific Limited New Zealand 100%** Indirectly held by DS Smith Plc.
A complete list of the Group’s companies is available from the registered office and will be filed with the Annual Return.

130 Financial Statements
Annual Report & Accounts 2015
130 Financial Statements
Company Balance Sheet Prepared in Accordance with UK GAAP At 30 April 2015
Note 2015
£m2014
£mFixed assets Tangible assets 3 7 4Investments 4 1,833 1,833 1,840 1,837Current assets Debtors: amounts falling due within one year 5 123 80Debtors: amounts falling due after more than one year 5 105 339Cash at bank and in hand 10 19 35 247 454Creditors: amounts falling due within one year Trade and other creditors 6 (86) (60)Borrowings 6 (142) (218)Net current assets 19 176Total assets less current liabilities 1,859 2,013Creditors: amounts falling due after more than one year Trade and other creditors 6 (13) (40)Borrowings 6 (774) (782)Provisions for liabilities 7 (1) (3)Net assets 1,071 1,188 Capital and reserves Called up share capital 8 94 94Share premium account 9 715 715Profit and loss account 9 262 379Shareholders’ funds 1,071 1,188
Approved by the Board of Directors of DS Smith Plc (company registered number 1377658) on 24 June 2015 and signed on its behalf by
M W Roberts A R T Marsh Director Director
The accompanying notes are an integral part of these financial statements.

Financial Statements 131
dssmith.com
130 Financial Statements
Company Balance Sheet Prepared in Accordance with UK GAAP At 30 April 2015
Note 2015
£m2014
£mFixed assets Tangible assets 3 7 4Investments 4 1,833 1,833 1,840 1,837Current assets Debtors: amounts falling due within one year 5 123 80Debtors: amounts falling due after more than one year 5 105 339Cash at bank and in hand 10 19 35 247 454Creditors: amounts falling due within one year Trade and other creditors 6 (86) (60)Borrowings 6 (142) (218)Net current assets 19 176Total assets less current liabilities 1,859 2,013Creditors: amounts falling due after more than one year Trade and other creditors 6 (13) (40)Borrowings 6 (774) (782)Provisions for liabilities 7 (1) (3)Net assets 1,071 1,188 Capital and reserves Called up share capital 8 94 94Share premium account 9 715 715Profit and loss account 9 262 379Shareholders’ funds 1,071 1,188
Approved by the Board of Directors of DS Smith Plc (company registered number 1377658) on 24 June 2015 and signed on its behalf by
M W Roberts A R T Marsh Director Director
The accompanying notes are an integral part of these financial statements.
Financial Statements 131
Notes to the Company Balance Sheet
1. SIGNIFICANT ACCOUNTING POLICIES A summary of the significant accounting policies, which have been applied consistently to all periods presented, is set out below:
(a) Accounting basis The financial statements of DS Smith Plc (the ‘Company’) have been prepared on a going concern basis and under the historical cost convention and have been prepared in accordance with the Companies Act 2006 and UK Generally Accepted Accounting Practice (GAAP).
Under section 408 of the Companies Act 2006 the Company is exempt from the requirement to present its own profit and loss account.
Under FRS 1 Cash Flow Statements, the Company is exempt from the requirement to prepare a cash flow statement on the grounds the Company is included in the consolidated financial statements.
The Company has also taken advantage of the exemption in FRS 29 Financial Instruments: Disclosures, not to present Company only information as the disclosures provided in the notes to the consolidated financial statements comply with the requirements of this standard.
In accordance with FRS 17 Retirement Benefits, the Company has taken the multi-employer exemption from disclosing the assets and liabilities of the scheme as it is not possible to separately identify those relating to the Company employees. This is because of complexities in determining how the cost of funding the deficit will be allocated between Group companies in future periods. A Group level actuarial valuation under FRS 17 has not been performed, but the net pension liability before tax under IAS 19 for the UK defined benefit pension schemes was £109m at 30 April 2015 (2014: £72m).
FRS 100 Application of Finance Reporting Requirements has been issued but not yet adopted by the Company. It is effective for accounting periods beginning on or after 1 January 2015.
(b) Income recognition Dividend income from subsidiary undertakings is recognised in the profit and loss account when paid.
(c) Tangible fixed assets Tangible fixed assets are stated at cost less accumulated depreciation. Depreciation is calculated to write off the cost or valuation less the estimated residual value of all tangible fixed assets in equal annual instalments over their estimated useful lives at the following rates:
Plant and equipment 2-25 years
(d) Fixed asset investments Fixed asset investments are valued at cost less provisions for impairment.
(e) Deferred taxation In accordance with FRS 19 Deferred Tax, deferred tax is provided in full on timing differences that result in an obligation at the reporting date to pay more tax, or a right to pay less tax, at a future date, at rates expected to apply when they crystallise, provided at current tax rates and based on current legislation. Timing differences arise from inclusion of items of income and expenditure in taxation computations in periods different from those in which they are included in the financial statements. Deferred tax assets are recognised to the extent that it is regarded as more likely than not that they will be recovered. Deferred tax assets and liabilities are not discounted.
(f) Foreign currencies Monetary assets and liabilities denominated in foreign currencies are translated into sterling at the rates of exchange ruling at that date. Exchange differences arising on translation are taken to the profit and loss account. (g) Pension contributions The Company participates in a funded, defined benefit scheme in the UK, the DS Smith Group Pension scheme (the ‘Group Scheme’). On 30 April 2011, the scheme was closed to future accrual. As the Company is unable to identify its share of scheme assets and liabilities on a consistent and reasonable basis, the Company treats contributions to defined benefit schemes as if they were contributions to a defined contribution scheme in accordance with the exemption permitted by FRS 17 Retirement Benefits. As a result, the amount charged to the profit and loss account represents the contributions payable to the scheme in respect of the relevant accounting period. (h) Financial instruments Financial instruments are reported in accordance with FRS 26 Financial Instruments: Recognition and Measurement. The Company uses derivative financial instruments, primarily interest rate, currency and commodity swaps, to manage interest rate, currency and commodity risks associated with the Group’s underlying business activities and the financing of these activities. The Group has a policy not to, and does not, undertake any speculative activity in these instruments. Such derivative financial instruments are initially recognised at fair value on the date on which a derivative contract is entered into and are subsequently remeasured at fair value. Derivatives are carried as assets when the fair value is positive and as liabilities when the fair value is negative.
Derivative financial instruments are accounted for as hedges when designated as hedges at the inception of the contract and when the financial instruments provide an effective hedge of the underlying risk. Any gains or losses arising from the hedging instruments are offset against the hedged items.
For the purpose of hedge accounting, hedges are classified as:
fair value hedges when hedging the exposure to changes in the fair value of a recognised asset or liability; and
cash flow hedges when hedging exposure to variability in cash flows that is either attributable to a particular risk associated with a recognised asset or liability or a highly probable forecast transaction.
(i) Share options The Company operates an equity-settled, share-based compensation plan. The fair value of the employee services received in exchange for the grant of the options is recognised as an expense. The fair value of the options granted is measured using a stochastic model, taking into account the terms and conditions upon which the options were granted. The total amount to be expensed over the vesting period is determined by reference to the fair value of the options granted, excluding the impact of any non-market vesting conditions. Non-market vesting conditions are included in assumptions about the number of options that are expected to become exercisable.
At each reporting date, the entity revises its estimates of the numbers of options that are expected to become exercisable. It recognises the impact of the revision of original estimates, if any, in the profit and loss account, and a corresponding adjustment to equity. Where applicable, the fair value of employee services received by subsidiary undertakings within the DS Smith Plc Group in exchange for options granted by the Company is recognised as an expense in the financial statements of the subsidiary by means of a recharge from the Company.

132 Financial Statements
Annual Report & Accounts 2015
132 Financial Statements
Notes to the Company Balance Sheet continued
2. EMPLOYEE INFORMATION The average number of employees employed by the Company during the year was 118 (2013/14: 58).
2015
£m2014
£mWages and salaries 21 8Social security costs 2 2Pension costs 1 1Total 24 11
Note 26 to the consolidated financial statements sets out the disclosure information required for the Company’s share-based payments.
3. TANGIBLE FIXED ASSETS
Plant and equipment
£mTotal
£mCost At 1 May 2014 6 6Additions 3 3Disposals (1) (1)At 30 April 2015 8 8 Depreciation At 1 May 2014 (2) (2)Charge for the year – –Disposals 1 1At 30 April 2015 (1) (1) Carrying amount At 1 May 2014 4 4At 30 April 2015 7 7
4. FIXED ASSET INVESTMENTS
Shares in Group undertakings
£mAt 30 April 2014 1,833At 30 April 2015 1,833
The Company’s principal trading subsidiary undertakings at 30 April 2015 are shown in note 34 to the consolidated financial statements.

Financial Statements 133
dssmith.com
132 Financial Statements
Notes to the Company Balance Sheet continued
2. EMPLOYEE INFORMATION The average number of employees employed by the Company during the year was 118 (2013/14: 58).
2015
£m2014
£mWages and salaries 21 8Social security costs 2 2Pension costs 1 1Total 24 11
Note 26 to the consolidated financial statements sets out the disclosure information required for the Company’s share-based payments.
3. TANGIBLE FIXED ASSETS
Plant and equipment
£mTotal
£mCost At 1 May 2014 6 6Additions 3 3Disposals (1) (1)At 30 April 2015 8 8 Depreciation At 1 May 2014 (2) (2)Charge for the year – –Disposals 1 1At 30 April 2015 (1) (1) Carrying amount At 1 May 2014 4 4At 30 April 2015 7 7
4. FIXED ASSET INVESTMENTS
Shares in Group undertakings
£mAt 30 April 2014 1,833At 30 April 2015 1,833
The Company’s principal trading subsidiary undertakings at 30 April 2015 are shown in note 34 to the consolidated financial statements.
Financial Statements 133
5. DEBTORS
2015
£m2014
£mAmounts falling due within one year Trade debtors 3 –Amounts owed by subsidiary undertakings 89 66Other debtors 15 10Prepayments and accrued income 3 2Derivative financial instruments 13 2 123 80 Amounts falling due after more than one year Amounts owed by subsidiary undertakings 62 319Deferred tax asset 19 16Derivative financial instruments 24 4 105 339Total debtors 228 419
6. CREDITORS
2015
£m2014
£mTrade and other creditors falling due within one yearTrade payables 11 –Amounts owed to subsidiary undertakings 28 2Corporation tax 2 1Other tax and social security payables – 5Other creditors, accruals and deferred income 27 32Derivative financial instruments 18 20 86 60 Trade and other creditors falling due after more than one year Derivative financial instruments 13 40 13 40 Borrowings falling due within one year Bank loans and overdrafts 142 155Other loans – 63 142 218 Borrowings falling due after more than one year Other loans 774 782 774 782Total creditors 1,015 1,100
7. PROVISIONS FOR LIABILITIES
Restructuring
£mTotal
£mAt 1 May 2014 3 3Charged to the profit and loss account 1 1Utilised (3) (3)At 30 April 2015 1 1
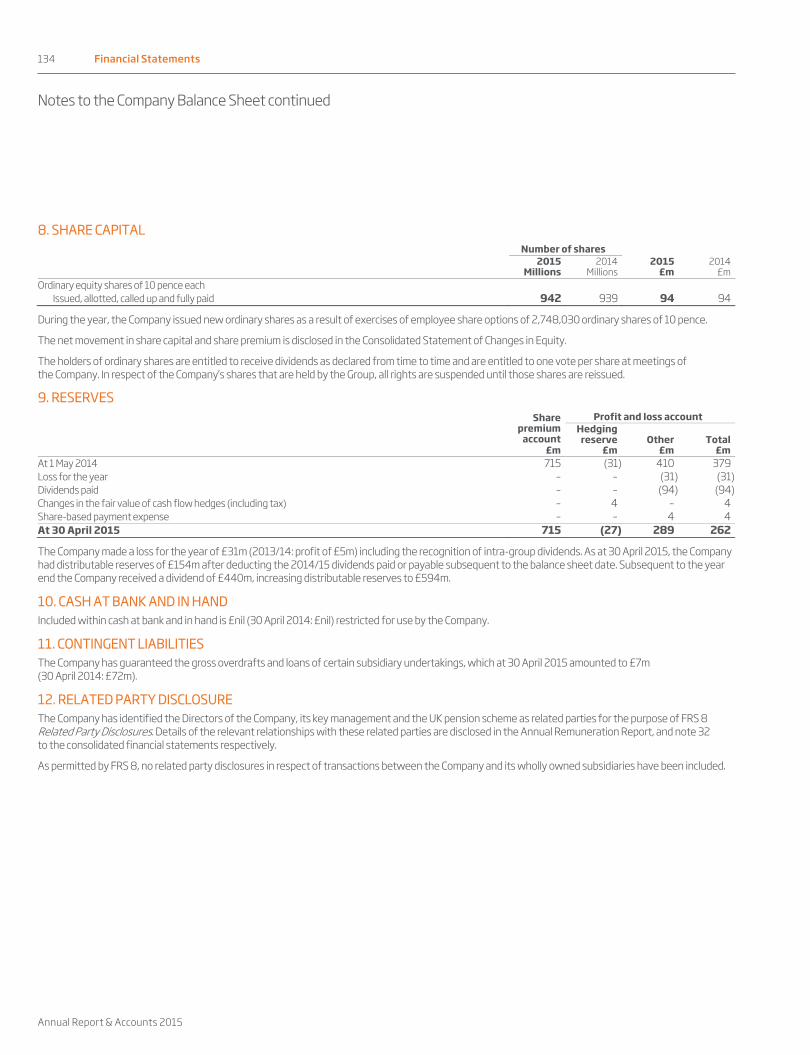
134 Financial Statements
Annual Report & Accounts 2015
134 Financial Statements
Notes to the Company Balance Sheet continued
8. SHARE CAPITAL Number of shares
2015
Millions2014
Millions 2015
£m 2014
£mOrdinary equity shares of 10 pence each
Issued, allotted, called up and fully paid 942 939 94 94
During the year, the Company issued new ordinary shares as a result of exercises of employee share options of 2,748,030 ordinary shares of 10 pence.
The net movement in share capital and share premium is disclosed in the Consolidated Statement of Changes in Equity.
The holders of ordinary shares are entitled to receive dividends as declared from time to time and are entitled to one vote per share at meetings of the Company. In respect of the Company’s shares that are held by the Group, all rights are suspended until those shares are reissued.
9. RESERVES Share
premium account
£m
Profit and loss account
Hedging reserve
£m Other
£mTotal
£mAt 1 May 2014 715 (31) 410 379Loss for the year – – (31) (31)Dividends paid – – (94) (94)Changes in the fair value of cash flow hedges (including tax) – 4 – 4Share-based payment expense – – 4 4At 30 April 2015 715 (27) 289 262
The Company made a loss for the year of £31m (2013/14: profit of £5m) including the recognition of intra-group dividends. As at 30 April 2015, the Company had distributable reserves of £154m after deducting the 2014/15 dividends paid or payable subsequent to the balance sheet date. Subsequent to the year end the Company received a dividend of £440m, increasing distributable reserves to £594m.
10. CASH AT BANK AND IN HAND Included within cash at bank and in hand is £nil (30 April 2014: £nil) restricted for use by the Company.
11. CONTINGENT LIABILITIES The Company has guaranteed the gross overdrafts and loans of certain subsidiary undertakings, which at 30 April 2015 amounted to £7m (30 April 2014: £72m).
12. RELATED PARTY DISCLOSURE The Company has identified the Directors of the Company, its key management and the UK pension scheme as related parties for the purpose of FRS 8 Related Party Disclosures. Details of the relevant relationships with these related parties are disclosed in the Annual Remuneration Report, and note 32 to the consolidated financial statements respectively.
As permitted by FRS 8, no related party disclosures in respect of transactions between the Company and its wholly owned subsidiaries have been included.

Financial Statements 135
dssmith.com
134 Financial Statements
Notes to the Company Balance Sheet continued
8. SHARE CAPITAL Number of shares
2015
Millions2014
Millions 2015
£m 2014
£mOrdinary equity shares of 10 pence each
Issued, allotted, called up and fully paid 942 939 94 94
During the year, the Company issued new ordinary shares as a result of exercises of employee share options of 2,748,030 ordinary shares of 10 pence.
The net movement in share capital and share premium is disclosed in the Consolidated Statement of Changes in Equity.
The holders of ordinary shares are entitled to receive dividends as declared from time to time and are entitled to one vote per share at meetings of the Company. In respect of the Company’s shares that are held by the Group, all rights are suspended until those shares are reissued.
9. RESERVES Share
premium account
£m
Profit and loss account
Hedging reserve
£m Other
£mTotal
£mAt 1 May 2014 715 (31) 410 379Loss for the year – – (31) (31)Dividends paid – – (94) (94)Changes in the fair value of cash flow hedges (including tax) – 4 – 4Share-based payment expense – – 4 4At 30 April 2015 715 (27) 289 262
The Company made a loss for the year of £31m (2013/14: profit of £5m) including the recognition of intra-group dividends. As at 30 April 2015, the Company had distributable reserves of £154m after deducting the 2014/15 dividends paid or payable subsequent to the balance sheet date. Subsequent to the year end the Company received a dividend of £440m, increasing distributable reserves to £594m.
10. CASH AT BANK AND IN HAND Included within cash at bank and in hand is £nil (30 April 2014: £nil) restricted for use by the Company.
11. CONTINGENT LIABILITIES The Company has guaranteed the gross overdrafts and loans of certain subsidiary undertakings, which at 30 April 2015 amounted to £7m (30 April 2014: £72m).
12. RELATED PARTY DISCLOSURE The Company has identified the Directors of the Company, its key management and the UK pension scheme as related parties for the purpose of FRS 8 Related Party Disclosures. Details of the relevant relationships with these related parties are disclosed in the Annual Remuneration Report, and note 32 to the consolidated financial statements respectively.
As permitted by FRS 8, no related party disclosures in respect of transactions between the Company and its wholly owned subsidiaries have been included.
Financial Statements 135
Five-Year Financial Summary
Continuing operations 20111 £m
2012 1 £m
20131 £m
2014£m
2015£m
Revenue 1,759 1,969 3,669 4,035 3,820Operating profit2 110 141 249 307 335Amortisation (7) (8) (45) (51) (46)Share of (loss)/profit of equity-accounted investments before exceptional items, net of tax – (1) 1 – –Net financing costs (30) (25) (44) (48) (38)Profit before taxation and exceptional items 73 107 161 208 251Acquisitions and disposals – (18) (69) (46) (4)Other exceptional items 1 (70) (10) 5 (47)Profit before income tax 74 19 82 167 200 Adjusted earnings per share2 9.7p 12.5p 17.1p 21.4p 24.5pDividends per share 4.5p 5.9p 8.0p 10.0p 11.4p Adjusted return on sales2 6.3% 7.2% 6.8% 7.6% 8.8%Adjusted return on average capital employed2,3,4 11.4% 14.3% 12.2% 13.0% 14.6%1 Restated for IAS 19 (Revised 2011) (note 1a). 2 Before amortisation and exceptional items. 3 Adjusted return on average capital employed is defined as operating profit before amortisation and exceptional items divided by average capital employed. 4 Average capital employed is the average monthly capital employed for the last 12 months. Capital employed is made up of property, plant and equipment, goodwill and intangible assets, working capital,
capital debtors/creditors, provisions and assets/liabilities held for sale. The definition of capital employed is different from the definition of managed capital as defined in note 21 to the consolidated financial statements, which consists of equity as presented in the Consolidated Statement of Financial Position, plus net debt.

Annual Report & Accounts 2015
136
Shareholder Information
FINANCIAL DIARY8 September 2015 Annual General Meeting
1 October 2015 Ex-dividend date for final dividend
2 November 2015 Payment of final dividend
3 December 2015* Announcement of half-year results for the six months ended 31 October 2015
31 March 2016* Ex-dividend date for interim dividend
3 May 2016* Payment of interim dividend
23 June 2016* Announcement of full-year results for the year ended 30 April 2016* Provisional date
COMPANY WEBSITEThe Company’s website at www.dssmith.com contains the latest information for shareholders, including press releases and an updated financial diary. E-mail alerts of the latest news, press releases and financial reports about DS Smith Plc may be obtained by registering for the e-mail news alert service on the website.
SHARE PRICE INFORMATIONThe latest price of the Company’s ordinary shares is available from the FT Cityline service. To access this service, telephone +44 (0) 9058 171 690. For call charges, please check with your provider as costs may vary. Alternatively click on www.londonstockexchange.com. DS Smith’s ticker symbol is SMDS. It is recommended that you consult your financial adviser and verify information obtained from these services before making any investment decision.
REGISTRARSPlease contact the Registrars at the address above to advise of a change of address or for any enquiries relating to dividend payments, lost share certificates or other share registration matters. The Registrars provide on-line facilities at www.shareview.co.uk. Once you have registered you will be able to access information on your DS Smith Plc shareholding, update your personal details and amend your dividend payment instructions on-line without having to call or write to the Registrars.
DIVIDENDSShareholders who wish to have their dividends paid directly into a bank or building society account should contact the Registrars. In addition, the Registrars are now able to pay dividends in 90 foreign currencies. This service enables the payment of your dividends directly into your bank account in your home currency. For international payments, a charge is deducted from each dividend payment to cover the costs involved. Please contact the Registrars to request further information.
SHARE DEALING SERVICESThe Registrars offer a real-time telephone and internet dealing service for the UK. Further details including terms and rates can be obtained by logging on to the website at www.shareview.co.uk/dealing or by calling 0845 603 7037. Lines are open between 8am and 4.30pm, Monday to Friday.
REGISTERED OFFICE AND ADVISERSSecretary and Registered OfficeMatt Jowett DS Smith Plc 350 Euston Road London NW1 3AX Registered in England No: 1377658AuditorsDeloitte LLP 2 New Street Square London EC4A 3BZSolicitorsAllen & Overy LLP One Bishops Square London E1 6ADPrincipal clearing bankThe Royal Bank of Scotland 280 Bishopsgate London EC2M 4RBStockbrokersCitigroup Citigroup Centre 33 Canada Square Canary Wharf London E14 5LBJ.P. Morgan Cazenove 25 Bank Street London E14 5JPRegistrarsEquiniti Aspect House Spencer Road Lancing West Sussex BN99 6DA
Registrars queriesInformation on how to manage your shareholdings can be found at https://help.shareview.co.uk. The pages at this web address provide answers to commonly asked questions regarding shareholder registration, links to downloadable forms and guidance notes. If your question is not answered by the information provided, you can send your enquiry via secure e-mail from these pages. You will be asked to complete a structured form and to provide your shareholder reference, name and address. You will also need to provide your e-mail address if this is how you would like to receive your response. In the UK you can telephone 0871 384 2197. Lines are open 8.30am to 5.30pm Monday to Friday. For call charges, please check with your provider as costs may vary. For overseas, telephone +44 (0) 121 415 7047.


DS Smith Plc 350 Euston Road Regent’s Place London NW1 3AX
Telephone +44 (0)20 7756 1800
www.dssmith.com
Find us on:
Printed in the UK by Principal Colour Ltd on Lumi Silk made from FSC® certified fibrePrincipal Colour Ltd are certified to the ISO 14001 Environmental Management System.
Designed and produced by Black Sun Plc (London) www.blacksunplc.com +44 (0) 20 7736 0011
DS Smith Plc
Annual Report and Accounts 2015