DryShips Inc. Informational Roadshowdryships.irwebpage.com/files/INFOROADSHOWJUN06.pdfThis...
29
DryShips Inc. Informational Roadshow June 2006 NASDAQ: “DRYS”
Transcript of DryShips Inc. Informational Roadshowdryships.irwebpage.com/files/INFOROADSHOWJUN06.pdfThis...
DryShips Inc.Informational Roadshow
June 2006
NASDAQ: “DRYS”

DryShips Inc. © 2005Page 2
Disclaimer
Forward-Looking Statements
This presentation contains forward-looking statements within the meaning of applicable federal securities laws. Such statements are based upon current expectations that involve risks and uncertainties. Any statements contained herein that are not statements of historical fact may be deemed to be forward-looking statements. For example, words such as “may,” “will,” “should,”“estimates,” “predicts,” “potential,” “continue,” “strategy,” “believes,” “anticipates,” “plans,” “expects,”“intends” and similar expressions are intended to identify forward-looking statements. Actual results and the timing of certain events may differ significantly from the results discussed or implied in the forward-looking statements. Among the factors that might cause or contribute to such a discrepancy include, but are not limited to, the risk factors described in the Company’s Registration Statement filed with the Securities and Exchange Commission, particularly those describing variations on charter rates and their effect on the Company’s revenues, net income and profitability as well as the value of the Company’s fleet.

DryShips Inc. © 2005Page 3
Business Profile and Strategy
! Quarterly dividend of $0.20 per share! Paid / announced 5 consecutive dividends since IPO
Regular Dividends
! 2005 ROCE 28.6% ! 2005 ROE 63.2% Financial Return Focus
! Unique combination of spot, period and pool employment only possible because of large fleet.
! Aimed to maximize revenues and profitability! Fixed revenue comparable to public peers
Diversified Chartering Strategy
! 29 vessels – 2.4 mil dwt – 11.3 years average age versus industry average of 15 years
! 4 Capesize - 22 Panamax – 3 HandysizeModern and Diversified Fleet
! Largest US listed drybulk company in terms of fleet and revenues
! Among largest panamax owner in the world ! Strategic objective of industry consolidator
through accretive acquisitions
Sector Leadership
Capitalize on Fundamental Industry Change

DryShips Inc. © 2005Page 4
Financial Highlights
59.5 %
59.3 %
57.9%
56.5%
Debt to Capitalization
Net Debt to Capitalization
$0.60 per share3 quarterly dividends
$0.20 per shareDividend
$173.3 million$37 millionEBITDA
$3.83 per share$0.60 per shareEPS
$111 million$18.1 millionNet Income
$219.3 million$50.8 millionNet Revenue
Full Year 2005Q1 2006

DryShips Inc. © 2005Page 5
Operating Highlights
98%98%Fleet Utilization
$5,831$5,326Daily Vessel Operating Expenses
$28,446$21,325Average Daily Fleet TCE Rate
Acquired 21 vessels Fleet of 27 vessels
Agreed to acquire 2 vessels Fleet of 29 vessels
Fleet Development
Full Year 2005Q1 2006
DryShips Inc. © 2005Page 6
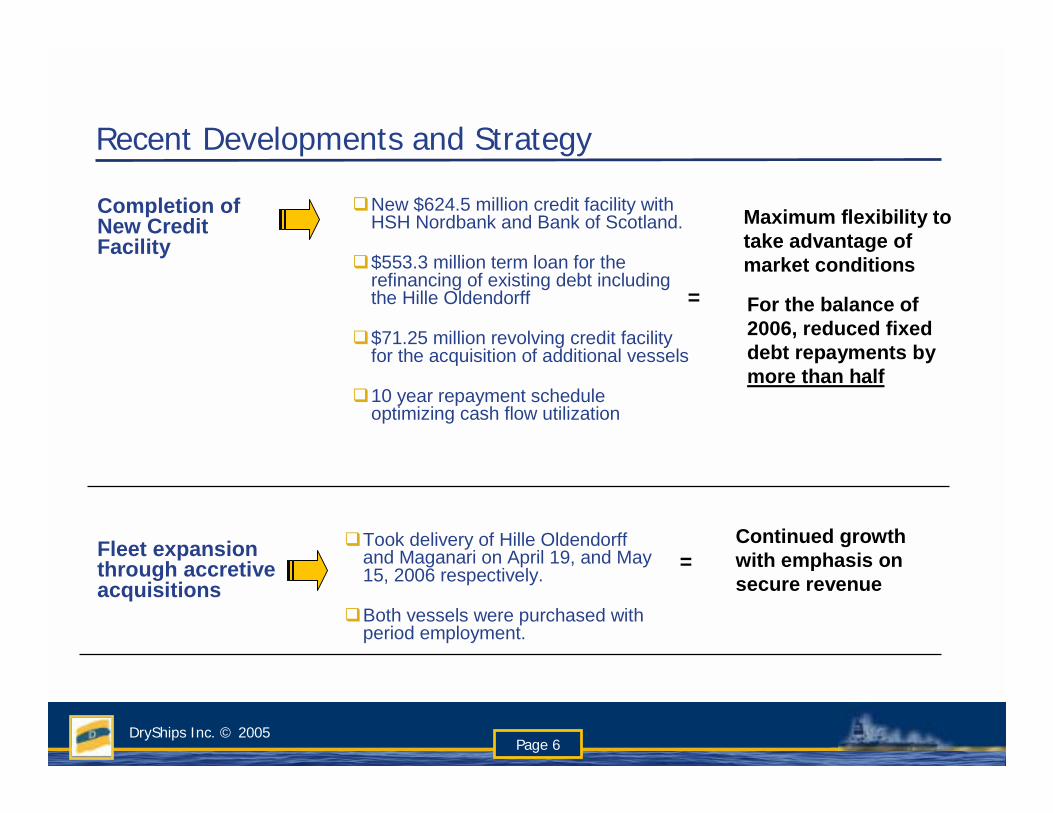
Recent Developments and Strategy
!Took delivery of Hille Oldendorff and Maganari on April 19, and May 15, 2006 respectively.
!Both vessels were purchased withperiod employment.
Fleet expansion through accretive acquisitions
!New $624.5 million credit facility with HSH Nordbank and Bank of Scotland.
!$553.3 million term loan for the refinancing of existing debt including the Hille Oldendorff
!$71.25 million revolving credit facility for the acquisition of additional vessels
!10 year repayment schedule optimizing cash flow utilization
Completion of New Credit Facility
=
=
Maximum flexibility to take advantage of market conditions
Continued growth with emphasis on secure revenue
For the balance of 2006, reduced fixed debt repayments by more than half
DryShips Inc. © 2005Page 7
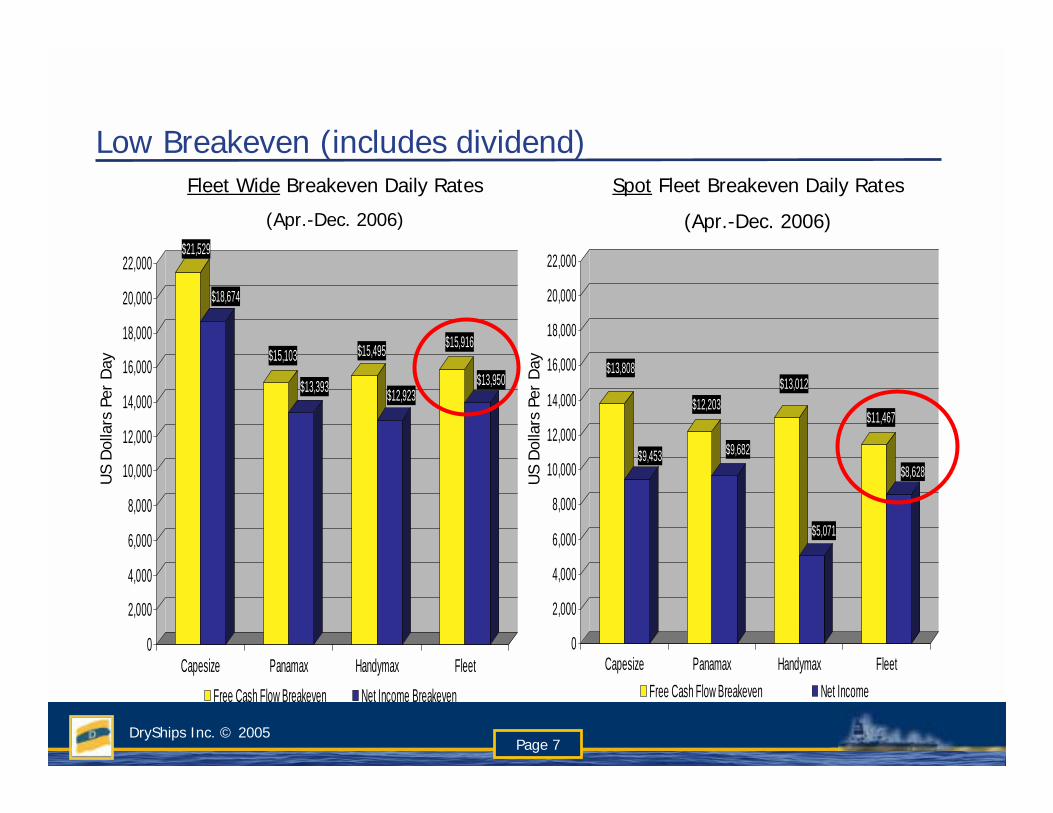
Low Breakeven (includes dividend)
$13,808
$9,453
$12,203
$9,682
$13,012
$5,071
$11,467
$8,628
0
2,000
4,000
6,000
8,000
10,000
12,000
14,000
16,000
18,000
20,000
22,000
Capesize Panamax Handymax FleetFree Cash Flow Breakeven Net Income
US
Dol
lars
Per
Day
$21,529
$18,674
$15,103
$13,393
$15,495
$12,923
$15,916
$13,950
0
2,000
4,000
6,000
8,000
10,000
12,000
14,000
16,000
18,000
20,000
22,000
Capesize Panamax Handymax FleetFree Cash Flow Breakeven Net Income Breakeven
Fleet Wide Breakeven Daily Rates
(Apr.-Dec. 2006)
Spot Fleet Breakeven Daily Rates
(Apr.-Dec. 2006)
US
Dol
lars
Per
Day

DryShips Inc. © 2005Page 8
Accretive Growth Strategy
Hille Oldendorff – Purchase price $40.76 million
Maganari – Purchase price $35.4 million
" Modern 2001 built 75,941 dwt panamax bulkcarrier
" $15.1 million in fixed net revenue under current charter (redelivery Feb 08 – Jul 08)
" $3.0 million in estimated net income for 2006.
" Modern 2005 built 55,566 dwt handymax bulkcarrier
" $5.4 million in fixed net revenue under current charter (redelivery Jan 07 – May 07)
" $2.4 million in estimated net income for 2006.
Note: EPS measured on the basis of 30.35 million shares outstanding

DryShips Inc. © 2005Page 9
Controlled Equity Offering
Mechanics
Objective
" Increase DryShips’ ability to take advantage of market conditions to acquire
additional vessels as and when opportunities arise.
" Small size maybe up to 5 million shares
" Shares may be sold from time to time in open market operations
" Prevailing “at the market” price and low transaction costs
" DryShips has total control over manner, timing and size of transactions.
" DryShips can commence and stop the process at any time
Increased Financial Flexibility
DryShips Inc. © 2005Page 10
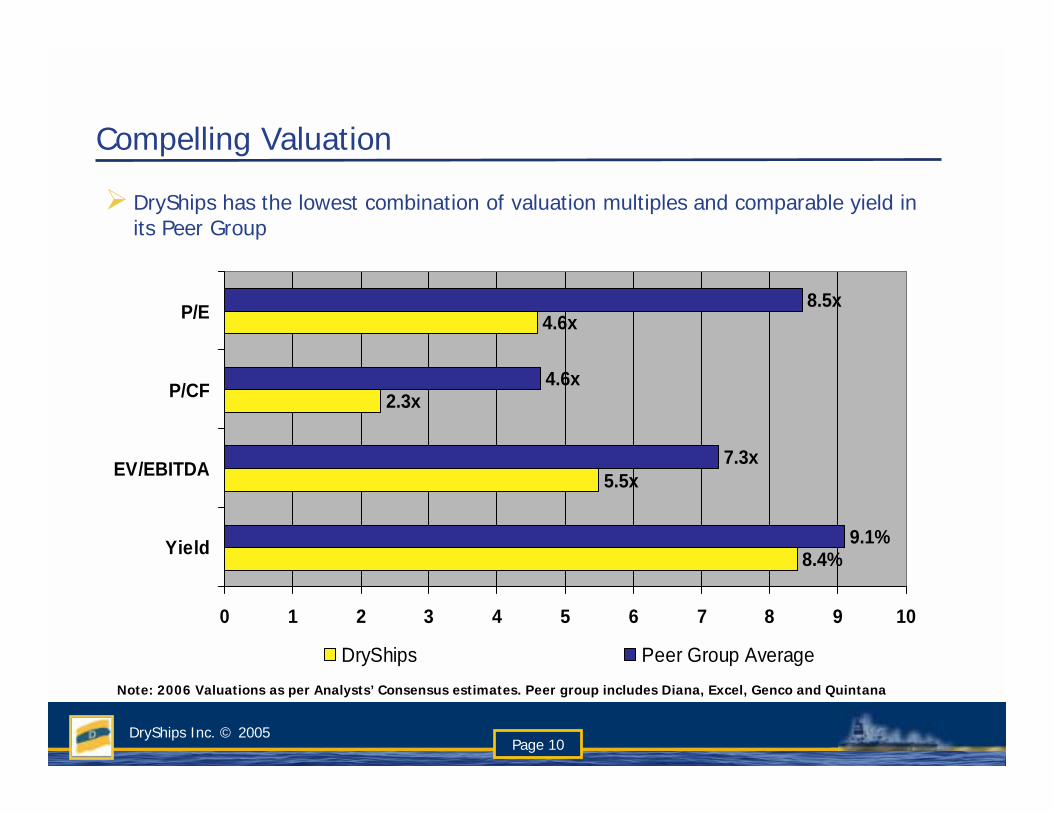
Compelling Valuation
Note: 2006 Valuations as per Analysts’ Consensus estimates. Peer group includes Diana, Excel, Genco and Quintana
" DryShips has the lowest combination of valuation multiples and comparable yield in its Peer Group
5.5x
2.3x
4.6x
7.3x
4.6x
8.5x
8.4%9.1%
0 1 2 3 4 5 6 7 8 9 10
Yield
EV/EBITDA
P/CF
P/E
DryShips Peer Group Average

DryShips Inc. © 2005Page 11
Strong Operating Performance
Source: Various companies publications
" Highest fleet average TCE rate in 1Q06 compared to peers
" Lowest total operating cost in 1Q06 compared to peers
$5,252
$21,480
$5,723
$20,405
$0 $5,000 $10,000 $15,000 $20,000 $25,000
TVOE
TCE Rate
DryShips Peer Group

DryShips Inc. © 2005Page 12
Significant Upside Potential
" Highest earnings leverage within its Peer Group
$0.07
$0.19
$0.00 $0.05 $0.10 $0.15 $0.20
Peer Group Average DryShips
Incremental gross earnings per Share for every $1,000 per day increase in TCE rates
EPS
Note: A $1,000 per day increase in spot charter rates will increase DRYSHIPS gross revenue by an additional $5.8 million during the period April 1, 2006 to December 31, 2006, or $0.19 per share = 10% basis $1.97 consensus estimates
Spot timecharter rates assumed as: Capesize 31,750, Panamax 16,875, Handymax 16,750 (estimated 1yr TC levels from industry sources)

DryShips Inc. © 2005Page 13
Comparable Fixed Revenue
Source: Companies press releases and presentations
$55.90
$57.20
$40.00 $45.00 $50.00 $55.00 $60.00
Gro
ss R
even
ue (U
S$m
)
Peer Group Average DryShips
Fixed Revenue April 1, to December 31, 2006
" DryShips revenue from period employment for the balance of 2006 is in line with its peer group.

DryShips Inc. © 2005Page 14
Baltic Dry Index
Baltic Dry Index – 2004, 2005 and 2006 year to date
Source: The Baltic Exchange
-
1,000
2,000
3,000
4,000
5,000
6,000
7,000
2 Jan 13 Feb 26 Mar 12 May 24 Jun 5 Aug 17 Sep 29 Oct 10 Dec
BD
I
Year 2004 Year 2005 2006

DryShips Inc. © 2005Page 15
-2
0
2
4
6
8
10
12
14
16
1955
1958
1961
1964
1967
1970
1973
1976
1979
1982
1985
1988
1991
1994
1997
2000
2003 -50
0
50
100
150
Japanese GDP Japanese Crude Steel Production
Source: Clarksons Research Studies and International Monetary Fund
" “Soft” or “Hard” landing? “No” landing at all
143125110Net Change
9.9%9.5%9.1%% Change
1,5871,4441,319GDP China
200520042003($ in billions)
% C
hang
e
$MM
Metric Tons
Is China a Bubble? Absolutely Not!
0
200
400
600
800
1000
1200
0 2 4 6 8 10 12 14 16 18 20 22 24 26 28 30
JapanKoreaChina
Industrial Production
Years from BaseIn
dex,
Bas
e Ye
ar =
100
Japan Base Year = 1959Korea Base Year = 1980China Base Year = 1995
Japan Industrial Production and GDP

DryShips Inc. © 2005Page 16
Chinese Steel Production

DryShips Inc. © 2005Page 17
Sustained Chinese Demand
0
0.5
1
1.5
2
2.5
3
3.5
4
Aug-02
Oct-02
Dec-02
Feb-03
Apr-03
Jun-03
Aug-03
Oct-03
Dec-03
Feb-04
Apr-04
Jun-04
Aug-04
Oct-04
Dec-04
Feb-05
Apr-05
Jun-05
Aug-05
Oct-05
Dec-05
Feb-06
Apr-06
" Coal imports of 8.9m tons for 1Q06 up 81.6% from 4.9m tons for 1Q05!
CAGR = 80.9%
Chinese Coal Imports
0
5
10
15
20
25
30
35
Aug-02
Oct-02
Dec-02
Feb-03
Apr-03
Jun-03
Aug-03
Oct-03
Dec-03
Feb-04
Apr-04
Jun-04
Aug-04
Oct-04
Dec-04
Feb-05
Apr-05
Jun-05
Aug-05
Oct-05
Dec-05
Feb-06
Apr-06
Chinese Iron Ore Imports
" Iron ore imports of 81.0m tons for the 1Q06 up 27.3% from 63.6m tons for 1Q05!
CAGR = 28.4%

DryShips Inc. © 2005Page 18
Growth in Worldwide Steel Production
" Steel and its raw materials account for 44% of drybulk demand
World Steel Production GrowthWorld Steel Production
0
200
400
600
800
1,000
1,200
1980 1985 1990 1995 2000 2002 2003 2004 2005*
Mill
ion
To
nn
es
China World-2.0%
-1.0%
0.0%
1.0%
2.0%
3.0%
4.0%
5.0%
6.0%
7.0%
8.0%
1959
-64
1964
-69
1969
-74
1974
-79
1979
-84
1984
-89
1989
-94
1994
-99
1999
-04
CAGR 1980 - 2000 = 6.4%
CAGR 2000 - 2005 = 20.8%
Low Charter Rates
25 years
High Charter
rates15 years
High Charter Rates
2-3 years so far

DryShips Inc. © 2005Page 19
Positive Fundamental Outlook
" Estimated supply of tonnage is below demand in 2007 and 2008
0.0%
1.0%
2.0%
3.0%
4.0%
5.0%
6.0%
7.0%
8.0%
9.0%
2004 2005 2006E 2007E 2008E0
1,000
2,000
3,000
4,000
5,000
6,000
Cargo Ton Miles Growth Year End Fleet Growth BDI
Excess Supply Excess
Supply
Supply Shortage
Supply Shortage
Supply Shortage
?
Note: Actual BDI figures for 2004, 2005 and YTD 2006 figures only.
?
?
?

DryShips Inc. © 2005Page 20
Industry Summary
SUPPLY
"Newbuilding deliveries to decline in 2007 and beyond
"Pool of scrapping candidate vessel (25+ years old) to increase steadily
DEMAND
"Chinese urbanization and industrialization will continue to support steel demand
" Indian acute coal shortage, country emerging as important demand source
"Huge iron ore and coal mining capacity expansion mainly in 2006 and 2007
"Economic growth forecasts imply increased demand for steel & energy in 2006
" Iron ore and coal ton mile expected demand growth at 6.7% p.a. versus 1%
during 1990-99
FLEET CAPACITY
"Shortage expected to continue supporting above historical average charter rates
No Change in Positive Long Term Fundamentals

DryShips Inc. © 2005Page 21
DryShips: Compelling Investment Case
" Large, modern and diversified fleet
" Low breakeven Levels
" Increased financial flexibility
" Strong operating performance
" Significant earnings leverage
" Attractive dividend yield
" Low valuation versus peers
" Positive fundamental outlook

DryShips Inc. © 2005Page 22
Appendix I – 1Q06 AND 1Q05 Income Statements(Dollars in thousands, except per share data and 3 Months Ended 3 Months EndedAverage Daily Results - unaudited) March 31, 2006 March 31, 2005
Unaudited UnauditedINCOME STATEMENT DATAVoyage revenues $54,809 $29,449Voyage expenses 4,033 2,008
Vessels operating expenses 10,522 3,963Depreciation and amortization 13,766 2,536Management fees 1,444 549Foreign currency losses 0 32General and administrative 979 726
Operating Income 24,065 19,635
Interest and finance costs, net (6,104) (522)Other, net 102 (3)
NET INCOME $18,063 $19,110
Basic and fully diluted earnings per share $0.60 $0.80Weighted average basic and diluted shares outstanding 30,350,000 23,871,667

DryShips Inc. © 2005Page 23
Appendix II – December 31, 2005 and March 31, 2006 Balance Sheet
" Debt to Capitalization = 57.88%
" Net Debt to Capitalization =56.48%
(Dollars in thousands) As at As atMarch 31, 2006 Dec. 31, 2005
BALANCE SHEET DATA Unaudited AuditedCash and cash equivalents 7,891 5,184Other current assets 16,993 13,593Vessels, net 851,687 864,733Other non current assets 26,161 27,049TOTAL ASSETS 902,732 910,559
Current portion of long-term debt 107,726 107,738Other current liabilities 27,097 28,007Long-term debt, net of current portion 398,684 417,615Other non-current liabilities 726 698Total Liabilities 534,233 554,058
Total Stockholders' Equity 368,499 356,501TOTAL LIABILITIES AND STOCKHOLDERS' EQUITY 902,732 910,559
DryShips Inc. © 2005Page 24
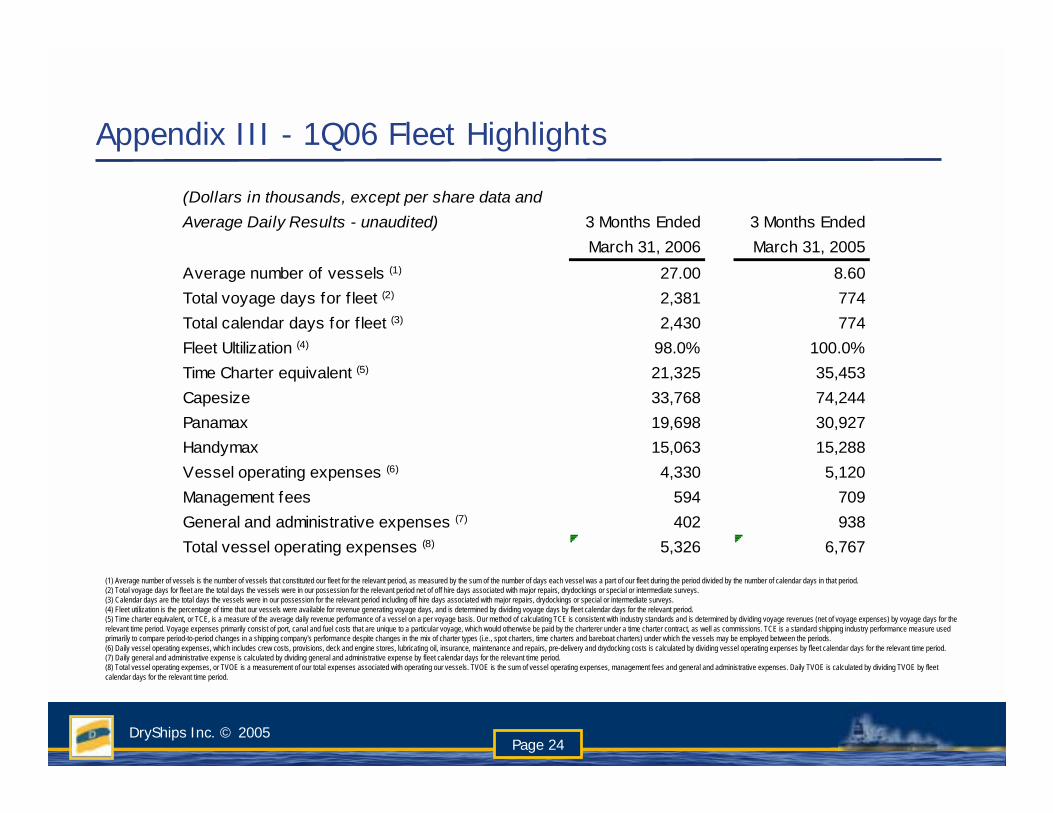
Appendix III - 1Q06 Fleet Highlights
(1) Average number of vessels is the number of vessels that constituted our fleet for the relevant period, as measured by the sum of the number of days each vessel was a part of our fleet during the period divided by the number of calendar days in that period. (2) Total voyage days for fleet are the total days the vessels were in our possession for the relevant period net of off hire days associated with major repairs, drydockings or special or intermediate surveys. (3) Calendar days are the total days the vessels were in our possession for the relevant period including off hire days associated with major repairs, drydockings or special or intermediate surveys. (4) Fleet utilization is the percentage of time that our vessels were available for revenue generating voyage days, and is determined by dividing voyage days by fleet calendar days for the relevant period. (5) Time charter equivalent, or TCE, is a measure of the average daily revenue performance of a vessel on a per voyage basis. Our method of calculating TCE is consistent with industry standards and is determined by dividing voyage revenues (net of voyage expenses) by voyage days for the relevant time period. Voyage expenses primarily consist of port, canal and fuel costs that are unique to a particular voyage, which would otherwise be paid by the charterer under a time charter contract, as well as commissions. TCE is a standard shipping industry performance measure used primarily to compare period-to-period changes in a shipping company's performance despite changes in the mix of charter types (i.e., spot charters, time charters and bareboat charters) under which the vessels may be employed between the periods. (6) Daily vessel operating expenses, which includes crew costs, provisions, deck and engine stores, lubricating oil, insurance, maintenance and repairs, pre-delivery and drydocking costs is calculated by dividing vessel operating expenses by fleet calendar days for the relevant time period. (7) Daily general and administrative expense is calculated by dividing general and administrative expense by fleet calendar days for the relevant time period. (8) Total vessel operating expenses, or TVOE is a measurement of our total expenses associated with operating our vessels. TVOE is the sum of vessel operating expenses, management fees and general and administrative expenses. Daily TVOE is calculated by dividing TVOE by fleet calendar days for the relevant time period.
(Dollars in thousands, except per share data andAverage Daily Results - unaudited) 3 Months Ended 3 Months Ended
March 31, 2006 March 31, 2005Average number of vessels (1) 27.00 8.60Total voyage days for f leet (2) 2,381 774Total calendar days for f leet (3) 2,430 774Fleet Ultilization (4) 98.0% 100.0%Time Charter equivalent (5) 21,325 35,453Capesize 33,768 74,244Panamax 19,698 30,927Handymax 15,063 15,288Vessel operating expenses (6) 4,330 5,120Management fees 594 709General and administrative expenses (7) 402 938Total vessel operating expenses (8) 5,326 6,767
DryShips Inc. © 2005Page 25
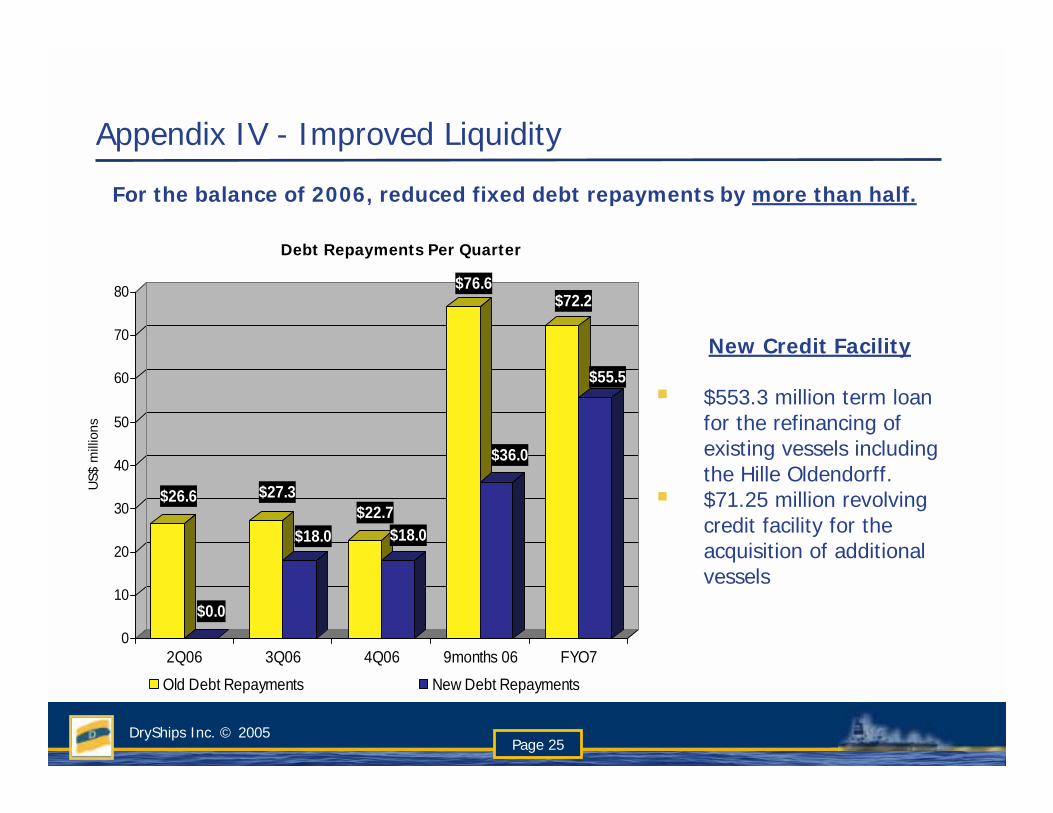
Appendix IV - Improved Liquidity
New Credit Facility
# $553.3 million term loan for the refinancing of existing vessels including the Hille Oldendorff.
# $71.25 million revolving credit facility for the acquisition of additional vessels
$26.6
$0.0
$27.3
$18.0$22.7
$18.0
$76.6
$36.0
$72.2
$55.5
0
10
20
30
40
50
60
70
80
2Q06 3Q06 4Q06 9months 06 FYO7
Old Debt Repayments New Debt Repayments
Debt Repayments Per Quarter
US$
mill
ions
For the balance of 2006, reduced fixed debt repayments by more than half.
DryShips Inc. © 2005Page 26
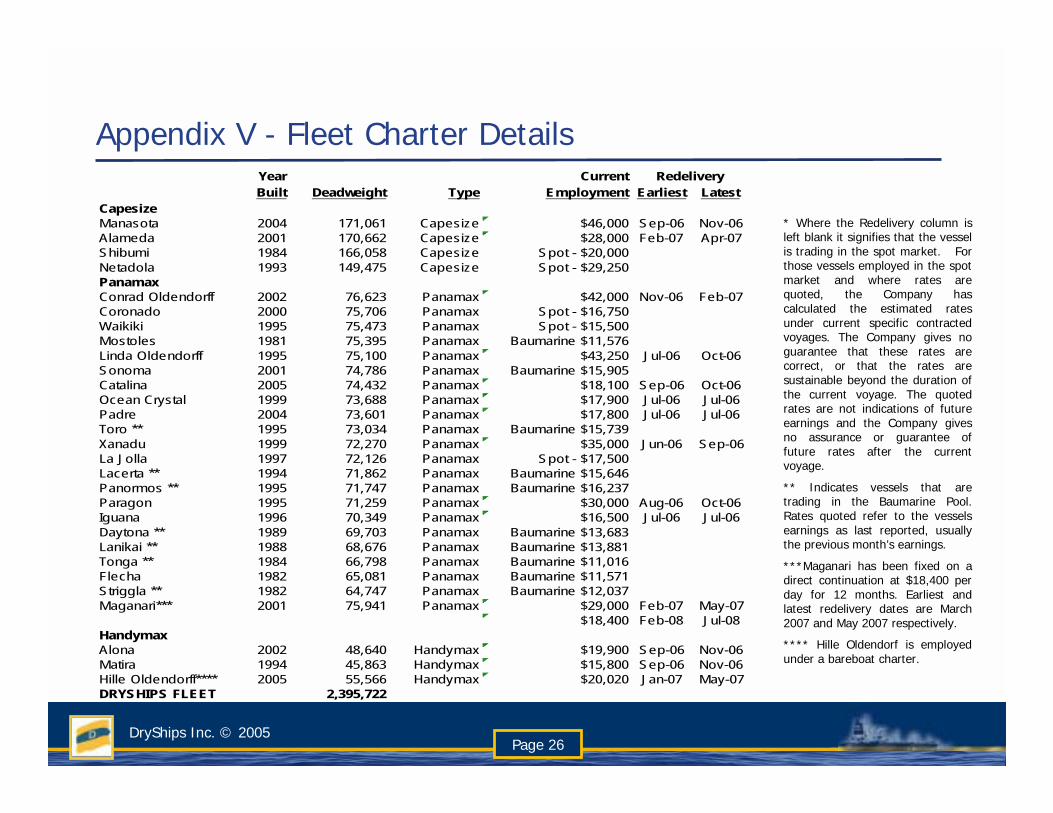
Year CurrentBuilt Deadweight Type Employment Earliest Latest
CapesizeManasota 2004 171,061 Capesize $46,000 Sep-06 Nov-06Alameda 2001 170,662 Capesize $28,000 Feb-07 Apr-07Shibumi 1984 166,058 Capesize Spot - $20,000Netadola 1993 149,475 Capesize Spot - $29,250PanamaxConrad Oldendorff 2002 76,623 Panamax $42,000 Nov-06 Feb-07Coronado 2000 75,706 Panamax Spot - $16,750Waikiki 1995 75,473 Panamax Spot - $15,500Mostoles 1981 75,395 Panamax Baumarine $11,576Linda Oldendorff 1995 75,100 Panamax $43,250 Jul-06 Oct-06Sonoma 2001 74,786 Panamax Baumarine $15,905Catalina 2005 74,432 Panamax $18,100 Sep-06 Oct-06Ocean Crystal 1999 73,688 Panamax $17,900 Jul-06 Jul-06Padre 2004 73,601 Panamax $17,800 Jul-06 Jul-06Toro ** 1995 73,034 Panamax Baumarine $15,739Xanadu 1999 72,270 Panamax $35,000 Jun-06 Sep-06La Jolla 1997 72,126 Panamax Spot - $17,500Lacerta ** 1994 71,862 Panamax Baumarine $15,646Panormos ** 1995 71,747 Panamax Baumarine $16,237Paragon 1995 71,259 Panamax $30,000 Aug-06 Oct-06Iguana 1996 70,349 Panamax $16,500 Jul-06 Jul-06Daytona ** 1989 69,703 Panamax Baumarine $13,683Lanikai ** 1988 68,676 Panamax Baumarine $13,881Tonga ** 1984 66,798 Panamax Baumarine $11,016Flecha 1982 65,081 Panamax Baumarine $11,571Striggla ** 1982 64,747 Panamax Baumarine $12,037Maganari*** 2001 75,941 Panamax $29,000 Feb-07 May-07
$18,400 Feb-08 Jul-08HandymaxAlona 2002 48,640 Handymax $19,900 Sep-06 Nov-06Matira 1994 45,863 Handymax $15,800 Sep-06 Nov-06Hille Oldendorff**** 2005 55,566 Handymax $20,020 Jan-07 May-07DRYSHIPS FLEET 2,395,722
Redelivery
* Where the Redelivery column is left blank it signifies that the vessel is trading in the spot market. For those vessels employed in the spot market and where rates are quoted, the Company has calculated the estimated rates under current specific contracted voyages. The Company gives no guarantee that these rates are correct, or that the rates are sustainable beyond the duration of the current voyage. The quoted rates are not indications of future earnings and the Company gives no assurance or guarantee of future rates after the current voyage.
** Indicates vessels that are trading in the Baumarine Pool. Rates quoted refer to the vessels earnings as last reported, usually the previous month’s earnings.
***Maganari has been fixed on a direct continuation at $18,400 per day for 12 months. Earliest and latest redelivery dates are March 2007 and May 2007 respectively.
**** Hille Oldendorf is employed under a bareboat charter.
Appendix V - Fleet Charter Details

DryShips Inc. © 2005Page 27
Appendix VI - EBITDA CalculatorCapesizeSpot Voyage Days 270 231 194 276Daily Spot Charter Rate (net of commissions) $30,619 - - -Fixed T/C Revenue (net of commissions) $3.9 m $4.5 m $5.9 m $2.0 m
PanamaxSpot Voyage Days 1,440 1,353 1,642 1,894Daily Spot Charter Rate (net of commissions) $13,576 - - -Fixed T/C Revenue (net of commissions) $16.3 m $16.1 m $9.8 m $4.0 m
HandymaxSpot Voyage Days 140 57 15 184Daily Spot Charter Rate (net of commissions) $13,870 - - -Fixed T/C Revenue (net of commissions) $0.8 m $3.6 m $4.7 m $1.8 m
Total Spot TCE Revenue $29.8 m - m - m - mTotal Fixed TCE Revenue $21.0 m $24.2 m $20.4 m $7.8 m
Combined TCE Revenue $50.8 m - m - m - m
Total Calendar Days 2,430 2,580 2,668 2,668TVOE per day $5,108 $5,108 $5,108 $5,108Fleet Quarterly TVOE $12.4 m $13.2 m $13.6 m $13.6 m
EBITDA $37.0 m - m - m - mDepreciation & amortization $13.7 m $13.7 m $13.7 m $13.7 mInterest, net $5.5 m $5.5 m $5.0 m $4.5 m
1Q06A 2Q06E 3Q06E 4Q06E
Note: Estimates may differ materially from actual results.

DryShips Inc. © 2005Page 28
Appendix VII - Possible Demand and Supply Developments
Supply of tonnage is below demand in 2007 and 2008
Notes: 1. Numbers in parenthesis relate to data in our last report
2003 2004 2005 2006E 2007E 2008E
Demand (million tons)Iron Ore 524 589 650 690 730Coal 619 664 690 715 740Grain 240 236 242 255 265Major Bulks 1383 1,489 1,582 1,660 1,735Minor Bulks 957 1,025 1,049 1,078 1,106Total (1) 2340 2,514 (2,507) 2,631 (2,636) 2,738 2,841 2,957Annual Increase (1) 174 (167) 117 (129) 107 103 116% Growth Rate (1) 5.5% 7.4% (7.1%) 4.7% (5.1%) 4.1% (3.9%) 3.8% (4.1%) 4.1% (4.1%)
Cargo Ton Miles (In billions) 11,144 12,079 12,699 13,256 13,878 14,530% Growth Rate 6.7% 8.4% (7.5%) 5.1% (5.6%) 4.4% (4.4%) 4.7% (4.4%) 4.7% (4.4%)
Supply (million dwt)Year End Fleet 321.2 343.9 367.6 378.1Deliveries 24.3 25.6 16.4 14.5Deletions -1.6 -1.9 -5.9 -5.7Year End Fleet 321.2 343.9 367.6 378.1 386.9% Growth Rate 6.1% 7.2% (4.9%) 6.9% (4.7%) 2.9% (2.7%) 2.3% (2.5%)
25+ Year Fleet 30.0 41.0 55.0 65.2% of Fleet 9.6% 12.0% 15.4% 17.8%

DryShips Inc. © 2005Page 29
Contacts
Visit our website at www.dryships.com
Company Contact:Christopher J. Thomas Chief Financial Officer
DryShips Inc. Tel. 011-30-210-809-0570
E-mail: [email protected]
Investor Relations / Media:Nicolas Bornozis
Capital Link, Inc. (New York)Tel. 212-661-7566
E-mail: [email protected]