Drug Use Among Seniors on Public Drug Programs in Canada, … · 7 Drug Use Among Seniors on Public...
71
Types of Care Report Revised October 2014 Drug Use Among Seniors on Public Drug Programs in Canada, 2012
Transcript of Drug Use Among Seniors on Public Drug Programs in Canada, … · 7 Drug Use Among Seniors on Public...
Types of Care
Report Revised October 2014
Drug Use Among Seniors on Public Drug Programs in Canada, 2012
Our VisionBetter data. Better decisions. Healthier Canadians.
Our MandateTo lead the development and maintenance of comprehensive and integrated health information that enables sound policy and effective health system management that improve health and health care.
Our ValuesRespect, Integrity, Collaboration, Excellence, Innovation
Table of Contents Acknowledgements ..................................................................................................................... 5
About CIHI .................................................................................................................................. 6
Highlights .................................................................................................................................... 7
Executive Summary .................................................................................................................... 8 How Much Are Public Drug Programs Spending on Seniors? .................................................. 8 Which Drugs Account for the Highest Drug Program Spending on Seniors? ........................... 8 Which Drugs Are Most Commonly Used by Seniors? .............................................................. 9 Which Chronic Conditions Are Seniors Using Drugs to Treat? ................................................. 9 How Many Drugs Are Seniors Using? ...................................................................................... 9 How Many Seniors Are Using Potentially Inappropriate Medications? ....................................... 9 How Does Drug Utilization Differ Among Seniors Living in Long-Term Care Facilities? ......... 10
Introduction ............................................................................................................................... 11
Drug Spending Among Seniors ................................................................................................. 12 How Much Are Public Drug Programs Spending on Seniors? ................................................ 12 Which Drugs Account for the Highest Drug Program Spending on Seniors? ......................... 12 Which Drugs Had the Largest Increases in Drug Program Spending on Seniors? ................. 13
Drug Utilization Among Seniors ................................................................................................ 15 What Is the Size of the Senior Claimant Population in Each Jurisdiction? ............................. 15 Which Drugs Are Most Commonly Used by Seniors? ............................................................ 16 Which Chronic Conditions Are Seniors Using Drugs to Treat? ............................................... 20 How Many Drugs Are Seniors Using? .................................................................................... 22 How Many Seniors Are Using Potentially Inappropriate Medications? ................................... 25 How Does Drug Utilization Differ Among Seniors Living in Long-Term Care Facilities? ......... 28
Appendix A: Glossary of Terms ................................................................................................. 33
Appendix B: Methodological Notes ............................................................................................ 36
Appendix C: Summary of Public Drug Plan Coverage Available to Seniors ............................... 45
Appendix D: Distribution of Total Senior Population and Senior Claimants on Public Drug Programs, by Sex and Age Group, Selected Jurisdictions and Canada, 2012 .......................... 54
Appendix E: Percentage of Seniors on Public Drug Programs With Accepted and Paid Claims ............................................................................................................................... 56
Appendix F: Top 10 Most Used Drug Classes by Jurisdiction ................................................... 57
Appendix G: Top 10 Most Used Drug Classes by Sex .............................................................. 62
Appendix H: Top 10 Most Used Drug Classes by Age Group .................................................... 63
4
Drug Use Among Seniors on Public Drug Programs in Canada, 2012: Revised October 2014
Appendix I: Distribution of Senior Claimants on Public Drug Programs Living in Long-Term Care Facilities, by Age Group, Selected Provinces, 2012 ......................................................... 65
Appendix J: Provincial and Territorial Drug Programs ............................................................... 66
References ............................................................................................................................... 67
5
Drug Use Among Seniors on Public Drug Programs in Canada, 2012: Revised October 2014
Acknowledgements The Canadian Institute for Health Information (CIHI) wishes to acknowledge and thank the following groups for their contributions to Drug Use Among Seniors on Public Drug Programs in Canada, 2012:
• Provincial Pharmacare Program, Prince Edward Island Department of Health and Wellness
• Pharmaceutical Services, Nova Scotia Department of Health and Wellness
• Pharmaceutical Services Branch, New Brunswick Department of Health
• Pharmaceutical Services Coordination Unit, Ontario Ministry of Health and Long-Term Care
• Provincial Drug Programs, Manitoba Department of Health
• Drug Plan and Extended Benefits Branch, Saskatchewan Ministry of Health
• Pharmaceutical Funding and Guidance, Pharmaceuticals and Life Sciences Branch, Alberta Health
• Health Outcomes, Evaluation and Economic Analysis Division, British Columbia Ministry of Health
• First Nations and Inuit Health Branch, Non-Insured Health Benefits Directorate, Health Canada
CIHI wishes to acknowledge and thank the following individuals for their invaluable advice on Drug Use Among Seniors on Public Drug Programs in Canada, 2012:
• Paula A. Rochon, MD, MPH, FRCPC; Senior Scientist, Women’s College Research Institute; Vice President, Research, Women’s College Hospital; Professor, Department of Medicine, University of Toronto
• Ingrid S. Sketris, PharmD, MPA(HSA); Professor, College of Pharmacy, Dalhousie University
Please note that the analyses and conclusions in this document do not necessarily reflect those of the individuals or organizations mentioned above.

6
Drug Use Among Seniors on Public Drug Programs in Canada, 2012: Revised October 2014
About CIHI The Canadian Institute for Health Information (CIHI) collects and analyzes information on health and health care in Canada and makes it publicly available. Canada’s federal, provincial and territorial governments created CIHI as a not-for-profit, independent organization dedicated to forging a common approach to Canadian health information. CIHI’s goal: to provide timely, accurate and comparable information. CIHI’s data and reports inform health policies, support the effective delivery of health services and raise awareness among Canadians of the factors that contribute to good health.
Production of this analysis is made possible by financial contributions from Health Canada and provincial and territorial governments. The views expressed herein do not necessarily represent the views of Health Canada or any provincial or territorial government.
7
Drug Use Among Seniors on Public Drug Programs in Canada, 2012: Revised October 2014
Highlights Drug Use Among Seniors on Public Drug Programs in Canada, 2012 examines drug use among seniors (those age 65 and older) using data from the National Prescription Drug Utilization Information System (NPDUIS) Database, 1 of 27 databases managed by the Canadian Institute for Health Information (CIHI). The data is submitted by public drug programs in eight provinces as well as one federal drug program.
This report provides an in-depth look at public drug program spending for seniors, as well as the number and types of drugs used by seniors. More focused analyses examine potentially inappropriate drug use and compare drug use among seniors living in long-term care facilities and those living in the community.
Nearly two-thirds (65.9%) of seniors had claims for 5 or more drug classes, and more than one-quarter (27.2%) of seniors had claims for 10 or more drug classes. The number of drugs used by seniors increased with age. In 2012, the proportion of seniors age 85 and older with claims for 10 or more drug classes (39.3%) was double that of seniors age 65 to 74 (20.0%). Chronic drug use by seniors was often associated with the treatment of chronic conditions, with about half of seniors using drugs to treat two or more conditions.
Six of the 10 drug classes most commonly used by seniors were cardiovascular-related. The most commonly used drug class was statins, which are used to treat high cholesterol. In 2012, almost half of seniors (46.6%) used this drug class. Statins were followed by angiotensin converting enzyme (ACE) inhibitors, used to treat heart failure and high blood pressure, and proton pump inhibitors (PPIs), used to treat gastroesophageal reflux disease and peptic ulcer disease, each used by about a quarter of seniors. More than one-third of seniors (38.9%) had claims for a drug on the Beers list—a list of drugs identified as potentially inappropriate to prescribe to seniors due to an elevated risk of adverse effects, a lack of efficacy or the availability of safer alternatives.
Seniors living in long-term facilities used significantly more drugs than those living in the community. In 2012, more than half of seniors living in long-term care (LTC) facilities were using 10 or more different drug classes (60.9%), more than double the proportion among seniors living in the community (26.1%). The most commonly used drug class in LTC facilities was PPIs, used by 37.9% of seniors (compared with 25.9% of seniors living in the community). The use of psychotropic drugs by seniors was much higher among those in LTC facilities than those living in the community. Benzodiazepine use was double the rate, antidepressant use triple the rate and antipsychotic use nine times the rate among seniors living in the community.
Ten drug classes accounted for 38.3% of total public drug program spending on seniors. Statins made up the highest proportion of spending, at 7.9%. This was followed by antineovascularization agents (5.3%), used to treat age-related macular degeneration, and PPIs (4.5%).
8
Drug Use Among Seniors on Public Drug Programs in Canada, 2012: Revised October 2014
Executive Summary Although seniors (those age 65 and older) account for only 15% of the Canadian population, they are estimated to account for 40% of all spending on prescribed drugs and 60% of public drug program spending.
Seniors take more drugs than younger Canadians because, on average, they have a higher number of chronic conditions. Although taking multiple medications may be necessary to manage these conditions; it is important to consider the benefits and risks of each medication and the therapeutic goals of the patient. Drug use is also important to monitor from a spending perspective, as increased drug utilization has been found to be the biggest driver of drug spending in Canada.
This report looks at several key questions regarding seniors’ drug use, including
• How much are public drug programs spending on seniors?
• Which drugs account for the highest drug program spending on seniors?
• Which drugs are most commonly used by seniors?
• Which chronic conditions are seniors using drugs to treat?
• How many drugs are seniors using?
• How many seniors are using potentially inappropriate medications?
• How does drug utilization differ among seniors living in long-term care facilities?
The report uses data from the National Prescription Drug Utilization Information System (NPDUIS) Database, as submitted by public drug programs in eight provinces—Prince Edward Island, Nova Scotia, New Brunswick, Ontario, Manitoba, Saskatchewan, Alberta and British Columbia—and by one federal drug program, managed by the First Nations and Inuit Health Branch (FNIHB).
How Much Are Public Drug Programs Spending on Seniors? • In 2012, public drug program spending on seniors totalled $4.4 billion for the nine
jurisdictions, accounting for 67.9% of their total public drug program spending.
Which Drugs Account for the Highest Drug Program Spending on Seniors? • The top 10 drug classes accounted for 38.3% of total spending on seniors.
• Statins, used to treat high cholesterol, made up the highest proportion of spending, at 7.9%, followed by antineovascularization agents (5.3%), used to treat age-related macular degeneration, and proton pump inhibitors (PPIs) (4.5%), used to treat gastrointestinal disorders.
• Antineovascularization agents had the largest increase in public drug program spending from 2006 to 2012, increasing at an average annual rate of 90.6%.
9
Drug Use Among Seniors on Public Drug Programs in Canada, 2012: Revised October 2014
Which Drugs Are Most Commonly Used by Seniors? • Six of the 10 most commonly used drug classes by seniors were cardiovascular-related.
• Statins, the most commonly used drug class, were used by 46.6% of seniors.
• Angiotensin converting enzyme (ACE) inhibitors, used to treat heart failure and high blood pressure, and PPIs, used to treat gastroesophageal reflux disease and peptic ulcer disease, were the next most commonly used drug classes, used by 28.4% and 27.0% of seniors respectively.
• The rate of use of PPIs (the third most commonly used drug class) ranged from 12.5% of seniors in B.C. to 39.7% of seniors covered through FNIHB.
• The use of sulfonamide diuretics (used to treat high blood pressure and heart failure) and fluoroquinolones (used to treat pneumonia and urinary tract infections) was significantly higher among seniors age 85 and older.
Which Chronic Conditions Are Seniors Using Drugs to Treat? • More than half of seniors (54.6%) were chronic users of drugs to treat two or more of seven
selected chronic conditions, while 28.9% of seniors were chronic users of drugs to treat three or more conditions.
• The most common of the seven selected condition categories was high blood pressure and heart failure; 63.4% of seniors were chronically using at least one drug to treat those conditions.
How Many Drugs Are Seniors Using? • In 2012, nearly two-thirds (65.9%) of seniors had claims for 5 or more drug classes, and
more than one-quarter (27.2%) of seniors had claims for 10 or more drug classes.
• Seniors living in P.E.I. used the fewest drugs on average, with just 13.5% using 10 or more drug classes. Seniors covered by FNIHB used the most drugs on average, with 53.7% using 10 or more drug classes.
• The number of drugs used by seniors increased with age: 20.0% of seniors age 65 to 74 had claims for 10 or more drug classes, compared with 31.9% of seniors age 75 to 84 and 39.3% of seniors age 85 and older.
How Many Seniors Are Using Potentially Inappropriate Medications? • More than one-third (38.9%) of seniors on public drug programs used a drug from the Beers
list (that is, a list of drugs defined as potentially inappropriate for use by seniors) and 12.4% had claims for multiple drugs from the Beers list.
• More than one-fifth (22.4%) of seniors on public drug programs were chronic users of at least one drug from the Beers list.
• Lorazepam (used to treat anxiety) was the most commonly used chemical from the Beers list, used by 9.1% of seniors.
10
Drug Use Among Seniors on Public Drug Programs in Canada, 2012: Revised October 2014
How Does Drug Utilization Differ Among Seniors Living in Long-Term Care Facilities? • PPIs were the most commonly used drug class in long-term care (LTC) facilities, followed by
two classes of antidepressants.
• Statins, the most commonly used drug class in the community, were the seventh most commonly used drug class in LTC facilities.
• Among seniors living in LTC facilities, 60.9% used 10 or more different drug classes (compared with 26.1% of seniors living in the community).
11
Drug Use Among Seniors on Public Drug Programs in Canada, 2012: Revised October 2014
Introduction Although seniors (those age 65 and older) account for only 15% of the Canadian population, they are estimated to account for 40% of all spending on prescribed drugs and 60% of public drug program spending.1, 2
Seniors take more drugs than younger Canadians because, on average, they have a higher number of chronic conditions.2–4 Studies have shown that the use of multiple medications, as well as age-related changes to the body in seniors, can increase the risk of adverse effects, drug interactions and non-compliance with drug therapy, all of which may result in less-than-optimal health outcomes.2, 5, 6 Although in some cases it may be appropriate for a patient to be using a high number of medications, it is important to consider the benefits and risks of each medication and the therapeutic goals of the patient.3, 7, 8
The Canadian senior populationi grew at an average rate of 3.1% per year from 2006 to 2012, compared with 0.8% growth in the non-senior population over the same time period. As this growth is expected to continue, there will be an ongoing need for detailed information on seniors’ drug use to help ensure that prescription drugs are being used safely and appropriately. Drug use is also important to monitor from a spending perspective, as increased drug utilization has been found to be the biggest driver of drug spending in Canada.9
This report uses drug claims data from the National Prescription Drug Utilization Information System (NPDUIS) Database to provide an in-depth look at public drug program spending on seniors, as well as the number and types of drugs used by them. More focused analyses examine potentially inappropriate drug use and compare drug use among seniors living in long-term care facilities and those living in the community. The NPDUIS Database currently contains claims data from public drug programs in eight Canadian provinces—Prince Edward Island, Nova Scotia, New Brunswick, Ontario, Manitoba, Saskatchewan, Alberta and British Columbia— as well as one federal drug program, managed by the First Nations and Inuit Health Branch.
i. Population data comes from Statistics Canada, Estimates of Population. The population estimates for 2006 are considered final,
while interim population estimates were used for 2012.
12
Drug Use Among Seniors on Public Drug Programs in Canada, 2012: Revised October 2014
Drug Spending Among Seniors This section examines drug spending among seniors (those age 65 and older) in Canada and will address the following questions:
• How much are public drug programs spending on seniors?
• Which drugs account for the highest drug program spending on seniors?
• Which drugs had the largest increases in drug program spending on seniors?
For a list of key terms used in this report, see Appendix A.
How Much Are Public Drug Programs Spending on Seniors? In 2012, public drug program spending for seniors totalled $4.4 billion for the nine jurisdictions submitting data to the NPDUIS Database. This amount accounted for 67.9% of total public drug program spending in these jurisdictions. (See Appendix B for detail on methodology.)
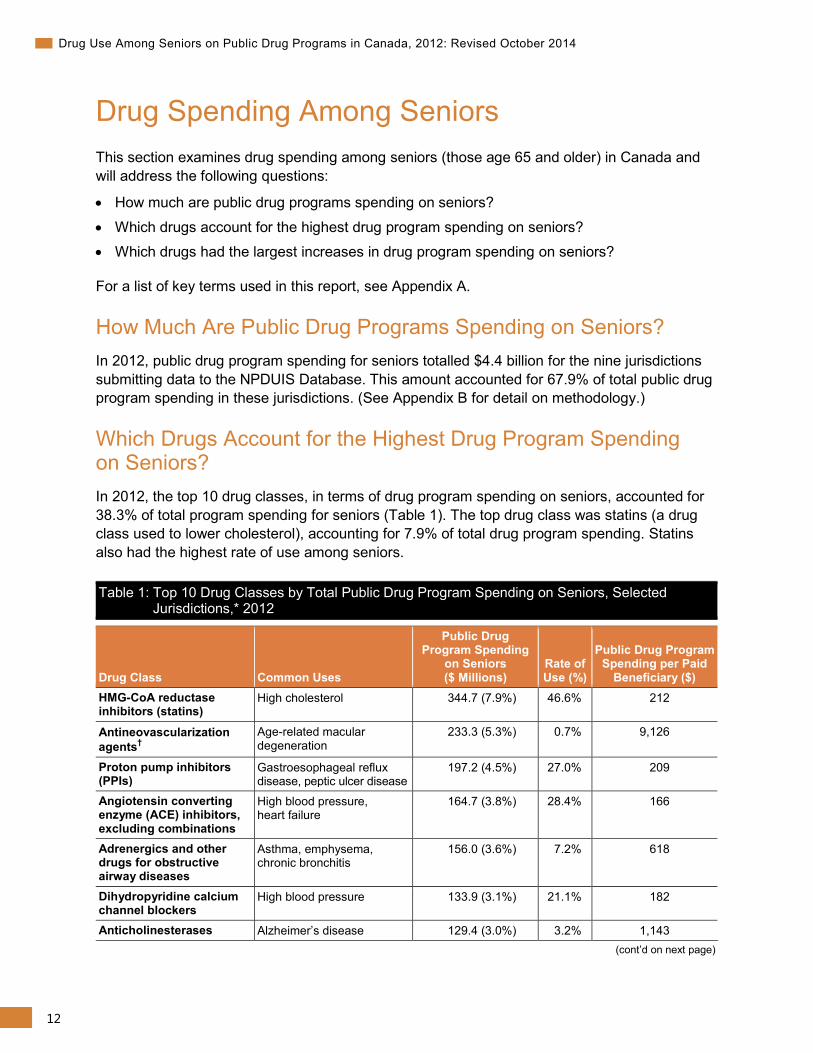
Which Drugs Account for the Highest Drug Program Spending on Seniors? In 2012, the top 10 drug classes, in terms of drug program spending on seniors, accounted for 38.3% of total program spending for seniors (Table 1). The top drug class was statins (a drug class used to lower cholesterol), accounting for 7.9% of total drug program spending. Statins also had the highest rate of use among seniors.
Table 1: Top 10 Drug Classes by Total Public Drug Program Spending on Seniors, Selected Jurisdictions,* 2012
Drug Class Common Uses
Public Drug Program Spending
on Seniors ($ Millions)
Rate of Use (%)
Public Drug Program Spending per Paid
Beneficiary ($) HMG-CoA reductase inhibitors (statins)
High cholesterol 344.7 (7.9%) 46.6% 212
Antineovascularization agents†
Age-related macular degeneration
233.3 (5.3%) 0.7% 9,126
Proton pump inhibitors (PPIs)
Gastroesophageal reflux disease, peptic ulcer disease
197.2 (4.5%) 27.0% 209
Angiotensin converting enzyme (ACE) inhibitors, excluding combinations
High blood pressure, heart failure
164.7 (3.8%) 28.4% 166
Adrenergics and other drugs for obstructive airway diseases
Asthma, emphysema, chronic bronchitis
156.0 (3.6%) 7.2% 618
Dihydropyridine calcium channel blockers
High blood pressure 133.9 (3.1%) 21.1% 182
Anticholinesterases Alzheimer’s disease 129.4 (3.0%) 3.2% 1,143 (cont’d on next page)
13
Drug Use Among Seniors on Public Drug Programs in Canada, 2012: Revised October 2014
Table 1: Top 10 Drug Classes by Total Public Drug Program Spending on Seniors, Selected Jurisdictions,* 2012 (cont’d)
Drug Class Common Uses
Public Drug Program Spending
on Seniors ($ Millions)
Rate of Use (%)
Public Drug Program Spending per Paid
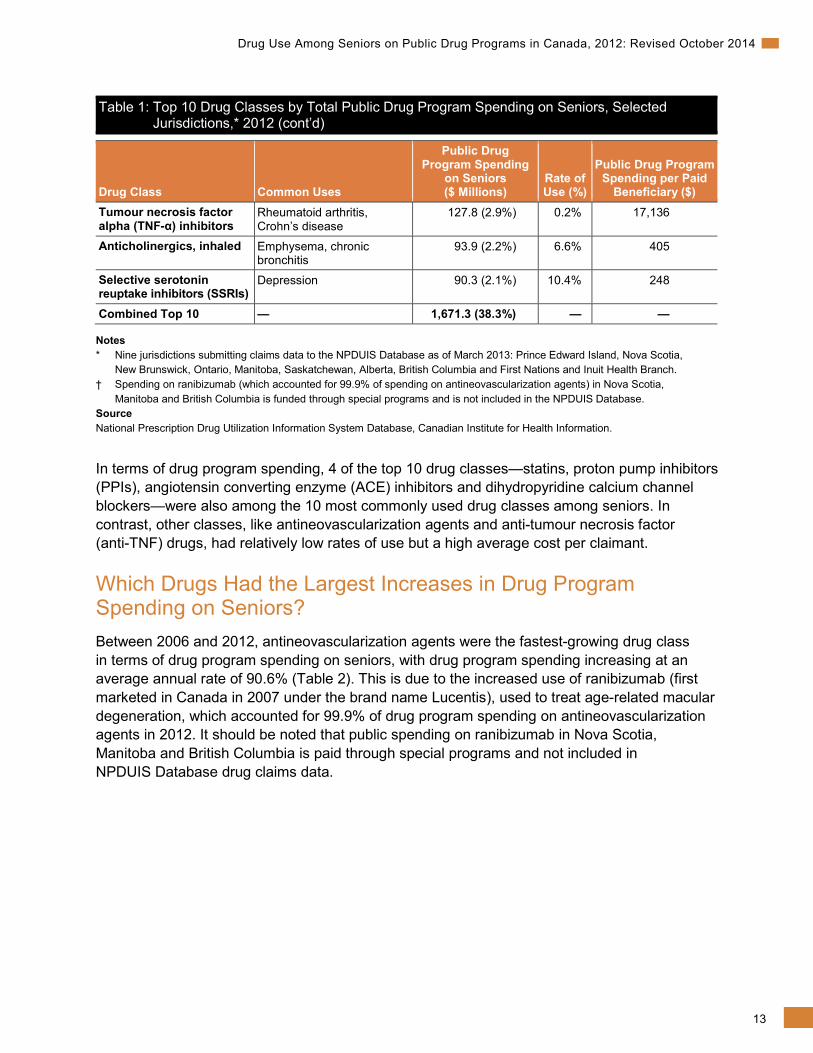
Beneficiary ($) Tumour necrosis factor alpha (TNF-α) inhibitors
Rheumatoid arthritis, Crohn’s disease
127.8 (2.9%) 0.2% 17,136
Anticholinergics, inhaled Emphysema, chronic bronchitis
93.9 (2.2%) 6.6% 405
Selective serotonin reuptake inhibitors (SSRIs)
Depression 90.3 (2.1%) 10.4% 248
Combined Top 10 — 1,671.3 (38.3%) — —
Notes * Nine jurisdictions submitting claims data to the NPDUIS Database as of March 2013: Prince Edward Island, Nova Scotia,
New Brunswick, Ontario, Manitoba, Saskatchewan, Alberta, British Columbia and First Nations and Inuit Health Branch. † Spending on ranibizumab (which accounted for 99.9% of spending on antineovascularization agents) in Nova Scotia,
Manitoba and British Columbia is funded through special programs and is not included in the NPDUIS Database. Source National Prescription Drug Utilization Information System Database, Canadian Institute for Health Information.
In terms of drug program spending, 4 of the top 10 drug classes—statins, proton pump inhibitors (PPIs), angiotensin converting enzyme (ACE) inhibitors and dihydropyridine calcium channel blockers—were also among the 10 most commonly used drug classes among seniors. In contrast, other classes, like antineovascularization agents and anti-tumour necrosis factor (anti-TNF) drugs, had relatively low rates of use but a high average cost per claimant.
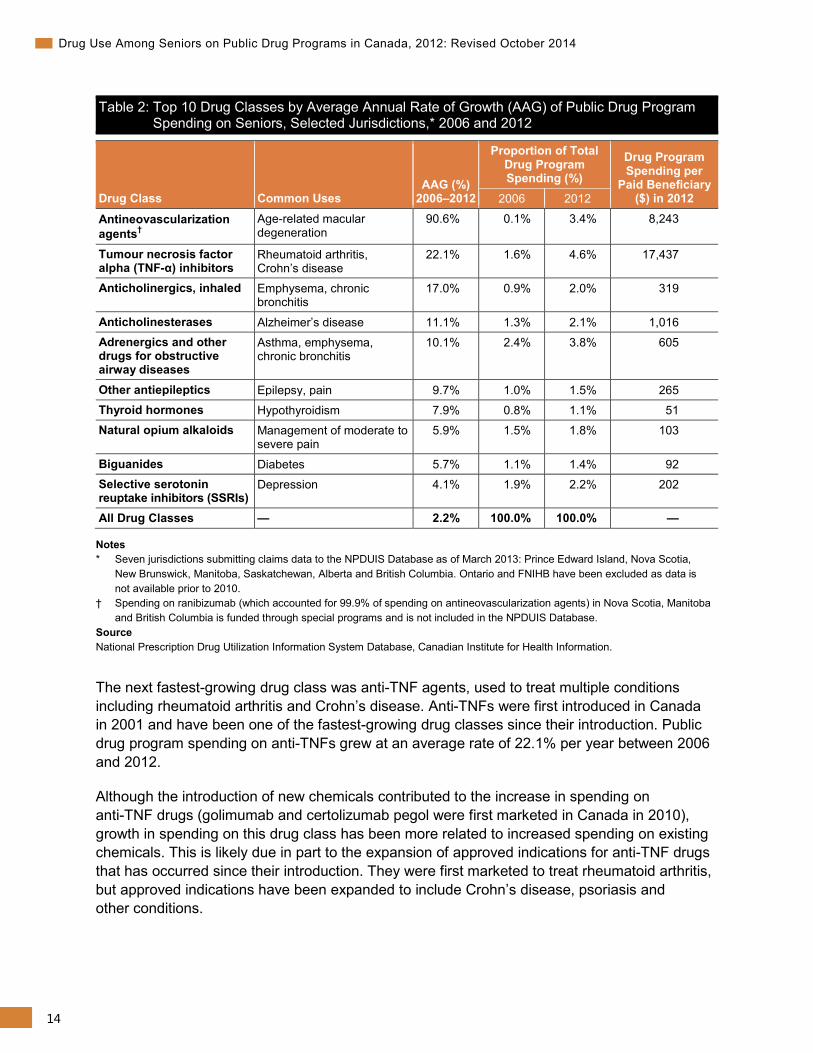
Which Drugs Had the Largest Increases in Drug Program Spending on Seniors? Between 2006 and 2012, antineovascularization agents were the fastest-growing drug class in terms of drug program spending on seniors, with drug program spending increasing at an average annual rate of 90.6% (Table 2). This is due to the increased use of ranibizumab (first marketed in Canada in 2007 under the brand name Lucentis), used to treat age-related macular degeneration, which accounted for 99.9% of drug program spending on antineovascularization agents in 2012. It should be noted that public spending on ranibizumab in Nova Scotia, Manitoba and British Columbia is paid through special programs and not included in NPDUIS Database drug claims data.
14
Drug Use Among Seniors on Public Drug Programs in Canada, 2012: Revised October 2014
Table 2: Top 10 Drug Classes by Average Annual Rate of Growth (AAG) of Public Drug Program Spending on Seniors, Selected Jurisdictions,* 2006 and 2012
Drug Class Common Uses AAG (%)
2006–2012
Proportion of Total Drug Program Spending (%)
Drug Program Spending per
Paid Beneficiary ($) in 2012 2006 2012
Antineovascularization agents†
Age-related macular degeneration
90.6% 0.1% 3.4% 8,243
Tumour necrosis factor alpha (TNF-α) inhibitors
Rheumatoid arthritis, Crohn’s disease
22.1% 1.6% 4.6% 17,437
Anticholinergics, inhaled Emphysema, chronic bronchitis
17.0% 0.9% 2.0% 319
Anticholinesterases Alzheimer’s disease 11.1% 1.3% 2.1% 1,016 Adrenergics and other drugs for obstructive airway diseases
Asthma, emphysema, chronic bronchitis
10.1% 2.4% 3.8% 605
Other antiepileptics Epilepsy, pain 9.7% 1.0% 1.5% 265 Thyroid hormones Hypothyroidism 7.9% 0.8% 1.1% 51 Natural opium alkaloids Management of moderate to
severe pain 5.9% 1.5% 1.8% 103
Biguanides Diabetes 5.7% 1.1% 1.4% 92 Selective serotonin reuptake inhibitors (SSRIs)
Depression 4.1% 1.9% 2.2% 202
All Drug Classes — 2.2% 100.0% 100.0% —
Notes * Seven jurisdictions submitting claims data to the NPDUIS Database as of March 2013: Prince Edward Island, Nova Scotia,
New Brunswick, Manitoba, Saskatchewan, Alberta and British Columbia. Ontario and FNIHB have been excluded as data is not available prior to 2010.
† Spending on ranibizumab (which accounted for 99.9% of spending on antineovascularization agents) in Nova Scotia, Manitoba and British Columbia is funded through special programs and is not included in the NPDUIS Database.
Source National Prescription Drug Utilization Information System Database, Canadian Institute for Health Information.
The next fastest-growing drug class was anti-TNF agents, used to treat multiple conditions including rheumatoid arthritis and Crohn’s disease. Anti-TNFs were first introduced in Canada in 2001 and have been one of the fastest-growing drug classes since their introduction. Public drug program spending on anti-TNFs grew at an average rate of 22.1% per year between 2006 and 2012.
Although the introduction of new chemicals contributed to the increase in spending on anti-TNF drugs (golimumab and certolizumab pegol were first marketed in Canada in 2010), growth in spending on this drug class has been more related to increased spending on existing chemicals. This is likely due in part to the expansion of approved indications for anti-TNF drugs that has occurred since their introduction. They were first marketed to treat rheumatoid arthritis, but approved indications have been expanded to include Crohn’s disease, psoriasis and other conditions.
15
Drug Use Among Seniors on Public Drug Programs in Canada, 2012: Revised October 2014
Not all drug classes experienced significant growth in spending between 2006 and 2012, and spending on three of the top four drug classes in terms of public program spending actually declined during this period. Spending on ACE inhibitors, statins and PPIs decreased at an average annual rate of 6.9%, 4.4% and 1.9%, respectively, from 2006 to 2012. While the rate of ACE inhibitor use also decreased during this period (from 30.2% to 27.5%), the use of statins and PPIs increased (statin use increased from 32.3% to 41.1% while PPI use increased from 16.3% to 21.6%). In each of these classes, patents on commonly used drugs expired, allowing for the entry of lower-priced generic alternatives.10
Drug Utilization Among Seniors This section examines drug utilization among seniors in Canada and will address the following questions:
• What is the size of the senior claimant population in each jurisdiction?
• Which drugs are most commonly used by seniors?
• Which chronic conditions are seniors using drugs to treat?
• How many drugs are seniors using?
• How many seniors are using potentially inappropriate medications?
• How does drug utilization differ among seniors living in long-term care facilities?
What Is the Size of the Senior Claimant Population in Each Jurisdiction? In 2012, there were nearly 3.5 million seniors who had claims for at least one drug from the public drug programs in the nine jurisdictions where NPDUIS Database data was available. (For details on public drug coverage available to seniors, see Appendix C.) Ontario accounted for more than half (54.2%) of the senior claimant population in the nine jurisdictions. British Columbia and Alberta made up the next highest proportions, at 18.5% and 11.3%, respectively, while P.E.I. accounted for the lowest proportion of seniors, at 0.6%.
The age distribution of senior claimants varied across the nine jurisdictions (see Appendix D).ii Saskatchewan had the highest proportion of senior claimants age 85 and older, at 18.6%, while Alberta had the lowest proportion, at 13.1%.iii FNIHB’s population is younger than that of the provinces, with 66.5% of its senior claimants population between the ages of 65 and 74.11 Among the provinces, the proportion of senior claimants age 65 to 74 ranged from 47.4% in Saskatchewan to 54.3% in P.E.I.
ii. Population data comes from Statistics Canada, Estimates of Population. The population estimates for 2006 are considered final,
while interim population estimates were used for 2012. iii. FNIHB likely has a lower proportion of claimants age 85 and older; however, the ages of claimants older than 75 cannot be
distinguished in its claims data.
16
Drug Use Among Seniors on Public Drug Programs in Canada, 2012: Revised October 2014
The proportion of seniors with accepted claims from public drug programs in the nine jurisdictions in 2012 varied from 56.0% in New Brunswick to 95.7% in Ontario (see Appendix E).iv The higher percentage in Ontario is due in part to the fact that it provides coverage to seniors covered by FNIHB (costs are shared between the two programs), whereas these seniors are ineligible for provincial coverage in other provinces.v The lower percentages in New Brunswick (56.0%) and Nova Scotia (67.2%) are most likely due to plan design (see Appendix B). There may be differences in population characteristics (such as age and health status) between seniors with and without public coverage. In provinces with lower proportions of seniors who have claims accepted by the public plan, drug utilization patterns among those with public coverage are less likely to be reflective of utilization patterns among all seniors in the province.
The proportion of seniors with paid claims showed even greater variability among the jurisdictions, ranging from 41.0% in Manitoba to 95.7% in Ontario (see Appendix E).vi In jurisdictions where the public drug program pays a portion of every claim (Nova Scotia, New Brunswick, Ontario and Alberta), the proportion of seniors with paid claims is nearly identical to the proportion with accepted claims. In provinces with either fixed copayments or deductibles, the number of seniors with paid claims will be lower than the number with accepted claims. The difference is greatest in Manitoba and B.C., both which apply a deductible for a large portion of beneficiaries.
From 2006 to 2012, the proportion of seniors who had drug claims accepted by the public drug programs remained relatively stable in all provinces, with the exception of P.E.I., where the proportion of seniors with accepted claims increased from 81.0% to 91.8%.
In Nova Scotia, New Brunswick and Alberta, the proportion of seniors with paid claims remained relatively stable between 2006 and 2012. In Saskatchewan, the proportion increased significantly when a maximum copayment was introduced for a large number of seniors on July 1, 2007. In P.E.I., there was also an increase, similar to that observed in the proportion of seniors with accepted claims. There was a decrease in the proportion of seniors with claims paid by the public drug programs in B.C. and Manitoba. The decrease in Manitoba was likely due in part to changes in deductible levels, while the decrease in B.C. was due in part to the implementation of an income-based plan for seniors in 2003.vii, viii
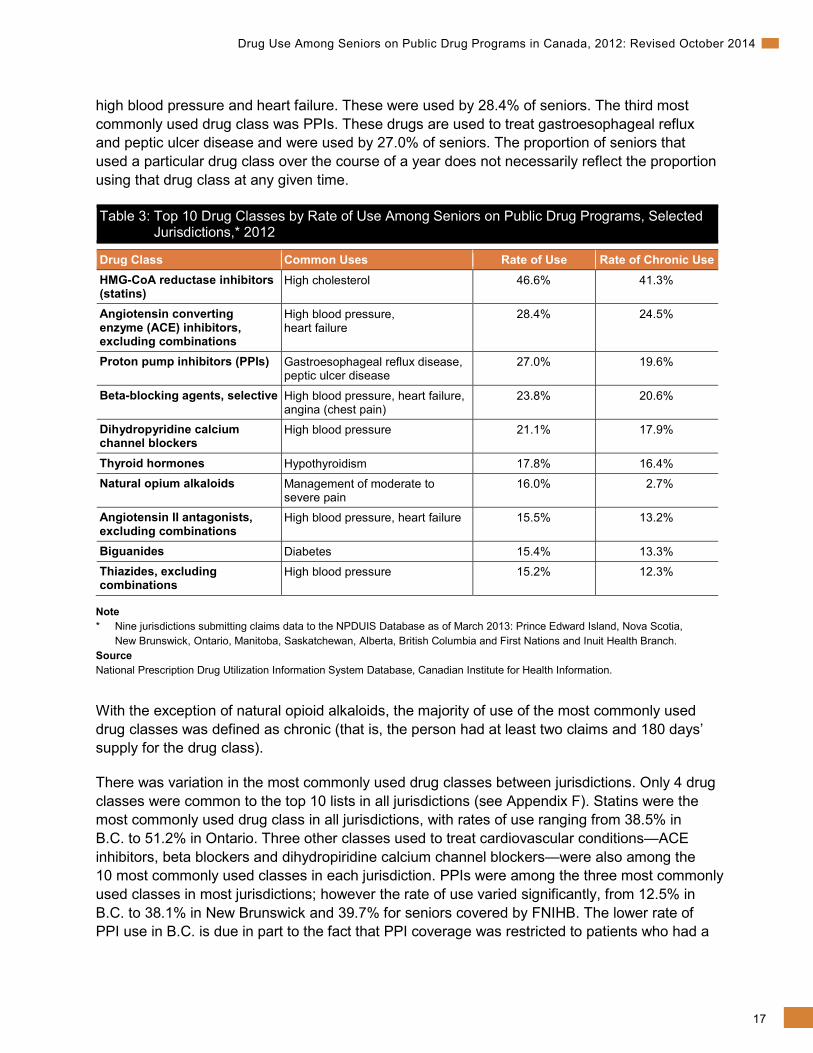
Which Drugs Are Most Commonly Used by Seniors? In 2012, 6 of the 10 most commonly used drug classes among seniors on public drug programs were cardiovascular-related (Table 3). The most commonly used drug class was statins, which are used to lower cholesterol. Nearly half (46.6%) of seniors had at least one claim for a statin in 2012. The next most commonly used drug class was ACE inhibitors, which are used to treat
iv. An accepted claim is where the drug program accepts at least a portion of the cost, either toward a deductible or
for reimbursement. v. If the FNIHB population is subtracted from the populations in Saskatchewan and Manitoba, the proportion of seniors with
accepted claims increases to 96.0% and 95.9%, respectively. vi. A paid claim is a claim for which the drug program paid at least a portion of the cost. vii. From April 1, 2008, to April 1, 2013, deductibles in Manitoba increased from between 2.56% and 5.51% to 2.85% and 6.46% of
adjusted family income. Also, in 2008, the deductible rate structure changed to include more income brackets, allowing for a more gradual increase in deductibles.
viii. Residents in B.C. born before 1939 are eligible for a reduced deductible based on family income.
17
Drug Use Among Seniors on Public Drug Programs in Canada, 2012: Revised October 2014
high blood pressure and heart failure. These were used by 28.4% of seniors. The third most commonly used drug class was PPIs. These drugs are used to treat gastroesophageal reflux and peptic ulcer disease and were used by 27.0% of seniors. The proportion of seniors that used a particular drug class over the course of a year does not necessarily reflect the proportion using that drug class at any given time.
Table 3: Top 10 Drug Classes by Rate of Use Among Seniors on Public Drug Programs, Selected Jurisdictions,* 2012
Drug Class Common Uses Rate of Use Rate of Chronic Use HMG-CoA reductase inhibitors (statins)
High cholesterol 46.6% 41.3%
Angiotensin converting enzyme (ACE) inhibitors, excluding combinations
High blood pressure, heart failure
28.4% 24.5%
Proton pump inhibitors (PPIs) Gastroesophageal reflux disease, peptic ulcer disease
27.0% 19.6%
Beta-blocking agents, selective High blood pressure, heart failure, angina (chest pain)
23.8% 20.6%
Dihydropyridine calcium channel blockers
High blood pressure 21.1% 17.9%
Thyroid hormones Hypothyroidism 17.8% 16.4% Natural opium alkaloids Management of moderate to
severe pain 16.0% 2.7%
Angiotensin II antagonists, excluding combinations
High blood pressure, heart failure 15.5% 13.2%
Biguanides Diabetes 15.4% 13.3% Thiazides, excluding combinations
High blood pressure 15.2% 12.3%
Note * Nine jurisdictions submitting claims data to the NPDUIS Database as of March 2013: Prince Edward Island, Nova Scotia,
New Brunswick, Ontario, Manitoba, Saskatchewan, Alberta, British Columbia and First Nations and Inuit Health Branch. Source National Prescription Drug Utilization Information System Database, Canadian Institute for Health Information.
With the exception of natural opioid alkaloids, the majority of use of the most commonly used drug classes was defined as chronic (that is, the person had at least two claims and 180 days’ supply for the drug class).
There was variation in the most commonly used drug classes between jurisdictions. Only 4 drug classes were common to the top 10 lists in all jurisdictions (see Appendix F). Statins were the most commonly used drug class in all jurisdictions, with rates of use ranging from 38.5% in B.C. to 51.2% in Ontario. Three other classes used to treat cardiovascular conditions—ACE inhibitors, beta blockers and dihydropiridine calcium channel blockers—were also among the 10 most commonly used classes in each jurisdiction. PPIs were among the three most commonly used classes in most jurisdictions; however the rate of use varied significantly, from 12.5% in B.C. to 38.1% in New Brunswick and 39.7% for seniors covered by FNIHB. The lower rate of PPI use in B.C. is due in part to the fact that PPI coverage was restricted to patients who had a
18
Drug Use Among Seniors on Public Drug Programs in Canada, 2012: Revised October 2014
documented failure or intolerance to adequate doses of an H2 receptor antagonist (for example, ranitidine). Some other jurisdictions also had restrictions for PPI coverage (for example, providing coverage for limited treatment durations) but did not require that H2RAs be used prior to the initial PPI treatment.
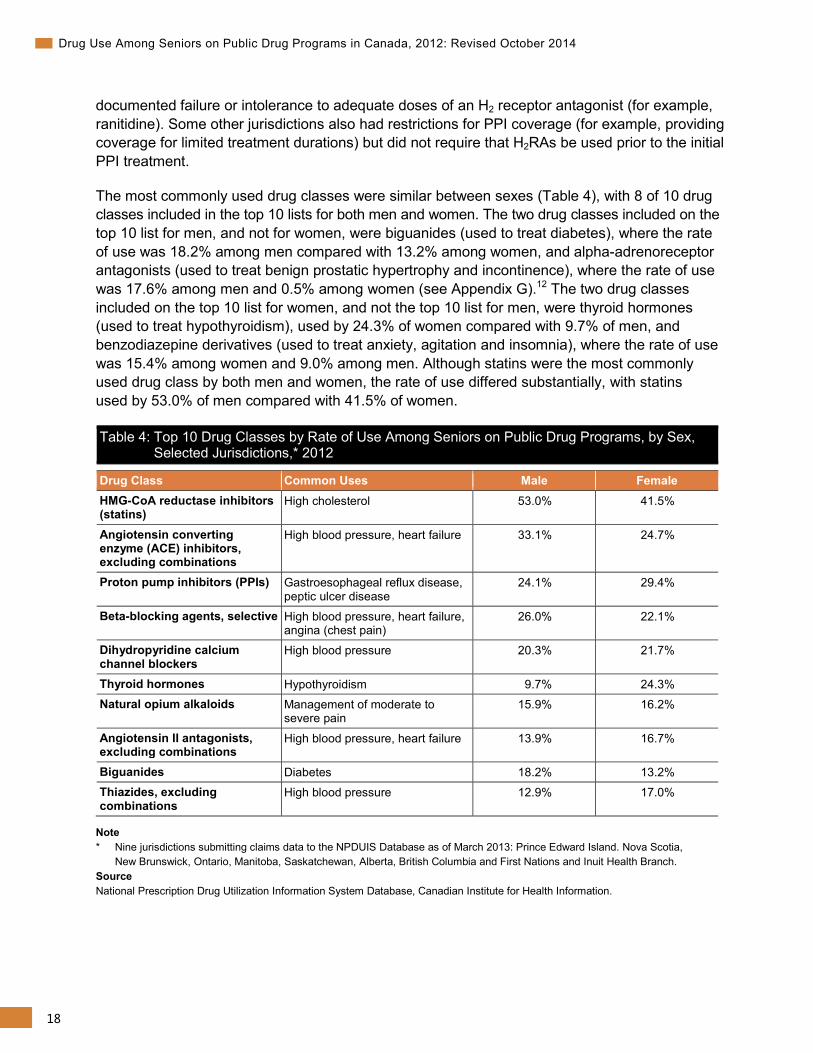
The most commonly used drug classes were similar between sexes (Table 4), with 8 of 10 drug classes included in the top 10 lists for both men and women. The two drug classes included on the top 10 list for men, and not for women, were biguanides (used to treat diabetes), where the rate of use was 18.2% among men compared with 13.2% among women, and alpha-adrenoreceptor antagonists (used to treat benign prostatic hypertrophy and incontinence), where the rate of use was 17.6% among men and 0.5% among women (see Appendix G).12 The two drug classes included on the top 10 list for women, and not the top 10 list for men, were thyroid hormones (used to treat hypothyroidism), used by 24.3% of women compared with 9.7% of men, and benzodiazepine derivatives (used to treat anxiety, agitation and insomnia), where the rate of use was 15.4% among women and 9.0% among men. Although statins were the most commonly used drug class by both men and women, the rate of use differed substantially, with statins used by 53.0% of men compared with 41.5% of women.
Table 4: Top 10 Drug Classes by Rate of Use Among Seniors on Public Drug Programs, by Sex, Selected Jurisdictions,* 2012
Drug Class Common Uses Male Female HMG-CoA reductase inhibitors (statins)
High cholesterol 53.0% 41.5%
Angiotensin converting enzyme (ACE) inhibitors, excluding combinations
High blood pressure, heart failure 33.1% 24.7%
Proton pump inhibitors (PPIs) Gastroesophageal reflux disease, peptic ulcer disease
24.1% 29.4%
Beta-blocking agents, selective High blood pressure, heart failure, angina (chest pain)
26.0% 22.1%
Dihydropyridine calcium channel blockers
High blood pressure 20.3% 21.7%
Thyroid hormones Hypothyroidism 9.7% 24.3% Natural opium alkaloids Management of moderate to
severe pain 15.9% 16.2%
Angiotensin II antagonists, excluding combinations
High blood pressure, heart failure 13.9% 16.7%
Biguanides Diabetes 18.2% 13.2% Thiazides, excluding combinations
High blood pressure 12.9% 17.0%
Note * Nine jurisdictions submitting claims data to the NPDUIS Database as of March 2013: Prince Edward Island. Nova Scotia,
New Brunswick, Ontario, Manitoba, Saskatchewan, Alberta, British Columbia and First Nations and Inuit Health Branch. Source National Prescription Drug Utilization Information System Database, Canadian Institute for Health Information.
19
Drug Use Among Seniors on Public Drug Programs in Canada, 2012: Revised October 2014
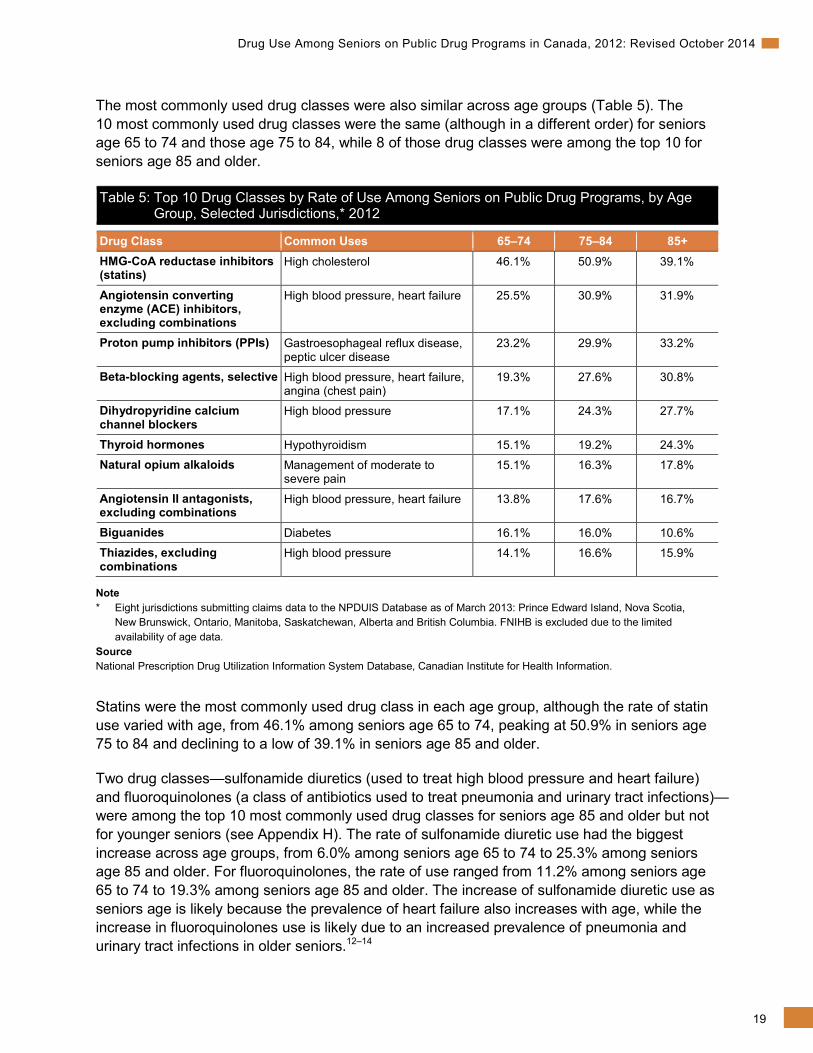
The most commonly used drug classes were also similar across age groups (Table 5). The 10 most commonly used drug classes were the same (although in a different order) for seniors age 65 to 74 and those age 75 to 84, while 8 of those drug classes were among the top 10 for seniors age 85 and older.
Table 5: Top 10 Drug Classes by Rate of Use Among Seniors on Public Drug Programs, by Age Group, Selected Jurisdictions,* 2012
Drug Class Common Uses 65–74 75–84 85+ HMG-CoA reductase inhibitors (statins)
High cholesterol 46.1% 50.9% 39.1%
Angiotensin converting enzyme (ACE) inhibitors, excluding combinations
High blood pressure, heart failure 25.5% 30.9% 31.9%
Proton pump inhibitors (PPIs) Gastroesophageal reflux disease, peptic ulcer disease
23.2% 29.9% 33.2%
Beta-blocking agents, selective High blood pressure, heart failure, angina (chest pain)
19.3% 27.6% 30.8%
Dihydropyridine calcium channel blockers
High blood pressure 17.1% 24.3% 27.7%
Thyroid hormones Hypothyroidism 15.1% 19.2% 24.3% Natural opium alkaloids Management of moderate to
severe pain 15.1% 16.3% 17.8%
Angiotensin II antagonists, excluding combinations
High blood pressure, heart failure 13.8% 17.6% 16.7%
Biguanides Diabetes 16.1% 16.0% 10.6% Thiazides, excluding combinations
High blood pressure 14.1% 16.6% 15.9%
Note * Eight jurisdictions submitting claims data to the NPDUIS Database as of March 2013: Prince Edward Island, Nova Scotia,
New Brunswick, Ontario, Manitoba, Saskatchewan, Alberta and British Columbia. FNIHB is excluded due to the limited availability of age data.
Source National Prescription Drug Utilization Information System Database, Canadian Institute for Health Information.
Statins were the most commonly used drug class in each age group, although the rate of statin use varied with age, from 46.1% among seniors age 65 to 74, peaking at 50.9% in seniors age 75 to 84 and declining to a low of 39.1% in seniors age 85 and older.
Two drug classes—sulfonamide diuretics (used to treat high blood pressure and heart failure) and fluoroquinolones (a class of antibiotics used to treat pneumonia and urinary tract infections)—were among the top 10 most commonly used drug classes for seniors age 85 and older but not for younger seniors (see Appendix H). The rate of sulfonamide diuretic use had the biggest increase across age groups, from 6.0% among seniors age 65 to 74 to 25.3% among seniors age 85 and older. For fluoroquinolones, the rate of use ranged from 11.2% among seniors age 65 to 74 to 19.3% among seniors age 85 and older. The increase of sulfonamide diuretic use as seniors age is likely because the prevalence of heart failure also increases with age, while the increase in fluoroquinolones use is likely due to an increased prevalence of pneumonia and urinary tract infections in older seniors.12–14
20
Drug Use Among Seniors on Public Drug Programs in Canada, 2012: Revised October 2014
Which Chronic Conditions Are Seniors Using Drugs to Treat? Seniors are known to have a higher prevalence of certain chronic conditions and, on average, a higher number of chronic conditions than younger populations.3–6 In this section, seven chronic conditions were identified by the chronic use of drug classes commonly prescribed to treat them. (For information on how chronic conditions were defined, see Appendix B.) Chronic use of these drugs was defined as a person having at least two claims and 180 days’ supply for a specific drug class.
Identifying chronic conditions through prescribed drugs is not ideal, as conditions are not always treated with medication. Also, some drugs can be used to treat multiple conditions, and the NPDUIS Database does not contain information regarding the diagnosis or condition for which a prescription was written. However, by identifying the most common indications for the drug classes, drug use can be used to estimate the proportion of seniors with specific conditions.
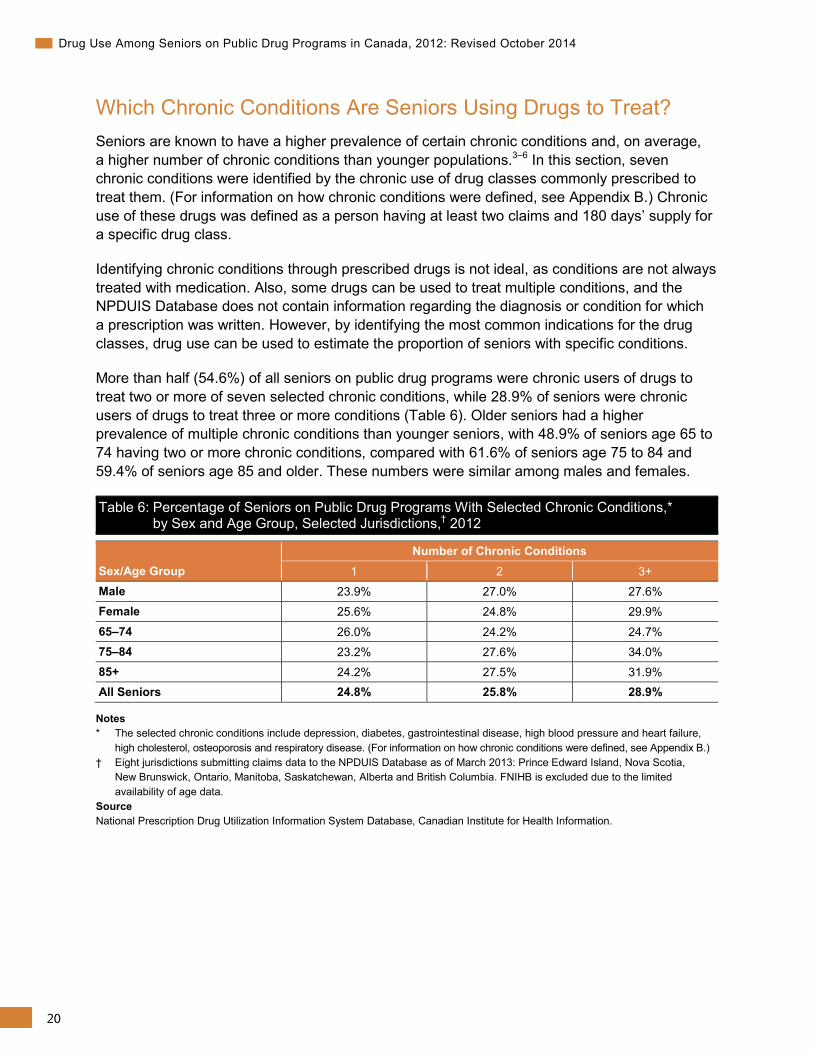
More than half (54.6%) of all seniors on public drug programs were chronic users of drugs to treat two or more of seven selected chronic conditions, while 28.9% of seniors were chronic users of drugs to treat three or more conditions (Table 6). Older seniors had a higher prevalence of multiple chronic conditions than younger seniors, with 48.9% of seniors age 65 to 74 having two or more chronic conditions, compared with 61.6% of seniors age 75 to 84 and 59.4% of seniors age 85 and older. These numbers were similar among males and females.
Table 6: Percentage of Seniors on Public Drug Programs With Selected Chronic Conditions,* by Sex and Age Group, Selected Jurisdictions,† 2012
Sex/Age Group Number of Chronic Conditions
1 2 3+ Male 23.9% 27.0% 27.6% Female 25.6% 24.8% 29.9%
65–74 26.0% 24.2% 24.7% 75–84 23.2% 27.6% 34.0% 85+ 24.2% 27.5% 31.9% All Seniors 24.8% 25.8% 28.9%
Notes * The selected chronic conditions include depression, diabetes, gastrointestinal disease, high blood pressure and heart failure,
high cholesterol, osteoporosis and respiratory disease. (For information on how chronic conditions were defined, see Appendix B.) † Eight jurisdictions submitting claims data to the NPDUIS Database as of March 2013: Prince Edward Island, Nova Scotia,
New Brunswick, Ontario, Manitoba, Saskatchewan, Alberta and British Columbia. FNIHB is excluded due to the limited availability of age data.
Source National Prescription Drug Utilization Information System Database, Canadian Institute for Health Information.
21
Drug Use Among Seniors on Public Drug Programs in Canada, 2012: Revised October 2014
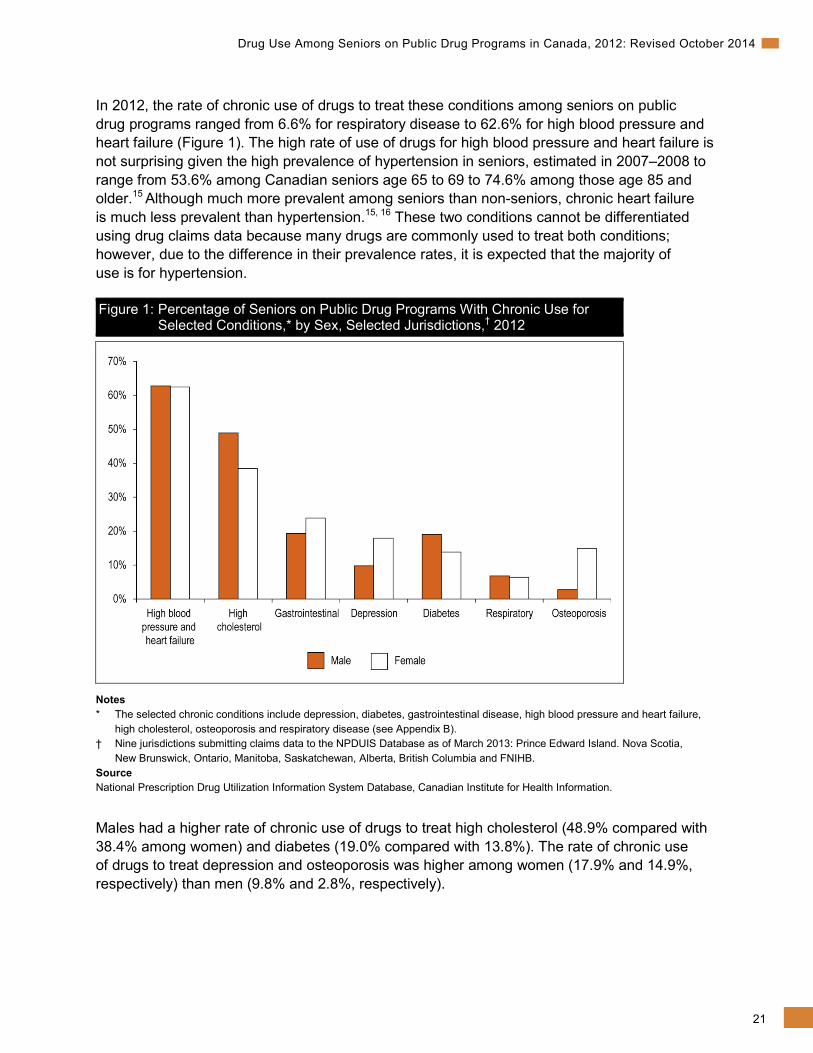
In 2012, the rate of chronic use of drugs to treat these conditions among seniors on public drug programs ranged from 6.6% for respiratory disease to 62.6% for high blood pressure and heart failure (Figure 1). The high rate of use of drugs for high blood pressure and heart failure is not surprising given the high prevalence of hypertension in seniors, estimated in 2007–2008 to range from 53.6% among Canadian seniors age 65 to 69 to 74.6% among those age 85 and older.15 Although much more prevalent among seniors than non-seniors, chronic heart failure is much less prevalent than hypertension.15, 16 These two conditions cannot be differentiated using drug claims data because many drugs are commonly used to treat both conditions; however, due to the difference in their prevalence rates, it is expected that the majority of use is for hypertension.
Figure 1: Percentage of Seniors on Public Drug Programs With Chronic Use for Selected Conditions,* by Sex, Selected Jurisdictions,† 2012
Notes * The selected chronic conditions include depression, diabetes, gastrointestinal disease, high blood pressure and heart failure,
high cholesterol, osteoporosis and respiratory disease (see Appendix B). † Nine jurisdictions submitting claims data to the NPDUIS Database as of March 2013: Prince Edward Island. Nova Scotia,
New Brunswick, Ontario, Manitoba, Saskatchewan, Alberta, British Columbia and FNIHB. Source National Prescription Drug Utilization Information System Database, Canadian Institute for Health Information.
Males had a higher rate of chronic use of drugs to treat high cholesterol (48.9% compared with 38.4% among women) and diabetes (19.0% compared with 13.8%). The rate of chronic use of drugs to treat depression and osteoporosis was higher among women (17.9% and 14.9%, respectively) than men (9.8% and 2.8%, respectively).
22
Drug Use Among Seniors on Public Drug Programs in Canada, 2012: Revised October 2014
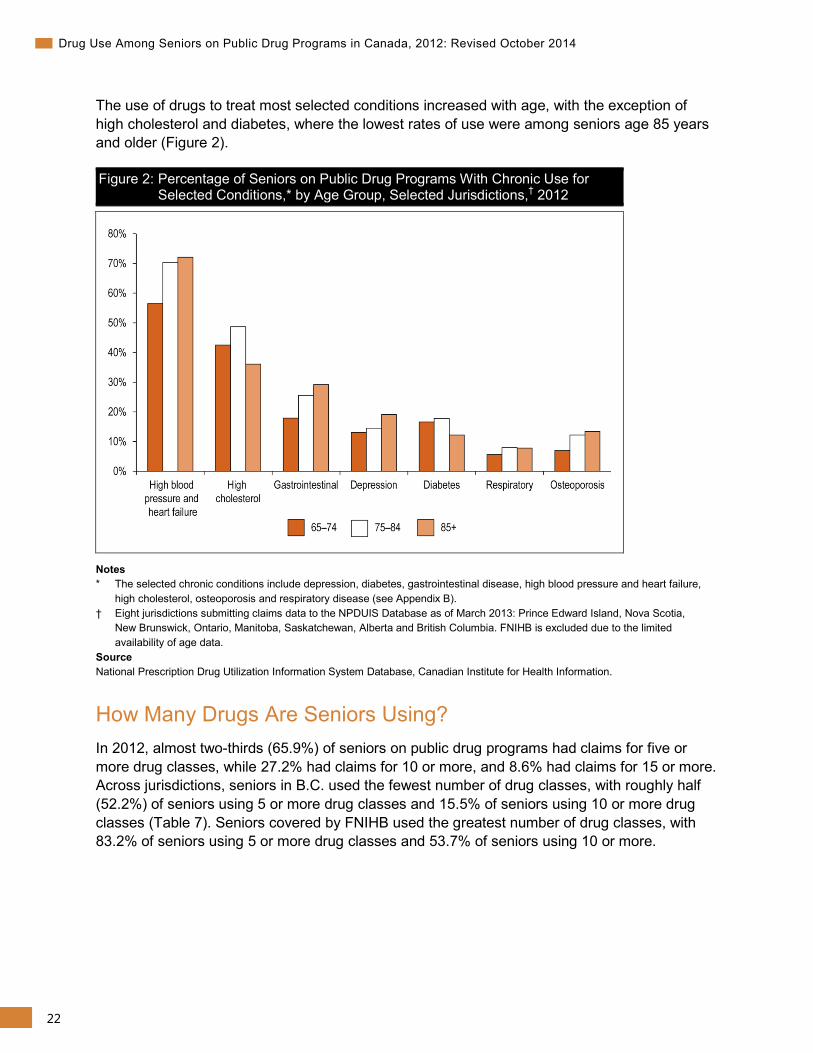
The use of drugs to treat most selected conditions increased with age, with the exception of high cholesterol and diabetes, where the lowest rates of use were among seniors age 85 years and older (Figure 2).
Figure 2: Percentage of Seniors on Public Drug Programs With Chronic Use for Selected Conditions,* by Age Group, Selected Jurisdictions,† 2012
Notes * The selected chronic conditions include depression, diabetes, gastrointestinal disease, high blood pressure and heart failure,
high cholesterol, osteoporosis and respiratory disease (see Appendix B). † Eight jurisdictions submitting claims data to the NPDUIS Database as of March 2013: Prince Edward Island, Nova Scotia,
New Brunswick, Ontario, Manitoba, Saskatchewan, Alberta and British Columbia. FNIHB is excluded due to the limited availability of age data.
Source National Prescription Drug Utilization Information System Database, Canadian Institute for Health Information.
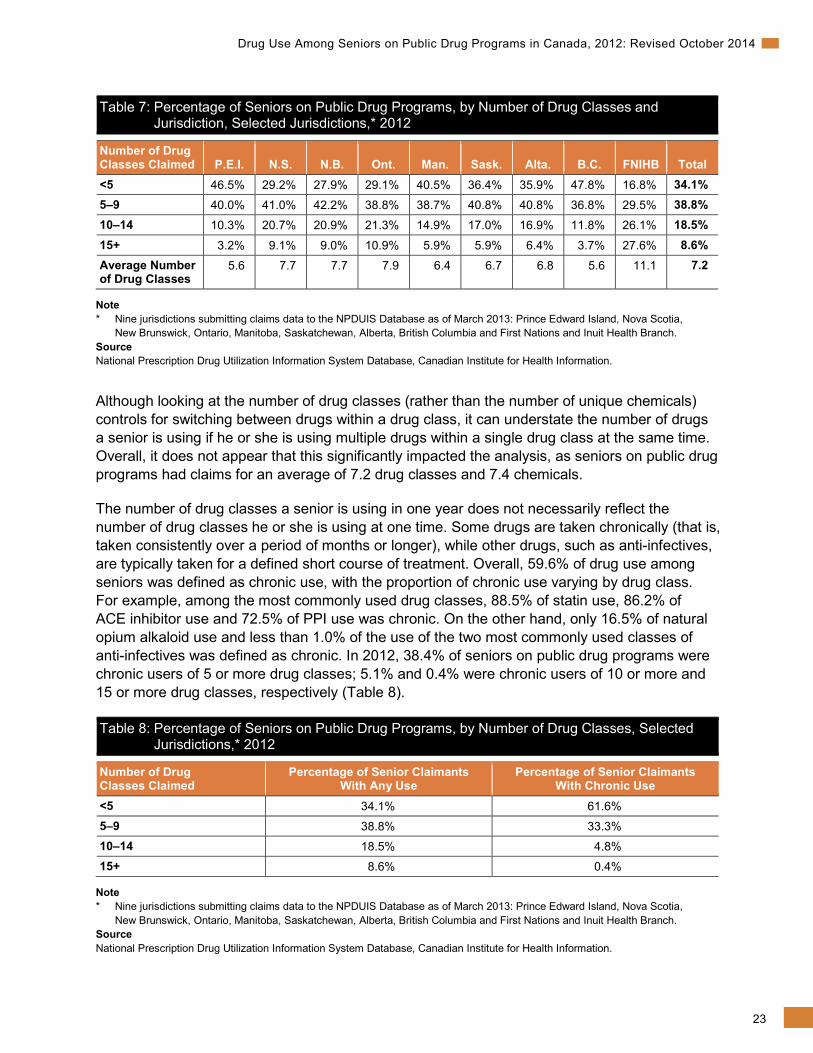
How Many Drugs Are Seniors Using? In 2012, almost two-thirds (65.9%) of seniors on public drug programs had claims for five or more drug classes, while 27.2% had claims for 10 or more, and 8.6% had claims for 15 or more. Across jurisdictions, seniors in B.C. used the fewest number of drug classes, with roughly half (52.2%) of seniors using 5 or more drug classes and 15.5% of seniors using 10 or more drug classes (Table 7). Seniors covered by FNIHB used the greatest number of drug classes, with 83.2% of seniors using 5 or more drug classes and 53.7% of seniors using 10 or more.
23
Drug Use Among Seniors on Public Drug Programs in Canada, 2012: Revised October 2014
Table 7: Percentage of Seniors on Public Drug Programs, by Number of Drug Classes and Jurisdiction, Selected Jurisdictions,* 2012
Number of Drug Classes Claimed P.E.I. N.S. N.B. Ont. Man. Sask. Alta. B.C. FNIHB Total <5 46.5% 29.2% 27.9% 29.1% 40.5% 36.4% 35.9% 47.8% 16.8% 34.1% 5–9 40.0% 41.0% 42.2% 38.8% 38.7% 40.8% 40.8% 36.8% 29.5% 38.8% 10–14 10.3% 20.7% 20.9% 21.3% 14.9% 17.0% 16.9% 11.8% 26.1% 18.5% 15+ 3.2% 9.1% 9.0% 10.9% 5.9% 5.9% 6.4% 3.7% 27.6% 8.6% Average Number of Drug Classes
5.6 7.7 7.7 7.9 6.4 6.7 6.8 5.6 11.1 7.2
Note * Nine jurisdictions submitting claims data to the NPDUIS Database as of March 2013: Prince Edward Island, Nova Scotia,
New Brunswick, Ontario, Manitoba, Saskatchewan, Alberta, British Columbia and First Nations and Inuit Health Branch. Source National Prescription Drug Utilization Information System Database, Canadian Institute for Health Information.
Although looking at the number of drug classes (rather than the number of unique chemicals) controls for switching between drugs within a drug class, it can understate the number of drugs a senior is using if he or she is using multiple drugs within a single drug class at the same time. Overall, it does not appear that this significantly impacted the analysis, as seniors on public drug programs had claims for an average of 7.2 drug classes and 7.4 chemicals.
The number of drug classes a senior is using in one year does not necessarily reflect the number of drug classes he or she is using at one time. Some drugs are taken chronically (that is, taken consistently over a period of months or longer), while other drugs, such as anti-infectives, are typically taken for a defined short course of treatment. Overall, 59.6% of drug use among seniors was defined as chronic use, with the proportion of chronic use varying by drug class. For example, among the most commonly used drug classes, 88.5% of statin use, 86.2% of ACE inhibitor use and 72.5% of PPI use was chronic. On the other hand, only 16.5% of natural opium alkaloid use and less than 1.0% of the use of the two most commonly used classes of anti-infectives was defined as chronic. In 2012, 38.4% of seniors on public drug programs were chronic users of 5 or more drug classes; 5.1% and 0.4% were chronic users of 10 or more and 15 or more drug classes, respectively (Table 8).
Table 8: Percentage of Seniors on Public Drug Programs, by Number of Drug Classes, Selected Jurisdictions,* 2012
Number of Drug Classes Claimed
Percentage of Senior Claimants With Any Use
Percentage of Senior Claimants With Chronic Use
<5 34.1% 61.6% 5–9 38.8% 33.3% 10–14 18.5% 4.8% 15+ 8.6% 0.4%
Note * Nine jurisdictions submitting claims data to the NPDUIS Database as of March 2013: Prince Edward Island, Nova Scotia,
New Brunswick, Ontario, Manitoba, Saskatchewan, Alberta, British Columbia and First Nations and Inuit Health Branch. Source National Prescription Drug Utilization Information System Database, Canadian Institute for Health Information.
24
Drug Use Among Seniors on Public Drug Programs in Canada, 2012: Revised October 2014
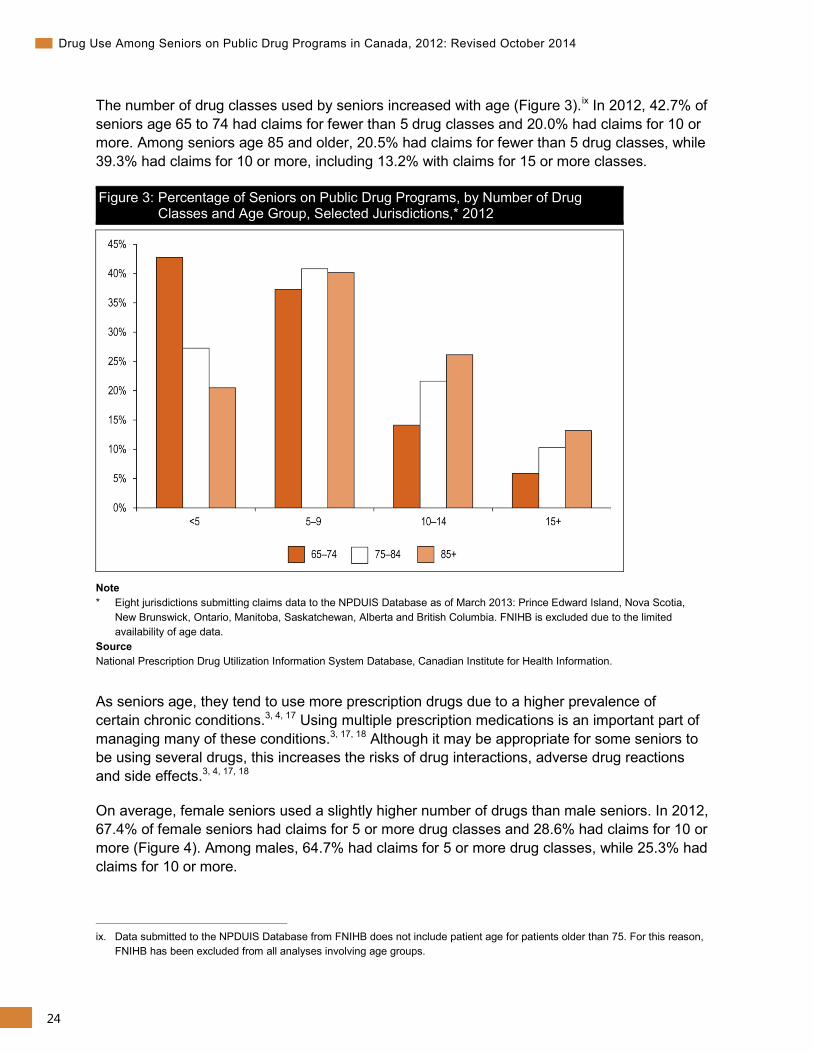
The number of drug classes used by seniors increased with age (Figure 3).ix In 2012, 42.7% of seniors age 65 to 74 had claims for fewer than 5 drug classes and 20.0% had claims for 10 or more. Among seniors age 85 and older, 20.5% had claims for fewer than 5 drug classes, while 39.3% had claims for 10 or more, including 13.2% with claims for 15 or more classes.
Figure 3: Percentage of Seniors on Public Drug Programs, by Number of Drug Classes and Age Group, Selected Jurisdictions,* 2012
Note * Eight jurisdictions submitting claims data to the NPDUIS Database as of March 2013: Prince Edward Island, Nova Scotia,
New Brunswick, Ontario, Manitoba, Saskatchewan, Alberta and British Columbia. FNIHB is excluded due to the limited availability of age data.
Source National Prescription Drug Utilization Information System Database, Canadian Institute for Health Information.
As seniors age, they tend to use more prescription drugs due to a higher prevalence of certain chronic conditions.3, 4, 17 Using multiple prescription medications is an important part of managing many of these conditions.3, 17, 18 Although it may be appropriate for some seniors to be using several drugs, this increases the risks of drug interactions, adverse drug reactions and side effects.3, 4, 17, 18
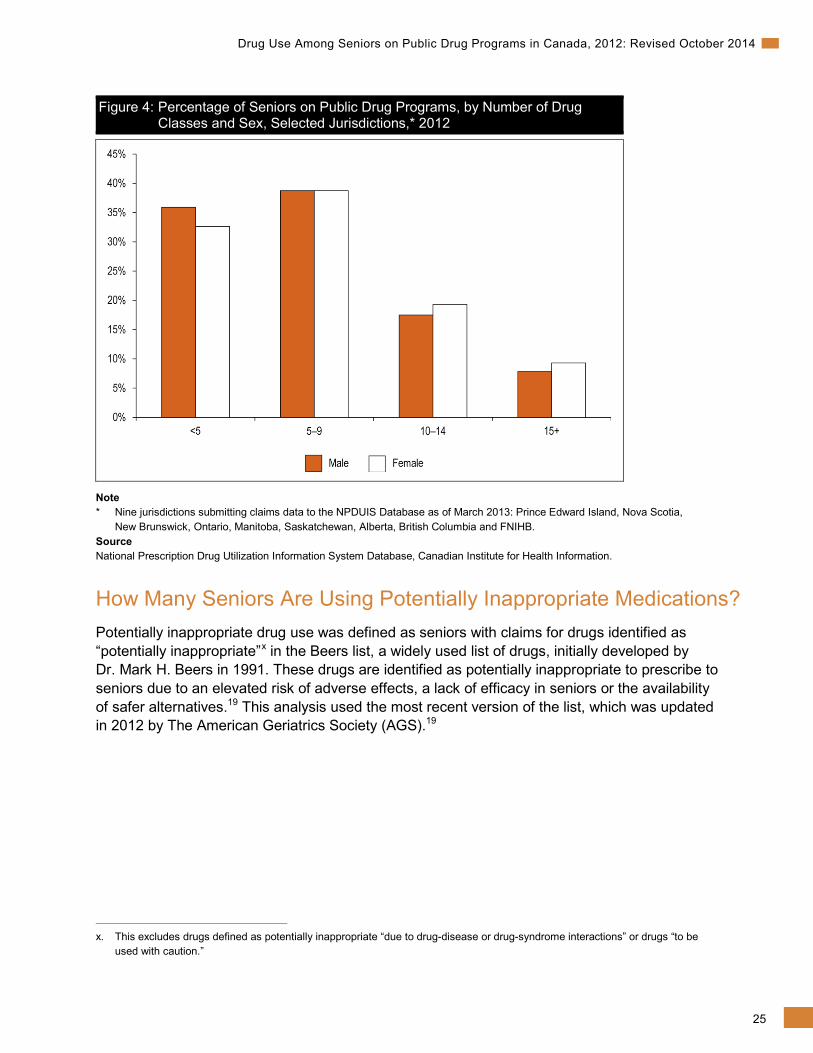
On average, female seniors used a slightly higher number of drugs than male seniors. In 2012, 67.4% of female seniors had claims for 5 or more drug classes and 28.6% had claims for 10 or more (Figure 4). Among males, 64.7% had claims for 5 or more drug classes, while 25.3% had claims for 10 or more.
ix. Data submitted to the NPDUIS Database from FNIHB does not include patient age for patients older than 75. For this reason,
FNIHB has been excluded from all analyses involving age groups.
25
Drug Use Among Seniors on Public Drug Programs in Canada, 2012: Revised October 2014
Figure 4: Percentage of Seniors on Public Drug Programs, by Number of Drug Classes and Sex, Selected Jurisdictions,* 2012
Note * Nine jurisdictions submitting claims data to the NPDUIS Database as of March 2013: Prince Edward Island, Nova Scotia,
New Brunswick, Ontario, Manitoba, Saskatchewan, Alberta, British Columbia and FNIHB. Source National Prescription Drug Utilization Information System Database, Canadian Institute for Health Information.
How Many Seniors Are Using Potentially Inappropriate Medications? Potentially inappropriate drug use was defined as seniors with claims for drugs identified as “potentially inappropriate”x in the Beers list, a widely used list of drugs, initially developed by Dr. Mark H. Beers in 1991. These drugs are identified as potentially inappropriate to prescribe to seniors due to an elevated risk of adverse effects, a lack of efficacy in seniors or the availability of safer alternatives.19 This analysis used the most recent version of the list, which was updated in 2012 by The American Geriatrics Society (AGS).19
x. This excludes drugs defined as potentially inappropriate “due to drug-disease or drug-syndrome interactions” or drugs “to be
used with caution.”
26
Drug Use Among Seniors on Public Drug Programs in Canada, 2012: Revised October 2014
It should be noted that there are multiple approaches to identifying inappropriate drug use, and the drugs identified as potentially inappropriate vary by method.19, 20 In addition to the Beers list, other methods for identifying potentially inappropriate medication use among seniors include the Screening Tool of Older Persons’ potentially inappropriate Prescriptions (STOPP) and Screening Tool to Alert doctors to Right Treatment (START) criteria.19, 20 In addition to inappropriate prescribing, the STOPP/START criteria also examine potentially inappropriate prescribing omissions and drug–drug interactions.21 Also, the Beers list focuses on drugs available in the United States (where the Beers list was developed), while the STOPP/START criteria (developed in Ireland) focus on drugs available in Europe. It is estimated that up to 50% of the drugs that appear on the Beers list are not available in Europe.21 In an effort to make the measure of potentially inappropriate use more applicable to the Canadian market for this analysis, all benzodiazepine and benzodiazepine-related products were identified as potentially inappropriate, not only those explicitly listed in the Beers list (see Appendix B).xi This modification is based on work by the Saskatchewan Health Quality Council.7, 22
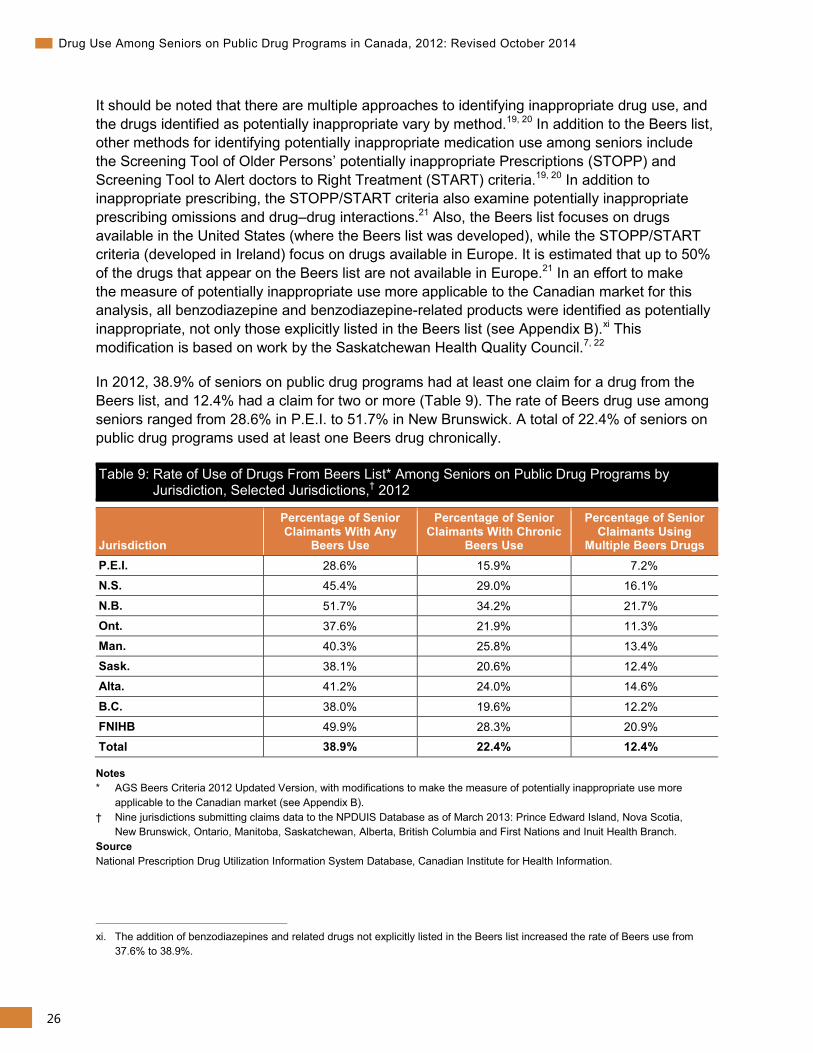
In 2012, 38.9% of seniors on public drug programs had at least one claim for a drug from the Beers list, and 12.4% had a claim for two or more (Table 9). The rate of Beers drug use among seniors ranged from 28.6% in P.E.I. to 51.7% in New Brunswick. A total of 22.4% of seniors on public drug programs used at least one Beers drug chronically.
Table 9: Rate of Use of Drugs From Beers List* Among Seniors on Public Drug Programs by Jurisdiction, Selected Jurisdictions,† 2012
Jurisdiction
Percentage of Senior Claimants With Any
Beers Use
Percentage of Senior Claimants With Chronic
Beers Use
Percentage of Senior Claimants Using
Multiple Beers Drugs P.E.I. 28.6% 15.9% 7.2% N.S. 45.4% 29.0% 16.1%
N.B. 51.7% 34.2% 21.7% Ont. 37.6% 21.9% 11.3% Man. 40.3% 25.8% 13.4% Sask. 38.1% 20.6% 12.4% Alta. 41.2% 24.0% 14.6%
B.C. 38.0% 19.6% 12.2% FNIHB 49.9% 28.3% 20.9% Total 38.9% 22.4% 12.4%
Notes * AGS Beers Criteria 2012 Updated Version, with modifications to make the measure of potentially inappropriate use more
applicable to the Canadian market (see Appendix B). † Nine jurisdictions submitting claims data to the NPDUIS Database as of March 2013: Prince Edward Island, Nova Scotia,
New Brunswick, Ontario, Manitoba, Saskatchewan, Alberta, British Columbia and First Nations and Inuit Health Branch. Source National Prescription Drug Utilization Information System Database, Canadian Institute for Health Information.
xi. The addition of benzodiazepines and related drugs not explicitly listed in the Beers list increased the rate of Beers use from
37.6% to 38.9%.
27
Drug Use Among Seniors on Public Drug Programs in Canada, 2012: Revised October 2014
Several new drugs were added in the 2012 update of the Beers list, most notably antipsychotics and several non-steroidal anti-inflammatory drugs (NSAIDs). Another major change was that benzodiazepines were added to the list regardless of dose. Previously, some benzodiazepines were considered potentially inappropriate only if they were used above a certain dose. As a result, rates of potentially inappropriate drug use measured using the 2012 update of the Beers list are much higher than those reported previously using older versions of the Beers list. For example, a 2007 CIHI report that used the 2002 version of the Beers list found that 27.2% of seniors had at least one claim for a drug from the Beers list in 2005–2006.22 In 2012, 23.1% of seniors had claims for at least one drug from the 2002 version of the Beers list, compared with 38.9% with claims from the 2012 version.
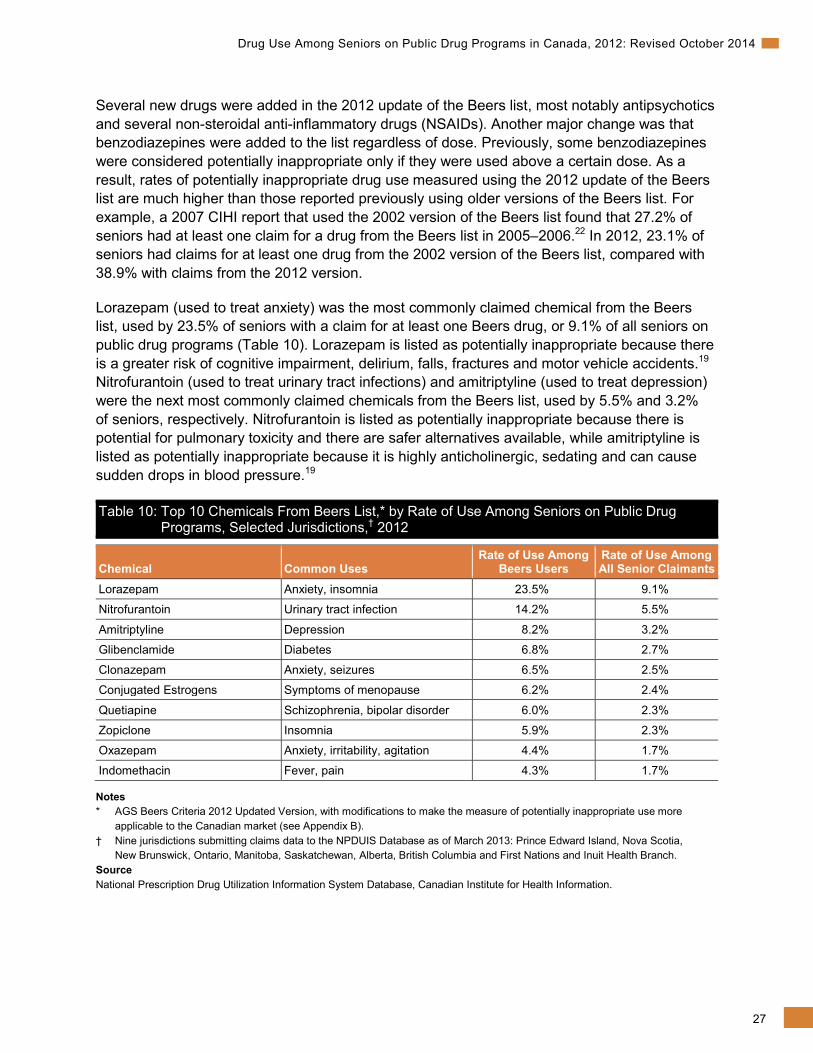
Lorazepam (used to treat anxiety) was the most commonly claimed chemical from the Beers list, used by 23.5% of seniors with a claim for at least one Beers drug, or 9.1% of all seniors on public drug programs (Table 10). Lorazepam is listed as potentially inappropriate because there is a greater risk of cognitive impairment, delirium, falls, fractures and motor vehicle accidents.19
Nitrofurantoin (used to treat urinary tract infections) and amitriptyline (used to treat depression) were the next most commonly claimed chemicals from the Beers list, used by 5.5% and 3.2% of seniors, respectively. Nitrofurantoin is listed as potentially inappropriate because there is potential for pulmonary toxicity and there are safer alternatives available, while amitriptyline is listed as potentially inappropriate because it is highly anticholinergic, sedating and can cause sudden drops in blood pressure.19
Table 10: Top 10 Chemicals From Beers List,* by Rate of Use Among Seniors on Public Drug Programs, Selected Jurisdictions,† 2012
Chemical Common Uses
Rate of Use Among Beers Users
Rate of Use Among All Senior Claimants
Lorazepam Anxiety, insomnia 23.5% 9.1%
Nitrofurantoin Urinary tract infection 14.2% 5.5%
Amitriptyline Depression 8.2% 3.2%
Glibenclamide Diabetes 6.8% 2.7%
Clonazepam Anxiety, seizures 6.5% 2.5%
Conjugated Estrogens Symptoms of menopause 6.2% 2.4%
Quetiapine Schizophrenia, bipolar disorder 6.0% 2.3%
Zopiclone Insomnia 5.9% 2.3%
Oxazepam Anxiety, irritability, agitation 4.4% 1.7%
Indomethacin Fever, pain 4.3% 1.7%
Notes * AGS Beers Criteria 2012 Updated Version, with modifications to make the measure of potentially inappropriate use more
applicable to the Canadian market (see Appendix B). † Nine jurisdictions submitting claims data to the NPDUIS Database as of March 2013: Prince Edward Island, Nova Scotia,
New Brunswick, Ontario, Manitoba, Saskatchewan, Alberta, British Columbia and First Nations and Inuit Health Branch. Source National Prescription Drug Utilization Information System Database, Canadian Institute for Health Information.
28
Drug Use Among Seniors on Public Drug Programs in Canada, 2012: Revised October 2014
It is important to note that it may be appropriate to use some of these chemicals in certain cases. According to the Beers list, 3 chemicals from the top 10 most commonly used Beers chemicals (glibenclamide, amitriptyline and indomethacin) are recommended to be avoided at all times, while others are to be avoided only for certain uses. For example, lorazepam and oxazepam are recommended to be avoided for the treatment of insomnia, agitation or delirium but are not considered potentially inappropriate when used for conditions like anxiety. Even when a Beers drug is recommended to be avoided at all times, there may be situations where it is appropriate to prescribe it for a particular patient (for example, in cases where a patient has a long history of using the Beers drug safely and effectively). Six of the top 10 chemicals from the Beers list were psychotropic drugs, used to treat a wide range of conditions, including depression, schizophrenia, bipolar disorder, anxiety and insomnia. For seniors, antipsychotics, such as quetiapine and risperidone, are also commonly used to treat the behavioural and psychological symptoms of dementia, including delusion, aggression and agitation.23 Manufacturer and regulatory warnings have been released about the risk of antipsychotic use in elderly patients who have dementia.24–27 Studies have shown that the use of psychotropic drugs is related to an increased number of falls among seniors and that the use of antipsychotics in elderly patients with dementia may be associated with a small increase in the risk of death.24, 26–29
How Does Drug Utilization Differ Among Seniors Living in Long-Term Care Facilities? This section compares drug utilization among seniors living in LTC facilities with those living in the community, using data from five provinces (P.E.I., New Brunswick, Ontario, Manitoba and B.C.). In 2012, 3.8% of seniors in these five provinces were living in LTC facilities, accounting for 7.5% of public drug program spending on seniors.
Seniors living in LTC facilities are older than seniors living in the community (see Appendix I), with 57.7% of LTC facility residents age 85 and older, compared with 14.7% of seniors living in the community. The age distribution of LTC facility residents was similar across provinces, although the population in Manitoba was older than in the other four provinces, with 64.2% of seniors living in LTC facilities age 85 and older, compared with 57.0% of seniors in the other four provinces. Differences in age can influence the number and types of chronic conditions being treated, which in turn can influence the number and types of drugs being used (Table 5 and Figure 3).
29
Drug Use Among Seniors on Public Drug Programs in Canada, 2012: Revised October 2014
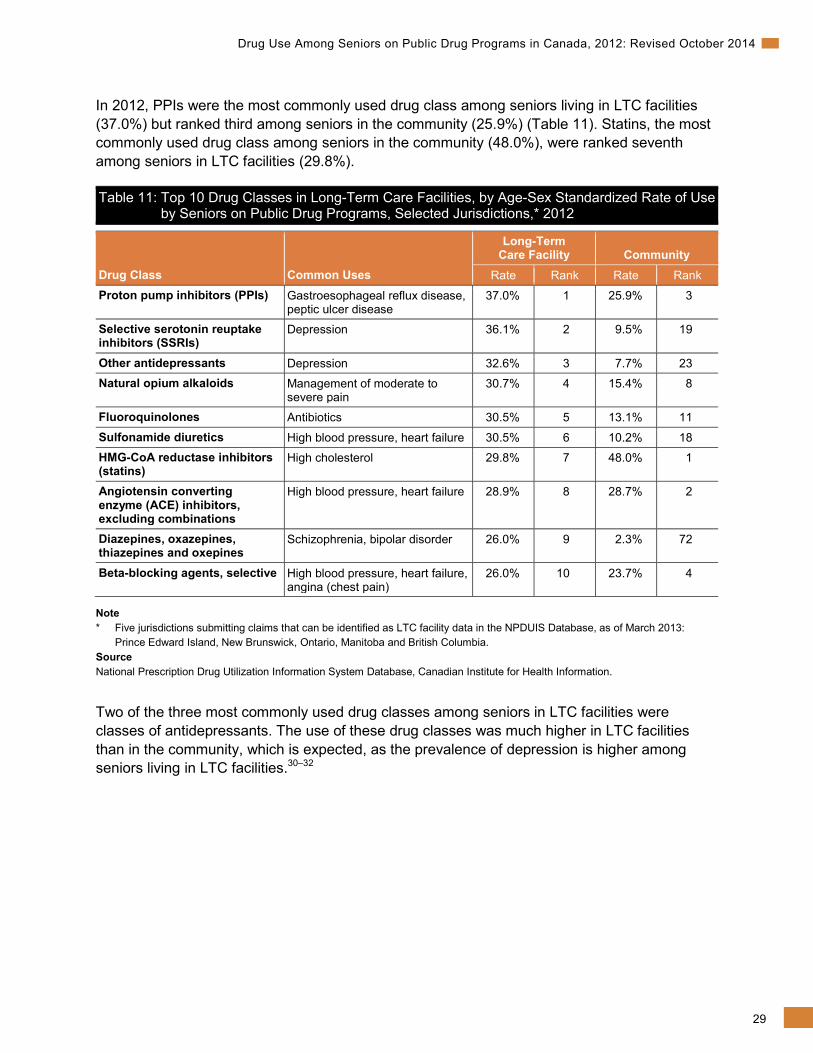
In 2012, PPIs were the most commonly used drug class among seniors living in LTC facilities (37.0%) but ranked third among seniors in the community (25.9%) (Table 11). Statins, the most commonly used drug class among seniors in the community (48.0%), were ranked seventh among seniors in LTC facilities (29.8%).
Table 11: Top 10 Drug Classes in Long-Term Care Facilities, by Age-Sex Standardized Rate of Use by Seniors on Public Drug Programs, Selected Jurisdictions,* 2012
Drug Class Common Uses
Long-Term Care Facility Community
Rate Rank Rate Rank
Proton pump inhibitors (PPIs) Gastroesophageal reflux disease, peptic ulcer disease
37.0% 1 25.9% 3
Selective serotonin reuptake inhibitors (SSRIs)
Depression 36.1% 2 9.5% 19
Other antidepressants Depression 32.6% 3 7.7% 23 Natural opium alkaloids Management of moderate to
severe pain 30.7% 4 15.4% 8
Fluoroquinolones Antibiotics 30.5% 5 13.1% 11
Sulfonamide diuretics High blood pressure, heart failure 30.5% 6 10.2% 18 HMG-CoA reductase inhibitors (statins)
High cholesterol 29.8% 7 48.0% 1
Angiotensin converting enzyme (ACE) inhibitors, excluding combinations
High blood pressure, heart failure 28.9% 8 28.7% 2
Diazepines, oxazepines, thiazepines and oxepines
Schizophrenia, bipolar disorder 26.0% 9 2.3% 72
Beta-blocking agents, selective High blood pressure, heart failure, angina (chest pain)
26.0% 10 23.7% 4
Note * Five jurisdictions submitting claims that can be identified as LTC facility data in the NPDUIS Database, as of March 2013:
Prince Edward Island, New Brunswick, Ontario, Manitoba and British Columbia. Source National Prescription Drug Utilization Information System Database, Canadian Institute for Health Information.
Two of the three most commonly used drug classes among seniors in LTC facilities were classes of antidepressants. The use of these drug classes was much higher in LTC facilities than in the community, which is expected, as the prevalence of depression is higher among seniors living in LTC facilities.30–32
30
Drug Use Among Seniors on Public Drug Programs in Canada, 2012: Revised October 2014
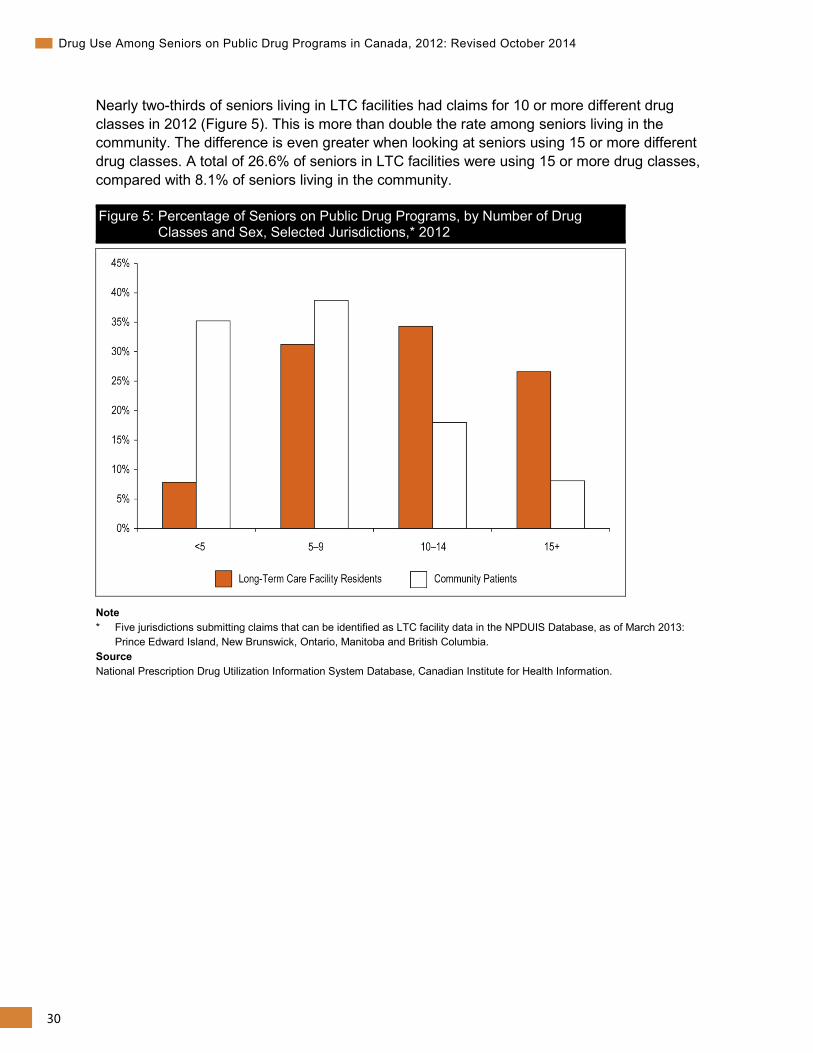
Nearly two-thirds of seniors living in LTC facilities had claims for 10 or more different drug classes in 2012 (Figure 5). This is more than double the rate among seniors living in the community. The difference is even greater when looking at seniors using 15 or more different drug classes. A total of 26.6% of seniors in LTC facilities were using 15 or more drug classes, compared with 8.1% of seniors living in the community.
Figure 5: Percentage of Seniors on Public Drug Programs, by Number of Drug Classes and Sex, Selected Jurisdictions,* 2012
Note * Five jurisdictions submitting claims that can be identified as LTC facility data in the NPDUIS Database, as of March 2013:
Prince Edward Island, New Brunswick, Ontario, Manitoba and British Columbia. Source National Prescription Drug Utilization Information System Database, Canadian Institute for Health Information.
31
Drug Use Among Seniors on Public Drug Programs in Canada, 2012: Revised October 2014
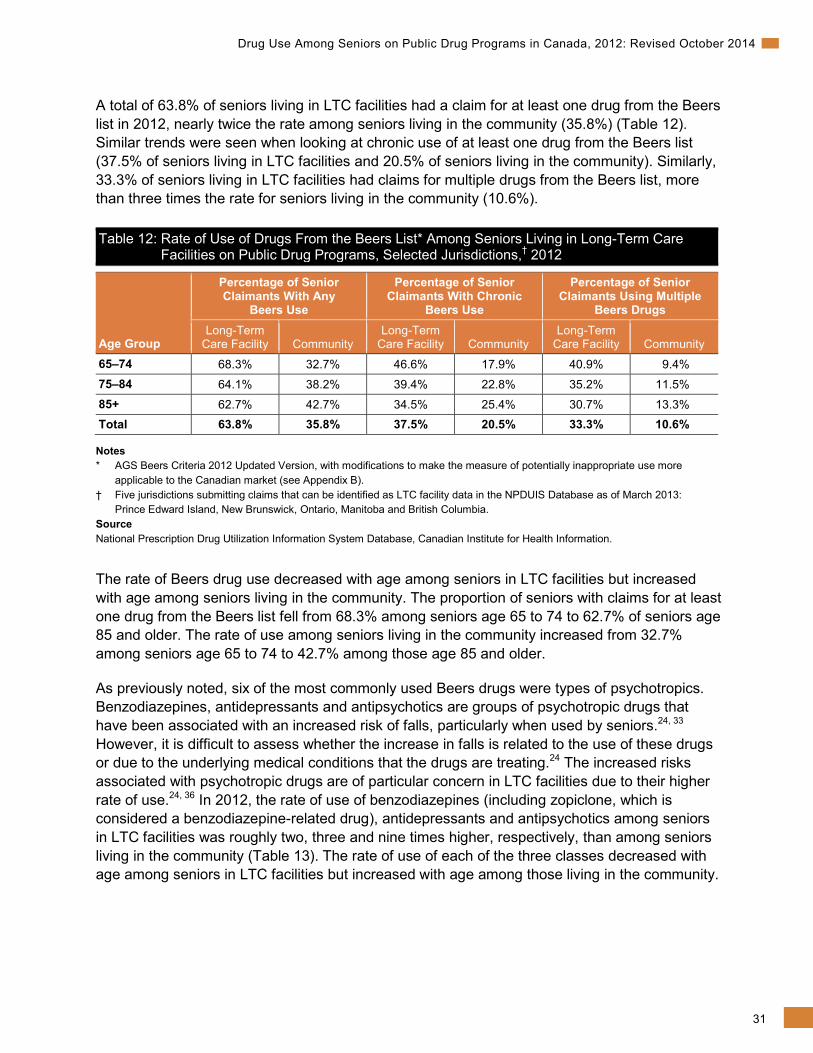
A total of 63.8% of seniors living in LTC facilities had a claim for at least one drug from the Beers list in 2012, nearly twice the rate among seniors living in the community (35.8%) (Table 12). Similar trends were seen when looking at chronic use of at least one drug from the Beers list (37.5% of seniors living in LTC facilities and 20.5% of seniors living in the community). Similarly, 33.3% of seniors living in LTC facilities had claims for multiple drugs from the Beers list, more than three times the rate for seniors living in the community (10.6%).
Table 12: Rate of Use of Drugs From the Beers List* Among Seniors Living in Long-Term Care Facilities on Public Drug Programs, Selected Jurisdictions,† 2012
Age Group
Percentage of Senior Claimants With Any
Beers Use
Percentage of Senior Claimants With Chronic
Beers Use
Percentage of Senior Claimants Using Multiple
Beers Drugs Long-Term
Care Facility Community Long-Term
Care Facility Community Long-Term
Care Facility Community
65–74 68.3% 32.7% 46.6% 17.9% 40.9% 9.4% 75–84 64.1% 38.2% 39.4% 22.8% 35.2% 11.5% 85+ 62.7% 42.7% 34.5% 25.4% 30.7% 13.3% Total 63.8% 35.8% 37.5% 20.5% 33.3% 10.6%
Notes * AGS Beers Criteria 2012 Updated Version, with modifications to make the measure of potentially inappropriate use more
applicable to the Canadian market (see Appendix B). † Five jurisdictions submitting claims that can be identified as LTC facility data in the NPDUIS Database as of March 2013:
Prince Edward Island, New Brunswick, Ontario, Manitoba and British Columbia. Source National Prescription Drug Utilization Information System Database, Canadian Institute for Health Information.
The rate of Beers drug use decreased with age among seniors in LTC facilities but increased with age among seniors living in the community. The proportion of seniors with claims for at least one drug from the Beers list fell from 68.3% among seniors age 65 to 74 to 62.7% of seniors age 85 and older. The rate of use among seniors living in the community increased from 32.7% among seniors age 65 to 74 to 42.7% among those age 85 and older.
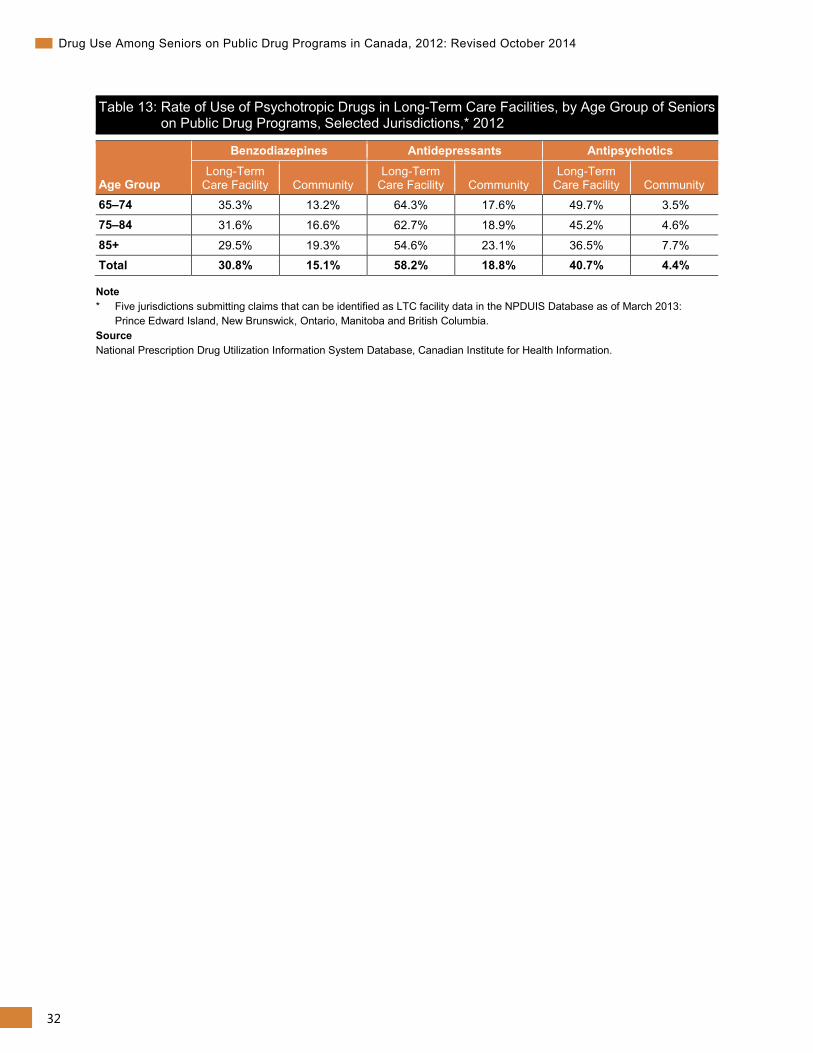
As previously noted, six of the most commonly used Beers drugs were types of psychotropics. Benzodiazepines, antidepressants and antipsychotics are groups of psychotropic drugs that have been associated with an increased risk of falls, particularly when used by seniors.24, 33 However, it is difficult to assess whether the increase in falls is related to the use of these drugs or due to the underlying medical conditions that the drugs are treating.24 The increased risks associated with psychotropic drugs are of particular concern in LTC facilities due to their higher rate of use.24, 36 In 2012, the rate of use of benzodiazepines (including zopiclone, which is considered a benzodiazepine-related drug), antidepressants and antipsychotics among seniors in LTC facilities was roughly two, three and nine times higher, respectively, than among seniors living in the community (Table 13). The rate of use of each of the three classes decreased with age among seniors in LTC facilities but increased with age among those living in the community.
32
Drug Use Among Seniors on Public Drug Programs in Canada, 2012: Revised October 2014
Table 13: Rate of Use of Psychotropic Drugs in Long-Term Care Facilities, by Age Group of Seniors on Public Drug Programs, Selected Jurisdictions,* 2012
Age Group
Benzodiazepines Antidepressants Antipsychotics Long-Term
Care Facility Community Long-Term
Care Facility Community Long-Term
Care Facility Community 65–74 35.3% 13.2% 64.3% 17.6% 49.7% 3.5% 75–84 31.6% 16.6% 62.7% 18.9% 45.2% 4.6%
85+ 29.5% 19.3% 54.6% 23.1% 36.5% 7.7% Total 30.8% 15.1% 58.2% 18.8% 40.7% 4.4%
Note * Five jurisdictions submitting claims that can be identified as LTC facility data in the NPDUIS Database as of March 2013:
Prince Edward Island, New Brunswick, Ontario, Manitoba and British Columbia. Source National Prescription Drug Utilization Information System Database, Canadian Institute for Health Information.
33
Drug Use Among Seniors on Public Drug Programs in Canada, 2012: Revised October 2014
Appendix A: Glossary of Terms Please note that some of the terms in this glossary may have alternate definitions. The stated definitions are meant to reflect how these terms were used in the context of this report only and are not necessarily the sole definitions of these terms.
Accepted claim: A claim for which the drug program accepts at least a portion of the cost, either toward a deductible or for reimbursement.
Adverse drug reaction: A harmful and unintended response to a drug that occurs at doses normally used or tested to diagnose, treat or prevent a condition or to modify an organic function.
Anatomical Therapeutic Chemical (ATC) system: A classification system that divides drugs into different groups according to the organ or system on which they act and their chemical, pharmacological and therapeutic properties. This report uses the 2013 version of the ATC classification system.
Average annual growth rate: The constant annual rate necessary for a value at the beginning of a period to grow to a value at the end of a period over the number of compounding years in the period. (See Appendix B for more detail.)
Beers list: A list of drugs identified as potentially inappropriate for use in seniors. The American Geriatric Society Beers Criteria 2012 Updated Version is used in this report, with slight modifications to make the measure of potentially inappropriate use more applicable to the Canadian market. (See Appendix B for more detail.)
Chemical: Subgroups classified by the World Health Organization at the fifth level of the ATC classification system, 2013 version. Each unique code represents a distinct chemical or biologic entity within the respective drug class.
Chronic drug use: A person having at least two claims and 180 days’ supply for a given drug class.
Claim: One or more transactions, with the final result indicating that a prescription had been filled and dispensed in exchange for payment.
Claimant: A senior with at least one claim accepted by a public drug program, either for reimbursement or applied toward a deductible. In Manitoba and Saskatchewan, claimants are also seniors with accepted claims who are eligible for coverage under a provincial drug program but who have not submitted an application and, therefore, do not have a defined deductible.
Copayment: The portion of the claim cost that patients must pay each time they make a claim. This may be a fixed amount or a percentage of the total claim cost. When calculated as a percentage of the total cost, this is also known as “co-insurance.”
34
Drug Use Among Seniors on Public Drug Programs in Canada, 2012: Revised October 2014
Cost sharing: The amount of the total prescription cost accepted by the plan/program that is not paid by the plan/program (that is, the amount of the total prescription cost accepted that is paid out of pocket by the beneficiary or through another plan/program/insurer).
Cost-sharing mechanisms: The ways through which prescription costs can be shared between drug programs and their beneficiaries (for example, copayments, deductibles and premiums).
Deductible: The amount of total drug spending a patient must pay in a given year (or other defined time period) before any part of his or her drug costs will be paid by the drug program. A deductible may be a fixed amount or a percentage of income (income-based deductible).
Drug class: Subgroups of chemicals classified by the World Health Organization at the fourth level of the ATC classification system, 2013 version. At this level, subgroups are, in theory, regarded as groups of different chemicals that work in the same way to treat similar medical conditions (for example, the chemical subgroup bisphosphonates includes chemicals such as etidronate, alendronate and risedronate).
Drug interaction: The alteration of the effect of a particular drug when it is taken with another drug.
Drug program: A program that provides coverage for drugs for a set population. Programs have defined rules for eligibility, payment, etc.
Drug program formulary: A formal listing of the benefits eligible for reimbursement under a specific drug benefit plan/program and the conditions under which coverage is provided. For the purpose of the NPDUIS Database, a “benefit” means a drug, product, medical supply, equipment item or service covered under a drug benefit plan or program.
Drug program spending: The amount paid by the drug program toward a senior’s prescription costs. Any portion of the prescription cost paid by the senior or a third-party private insurer is not captured in this amount, including the drug cost, professional fees paid to the pharmacy or markup charged by the pharmacy. (See Appendix C for more detail.)
Indication: A reason for using a specific drug. For example, gastroesophageal reflux disease is an indication for proton pump inhibitor use.
Jurisdiction: The federal/provincial/territorial jurisdiction responsible for the drug program formulary and for financing the paid amount of accepted claims.
Maximum contribution: The maximum amount of drug spending a patient is required to pay in a given year (or other defined time period). Once the maximum contribution has been reached, the drug program will pay 100% of eligible drug costs for the remainder of the year.
Maximum copayment: The maximum amount a patient is required to pay per claim.
Paid beneficiary: A senior claimant who has had at least part of at least one claim paid by a plan/program as a benefit.
35
Drug Use Among Seniors on Public Drug Programs in Canada, 2012: Revised October 2014
Paid claim: A claim for which the drug program paid at least a portion of the cost.
Palliative: Patients who have been diagnosed by a physician or nurse practitioner as being in the end stage of a terminal illness or disease, who are aware of their diagnosis and have made a voluntary informed decision related to resuscitation, and for whom the focus of care is palliation and not treatment aimed at a cure.
Premium: The amount a patient must pay to enrol in the drug program.
Public drug coverage: Drug coverage offered to seniors by the federal/provincial/ territorial jurisdictions.
Seniors: People age 65 years of age and older.
Total drug program spending: See drug program spending.
36
Drug Use Among Seniors on Public Drug Programs in Canada, 2012: Revised October 2014
Appendix B: Methodological Notes Data Sources National Prescription Drug Utilization Information System Database The drug claims and formulary data used in this analysis comes from the National Prescription Drug Utilization Information System (NPDUIS) Database, as submitted by eight provincial public drug programs (Prince Edward Island, Nova Scotia, New Brunswick, Ontario, Manitoba, Saskatchewan, Alberta and British Columbia), as well as the First Nations and Inuit Health Branch (FNIHB) federal public drug program. The NPDUIS Database houses pan-Canadian information related to public program formularies, drug claims, policies and population statistics. It was designed to provide information that supports accurate, timely and comparative analytical and reporting requirements for the establishment of sound pharmaceutical policies and the effective management of Canada’s public drug benefit programs.
The NPDUIS Database includes claims accepted by public drug programs, either for reimbursement or to be applied toward a deductible.xii Claims are included regardless of whether the patient actually used the drugs.
The NPDUIS Database does not include information regarding
• Prescriptions that were written but never dispensed;
• Prescriptions that were dispensed but for which the associated drug costs were not submitted to or not accepted by the public drug programs; or
• Diagnoses or conditions for which prescriptions were written.
Drug claims data from Prince Edward Island, Nova Scotia, New Brunswick, Manitoba, Saskatchewan, Alberta and British Columbia was available for 2006 through 2012; for Ontario, it was available from April 2010 onward; for FNIHB, it was available from October 2010 onward. Analyses that include drug claims data prior to 2010 do not include data from Ontario or FNIHB.
xii. In Manitoba and Saskatchewan, this includes accepted claims for people who are eligible for coverage under a provincial drug
program but have not submitted an application and, therefore, do not have a defined deductible.
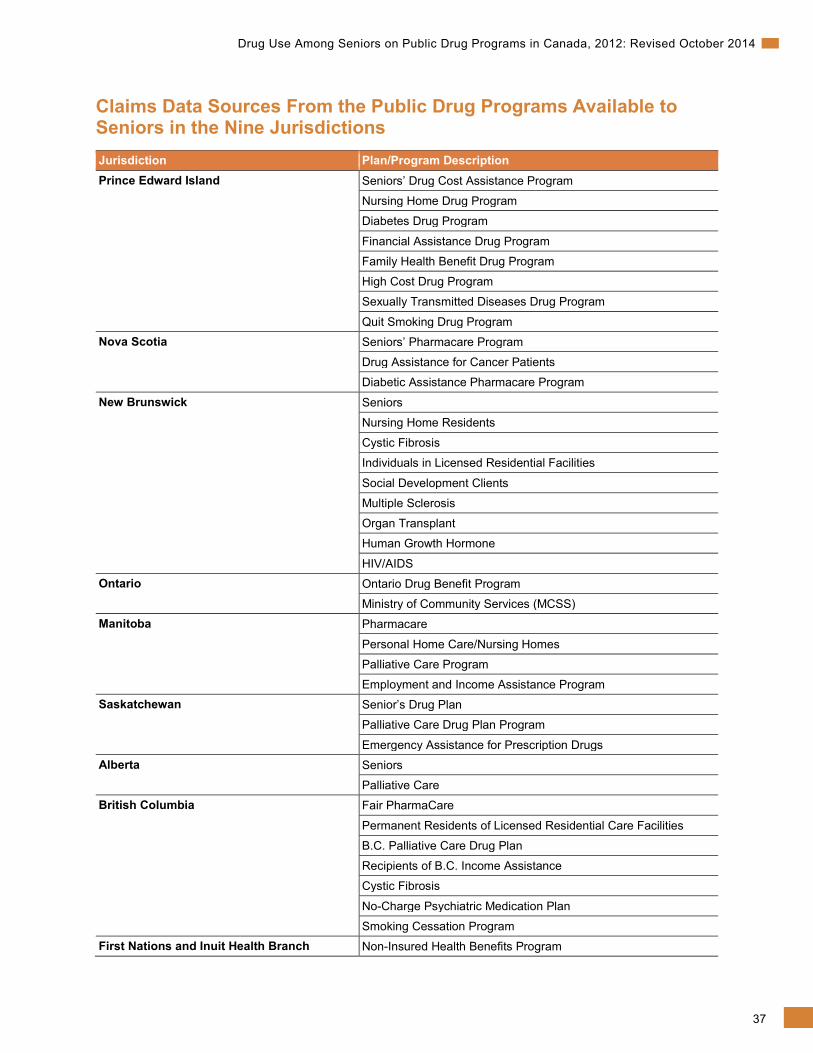
37
Drug Use Among Seniors on Public Drug Programs in Canada, 2012: Revised October 2014
Claims Data Sources From the Public Drug Programs Available to Seniors in the Nine Jurisdictions Jurisdiction Plan/Program Description Prince Edward Island Seniors’ Drug Cost Assistance Program
Nursing Home Drug Program
Diabetes Drug Program
Financial Assistance Drug Program
Family Health Benefit Drug Program
High Cost Drug Program
Sexually Transmitted Diseases Drug Program
Quit Smoking Drug Program Nova Scotia Seniors’ Pharmacare Program
Drug Assistance for Cancer Patients
Diabetic Assistance Pharmacare Program
New Brunswick Seniors
Nursing Home Residents
Cystic Fibrosis
Individuals in Licensed Residential Facilities
Social Development Clients
Multiple Sclerosis
Organ Transplant
Human Growth Hormone
HIV/AIDS Ontario Ontario Drug Benefit Program
Ministry of Community Services (MCSS) Manitoba Pharmacare
Personal Home Care/Nursing Homes
Palliative Care Program
Employment and Income Assistance Program Saskatchewan Senior’s Drug Plan
Palliative Care Drug Plan Program
Emergency Assistance for Prescription Drugs Alberta Seniors
Palliative Care British Columbia Fair PharmaCare
Permanent Residents of Licensed Residential Care Facilities
B.C. Palliative Care Drug Plan
Recipients of B.C. Income Assistance
Cystic Fibrosis
No-Charge Psychiatric Medication Plan
Smoking Cessation Program First Nations and Inuit Health Branch Non-Insured Health Benefits Program
38
Drug Use Among Seniors on Public Drug Programs in Canada, 2012: Revised October 2014
Provincial Notes Prince Edward Island
Claims dispensed through the Children in Care, Financial Assistance, Seniors’ Drug Cost Assistance, Diabetes, Family Health Benefit, High Cost Drug, Nursing Home, Quit Smoking and Sexually Transmitted Disease programs are included in the NPDUIS Database. Claims for all other plans are not submitted.
Saskatchewan
Claims for non-published drug identification numbers (that is, DINs not listed on the Saskatchewan Health Drug Plan Formulary) and claims dispensed through special programs, such as the Saskatchewan Cancer Agency, are not submitted to the NPDUIS Database. Claims dispensed through SAIL and Supplementary Health are included in the NPDUIS Database only if they are for DINs published on the Saskatchewan Health Drug Plan Formulary.
Alberta
Claims dispensed through the Income Support, Alberta Adult Health Benefit, Assured Income for the Severely Handicapped and Alberta Child Health Benefit programs are not submitted. Claims dispensed to residents of long-term care facilities are not submitted to the NPDUIS Database.
Limitations As claims data indicates only that a drug was dispensed, and not that it was used, it may not always reflect utilization. A patient may take all, some or none of a dispensed prescription.
The NPDUIS Database does not include information on claims that were not accepted by the public drug program (that is, claims paid by private insurers or out of pocket by individuals). Therefore, the number of drugs or rate of use may be underestimated. However, for seniors this underestimation applies mainly to drugs not covered by public drug programs and those with restrictive coverage policies.35
The NPDUIS Database does not contain information regarding diagnoses or the conditions for which prescriptions were written. Therefore, the conditions that contribute to drug program spending cannot be identified with certainty. However, identifying the most common indications for the drug classes that account for the majority of spending gives an idea of which conditions are the main contributors.
Formulary Comparison Variation in the number and types of drugs covered by formularies across jurisdictions can lead to differences in drug utilization and expenditure.
This section assesses the commonality of the public drug formularies of the nine jurisdictions as of December 31, 2012 (that is, the degree to which the formularies of the eight provincial and one federal drug plan are the same).
39
Drug Use Among Seniors on Public Drug Programs in Canada, 2012: Revised October 2014
In 2012, drugs common in all nine jurisdictions made up 94.1% of drug claims and 81.8% of drug program spending on seniors.xiii For drug classes covered in at least eight jurisdictions, the rates increase to 95.9% of drug claims and 95.7% of total program payments. Because such a large portion of program expenditures is for drug classes that are listed in all nine jurisdictions, differences in formulary coverage are not expected to play a large role in any provincial differences in overall utilization and expenditure. However, differences in formulary coverage may have a significant impact on the utilization of specific drugs or drug classes across provinces. For example, the lower rate of PPI use in B.C. is due in part to the fact that PPI coverage is restricted to patients who have a documented failure with or intolerance to adequate doses of H2 receptor antagonists (for example, ranitidine). Given this potential impact, it is important to consider differences in formulary listings when comparing provincial drug utilization or expenditure for specific drugs or drug classes.
Drug Classification Systems Drugs can be analyzed using many different classification systems. For the purposes of this analysis, the following systems were used:
• The DIN, as assigned by Health Canada. A DIN is specific to manufacturer, trade name, active ingredient(s), strength(s) of active ingredient(s) and pharmaceutical form. In this analysis, references to drug products are implied to be specific to DIN level.
• The pseudo-drug identification number (PDIN), as assigned by a drug program, in cases where a benefit has not been assigned a DIN by Health Canada. This may occur when a benefit is not a drug product (for example, a glucose test strip), when it is a compound consisting of multiple drug products, each with its own DIN, or when it is a pharmacy service (such as medication review).
• The 2013 version of the World Health Organization ATC classification system, as reported in the Health Canada Drug Product Database.xiv
– In the ATC classification system, drugs are divided into different groups according to the organ or system on which they act and their chemical, pharmacological and therapeutic properties.
– The ATC does not distinguish between strength, dosage, route or form of drug, except as implied by the ATC (for example, inhaled corticosteroid).
– Drugs are classified in groups at five different levels:
o The drugs are divided into 14 main groups (first level), with 1 pharmacological/ therapeutic subgroup (second level).
o The third and fourth levels are chemical/pharmacological/therapeutic subgroups.
o The second, third and fourth levels are often used to identify pharmacological subgroups when that is considered more appropriate than therapeutic or chemical subgroups.
o The fifth level is the chemical substance.
xiii. Formulary information for products available through Part III of the Manitoba formulary is not submitted to the NPDUIS Database. xiv. Although Health Canada typically assigns drug products to a fifth-level ATC, in some cases it may assign an ATC at the fourth
or even third level.
40
Drug Use Among Seniors on Public Drug Programs in Canada, 2012: Revised October 2014
– Drug products assigned a DIN but not assigned to an ATC classification by Health Canada are automatically classified under the ATC classification “unassigned.”
– Benefits assigned a PDIN are automatically classified under the ATC classification “not applicable.”
– Where appropriate, CIHI may assign DINs or PDINs to other ATC classifications.
Drug program spending on and use of DINs and PDINs not assigned to ATC classifications are included in total amounts, but the default drug classes “unassigned” and “not applicable” are not counted as drug classes. This applies to any count of drug classes and to any top 10 lists (that is, they are not included in any top 10 lists, even if their utilization or spending level puts them in the top 10).
Calculation Methods Public Drug Program Spending per Paid Beneficiary
Calculated as the total amount paid by the drug program toward drug claims for seniors in a given year, divided by the number of seniors with paid claims in that year.
Average Annual Growth Rate
The average annual growth rate is the constant annual rate necessary for a value at the beginning of a period to grow to a value at the end of a period over the number of compounding years in the period. The formula used to calculate the average annual rate of growth is as follows:
(e(ln(value at end of period) − ln(value at beginning of period))/(T − 1) − 1)
Where the constant “e” equals 2.718, which is the base of the natural logarithm, and “T” equals the number of years in the period.
Beers Drugs
Beers drugs are drugs that have been identified as “potentially inappropriate” to prescribe to seniors due to an elevated risk of adverse effects, a lack of efficacy in seniors, or the availability of safer alternatives.19 A widely used list of these drugs, known as the Beers list, was originally developed in 1991 by Dr. Mark H. Beers and applied specifically to seniors living in LTC facilities; it was then expanded to include all seniors.19 The 2012 version of the Beers list, updated by The American Geriatrics Society (AGS Beers Criteria 2012 Updated Version), is used in this report.
Several new drugs were added in the 2012 update of the Beers list, most notably antipsychotics and several non-steroidal anti-inflammatory drugs (NSAIDs). Another major change was that benzodiazepines were included regardless of dose. Previously, some benzodiazepines were considered potentially inappropriate only if they were used above a certain dose. As a result, rates of potentially inappropriate drug use measured using the 2012 update of the Beers list are much higher than those reported previously using older versions of the Beers list. For example, a 2007 CIHI report that used the 2002 version of the Beers list found that 27.2% of seniors had at least one claim for a drug from the Beers list in 2005–2006.22 In 2012, 23.1% of seniors had claims for at least one claim for a drug from the 2002 version of the Beers list, compared with 38.9% with claims from the 2012 version.
41
Drug Use Among Seniors on Public Drug Programs in Canada, 2012: Revised October 2014
The Beers list separates potentially inappropriate drugs for seniors into three groups: drugs that are regarded as potentially inappropriate, drugs that are inappropriate for use in seniors due to drug–disease or drug–syndrome interactions and drugs that should be taken with caution. Only drugs that are regarded as potentially inappropriate according to the Beers list were included in this analysis.
It should be noted that some drugs regarded as potentially inappropriate on the updated Beers list used in this report are considered potentially inappropriate for only a specific use or if they are prescribed in a certain way. Because information related to the reason for the prescription or details on how the drugs are prescribed is not available in the NPDUIS Database, in these cases all drug claims were identified as potentially inappropriate. One exception was insulin, which was not included in this analysis. Insulin is considered potentially inappropriate according to the Beers list only if it is prescribed to be taken on a sliding scale (progressive increase in pre-meal or nighttime insulin doses). Adding these drugs increased the rate of seniors with at least one claim for a drug meeting the Beers criteria from 38.9% to 41.2% in the nine jurisdictions.
Groups of drugs included on the Beers list can focus either on a therapeutic drug class (for example, benzodiazepines) or a specific drug (for example, meperidine). Drugs may be considered potentially inappropriate only if taken in a certain formulation (for example, chlorpropamide should not be taken if long-acting) or if taken in excess of a specific dose (for example, reserpine doses greater than 0.1 mg/day).
The Beers list was developed, and focuses on drugs available, in the United States. In an effort to customize this analysis to the Canadian market, all benzodiazepines and benzodiazepine-related products were identified as potentially inappropriate, not only those explicitly listed in the Beers list. The only exception was clobazam, which was excluded because, unlike other benzodiazepines, it is used primarily for epileptic seizures. This modification is based on work by the Saskatchewan Health Quality Council.7, 22 Adding these drugs increased the rate of seniors with at least one claim for a drug meeting the Beers criteria from 37.6% to 38.9% in the nine jurisdictions.
The Beers list also contains a designation for the quality of evidence regarding the inappropriateness of the drug and the strength of the recommendation. The quality of the evidence can be high (evidence includes consistent results from well-designed, well-conducted studies in representative populations that directly assess effects on health outcomes), moderate (evidence is sufficient to determine effects on health outcomes, but the number, quality, size, or consistency of included studies limits the strength of the evidence) or low (evidence is insufficient to assess effects on health outcomes). The strength of the recommendation can be strong (benefits clearly outweigh risks and burden or risks and burden clearly outweigh benefits), weak (benefits finely balanced with risks and burden) or insufficient (insufficient evidence to determine net benefits or risks). No drugs were excluded from this analysis based on strength of evidence or recommendation. However, it should be noted that very few drugs on the list had a low quality of evidence; and those that did all had a strong strength of recommendation.
42
Drug Use Among Seniors on Public Drug Programs in Canada, 2012: Revised October 2014
Drug Program Spending
“Drug program spending on drug claims for seniors” refers only to the amount paid by the drug program toward a senior’s prescription costs. Any portion of the prescription cost paid by either the senior or a third-party private insurer is not captured in this amount. The costs included are the drug cost (the actual cost of the drug product being dispensed), as well as pharmacy professional fees or pharmacy markup, if applicable. The policies determining the fees and markups that pharmacies are allowed to charge vary by jurisdiction. Although these differences will impact cost comparisons across jurisdictions, all costs are included in order to reflect the total cost of drug claims by seniors to public drug programs. For more information on drug program policies, including those regarding professional fees and markup, please see the NPDUIS Database Plan Information Document.
Identifying Chronic Conditions
Seven chronic conditions were identified by the chronic use of drug classes commonly prescribed to treat them. Chronic use of these drugs was defined as a person having at least two claims and 180 days’ supply for a specific drug class.
Conditions were identified using the ATC classification system, 2013 version, as follows:
• High blood pressure and heart failure: ATC codes C02—antihypertensives, C03—diuretics, C07 and C08—beta blockers and C09—ACE inhibitors
• High cholesterol: ATC codes C10—Statins
• Gastrointestinal disease: ATC codes A02BA—H2 receptor antagonists, A02BB—prostaglandins, A02BC—PPIs, A02BD—combinations for eradication of Helicobacter pylori and A02BX—other drugs for peptic ulcer and gastroesophageal reflux disorder
• Depression: ATC codes N06A—antidepressants
• Diabetes: ATC codes A10A—insulin, A10B and A10X—oral diabetic agents (e.g. metformin, pioglitazone, rosiglitazone)
• Respiratory disease: ATC codes R03A and R03C—adrenergics (e.g. salbutamol), R03B and R03D—glucocorticoids (e.g. fluticasone)
• Osteoporosis: ATC codes M05BA and M05BB—bisphosphonates
Identifying chronic conditions through prescribed drugs is not ideal, as conditions are not always treated with medication. Also, some drugs can be used to treat multiple conditions, and the NPDUIS Database does not contain information regarding the diagnosis or condition for which a prescription was written. However, by identifying the most common indications for the drug classes, drug use can be used to estimate the proportion of seniors with specific conditions.
Number of Drug Classes
The number of drug classes a senior was using in a given year is calculated by counting the number of unique drug classes (ATC level 4) a senior used during that year. This number does not necessarily reflect the number of drug classes he or she is using at one time.
43
Drug Use Among Seniors on Public Drug Programs in Canada, 2012: Revised October 2014
Also, this measure does not consider whether a patient was using a drug from each class from the beginning of the year or whether a drug was started partway through the year. In addition, although looking at the number of drug classes (rather than at the number of unique chemicals) controls for switching between drugs within a drug class, it can understate the number of drugs a senior is using if he or she is using multiple drugs within a single drug class at the same time. Overall, it does not appear that these factors significantly impacted the analysis, as the average number of claimed drug classes and claimed chemicals were similar for all age groups. In 2012, seniors on public drug programs had claims for an average of 7.2 drug classes and 7.4 chemicals.
Long-Term Care Residents
Long-term care facility residents were identified in one of two ways, depending on the jurisdiction. In P.E.I., New Brunswick, Manitoba and B.C., LTC facility residents were identified as those having claims accepted by drug programs designed to provide coverage to LTC facility residents. In Ontario, residents are flagged in the NPDUIS Databases as living in an LTC facility.
It should be noted that in P.E.I., only seniors whose long-term care is subsidized by the government can be identified as LTC facility residents. Long-term care facility residents whose care is paid for either out of pocket or through private insurance are classified as non-LTC facility–residing seniors in the NPDUIS Database. It is expected that this will increase the rate of use among non-LTC facility residents in P.E.I., though it is unclear what effect this will have on the rate of use among LTC facility residents. Because of P.E.I.’s relatively small population, it is not expected that this will have a great effect on the overall rates of use in the five provinces.
Percentage of Seniors With Accepted and Paid Claims
Percentage of seniors with accepted claims is calculated by dividing the number of senior claimants in a given year by the senior population reported for that province as of July 1 of that year.
Percentage of seniors with paid claims is calculated by dividing the number of seniors with paid claims in a given year by the senior population reported for that province as of July 1 of that year.
It should be noted that the denominators in the above two calculations include seniors who are not eligible for provincial drug coverage, either because they receive drug coverage from another source (for example, federal drug programs or private drug insurance) or because they were eligible for public drug coverage but did not apply to have their deductible calculated. The proportions of patients with accepted and paid claims would be larger if only the eligible and enrolled population was considered. It should also be noted that, as the numerator is a cumulative count of claimants throughout the year and the denominator is measured at a given point in time, it is possible for the percentage to be greater than 100%.
44
Drug Use Among Seniors on Public Drug Programs in Canada, 2012: Revised October 2014
Psychotropic Drugs
The psychotropic drug classes included in this analysis were identified by the DINs assigned by Health Canada and by the World Health Organization ATC codes N05BA—benzodiazepines (under the broader class of anxiolytics), N05CD—benzodiazepines (under the broader class of sedatives and hypnotics), N05CF—benzodiazepine-related drugs, N06A—antidepressants and N05A—antipsychotics. All dosage forms and strengths of these chemicals that were available in Canada during the study period, with the exception of lithium (ATC code N05AN) and clobazam (ATC code N05BA09), were included. Lithium was excluded because, unlike other drugs in its ATC class, it is not used to treat behavioural and psychological symptoms of dementia in elderly persons; clobazam was excluded because, unlike other benzodiazepines, it is used primarily for epileptic seizures.
Rate of Use
Calculated as the total number of seniors with claims for the group (for example, drug class or chemical) in question, divided by the total number of seniors with claims.
Top 10 Drug Classes Exhibiting Greatest Increase in Growth
Minimum levels of total drug program spending on seniors were set for drugs when preparing these lists. For a drug class to be considered among the top 10 fastest-growing drug classes (Table 2), it had to account for at least 1.0% of total drug program spending on seniors in 2012.
45
Drug Use Among Seniors on Public Drug Programs in Canada, 2012: Revised October 2014
Appendix C: Summary of Public Drug Plan Coverage Available to Seniors Public drug coverage is available to seniors (people age 65 and older) in all nine jurisdictions included in the analysis; however, each drug program is designed differently. One of the major differences is that P.E.I., Nova Scotia, New Brunswick, Ontario, Saskatchewan and Alberta have drug plans designed specifically for seniors, whereas seniors in Manitoba and B.C., and those covered by FNIHB, are covered under a universal drug plan offered to residents of all ages. Another important difference relates to the cost-sharing mechanisms used in the drug programs. These mechanisms, including premiums, deductibles and copayments, affect the amount that seniors are required to pay for their drugs.
Differences in plan design may impact drug utilization within the plans and, in turn, the claims submitted to the NPDUIS Database. For example, in provinces where plan members must pay premiums, a smaller number of seniors may choose public coverage, thereby reducing the percentage of seniors with claims accepted and paid for by the drug program. Seniors may choose private coverage, when available, particularly if it offers more affordable coverage. They may also choose to pay out of pocket if they expect their drug costs to be low. Premiums differ from deductibles and copayments in that they must be paid regardless of whether or not any drug expenses are incurred.
Deductibles and copayments (or a combination of the two) are also used to share costs between seniors and public drug programs. A deductible is an amount paid by the beneficiary toward eligible drug costs before any part of the drug costs will be paid by the drug program. Incurred drug costs that exceed the deductible may either be paid entirely by the drug program or be shared between the beneficiary and the drug program through copayments. The latter allows costs to be spread out over time and limits the amount that a senior will have to pay out of pocket for a single prescription. In some cases, drug programs set a maximum contribution, which limits the amount a beneficiary can pay through copayments in a given time period. It is expected that drug programs with deductibles will have a lower proportion of seniors with paid claims than those who pay a portion of every claim.
It should be noted that several factors, aside from differences in plan design, may lead to variations in seniors’ drug utilization and expenditure, both over time and among provinces. Factors include the health, age and sex of the population, prescribing trends, formulary listings and the availability of non-drug therapies.
46
Drug Use Among Seniors on Public Drug Programs in Canada, 2012: Revised October 2014
Common to all provinces included in the analysis, seniors covered by provincial workers’ compensation boards or federal drug programs are not eligible for coverage under provincial drug programs. Federal drug programs include those delivered by
• The Correctional Service of Canada;
• FNIHB;xv and
• Veterans Affairs Canada.
The following summaries provide a high-level overview of the drug coverage available to seniors in each of the eight provinces and one federal jurisdiction, under analysis, as of December 31, 2012, the end of the study period. Some of the drug plans described are available to people of all ages, not only seniors. In addition to the overview presented here, further information about public drug programs in Canada can be found in the NPDUIS Database Plan Information Document, available at www.cihi.ca, or on the websites of the public drug programs (see Appendix J).
Claims data for seniors covered in the plans described below is included in the NPDUIS Database, unless otherwise noted.
Prince Edward Island Drug coverage in P.E.I. is available to eligible recipients through the Prince Edward Island Drug Programs. Seniors are eligible for the following programs: the Seniors’ Drug Cost Assistance Program; the Diabetes Drug Program; the Financial Assistance Program; the Family Health Benefit Drug Program; the High Cost Drug Program (which covers drugs required to treat cancer, multiple sclerosis, severe rheumatoid arthritis and severe Crohn’s disease); the Nursing Home Drug Program; the Sexually Transmitted Diseases Drug Program; and the Quit Smoking Drug Program.xvi
P.E.I. residents age 65 and older who qualify for P.E.I. Medicare are automatically enrolled in the Seniors’ Drug Cost Assistance Program.
Seniors covered by this program are required to pay a copayment of $8.25 for each prescription, plus the cost of the professional fee, with no maximum contribution. Seniors eligible for coverage under the Financial Assistance Program and the Nursing Home Program (that is, seniors eligible for coverage under the Welfare Assistance Act) are not required to pay any copayments or fees for eligible prescriptions.
Seniors who meet certain income requirements and who have children younger than 18 (or younger than 25 if they are full-time students) living at home are required to pay only the professional fee for each eligible prescription.
xv. This excludes seniors living in Ontario who also have coverage through FNIHB. These seniors have their drug claims covered
first by the Ontario Drug Benefit program and any remaining drug costs are covered by FNIHB. xvi. In October 2013, P.E.I. introduced a Catastrophic Drug Program to assist individuals and families with high prescription drug
costs relative to their income.
47
Drug Use Among Seniors on Public Drug Programs in Canada, 2012: Revised October 2014
Seniors are also eligible for supplemental drug coverage if they require drugs to treat certain conditions. Those eligible for the Diabetes Drug Program pay a fixed copayment (the amount depends on the drug or supply) plus the professional fee, with no maximum contribution. Seniors eligible for the High Cost Drug Program pay an income-based copayment, plus the professional fee. Seniors covered under the Sexually Transmitted Diseases Program are not required to pay any copayments or fees. Under the Quit Smoking Drug Program, the first $75 of eligible drug costs are covered, and the senior must pay any additional costs. Drugs for certain other conditions are also provided to eligible seniors at no cost. The additional coverage provided by these supplementary plans applies only to prescriptions for drugs used to treat the conditions specified by each plan. Other prescriptions for seniors covered by a supplementary plan must be paid for as specified by the Seniors’ Drug Cost Assistance Program.
Claims for seniors covered under the Multiple Sclerosis Program (part of the High Cost Drug Program), or any supplementary plan not specifically mentioned above, are not included in the NPDUIS Database. Claims for seniors in government manors (that is, publicly owned nursing homes) are not included in the NPDUIS Database.
Seniors diagnosed with diabetes and registered with the Diabetes Control program are eligible for the Diabetes Drug Program. The copayment is $10.00 per unit or $20.00 per two-unit box of insulin, $11.00 per oral medication prescription and $11.00 per prescription for testing materials. All other costs and professional fees are paid by the program.
Drug Program Formularies Seniors covered under the Seniors’ Drug Cost Assistance Program are eligible to receive medications, subject to any criteria listed in the P.E.I. Drug Programs Formulary. As well, seniors who are enrolled in one of the supplementary plans are entitled to additional drugs covered by the respective plans, as noted in the formularies.
Nova Scotia Seniors in Nova Scotia are eligible for coverage under three programs: Seniors’ Pharmacare, Family Pharmacare and Drug Assistance for Cancer Patients.
For seniors to be eligible for coverage under any program, they must provide income information so any applicable premium or deductible can be calculated.xvii A person must renew his or her application every year.
Seniors must pay a premium to join the Seniors’ Pharmacare program. This premium is based on income and may be waived entirely for seniors below a certain income threshold. Once enrolled in the plan, seniors pay 30% of each claim, up to an annual maximum of $424. Once the maximum contribution has been reached, the drug program pays 100% of eligible drug costs.
xvii. For more information on the calculation of the deductible and Nova Scotia’s drug program in general, see the NPDUIS
Database Plan Information Document.
48
Drug Use Among Seniors on Public Drug Programs in Canada, 2012: Revised October 2014
Seniors may choose to be covered under the Family Pharmacare Program. Under this program, there is no premium; however, deductibles and copayments are applied. Prior to reaching their deductible, seniors pay the full cost of all eligible prescriptions. The majority (80%) of the cost of each prescription is counted toward an income-based deductible, and the remainder (20%) is paid as a copayment. Once the deductible has been reached, a copayment of 20% is applied until the maximum out-of-pocket drug costs are reached. The maximum contribution is also income-based. The drug program covers 100% of eligible drug costs exceeding the maximum contribution. Seniors may be enrolled in both the Drug Assistance for Cancer Patients and Family Pharmacare programs.
Drug Assistance for Cancer Patients offers coverage to seniors with a family income below a certain threshold. This program covers 100% of drug costs for a selected group of drugs used to treat cancer and its symptoms. These drugs are also covered under Seniors’ Pharmacare, as are prescription drugs for seniors residing in an LTC facility.
Drug Program Formularies Seniors covered under the public drug programs are eligible to receive medications listed on the plan formularies, subject to the criteria noted in the formularies. The Seniors’ Pharmacare and Family Pharmacare programs use the same formulary. Drug Assistance for Cancer Patients provides coverage for a selected group of drugs used to treat cancer and its symptoms.
New Brunswick Drug coverage in New Brunswick is available to eligible seniors through the New Brunswick Prescription Drug Program (NBPDP). The NBPDP provides coverage to all eligible residents of the province who are older than 65 and who either receive the federal Guaranteed Income Supplement (GIS) or qualify based on income.xviii To be eligible, seniors must be registered with New Brunswick Medicare.
Seniors who do not qualify for the NBPDP may apply to purchase equivalent prescription drug coverage through the Medavie Blue Cross Seniors’ Drug Program. They will be granted coverage under this plan if they apply within 60 days following their 65th birthday or within 60 days following the cancellation of other drug coverage after their 65th birthday. Coverage of late applicants (that is, those who apply after 60 days) is dependent on a review of their medical history. Seniors who wish to enrol in the Medavie Blue Cross Seniors’ Drug Program are required to pay a monthly premium of $105. There is no premium for coverage through the NBPDP.
Once enrolled in either of these programs, seniors must pay a part of each prescription. Those receiving the GIS are required to pay a maximum of $9.05 for each prescription, to a yearly maximum of $500. Seniors who qualify for the NBPDP based on their annual income, or who are enrolled in the Medavie Blue Cross Seniors’ Drug Program, are required to pay up to $15 per prescription, with no maximum contribution.
xviii. For more information on income requirements and the New Brunswick Prescription Drug Program in general, see the NPDUIS
Database Plan Information Document.
49
Drug Use Among Seniors on Public Drug Programs in Canada, 2012: Revised October 2014
All New Brunswick seniors who reside in licensed adult residential facilities or nursing homes are also eligible for prescription drug coverage through the NBPDP. Those residing in adult residential facilities must pay $4 per prescription, to a maximum of $250 per year, while seniors in nursing homes are not required to pay any copayments or fees. Seniors with cystic fibrosis or HIV and those who have had an organ transplant are required to pay a copayment of 20%, to a maximum of $20 per prescription. The maximum copayment amount per fiscal year is $500 per family unit.
Seniors with multiple sclerosis are required to pay an annual registration fee and an income-based copayment ranging from 0% to 100% of the prescription drug cost. Both the NBPDP and the Medavie Blue Cross Seniors’ Drug Program provide coverage to eligible seniors for a selected group of drugs used to treat cancer and its symptoms.
Drug Program Formularies Seniors enrolled in the NBPDP and the Medavie Blue Cross Seniors’ Drug Program are eligible for prescription drugs listed on the NBPDP formulary, subject to the criteria noted in the formulary. Seniors who are enrolled in one of the supplementary plans are entitled to additional drugs covered by the respective plans.
Ontario Seniors in Ontario are eligible for coverage under the Ontario Drug Benefit Program. This program is available to residents age 65 and older with a valid Ontario health card. For seniors covered under the Ontario Drug Benefit Program, there is a $100 deductible and a $6.11 copayment once the deductible has been reached if they are above a certain yearly net income, or a $2 copayment and no deductible if they are below the yearly net income threshold.xix
Seniors in Ontario may also be eligible for the Special Drug Program. The Special Drug Program is intended to cover certain expensive outpatient drugs used to treat cystic fibrosis, HIV infection, end-stage renal disease, solid organ or bone marrow transplant, human growth hormones, schizophrenia, Gaucher’s disease and thalassemia.
Drug Program Formularies Seniors in Ontario are eligible to receive medications listed on the Ontario Drug Benefit formulary, subject to the criteria noted on the formulary.
xix. For more information on income requirements and the Ontario Drug Benefit Program in general, see the NPDUIS Database
Plan Information Document.
50
Drug Use Among Seniors on Public Drug Programs in Canada, 2012: Revised October 2014
Manitoba Seniors in Manitoba are eligible for drug coverage through four programs: Pharmacare; Employment and Income Assistance; Home and Nursing Care; and Palliative Care.
The Pharmacare Program provides coverage to the majority of Manitoba seniors, although it is designed to cover residents of all ages. For seniors to be eligible for coverage, they must provide income information so that any applicable deductible can be calculated.xx A person may enrol indefinitely or choose to re-enrol each year. Unlike plans with age-based eligibility rules, Manitoba’s plan maintains the same eligibility criteria for drug coverage regardless of age. Once the deductible amount has been reached, all of the costs are covered for any drug listed on the formulary. The minimum deductible amount is $100.
If a senior is receiving Employment and Income Assistance (EIA), lives in a personal care home, is undergoing in-home cancer treatment that requires drugs or is receiving palliative care at home, 100% of the costs of any drug listed on the formulary of the applicable drug program will be covered, with no deductible.
Drug Program Formularies Seniors covered under the public drug programs are eligible to receive medications listed on the plan formulary, subject to the criteria noted in the formulary. The core drugs listed on the formularies of the four plans are the same, although there are additional drugs listed on the formularies of the Employment and Income Assistance, Home and Nursing Care and Palliative Care programs.
Saskatchewan Most seniors in Saskatchewan are covered under the Seniors’ Drug Plan and/or the Special Support Program, which is available to residents of all ages. Seniors may also qualify for the Palliative Care Drug Plan Program, the Saskatchewan Aids to Independent Living (SAIL) program or Plan Three Supplementary Health benefits, all of which are also available to residents of all ages.
Seniors may apply for coverage with automatic renewal or choose to re-enrol each year. Seniors with an income below a certain level (that is, seniors eligible for the federal age credit) qualify for coverage under this drug plan. Seniors pay a maximum copayment of $20 for each eligible prescription (low-cost alternative policies apply). Those who receive certain federal/ provincial income supplements are eligible for coverage with lower copayments, after their out-of-pocket expenditures reach a certain level.xxi
xx. For more information on the calculation of the deductible and Manitoba’s drug program in general, see the NPDUIS Database
Plan Information Document. xxi. For more information on how these copayments are determined and Saskatchewan’s drug program in general, see the NPDUIS
Database Plan Information Document.
51
Drug Use Among Seniors on Public Drug Programs in Canada, 2012: Revised October 2014
Seniors with anticipated drug costs in excess of 3.4% of their household income can also apply to the Special Support Program. Benefits are determined based on drug costs and income. Coverage may result in reduced copayments for seniors who are already covered by the Seniors’ Drug Plan, or it may be a source of benefits for seniors who are not eligible for the Seniors’ Drug Plan.
If a senior is approved for the Palliative Care Drug Plan Program, the SAIL program (which provides benefits for people with certain long-term disabilities or illnesses) or Plan Three Supplementary Health benefits (available to seniors receiving the Saskatchewan Income Plan and residing in a special-care home), eligible prescriptions are covered at no cost. Claims for seniors covered under the SAIL or Plan Three programs are included in the NPDUIS Database only if the medication claimed is listed in the Saskatchewan Health Drug Plan Formulary.
Prescription drugs covered by the Saskatchewan Cancer Agency are provided free of charge to registered cancer patients. These claims are not included in the NPDUIS Database.
Drug Program Formularies Seniors in Saskatchewan are eligible to receive medications listed in the Saskatchewan Health Drug Plan Formulary, subject to the criteria noted in the formulary. All plans use the same formulary, though additional benefits are available under the SAIL, Plan Three and Palliative Care programs.
Alberta Drug coverage for seniors in Alberta is available through two publicly funded drug plans: Alberta Blue Cross Coverage for Seniors and Palliative Care Drug Coverage.xxii The Alberta Blue Cross Coverage for Seniors plan applies to all Albertans age 65 and older and their dependants, as well as recipients of the province’s Widows’ Pensionxxiii and their dependants. To qualify for coverage, the senior must be a resident of Alberta and be registered with the Alberta Health Care Insurance Plan.
Palliative Care Drug Coverage covers people receiving palliative care at home. To qualify for drug coverage under this plan, the person must be a resident of Alberta, be registered with the Alberta Health Care Insurance Plan, have been diagnosed by a physician as palliative and be receiving treatments at home.
Seniors covered under either of these programs are required to pay 30% of their drug costs, up to a maximum of $25 for each drug prescribed. Under the Palliative Care Drug Coverage plan, seniors pay copayments up to a lifetime maximum of $1,000.
xxii. A new income-based PharmaCare program was announced for implementation in 2014 to provide access to comprehensive
drug and supplementary health benefit coverage for Albertans of all ages. xxiii. The Widows’ Pension was created to provide assistance to residents of Alberta who lost their spouse, are age 55 to 65, have a
low income and are not old enough to receive federal assistance.
52
Drug Use Among Seniors on Public Drug Programs in Canada, 2012: Revised October 2014
Alberta Health Services provides all medically required drugs at no direct cost to seniors residing in LTC facilities, including nursing homes. The Alberta Cancer Board covers the cost of selected medically required cancer drugs as specified in the Alberta Cancer Board Outpatient Cancer Drug Benefit Program for eligible cancer patients. Prescription drugs used to treat sexually transmitted diseases or tuberculosis are provided free of charge. Provincewide Services provides coverage for high-cost drugs that treat conditions such as HIV or cystic fibrosis. Claims paid under any of these programs are not included in the NPDUIS Database.
Drug Program Formularies Seniors in Alberta are eligible for medications listed in the Alberta Health and Wellness Drug Benefit List, subject to the criteria noted on that list. Under Palliative Care Drug Coverage, seniors are also entitled to drugs covered by the Palliative Care Drug Benefit Supplement.
British Columbia Seniors in B.C. are covered under the Fair PharmaCare plan, which is available to residents of all ages but offers enhanced assistance to residents born in 1939 and earlier. To be eligible for the Fair PharmaCare plan, residents must have valid B.C. Medical Service Plan coverage and have filed an income tax return for the relevant taxation year. This plan has a deductible between 0% and 3% of net annual family income. After the deductible has been reached, the plan covers 70% of eligible drug costs. Full coverage of eligible drug costs are covered once the patient reaches between 2% and 4% of the net family income, depending on income level. Seniors eligible for enhanced assistance have a deductible of between 0% and 2% of net annual family income. After the deductible has been reached, the plan covers 75% of eligible drug costs. Full coverage of eligible drug costs are covered once the patient reaches between 1.25% and 3% of the net family income.
Seniors may also qualify for coverage under these plans: Permanent Residents of Licensed Residential Care Facilities, Recipients of B.C. Income Assistance, Cystic Fibrosis, No-Charge Psychiatric Medication and Palliative Care.
The Permanent Residents of Licensed Residential Care Facilities program is available for all permanent residents of a licensed residential care facility who are enrolled and receive coverage through the care facility. This plan covers the full cost of eligible prescription drugs. The Recipients of B.C. Income Assistance plan provides full coverage of eligible drug costs to residents receiving medical benefits and income assistance through the Ministry of Social Development. The Cystic Fibrosis plan is available to residents registered with a provincial cystic fibrosis clinic. The No-Charge Psychiatric Medication plan is available if the patient’s physician or psychiatrist submits an application for psychiatric medication coverage to a mental health service centre for approval. The Palliative Care plan is available to patients wishing to receive palliative care at home.
Drug Program Formularies Seniors in B.C. are eligible for reimbursement toward any drugs covered in the B.C. PharmaCare Formulary, subject to the criteria noted in the formulary.
53
Drug Use Among Seniors on Public Drug Programs in Canada, 2012: Revised October 2014
First Nations and Inuit Health Branch Seniors are eligible for coverage under the FNIHB Non-Insured Health Benefits (NIHB) program, which is designed for people of all ages. Registered Indians, recognized Inuk, or Innu members of one of the two Innu communities in Labrador (Davis Inlet and Sheshatshiu) are eligible for coverage.
The NIHB program covers all costs for eligible drugs. Seniors living in Ontario who are eligible for coverage under the NIHB program first have their claim covered by the ODB program in Ontario; any remaining drug cost is covered by the NIHB program.
Drug Program Formularies Seniors covered through the NIHB program are eligible to receive medications from the NIHB Drug Benefit List.
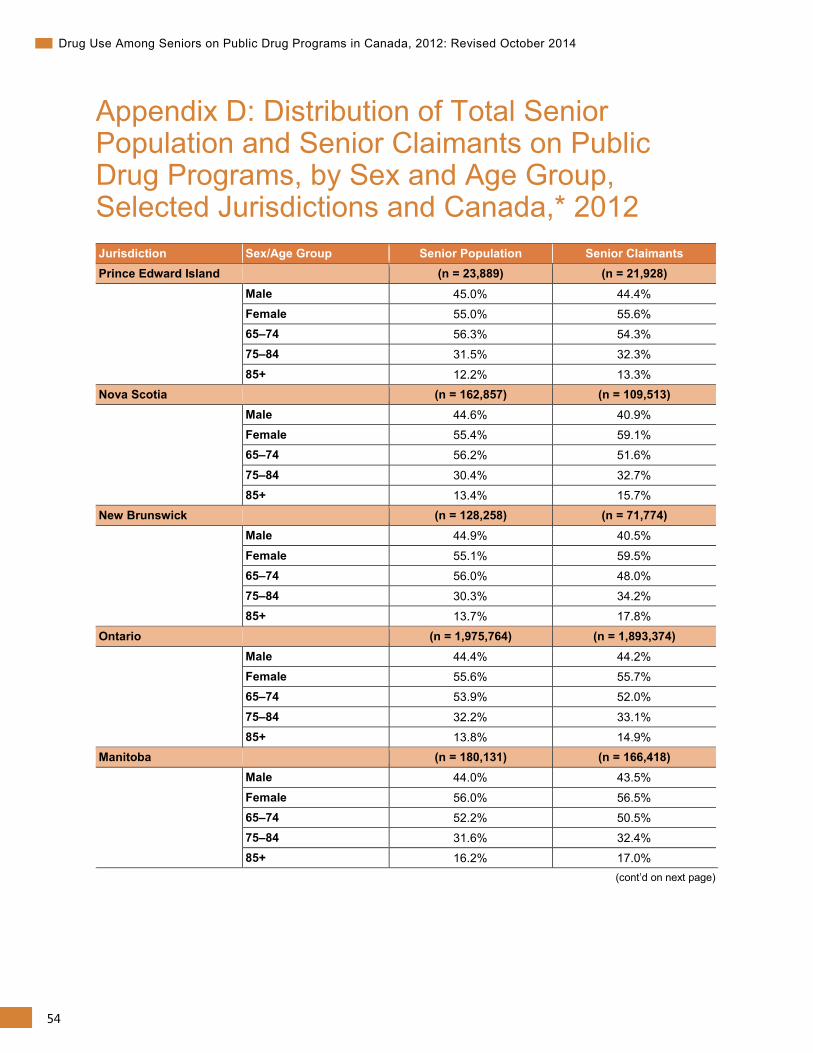
54
Drug Use Among Seniors on Public Drug Programs in Canada, 2012: Revised October 2014
Appendix D: Distribution of Total Senior Population and Senior Claimants on Public Drug Programs, by Sex and Age Group, Selected Jurisdictions and Canada,* 2012 Jurisdiction Sex/Age Group Senior Population Senior Claimants Prince Edward Island
(n = 23,889) (n = 21,928)
Male 45.0% 44.4% Female 55.0% 55.6% 65–74 56.3% 54.3% 75–84 31.5% 32.3%
85+ 12.2% 13.3% Nova Scotia (n = 162,857) (n = 109,513) Male 44.6% 40.9% Female 55.4% 59.1% 65–74 56.2% 51.6%
75–84 30.4% 32.7% 85+ 13.4% 15.7% New Brunswick (n = 128,258) (n = 71,774) Male 44.9% 40.5%
Female 55.1% 59.5% 65–74 56.0% 48.0% 75–84 30.3% 34.2% 85+ 13.7% 17.8%
Ontario (n = 1,975,764) (n = 1,893,374) Male 44.4% 44.2% Female 55.6% 55.7% 65–74 53.9% 52.0%
75–84 32.2% 33.1% 85+ 13.8% 14.9% Manitoba
(n = 180,131) (n = 166,418)
Male 44.0% 43.5%
Female 56.0% 56.5% 65–74 52.2% 50.5% 75–84 31.6% 32.4% 85+ 16.2% 17.0%
(cont’d on next page)
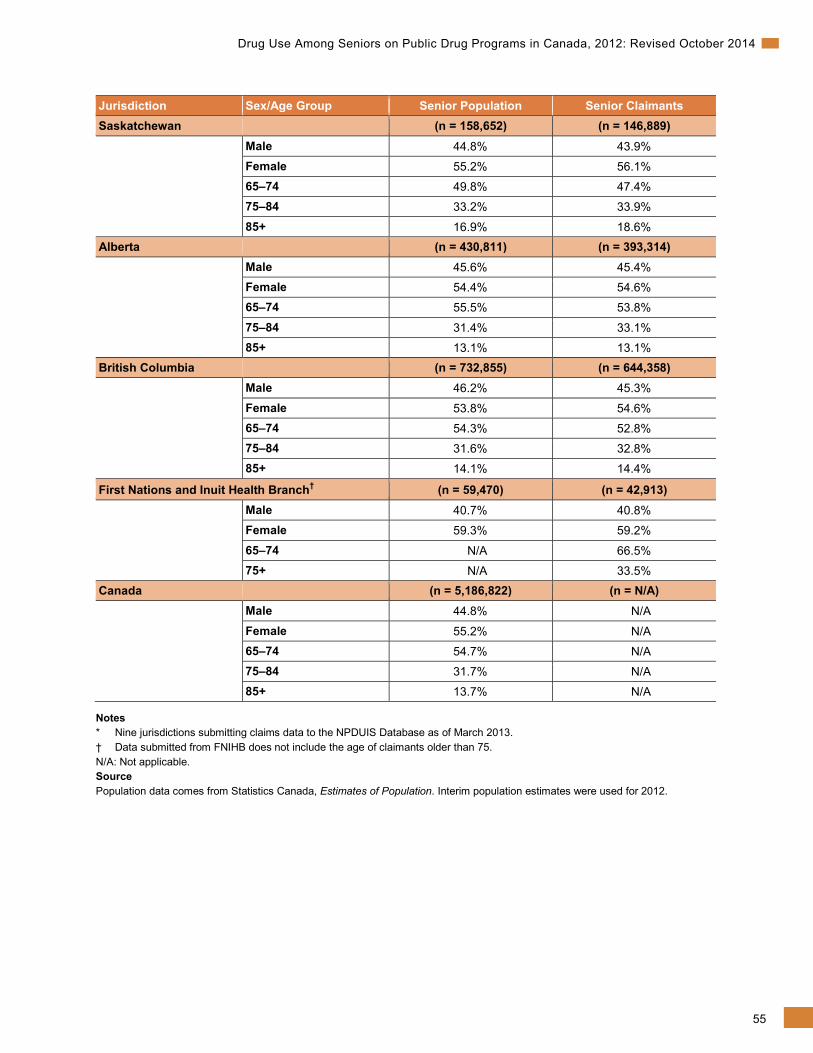
55
Drug Use Among Seniors on Public Drug Programs in Canada, 2012: Revised October 2014
Jurisdiction Sex/Age Group Senior Population Senior Claimants Saskatchewan (n = 158,652) (n = 146,889) Male 44.8% 43.9% Female 55.2% 56.1% 65–74 49.8% 47.4% 75–84 33.2% 33.9%
85+ 16.9% 18.6% Alberta (n = 430,811) (n = 393,314) Male 45.6% 45.4% Female 54.4% 54.6% 65–74 55.5% 53.8%
75–84 31.4% 33.1% 85+ 13.1% 13.1% British Columbia (n = 732,855) (n = 644,358) Male 46.2% 45.3%
Female 53.8% 54.6% 65–74 54.3% 52.8% 75–84 31.6% 32.8% 85+ 14.1% 14.4%
First Nations and Inuit Health Branch† (n = 59,470) (n = 42,913) Male 40.7% 40.8% Female 59.3% 59.2%
65–74 N/A 66.5% 75+ N/A 33.5% Canada (n = 5,186,822) (n = N/A) Male 44.8% N/A
Female 55.2% N/A 65–74 54.7% N/A 75–84 31.7% N/A 85+ 13.7% N/A
Notes * Nine jurisdictions submitting claims data to the NPDUIS Database as of March 2013. † Data submitted from FNIHB does not include the age of claimants older than 75. N/A: Not applicable. Source Population data comes from Statistics Canada, Estimates of Population. Interim population estimates were used for 2012.
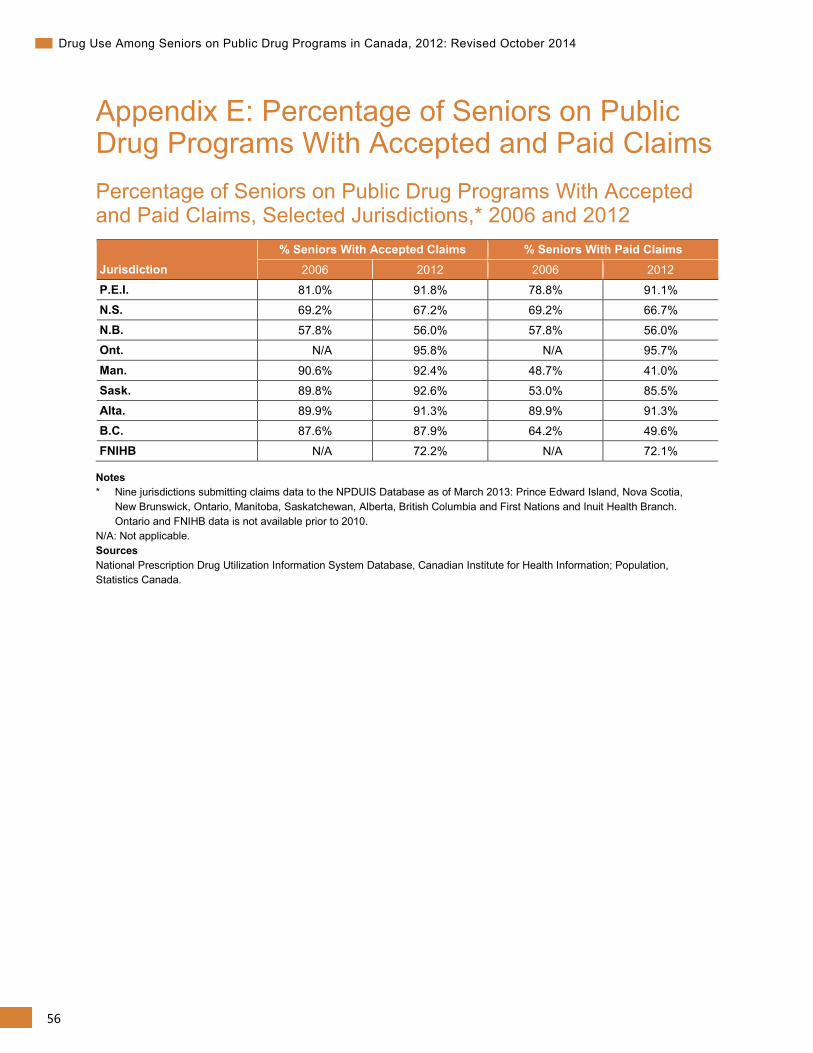
56
Drug Use Among Seniors on Public Drug Programs in Canada, 2012: Revised October 2014
Appendix E: Percentage of Seniors on Public Drug Programs With Accepted and Paid Claims Percentage of Seniors on Public Drug Programs With Accepted and Paid Claims, Selected Jurisdictions,* 2006 and 2012
Jurisdiction % Seniors With Accepted Claims % Seniors With Paid Claims
2006 2012 2006 2012
P.E.I. 81.0% 91.8% 78.8% 91.1% N.S. 69.2% 67.2% 69.2% 66.7% N.B. 57.8% 56.0% 57.8% 56.0% Ont. N/A 95.8% N/A 95.7%
Man. 90.6% 92.4% 48.7% 41.0% Sask. 89.8% 92.6% 53.0% 85.5% Alta. 89.9% 91.3% 89.9% 91.3% B.C. 87.6% 87.9% 64.2% 49.6% FNIHB N/A 72.2% N/A 72.1%
Notes * Nine jurisdictions submitting claims data to the NPDUIS Database as of March 2013: Prince Edward Island, Nova Scotia,
New Brunswick, Ontario, Manitoba, Saskatchewan, Alberta, British Columbia and First Nations and Inuit Health Branch. Ontario and FNIHB data is not available prior to 2010.
N/A: Not applicable. Sources National Prescription Drug Utilization Information System Database, Canadian Institute for Health Information; Population, Statistics Canada.
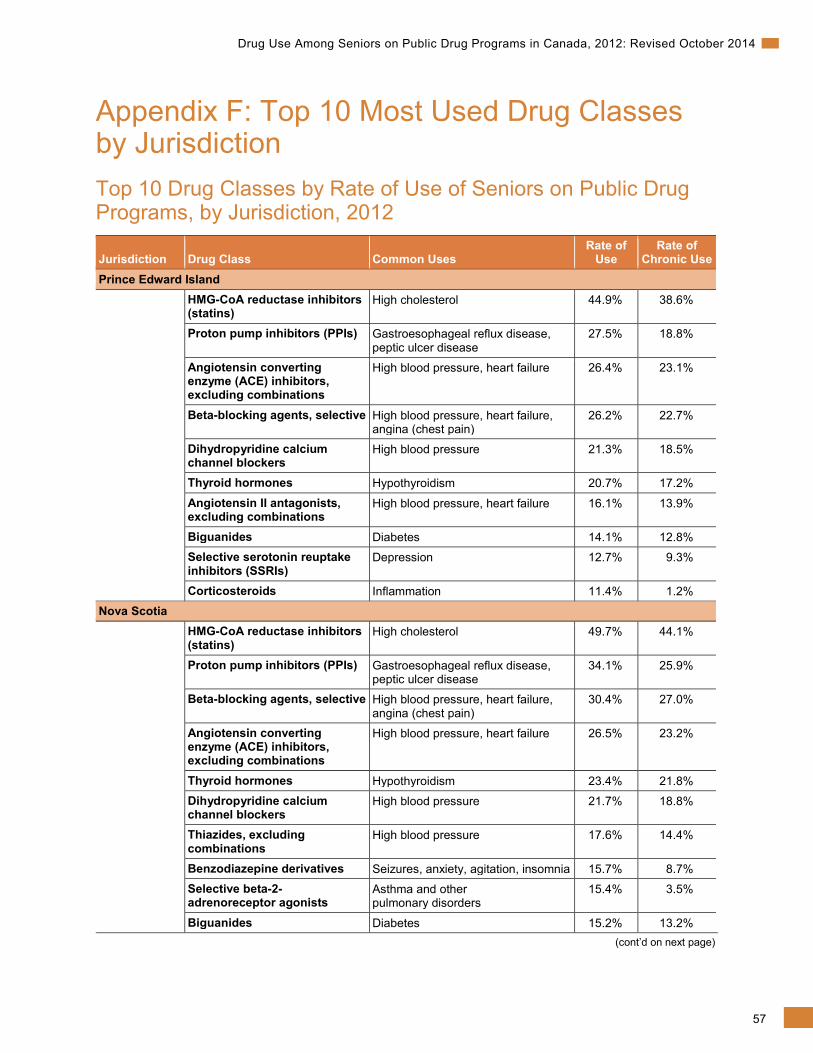
57
Drug Use Among Seniors on Public Drug Programs in Canada, 2012: Revised October 2014
Appendix F: Top 10 Most Used Drug Classes by Jurisdiction Top 10 Drug Classes by Rate of Use of Seniors on Public Drug Programs, by Jurisdiction, 2012
Jurisdiction Drug Class Common Uses Rate of
Use Rate of
Chronic Use Prince Edward Island HMG-CoA reductase inhibitors
(statins) High cholesterol 44.9% 38.6%
Proton pump inhibitors (PPIs) Gastroesophageal reflux disease, peptic ulcer disease
27.5% 18.8%
Angiotensin converting enzyme (ACE) inhibitors, excluding combinations
High blood pressure, heart failure 26.4% 23.1%
Beta-blocking agents, selective High blood pressure, heart failure, angina (chest pain)
26.2% 22.7%
Dihydropyridine calcium channel blockers
High blood pressure 21.3% 18.5%
Thyroid hormones Hypothyroidism 20.7% 17.2%
Angiotensin II antagonists, excluding combinations
High blood pressure, heart failure 16.1% 13.9%
Biguanides Diabetes 14.1% 12.8% Selective serotonin reuptake inhibitors (SSRIs)
Depression 12.7% 9.3%
Corticosteroids Inflammation 11.4% 1.2% Nova Scotia HMG-CoA reductase inhibitors
(statins) High cholesterol 49.7% 44.1%
Proton pump inhibitors (PPIs) Gastroesophageal reflux disease, peptic ulcer disease
34.1% 25.9%
Beta-blocking agents, selective High blood pressure, heart failure, angina (chest pain)
30.4% 27.0%
Angiotensin converting enzyme (ACE) inhibitors, excluding combinations
High blood pressure, heart failure 26.5% 23.2%
Thyroid hormones Hypothyroidism 23.4% 21.8% Dihydropyridine calcium channel blockers
High blood pressure 21.7% 18.8%
Thiazides, excluding combinations
High blood pressure 17.6% 14.4%
Benzodiazepine derivatives Seizures, anxiety, agitation, insomnia 15.7% 8.7% Selective beta-2-adrenoreceptor agonists
Asthma and other pulmonary disorders
15.4% 3.5%
Biguanides Diabetes 15.2% 13.2% (cont’d on next page)
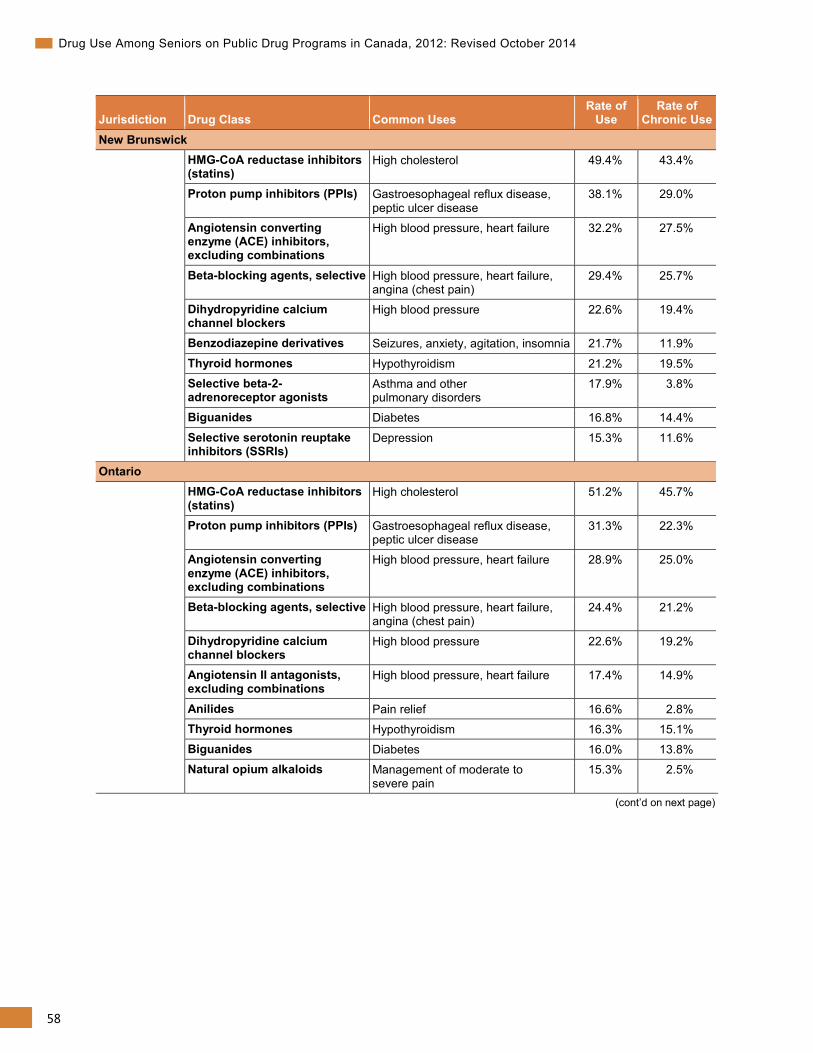
58
Drug Use Among Seniors on Public Drug Programs in Canada, 2012: Revised October 2014
Jurisdiction Drug Class Common Uses Rate of
Use Rate of
Chronic Use New Brunswick HMG-CoA reductase inhibitors
(statins) High cholesterol 49.4% 43.4%
Proton pump inhibitors (PPIs) Gastroesophageal reflux disease, peptic ulcer disease
38.1% 29.0%
Angiotensin converting enzyme (ACE) inhibitors, excluding combinations
High blood pressure, heart failure 32.2% 27.5%
Beta-blocking agents, selective High blood pressure, heart failure, angina (chest pain)
29.4% 25.7%
Dihydropyridine calcium channel blockers
High blood pressure 22.6% 19.4%
Benzodiazepine derivatives Seizures, anxiety, agitation, insomnia 21.7% 11.9%
Thyroid hormones Hypothyroidism 21.2% 19.5% Selective beta-2-adrenoreceptor agonists
Asthma and other pulmonary disorders
17.9% 3.8%
Biguanides Diabetes 16.8% 14.4%
Selective serotonin reuptake inhibitors (SSRIs)
Depression 15.3% 11.6%
Ontario HMG-CoA reductase inhibitors
(statins) High cholesterol 51.2% 45.7%
Proton pump inhibitors (PPIs) Gastroesophageal reflux disease, peptic ulcer disease
31.3% 22.3%
Angiotensin converting enzyme (ACE) inhibitors, excluding combinations
High blood pressure, heart failure 28.9% 25.0%
Beta-blocking agents, selective High blood pressure, heart failure, angina (chest pain)
24.4% 21.2%
Dihydropyridine calcium channel blockers
High blood pressure 22.6% 19.2%
Angiotensin II antagonists, excluding combinations
High blood pressure, heart failure 17.4% 14.9%
Anilides Pain relief 16.6% 2.8% Thyroid hormones Hypothyroidism 16.3% 15.1% Biguanides Diabetes 16.0% 13.8% Natural opium alkaloids Management of moderate to
severe pain 15.3% 2.5%
(cont’d on next page)
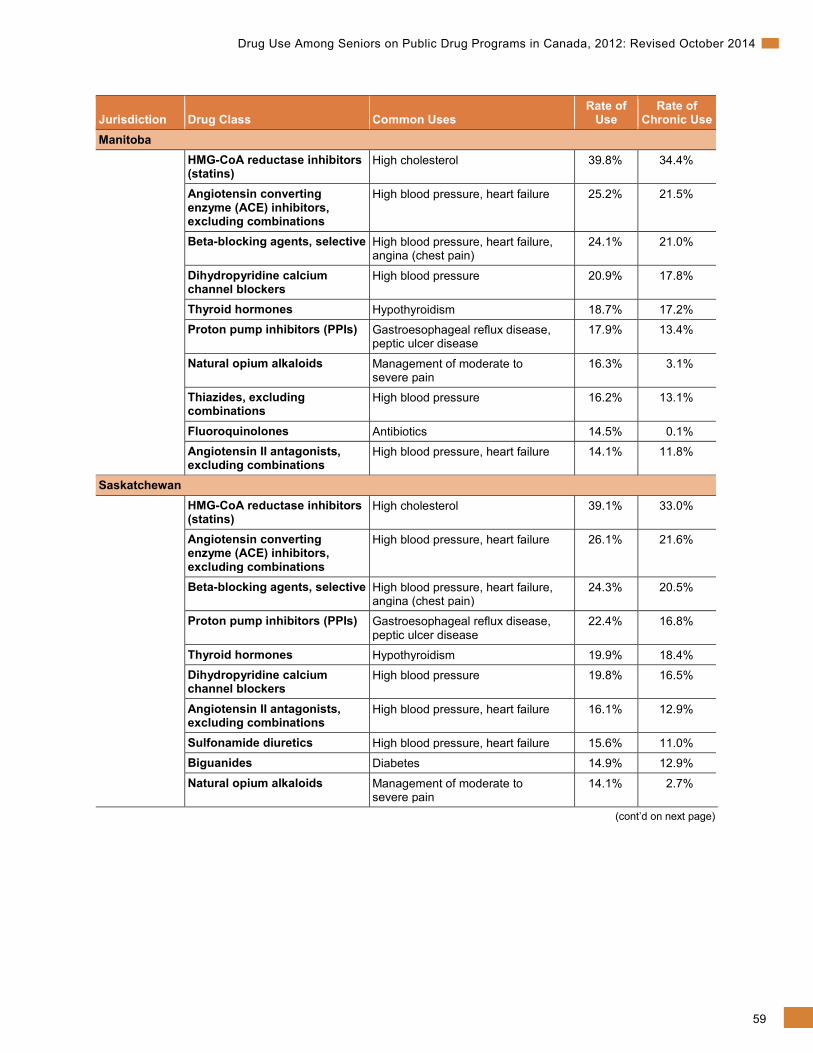
59
Drug Use Among Seniors on Public Drug Programs in Canada, 2012: Revised October 2014
Jurisdiction Drug Class Common Uses Rate of
Use Rate of
Chronic Use Manitoba HMG-CoA reductase inhibitors
(statins) High cholesterol 39.8% 34.4%
Angiotensin converting enzyme (ACE) inhibitors, excluding combinations
High blood pressure, heart failure 25.2% 21.5%
Beta-blocking agents, selective High blood pressure, heart failure, angina (chest pain)
24.1% 21.0%
Dihydropyridine calcium channel blockers
High blood pressure 20.9% 17.8%
Thyroid hormones Hypothyroidism 18.7% 17.2% Proton pump inhibitors (PPIs) Gastroesophageal reflux disease,
peptic ulcer disease 17.9% 13.4%
Natural opium alkaloids Management of moderate to severe pain
16.3% 3.1%
Thiazides, excluding combinations
High blood pressure 16.2% 13.1%
Fluoroquinolones Antibiotics 14.5% 0.1% Angiotensin II antagonists, excluding combinations
High blood pressure, heart failure 14.1% 11.8%
Saskatchewan HMG-CoA reductase inhibitors
(statins) High cholesterol 39.1% 33.0%
Angiotensin converting enzyme (ACE) inhibitors, excluding combinations
High blood pressure, heart failure 26.1% 21.6%
Beta-blocking agents, selective High blood pressure, heart failure, angina (chest pain)
24.3% 20.5%
Proton pump inhibitors (PPIs) Gastroesophageal reflux disease, peptic ulcer disease
22.4% 16.8%
Thyroid hormones Hypothyroidism 19.9% 18.4% Dihydropyridine calcium channel blockers
High blood pressure 19.8% 16.5%
Angiotensin II antagonists, excluding combinations
High blood pressure, heart failure 16.1% 12.9%
Sulfonamide diuretics High blood pressure, heart failure 15.6% 11.0% Biguanides Diabetes 14.9% 12.9%
Natural opium alkaloids Management of moderate to severe pain
14.1% 2.7%
(cont’d on next page)
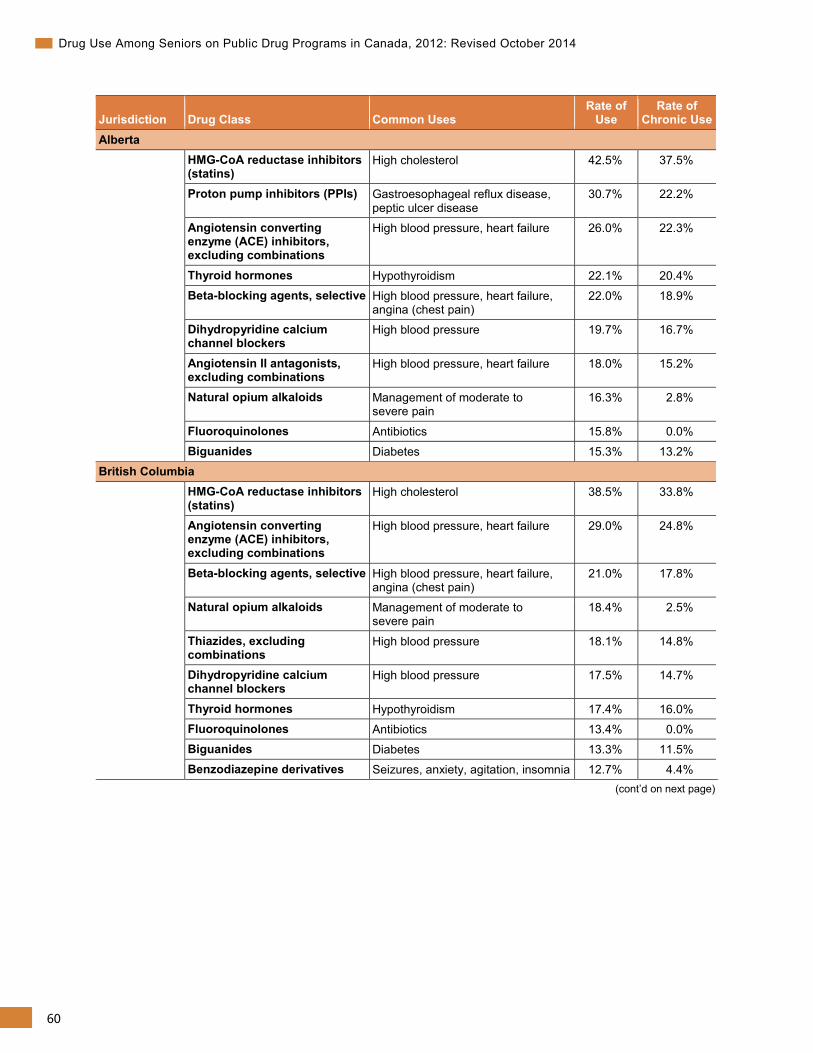
60
Drug Use Among Seniors on Public Drug Programs in Canada, 2012: Revised October 2014
Jurisdiction Drug Class Common Uses Rate of
Use Rate of
Chronic Use Alberta HMG-CoA reductase inhibitors
(statins) High cholesterol 42.5% 37.5%
Proton pump inhibitors (PPIs) Gastroesophageal reflux disease, peptic ulcer disease
30.7% 22.2%
Angiotensin converting enzyme (ACE) inhibitors, excluding combinations
High blood pressure, heart failure 26.0% 22.3%
Thyroid hormones Hypothyroidism 22.1% 20.4% Beta-blocking agents, selective High blood pressure, heart failure,
angina (chest pain) 22.0% 18.9%
Dihydropyridine calcium channel blockers
High blood pressure 19.7% 16.7%
Angiotensin II antagonists, excluding combinations
High blood pressure, heart failure 18.0% 15.2%
Natural opium alkaloids Management of moderate to severe pain
16.3% 2.8%
Fluoroquinolones Antibiotics 15.8% 0.0% Biguanides Diabetes 15.3% 13.2%
British Columbia HMG-CoA reductase inhibitors
(statins) High cholesterol 38.5% 33.8%
Angiotensin converting enzyme (ACE) inhibitors, excluding combinations
High blood pressure, heart failure 29.0% 24.8%
Beta-blocking agents, selective High blood pressure, heart failure, angina (chest pain)
21.0% 17.8%
Natural opium alkaloids Management of moderate to severe pain
18.4% 2.5%
Thiazides, excluding combinations
High blood pressure 18.1% 14.8%
Dihydropyridine calcium channel blockers
High blood pressure 17.5% 14.7%
Thyroid hormones Hypothyroidism 17.4% 16.0% Fluoroquinolones Antibiotics 13.4% 0.0% Biguanides Diabetes 13.3% 11.5% Benzodiazepine derivatives Seizures, anxiety, agitation, insomnia 12.7% 4.4%
(cont’d on next page)
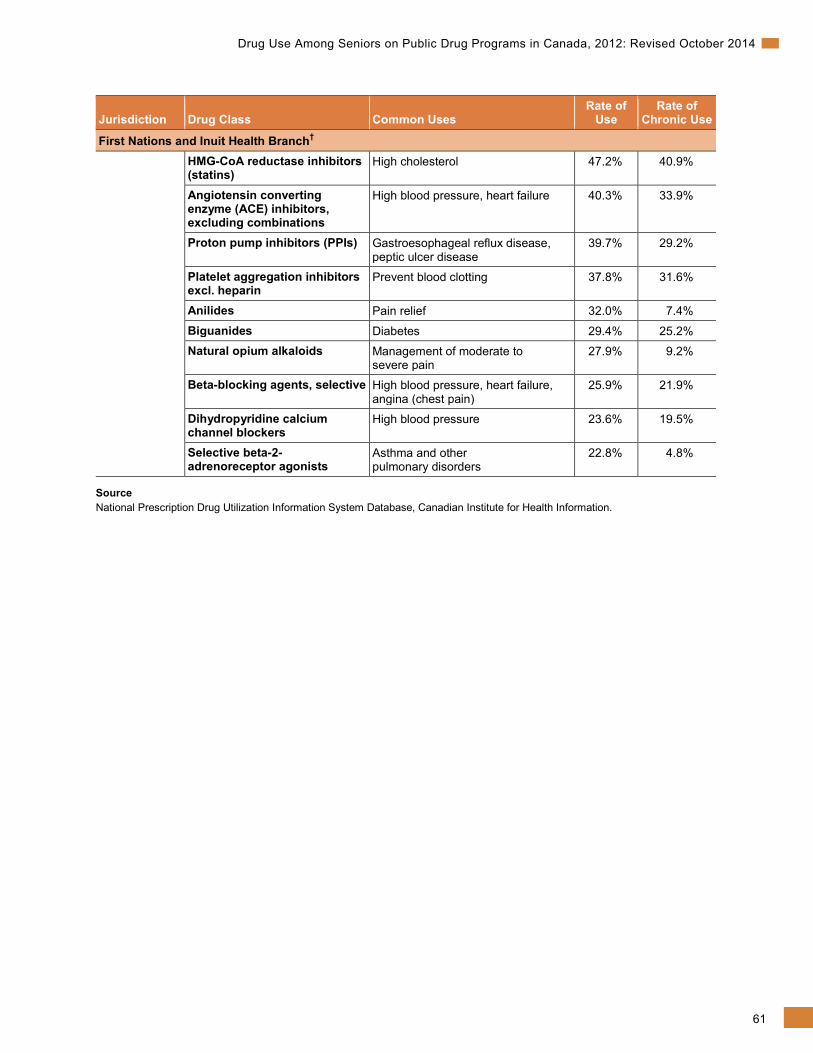
61
Drug Use Among Seniors on Public Drug Programs in Canada, 2012: Revised October 2014
Jurisdiction Drug Class Common Uses Rate of
Use Rate of
Chronic Use
First Nations and Inuit Health Branch† HMG-CoA reductase inhibitors
(statins) High cholesterol 47.2% 40.9%
Angiotensin converting enzyme (ACE) inhibitors, excluding combinations
High blood pressure, heart failure 40.3% 33.9%
Proton pump inhibitors (PPIs) Gastroesophageal reflux disease, peptic ulcer disease
39.7% 29.2%
Platelet aggregation inhibitors excl. heparin
Prevent blood clotting 37.8% 31.6%
Anilides Pain relief 32.0% 7.4%
Biguanides Diabetes 29.4% 25.2% Natural opium alkaloids Management of moderate to
severe pain 27.9% 9.2%
Beta-blocking agents, selective High blood pressure, heart failure, angina (chest pain)
25.9% 21.9%
Dihydropyridine calcium channel blockers
High blood pressure 23.6% 19.5%
Selective beta-2-adrenoreceptor agonists
Asthma and other pulmonary disorders
22.8% 4.8%
Source National Prescription Drug Utilization Information System Database, Canadian Institute for Health Information.
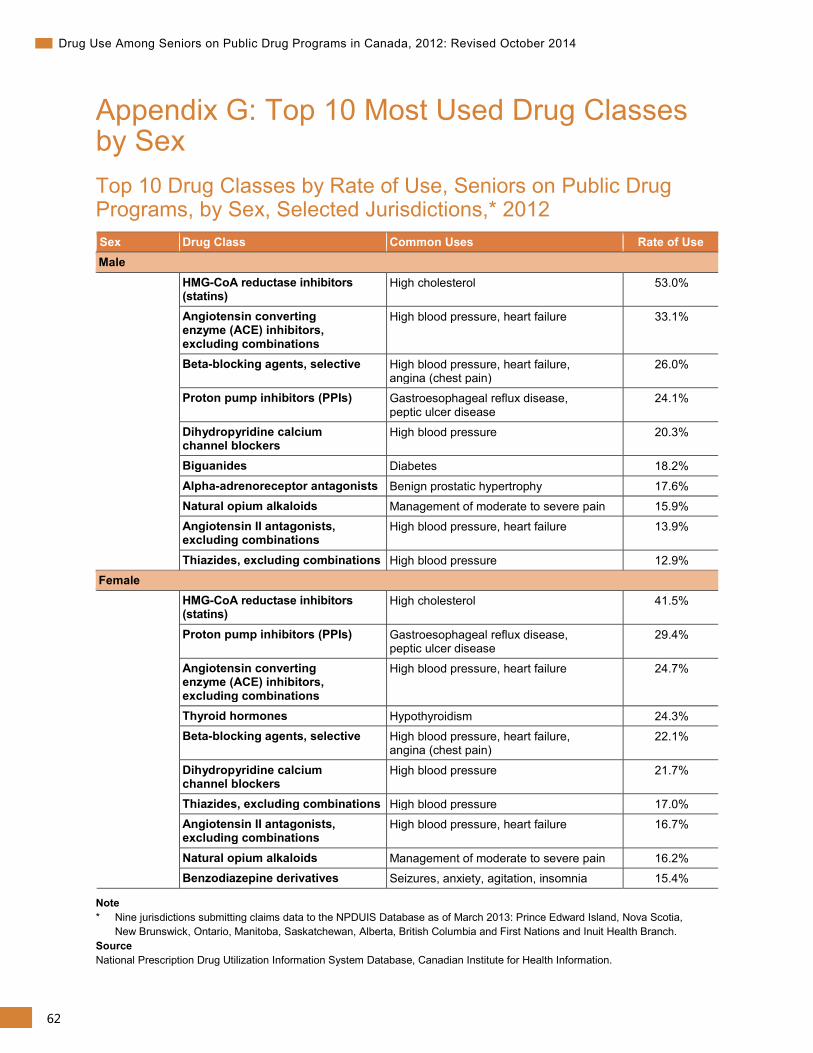
62
Drug Use Among Seniors on Public Drug Programs in Canada, 2012: Revised October 2014
Appendix G: Top 10 Most Used Drug Classes by Sex Top 10 Drug Classes by Rate of Use, Seniors on Public Drug Programs, by Sex, Selected Jurisdictions,* 2012 Sex Drug Class Common Uses Rate of Use Male HMG-CoA reductase inhibitors
(statins) High cholesterol 53.0%
Angiotensin converting enzyme (ACE) inhibitors, excluding combinations
High blood pressure, heart failure 33.1%
Beta-blocking agents, selective High blood pressure, heart failure, angina (chest pain)
26.0%
Proton pump inhibitors (PPIs) Gastroesophageal reflux disease, peptic ulcer disease
24.1%
Dihydropyridine calcium channel blockers
High blood pressure 20.3%
Biguanides Diabetes 18.2%
Alpha-adrenoreceptor antagonists Benign prostatic hypertrophy 17.6% Natural opium alkaloids Management of moderate to severe pain 15.9% Angiotensin II antagonists, excluding combinations
High blood pressure, heart failure 13.9%
Thiazides, excluding combinations High blood pressure 12.9% Female HMG-CoA reductase inhibitors
(statins) High cholesterol 41.5%
Proton pump inhibitors (PPIs) Gastroesophageal reflux disease, peptic ulcer disease
29.4%
Angiotensin converting enzyme (ACE) inhibitors, excluding combinations
High blood pressure, heart failure 24.7%
Thyroid hormones Hypothyroidism 24.3% Beta-blocking agents, selective High blood pressure, heart failure,
angina (chest pain) 22.1%
Dihydropyridine calcium channel blockers
High blood pressure 21.7%
Thiazides, excluding combinations High blood pressure 17.0% Angiotensin II antagonists, excluding combinations
High blood pressure, heart failure 16.7%
Natural opium alkaloids Management of moderate to severe pain 16.2% Benzodiazepine derivatives Seizures, anxiety, agitation, insomnia 15.4%
Note * Nine jurisdictions submitting claims data to the NPDUIS Database as of March 2013: Prince Edward Island, Nova Scotia,
New Brunswick, Ontario, Manitoba, Saskatchewan, Alberta, British Columbia and First Nations and Inuit Health Branch. Source National Prescription Drug Utilization Information System Database, Canadian Institute for Health Information.
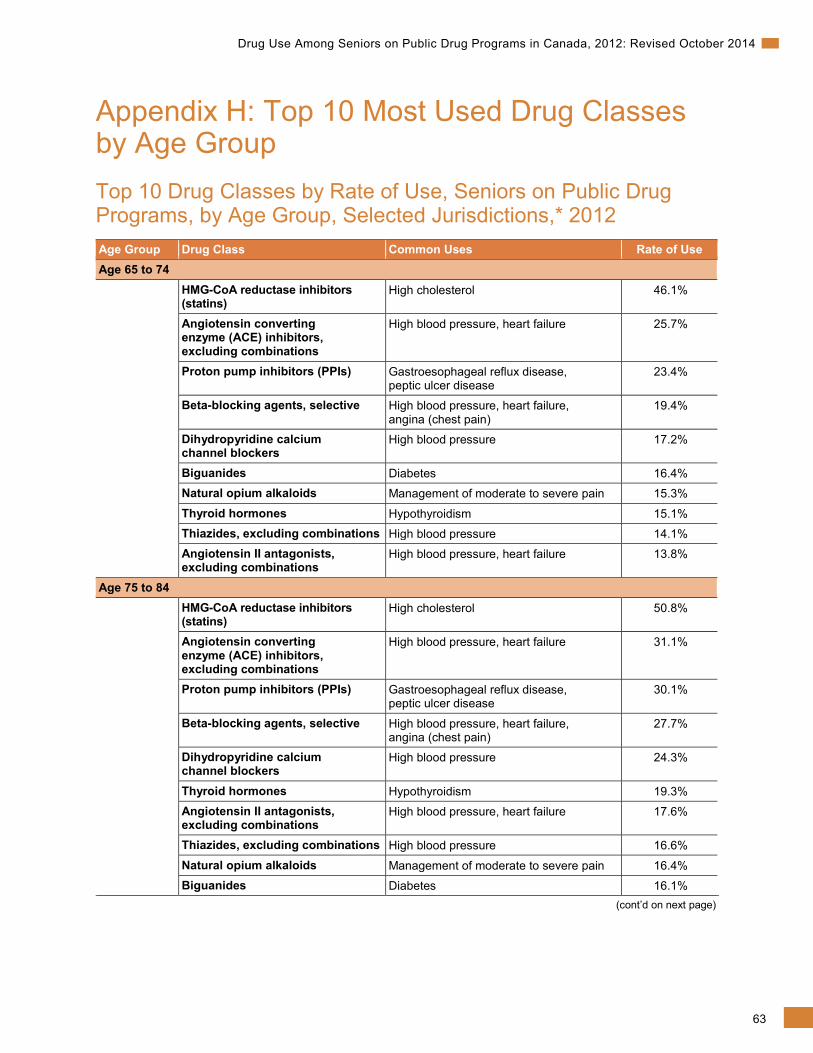
63
Drug Use Among Seniors on Public Drug Programs in Canada, 2012: Revised October 2014
Appendix H: Top 10 Most Used Drug Classes by Age Group Top 10 Drug Classes by Rate of Use, Seniors on Public Drug Programs, by Age Group, Selected Jurisdictions,* 2012 Age Group Drug Class Common Uses Rate of Use Age 65 to 74 HMG-CoA reductase inhibitors
(statins) High cholesterol 46.1%
Angiotensin converting enzyme (ACE) inhibitors, excluding combinations
High blood pressure, heart failure 25.7%
Proton pump inhibitors (PPIs) Gastroesophageal reflux disease, peptic ulcer disease
23.4%
Beta-blocking agents, selective High blood pressure, heart failure, angina (chest pain)
19.4%
Dihydropyridine calcium channel blockers
High blood pressure 17.2%
Biguanides Diabetes 16.4% Natural opium alkaloids Management of moderate to severe pain 15.3%
Thyroid hormones Hypothyroidism 15.1% Thiazides, excluding combinations High blood pressure 14.1% Angiotensin II antagonists, excluding combinations
High blood pressure, heart failure 13.8%
Age 75 to 84 HMG-CoA reductase inhibitors
(statins) High cholesterol 50.8%
Angiotensin converting enzyme (ACE) inhibitors, excluding combinations
High blood pressure, heart failure 31.1%
Proton pump inhibitors (PPIs) Gastroesophageal reflux disease, peptic ulcer disease
30.1%
Beta-blocking agents, selective High blood pressure, heart failure, angina (chest pain)
27.7%
Dihydropyridine calcium channel blockers
High blood pressure 24.3%
Thyroid hormones Hypothyroidism 19.3% Angiotensin II antagonists, excluding combinations
High blood pressure, heart failure 17.6%
Thiazides, excluding combinations High blood pressure 16.6%
Natural opium alkaloids Management of moderate to severe pain 16.4% Biguanides Diabetes 16.1%
(cont’d on next page)
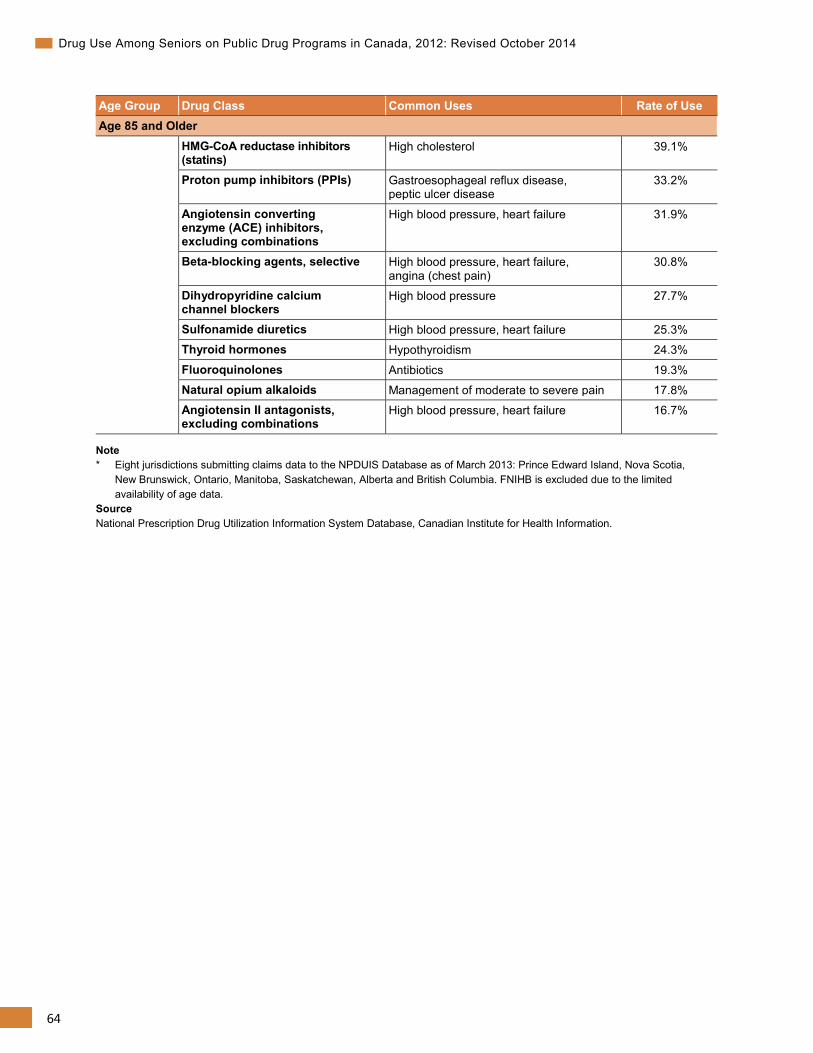
64
Drug Use Among Seniors on Public Drug Programs in Canada, 2012: Revised October 2014
Age Group Drug Class Common Uses Rate of Use Age 85 and Older HMG-CoA reductase inhibitors
(statins) High cholesterol 39.1%
Proton pump inhibitors (PPIs) Gastroesophageal reflux disease, peptic ulcer disease
33.2%
Angiotensin converting enzyme (ACE) inhibitors, excluding combinations
High blood pressure, heart failure 31.9%
Beta-blocking agents, selective High blood pressure, heart failure, angina (chest pain)
30.8%
Dihydropyridine calcium channel blockers
High blood pressure 27.7%
Sulfonamide diuretics High blood pressure, heart failure 25.3% Thyroid hormones Hypothyroidism 24.3%
Fluoroquinolones Antibiotics 19.3% Natural opium alkaloids Management of moderate to severe pain 17.8% Angiotensin II antagonists, excluding combinations
High blood pressure, heart failure 16.7%
Note * Eight jurisdictions submitting claims data to the NPDUIS Database as of March 2013: Prince Edward Island, Nova Scotia,
New Brunswick, Ontario, Manitoba, Saskatchewan, Alberta and British Columbia. FNIHB is excluded due to the limited availability of age data.
Source National Prescription Drug Utilization Information System Database, Canadian Institute for Health Information.
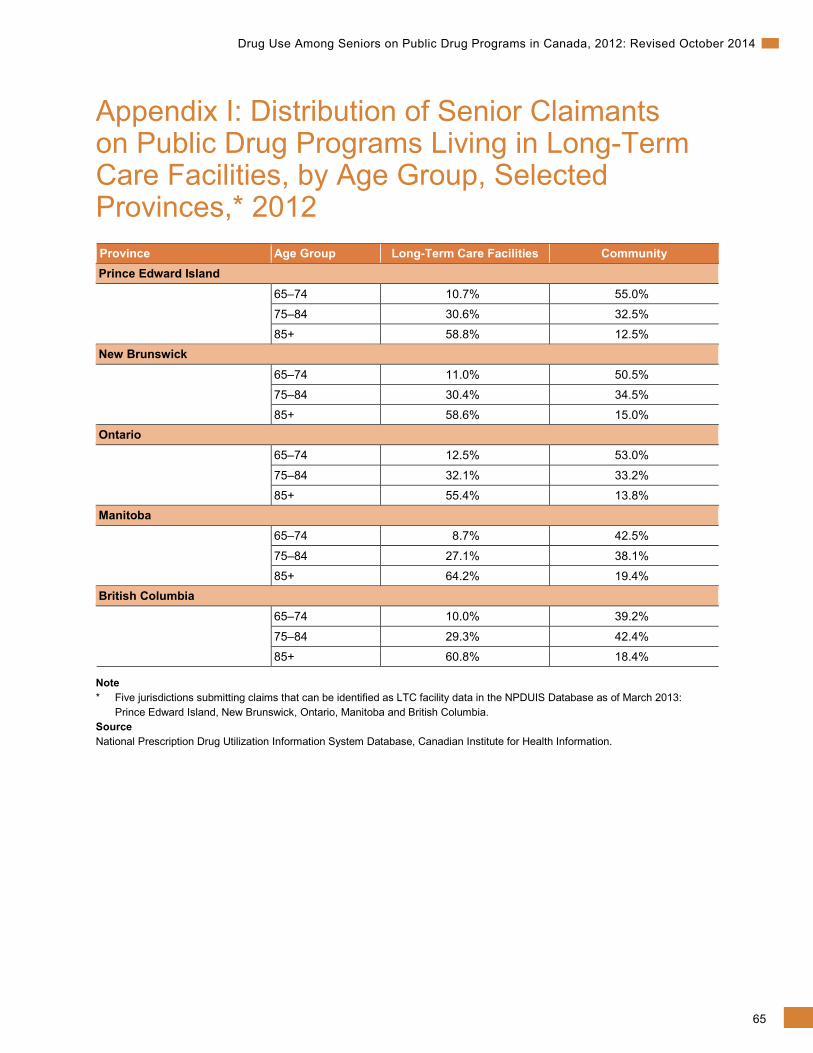
65
Drug Use Among Seniors on Public Drug Programs in Canada, 2012: Revised October 2014
Appendix I: Distribution of Senior Claimants on Public Drug Programs Living in Long-Term Care Facilities, by Age Group, Selected Provinces,* 2012 Province Age Group Long-Term Care Facilities Community Prince Edward Island 65–74 10.7% 55.0%
75–84 30.6% 32.5%
85+ 58.8% 12.5% New Brunswick 65–74 11.0% 50.5%
75–84 30.4% 34.5%
85+ 58.6% 15.0% Ontario 65–74 12.5% 53.0%
75–84 32.1% 33.2%
85+ 55.4% 13.8% Manitoba 65–74 8.7% 42.5%
75–84 27.1% 38.1%
85+ 64.2% 19.4% British Columbia 65–74 10.0% 39.2%
75–84 29.3% 42.4%
85+ 60.8% 18.4%
Note * Five jurisdictions submitting claims that can be identified as LTC facility data in the NPDUIS Database as of March 2013:
Prince Edward Island, New Brunswick, Ontario, Manitoba and British Columbia. Source National Prescription Drug Utilization Information System Database, Canadian Institute for Health Information.
66
Drug Use Among Seniors on Public Drug Programs in Canada, 2012: Revised October 2014
Appendix J: Provincial and Territorial Drug Programs More information on public drug programs is available from the following websites:
Newfoundland and Labrador Prescription Drug Program www.health.gov.nl.ca/health/prescription/nlpdp_plan_overview.html
Prince Edward Island Pharmacy Services http://healthpei.ca/drugprograms
Nova Scotia Pharmacare www.gov.ns.ca/health/pharmacare/
New Brunswick Prescription Drug Program www.gnb.ca/0212/intro-e.asp
Régime général d’assurance médicaments du Québec (RGAM) www.ramq.gouv.qc.ca/en/citizens/prescription-drug-insurance/Pages/prescription-drug-insurance.aspx
Ontario Drug Benefits www.health.gov.on.ca/en/public/programs/drugs/programs/programs.aspx
Manitoba Pharmacare Program www.gov.mb.ca/health/pharmacare/index.html
Saskatchewan Drug Plan www.health.gov.sk.ca/drug-plan-benefits
Alberta Prescription Drug Program www.health.alberta.ca/services/drug-coverage-services.html
British Columbia Pharmacare www.health.gov.bc.ca/pharmacare/
Yukon Pharmacare www.hss.gov.yk.ca/pharmacare.php
Northwest Territories www.hss.gov.nt.ca/health/nwt-health-care-plan/extended-health-benefits-seniors-program
Nunavut www.gov.nu.ca/health/information/health-insurance
67
Drug Use Among Seniors on Public Drug Programs in Canada, 2012: Revised October 2014
References 1. Morgan S, et al. The Canadian Rx Atlas, 2nd Edition. Centre for Health Services and Policy
Research, University of British Columbia. 2008.
2. Canadian Institute for Health Information. National Health Expenditure Trends, 1975 to 2013. Ottawa, ON: CIHI; 2013.
3. Canadian Institute for Health Information. Health Care in Canada, 2011: A Focus on Seniors and Aging. Ottawa, ON: CIHI; 2011.
4. Ramage-Morin P. Medication use among senior Canadians. Statistics Canada Health Reports. March 2009; Vol. 20, no. 1. Accessed on March 10, 2014, from <http://www.statcan.gc.ca/pub/82-003-x/2009001/article/10801-eng.pdf>. Catalogue no 82-003-XPE.
5. Canadian Institute for Health Information. Seniors and the Health Care System: What Is the Impact of Multiple Chronic Conditions?. Ottawa, ON: CIHI; 2011.
6. Olsson N, et al. “Medication quality and quality of life in the elderly, a cohort study.” Health and Quality of Life Outcomes 2011 (November 3, 2011). Accessed on March 10, 2014, from <http://www.hqlo.com/content/9/1/95>.
7. Clatney L, et al. Improving the Quality of Drug Management of Saskatchewan Seniors Living in the Community. Saskatoon, SK: Health Quality Council; 2005.
8. Marcum ZA, et al. “Medication Misadventures in the Elderly: A Year in Review.” American Journal of Geriatric Pharmacotherapy. (February 2010): 8,1 pp. 77-83.
9. Canadian Institute for Health Information. Drivers of Prescription Drug Spending in Canada. Ottawa, ON: CIHI; 2011.
10. Canadian Institute for Health Information. Prescribed Drug Spending in Canada, 2012: A Focus on Public Drug Programs. Ottawa, ON: CIHI; 2014.
11. Health Canada. First Nations and Inuit Health Branch. Non-Insured Health Benefits Program. Annual Report 2011/2012. Ottawa, ON: CIHI; 2012.
12. Bleumink G. et al. “Quantifying the heart failure epidemic: prevalence, incidence rate, lifetime risk and prognosis of heart failure The Rotterdam Study.” European Heart Journal, (September 2004): 25 pp.1614-1619. Accessed on March 10, 2014, from <http://eurheartj.oxfordjournals.org/content/25/18/1614.full.pdf+html>
13. Anderson K. “Are female lower urinary tract symptoms alleviated by alpha-adrenoreceptor antagonists?” Nature Clinical Practice Urology (November, 2008): 5(11) pp. 586-587
68
Drug Use Among Seniors on Public Drug Programs in Canada, 2012: Revised October 2014
14. Toward Optimized Practice. Guideline for the Diagnosis and Management of Urinary Tract Infections in Long Term Care. Last modified March 2010. Accessed on March 10, 2014, from <http://www.topalbertadoctors.org/cpgs/?sid=15&cpg_cats=66>.
15. Robitaille R, et al. “Diagnosed hypertension in Canada: incidence, prevalence and associated mortality.” CMAJ (January 2012): 184(1).
16. Chow C, et al. “Regional variation in self-reported heart disease prevalence in Canada.” The Canadian Journal of Cardiology (December 2005): 21(14) pp: 1265-1271.
17. Kwan D, Farrell B. “Polypharmacy—optimizing medication use in elderly patients.” Pharmacy Practice (2012): 29(2) pp. 20-25.
18. Terner M, et al. “Chronic Conditions More Than Age Drive Health System Use in Canadian Seniors.” Healthcare Quarterly (2011): 14(3) pp. 19-22.
19. American Geriatric Society. American Geriatric Society Updated Beers Criteria for Potentially Inappropriate Medication Use in Older Adults. New York, N.Y.: JAGS, 2012. Accessed on March 10, 2014, from <http://www.americangeriatrics.org/ health_care_professionals/clinical_practice/clinical_guidelines_recommendations/2012>.
20. Gallagher P, et al. “STOPP (Screening tool of older person’s prescriptions) and START (Screening tool to alert doctors to right treatment).” International Journal of Clinical Pharmacology & Therapeutics (February 2008): 46(2) pp. 72-83.
21. Lam M, et al. “The use of STOPP/START criteria as a screening tool for assessing the appropriateness of medications in the elderly population.” Expert Review of Clinical Pharmacology (March 2012): 5(2) pp.187.
22. Canadian Institute for Health Information, Drug Claims by Seniors: An Analysis Focusing on Potentially Inappropriate Use of Medications, 2000-2006. Ottawa, ON: CIHI; 2007.
23. Bronskill S, et al. “The Relationship Between Variations in Antipsychotic Prescribing Across Nursing Homes and Short-Term Mortality: quality of care implications.” Medical Care (September 2009): 47(9) pp. 1000-1008.
24. Canadian Institute for Health Information. The Use of Selected Psychotropic Drugs Among Seniors on Public Drug Programs in Canada, 2001 to 2010. Ottawa, ON: CIHI; 2012.
25. Herrmann N, et al. “Diagnosis and Treatment of Dementia: 6. Management of Severe Alzheimer Disease.” Canadian Medical Association Journal (December 2, 2008): 179(12) pp. 1279-1287.
26. Guthrie B, et al. “The burden of psychotropic drug prescribing in people with dementia: a population database study.” Age & Ageing. (September 2010): 39(5) pp. 637-642.
27. Gill S, et al. “Antipsychotic Drug Use and Mortality in Older Adults with Dementia.” Annals of Internal Medicine (June 2007): 146(11) pp. 775-786.
69
Drug Use Among Seniors on Public Drug Programs in Canada, 2012: Revised October 2014
28. Wang P, et al. “Risk of Death in Elderly Users of Conventional vs. Atypical Antipsychotic Medications.” New England Journal of Medicine (December 2005): 353(22) pp. 2335–2341.
29. Schneider L, et al. “Risk of Death With Atypical Antipsychotic Drug Treatment for Dementia: Meta-analysis of Randomized Placebo-Controlled Trials.” Journal of the American Medical Association (October 19, 2005): 294(15) pp. 1934-1943.
30. Canadian Institute for Health Information. Depression Among Seniors in Residential Care. Ottawa, ON: CIHI; 2010.
31. Djernes JK. “Prevalence and Predictors of Depression in Populations of Elderly: A Review.” Acta Psychiatrica Scandinavica (2006): 113 pp. 372-387.
32. Canadian Healthcare Association. New Directions for Facility-Based Long Term Care. Ottawa, ON: CHA, 2009.
33. Hill K, et al. “Psychotropic Drug-Induced Falls in Older People.” Drugs & Aging (January 2012): 29(1) pp. 15-30.
34. Lindsey P. “Psychotropic Medication Use Among Older Adults: What All Nurses Need to Know.” Journal of Gerontological Nursing (September 2009): 35(9) pp. 28-38.
35. Gamble JM, et al. “Restrictive Drug Coverage Policies can Induce Substantial Drug Exposure Misclassification in Pharmacoepidemiologic Studies.” Clinical Therapeutics (June 2012): 34(6) pp. 1379-1386.
Production of this document is made possible by financial contributions from Health Canada and provincial and territorial governments. The views expressed herein do not necessarily represent the views of Health Canada or any provincial or territorial government.
All rights reserved.
The contents of this publication may be reproduced unaltered, in whole or in part and by any means, solely for non-commercial purposes, provided that the Canadian Institute for Health Information is properly and fully acknowledged as the copyright owner. Any reproduction or use of this publication or its contents for any commercial purpose requires the prior written authorization of the Canadian Institute for Health Information. Reproduction or use that suggests endorsement by, or affiliation with, the Canadian Institute for Health Information is prohibited.
For permission or information, please contact CIHI:
Canadian Institute for Health Information495 Richmond Road, Suite 600Ottawa, Ontario K2A 4H6
Phone: 613-241-7860Fax: [email protected]
ISBN 978-1-77109-318-7 (PDF)
© 2014 Canadian Institute for Health Information
How to cite this document:Canadian Institute for Health Information. Drug Use Among Seniors on Public Drug Programs in Canada, 2012: Revised October 2014. Ottawa, ON: CIHI; 2014.
Cette publication est aussi disponible en français sous le titre Utilisation des médicaments chez les personnes âgées adhérant à un régime public d’assurance-médicaments au Canada, 2012 : mis à jour en octobre 2014.ISBN 978-1-77109-319-4 (PDF)
www.cihi.caAt the heart of data8739-10148739-1014
Talk to UsCIHI Ottawa495 Richmond Road, Suite 600Ottawa, Ontario K2A 4H6Phone: 613-241-7860
CIHI Toronto4110 Yonge Street, Suite 300Toronto, Ontario M2P 2B7Phone: 416-481-2002
CIHI Victoria 880 Douglas Street, Suite 600 Victoria, British Columbia V8W 2B7 Phone: 250-220-4100
CIHI Montréal1010 Sherbrooke Street West, Suite 300Montréal, Quebec H3A 2R7Phone: 514-842-2226
CIHI St. John’s140 Water Street, Suite 701St. John’s, Newfoundland and Labrador A1C 6H6Phone: 709-576-7006