Drug-related deaths in Scotland in 2020, Report
22
Drug-related deaths in Scotland in 2020 Published on 30 July 2021 Statistics of drug-related deaths in 2020 and earlier years, broken down by age, sex, substances implicated in the death, underlying cause of death and NHS Board and Council areas.
Transcript of Drug-related deaths in Scotland in 2020, Report

Drug-related deaths in Scotland in 2020
Published on 30 July 2021
Statistics of drug-related deaths in 2020 and earlier years, broken down by age, sex, substances implicated in the death, underlying cause of death and NHS Board and Council areas.

Drug-related deaths continue to increase
In 2020 there were 1,339 drug-related deaths, a 5% increase on the previous year and the largest number ever recorded. Drug-related deaths have been increasing since 1996 but since 2013 the upward trend has been steeper.
Largest increase was in 35-54 year olds
Most of the recent increase in drug related death rates* has occurred in the 35-44 year old and 45-54 year old age groups.
Death rates vary geographically
Greater Glasgow & Clyde had the highest death rate* at 30.8 per 100,000 population, followed by Ayrshire & Arran and Tayside with rates of 27.2 and 25.7 per 100,000 population respectively.
Age-standardised rates per 100,000 population. Rates not shown for areas with fewer than 10 deaths.
*
Deaths per 100,000 people*
Source: Drug-related deaths in Scotland, 2020www.nrscotland.gov.uk
Drug-related deaths in Scotland, 2020 Summary
244
527
1,339
1996 2013 2020
Drug-related deaths, 1996 to 2020
Drug-related death rates* by age group, 2000 to 2020
Drug-related death rates* by NHS Board area, 2016 to 2020
The dashed line shows the 5-year moving average and the shaded area shows the likely range of variation around the 5-year moving average.
15-24 25-34 35-44 45-54 55-64
2000 2020 2000 2020 2000 2020 2000 2020 2000 20200
20
40
60
21.2
27.2
16.4
19.318.6
21.2
14.6
30.8
13.3
21.6
16.1
25.7
Highland
Grampian
Lothian
Borders
Fife
Dumfries & Galloway
Forth Valley
Scotland
Lanarkshire
Tayside
Ayrshire & Arran
Greater Glasgow & Clyde
3
© Crown Copyright 2021
Contents
Main Points .......................................................................................................................... 4
1. Introduction .......................................................................................................... 5
2. Drug-related deaths in Scotland .......................................................................... 5
3. Drug-related deaths by sex .................................................................................. 8
4. Drug-related deaths by age ............................................................................... 10
5. Drug-related deaths by deprivation .................................................................... 11
6. Drug-related deaths across areas in Scotland ................................................... 12
7. Drug-related deaths by substances implicated .................................................. 15
8. Drug-related deaths by cause of death .............................................................. 18
9. Comparisons with UK and European countries ................................................. 19
10. Links to related statistics .................................................................................... 21
11. Notes on statistical publications ......................................................................... 21
.
Further information is available here:
Additional analyses
Annexes – providing further background and methodological information.
Tables and Figures

4
© Crown Copyright 2021
Main Points
• In 2020, there were 1,339 drug-related deaths registered in Scotland. This was 5% morethan in 2019 and the largest number since records began in 1996. Deaths have increasedsubstantially over the last 20 years – there were 4.6 times as many deaths in 2020compared with 2000.
• In 2020, males were 2.7 times as likely to have a drug-related death than females, afteradjusting for age.
• The average age of drug-related deaths has increased from 32 to 43 over the last 20 years.
• In 2020, 63% of all drug-related deaths were of people aged between 35 and 54.
• In 2020, after adjusting for age, people in the most deprived areas were 18 times as likelyto have a drug-related death as those in the least deprived areas. That ratio has almostdoubled in 20 years, from around 10 times in the early 2000s.
• Greater Glasgow and Clyde had the highest age-standardised drug-related death rate of allhealth board areas (30.8 per 100,000 population for the 5-year period 2016-2020), followedby Ayrshire and Arran (27.2) and Tayside (25.7).
• Greater Glasgow and Clyde had the largest increase in its drug-related death rate, from 8.9per 100,000 population in the period 2000-2004 to 30.8 per 100,000 population in 2016-2020. Tayside and Ayrshire and Arran had the next biggest increases.
• Dundee City had the highest age-standardised drug-related death rate of all local authorityareas (43.1 per 100,000 population for the 5-year period 2016-2020), followed by GlasgowCity (39.8) and Inverclyde (36.7).
• Dundee City had the largest increase in its drug-related death rate, from 5.9 per 100,000population in the period 2000-2004 to 43.1 per 100,000 population in 2016-2020.Inverclyde and Glasgow City had the next biggest increases.
• In 93% of all drug-related deaths, more than one drug was found to be present in the body.
• Of all drug-related deaths in 2020, the following substances were implicated:o opiates/opioids (such as heroin/morphine and methadone) - 1,192 deaths (89% of
the total)o benzodiazepines (such as diazepam and etizolam) - 974 (73%)o gabapentin and/or pregabalin - 502 (37%)o cocaine - 459 (34%)
• In recent years there have been large increases in the numbers of deaths where thefollowing substances were implicated:
o ‘street’ benzodiazepines (such as etizolam), from 58 in 2015 to 879 in 2020o methadone, from 251 in 2015 to 708 in 2020o heroin/morphine, from 345 in 2015 to 605 in 2020o gabapentin and/or pregabalin, from 131 in 2015 to 502 in 2020o cocaine, from 93 in 2015 to 459 in 2020
• Scotland’s drug-death rate was over 3½ times that for the UK as a whole, and higher thanthat of any European country.

5
© Crown Copyright 2021
1. Introduction
This publication provides statistics of drug-related deaths registered in Scotland in 2020. This includes trends since 1996, as well as breakdowns by age, sex, substances and other factors. These statistics are based on the definition of ‘drug-related deaths’ set out in Annex A, which was introduced in 2001 for the ‘baseline’ figures for the UK Drugs Strategy.
These official statistics are used in the development of policy by the Scottish Government, and by a number of other interested parties such as the Drug Deaths Taskforce, NHS Boards and local Alcohol and Drug Partnerships. Annex B provides more information on other definitions of drug-death statistics that are used, and the diagram on page 7 highlights the main differences.
Drug-related deaths are identified using data from death registration records. This is supplemented with information from the Crown Office and Procurator Fiscal Service (COPFS) and forensic pathologists. Annex C includes more detail on the sources of data used to produce this publication.
2. Drug-related deaths in Scotland
In 2020, there were 1,339 drug-related deaths registered in Scotland, 5% (59 deaths) more than in 2019. This was the largest number ever recorded since the series began in 1996. The number of deaths has increased substantially over the last 20 years – there were 4.6 times as many deaths in 2020 compared with 2000.
The number of drug-related deaths rose in most years since 1996 and the upward trend was particularly steep between 2013 and 2018.
Over the period from 1996 to 2008 drug-related deaths increased, with an average annual change of +8% per year. From 2013 to 2018 the average change was +18% per year. Over the last two years,deaths have increased by 8% and 5%respectively.
The age-standardised death rate in 2020 was 25.2 per 100,000 population.
Revised total for 2019
The total number of drug-related deaths registered in 2019 has been revised to 1,280: 16 (1%) higher than the 1,264 reported previously. This is mainly due to NRS not receiving information needed to classify 15 deaths as drug-related until after the previous edition was published. More on this is given in section A7 of Annex A

6
© Crown Copyright 2021
244
527
1,339
0
500
1,000
1,500
1996 1998 2000 2002 2004 2006 2008 2010 2012 2014 2016 2018 2020
Dru
g-R
elat
ed D
eath
s
Year
Figure 1: Number of drug-related deaths in Scotland, 1996 to 2020
Likely Range of Values (due to randomvariation) around 5-Year Average5-Year Average
Drug Related Deaths Registered inYear

7
© Crown Copyright 2021
Drug deaths definitions
In 2020 there were:
1,461 drug poisoning deaths – a wider definition than the headline measure used in Scotland, it covers all deaths with an underlying cause of drug poisoning or drug abuse.
1,339 drug-related deaths (sometimes referred to as drug-misuse deaths) – the headline measure used in Scotland, it covers drug poisoning deaths as defined above, but only where any of the substances involved are controlled in the UK. This means that deaths from only e.g. aspirin or paracetamol are excuded. There were 122 drug poisoning deaths which were excluded from the drug-related deaths count.
1,161 drug-induced deaths –the definition used for comparing European countries’ drug death rates. It uses broadly the same (although not identical) causes as the definitions above. However, the list of substances included differ slightly (as the drugs which are controlled in each country are different). The other key difference is that only people aged 15-64 are included whereas the other two definitions cover all age groups.
.
The diagram below illustrates how these three different definitions overlap, along with the relevant numbers for 2020. For more information on each of these definitions please see Annex B

8
© Crown Copyright 2021
3. Drug-related deaths by sex
Males accounted for 73% of the drug-related deaths in 2020. This is similar to recent years, and a continuation of the pattern that there are considerably more drug-related deaths of males than females.
0
100
200
300
400
500
600
700
800
900
1000
1996 1998 2000 2002 2004 2006 2008 2010 2012 2014 2016 2018 2020
Dru
g-R
elat
ed D
eath
s
Year
Figure 2: Number of drug-related deaths in Scotland: by sex
Males Females
9
© Crown Copyright 2021
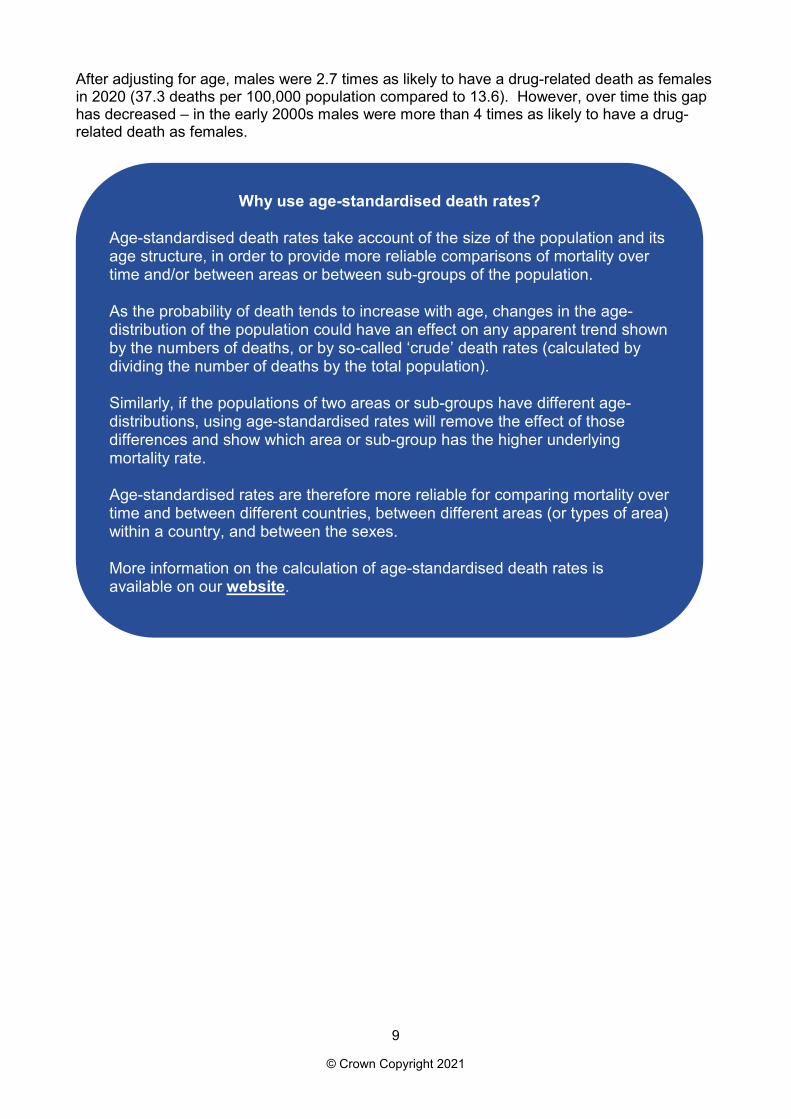
After adjusting for age, males were 2.7 times as likely to have a drug-related death as females in 2020 (37.3 deaths per 100,000 population compared to 13.6). However, over time this gap has decreased – in the early 2000s males were more than 4 times as likely to have a drug-related death as females.
Why use age-standardised death rates?
Age-standardised death rates take account of the size of the population and its age structure, in order to provide more reliable comparisons of mortality over time and/or between areas or between sub-groups of the population.
website.
As the probability of death tends to increase with age, changes in the age-distribution of the population could have an effect on any apparent trend shown by the numbers of deaths, or by so-called ‘crude’ death rates (calculated by dividing the number of deaths by the total population).
Similarly, if the populations of two areas or sub-groups have different age-distributions, using age-standardised rates will remove the effect of those differences and show which area or sub-group has the higher underlying mortality rate.
Age-standardised rates are therefore more reliable for comparing mortality over time and between different countries, between different areas (or types of area) within a country, and between the sexes.
More information on the calculation of age-standardised death rates is available on our

10
© Crown Copyright 2021
4. Drug-related deaths by age
The average age of drug-related deaths has increased over the last 20 years. In 2000 the average age of a drug-related death in Scotland was 32, and this increased to 43 in 2020.
32
43
0
10
20
30
40
50
60
2000 2002 2004 2006 2008 2010 2012 2014 2016 2018 2020
Age
Year
Figure 3A: Drug-related deaths in Scotland: average age
Average age
In 2020, 63% of all drug-related deaths were of people aged 35-54 year olds.
Prior to 2003 most drug-related deaths were of those aged under 35. Over the period from 2003 to 2014 there were more between 25 and 44 years old than aged under 35. However, most of the increase in drug-related deaths after 2014 has been in the 35-54 age-group, which has had the largest numbers of such deaths in recent years (even with a fall in 2020).
11
© Crown Copyright 2021
0
50
100
150
200
250
300
350
400
450
500
2000 2002 2004 2006 2008 2010 2012 2014 2016 2018 2020
Dru
g-R
elat
ed D
eath
s
Year
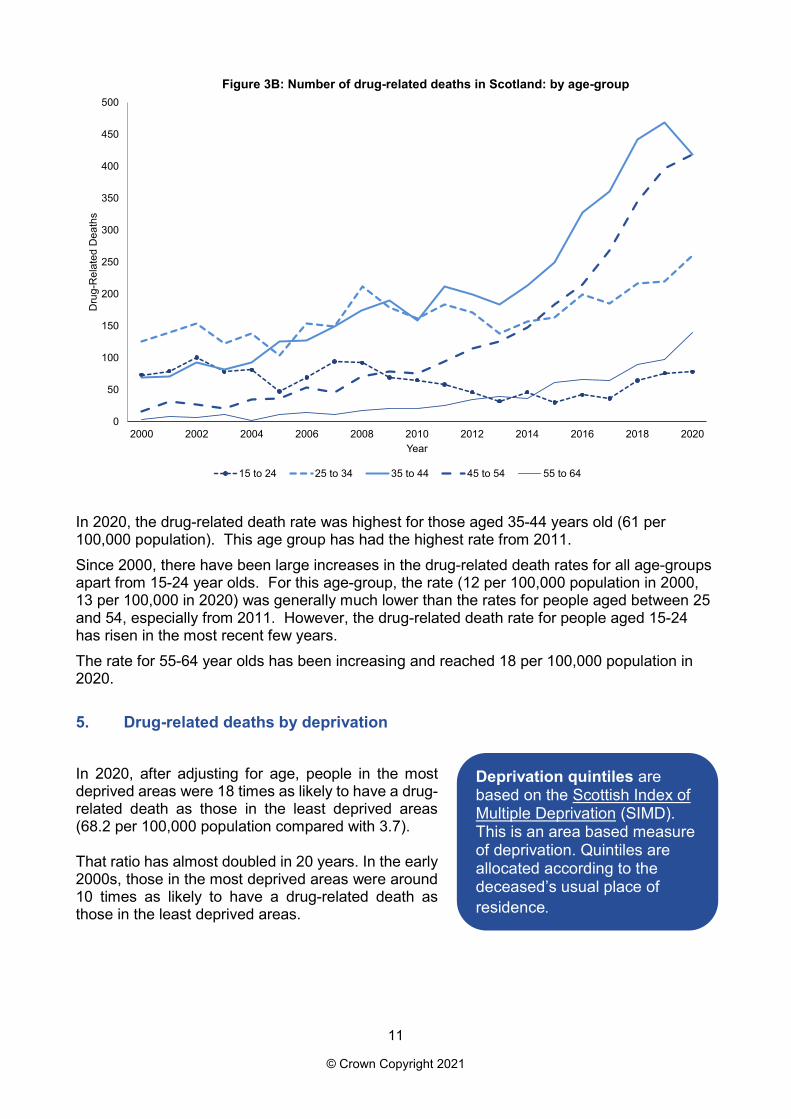
Figure 3B: Number of drug-related deaths in Scotland: by age-group
15 to 24 25 to 34 35 to 44 45 to 54 55 to 64
In 2020, the drug-related death rate was highest for those aged 35-44 years old (61 per 100,000 population). This age group has had the highest rate from 2011. Since 2000, there have been large increases in the drug-related death rates for all age-groups apart from 15-24 year olds. For this age-group, the rate (12 per 100,000 population in 2000, 13 per 100,000 in 2020) was generally much lower than the rates for people aged between 25 and 54, especially from 2011. However, the drug-related death rate for people aged 15-24 has risen in the most recent few years. The rate for 55-64 year olds has been increasing and reached 18 per 100,000 population in 2020.
5. Drug-related deaths by deprivation
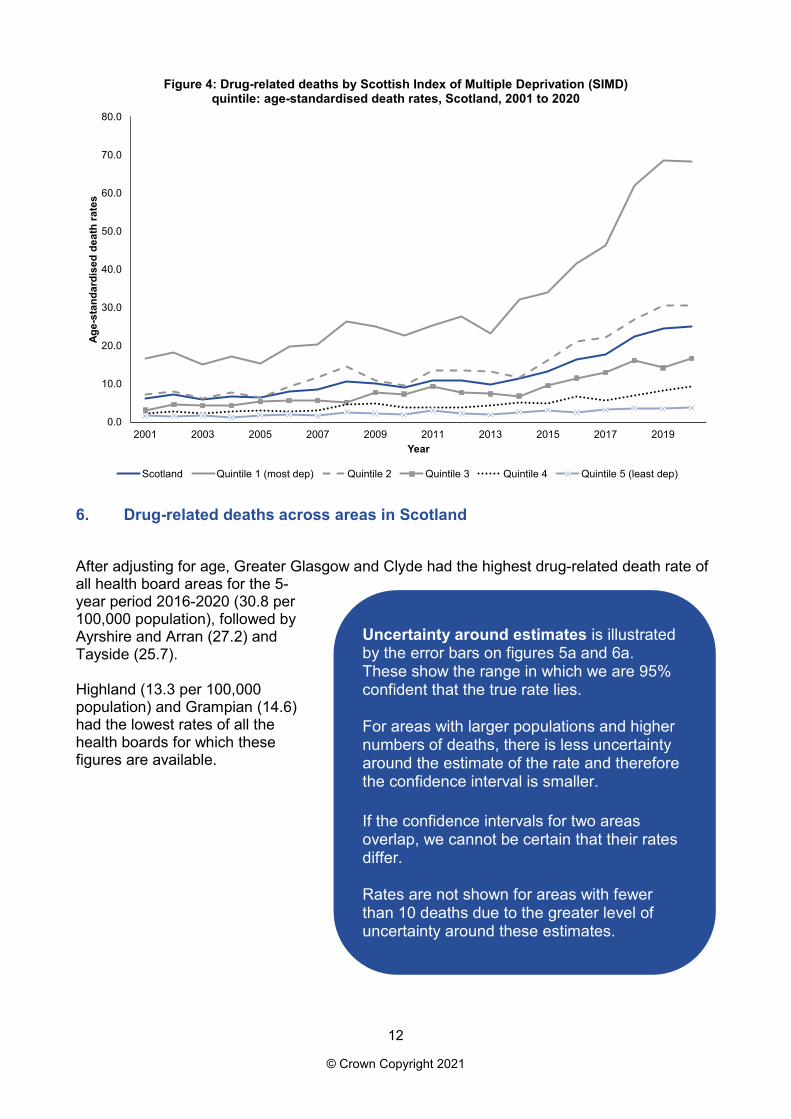
In 2020, after adjusting for age, people in the most deprived areas were 18 times as likely to have a drug-related death as those in the least deprived areas (68.2 per 100,000 population compared with 3.7).
That ratio has almost doubled in 20 years. In the early 2000s, those in the most deprived areas were around 10 times as likely to have a drug-related death as those in the least deprived areas.
Deprivation quintiles are based on the Scottish Index of Multiple Deprivation (SIMD). This is an area based measure of deprivation. Quintiles are allocated according to the deceased’s usual place of residence.
12
© Crown Copyright 2021
0.0
10.0
20.0
30.0
40.0
50.0
60.0
70.0
80.0
2001 2003 2005 2007 2009 2011 2013 2015 2017 2019
Age-
stan
dard
ised
dea
th ra
tes
Year
Figure 4: Drug-related deaths by Scottish Index of Multiple Deprivation (SIMD) quintile: age-standardised death rates, Scotland, 2001 to 2020
Scotland Quintile 1 (most dep) Quintile 2 Quintile 3 Quintile 4 Quintile 5 (least dep)
6. Drug-related deaths across areas in Scotland
After adjusting for age, Greater Glasgow and Clyde had the highest drug-related death rate of all health board areas for the 5-year period 2016-2020 (30.8 per 100,000 population), followed by Ayrshire and Arran (27.2) and Tayside (25.7).
Highland (13.3 per 100,000 population) and Grampian (14.6) had the lowest rates of all the health boards for which these figures are available.
Uncertainty around estimates is illustrated by the error bars on figures 5a and 6a. These show the range in which we are 95% confident that the true rate lies.
For areas with larger populations and higher numbers of deaths, there is less uncertainty around the estimate of the rate and therefore the confidence interval is smaller.
If the confidence intervals for two areas overlap, we cannot be certain that their rates differ.
Rates are not shown for areas with fewer than 10 deaths due to the greater level of uncertainty around these estimates.

13
© Crown Copyright 2021
0
5
10
15
20
25
30
35
GreaterGlasgow &
Clyde
Ayrshire &Arran
Tayside Lanarkshire Scotland Forth Valley Dumfries &Galloway
Fife Borders Lothian Grampian Highland
age-
stan
dard
ised
dea
th ra
te (p
er 1
00,0
00 p
opul
atio
n)
NHS Board Area
Figure 5A: Drug-related deaths for selected NHS Board areas- age-standardised death rates 2016-2020
Greater Glasgow and Clyde has seen the greatest increase in drug-related death rates over time, rising from a rate of 8.9 per 100,000 population in the period 2000-2004 to 30.8 per 100,000 population in 2016-2020. Tayside (rate up from 4.5 to 25.7) and Ayrshire and Arran (7.1 to 27.2) had the next biggest increases.
Grampian
Highland
Lothian
Dumfries & Galloway
Scotland
Fife
Forth Valley
Lanarkshire
Ayrshire & Arran
Tayside
Greater Glasgow and Clyde
0 5 10 15 20 25 30 35
NH
S B
oard
Are
a
Age-standardised death rate (per 100,000 population)
Figure 5B: Drug-related deaths for selected NHS board areas - age-standardised death rates, change between 2000-2004 and 2016-2020
14
© Crown Copyright 2021
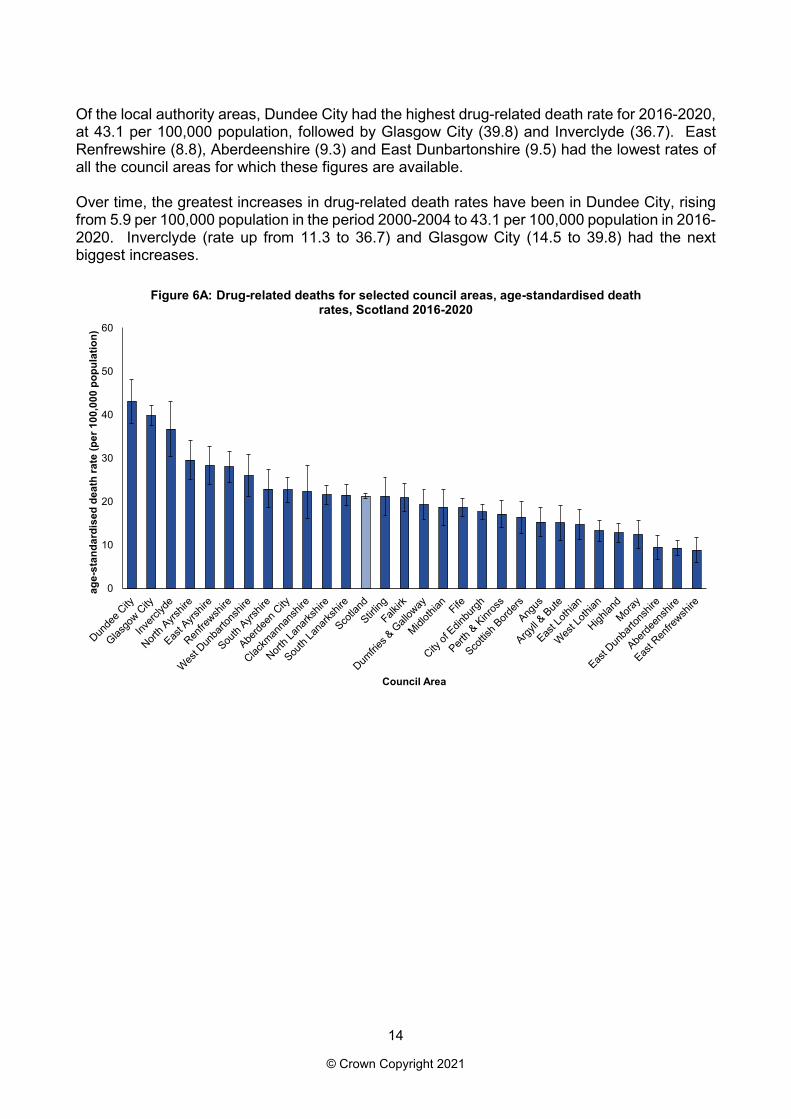
Of the local authority areas, Dundee City had the highest drug-related death rate for 2016-2020, at 43.1 per 100,000 population, followed by Glasgow City (39.8) and Inverclyde (36.7). East Renfrewshire (8.8), Aberdeenshire (9.3) and East Dunbartonshire (9.5) had the lowest rates of all the council areas for which these figures are available.
Over time, the greatest increases in drug-related death rates have been in Dundee City, rising from 5.9 per 100,000 population in the period 2000-2004 to 43.1 per 100,000 population in 2016-2020. Inverclyde (rate up from 11.3 to 36.7) and Glasgow City (14.5 to 39.8) had the next biggest increases.
0
10
20
30
40
50
60
age-
stan
dard
ised
dea
th ra
te (p
er 1
00,0
00 p
opul
atio
n)
Council Area
Figure 6A: Drug-related deaths for selected council areas, age-standardised death rates, Scotland 2016-2020

15
© Crown Copyright 2021
7. Drug-related deaths by substances implicated
In 93% of all drug-related deaths in 2020, more than one drug was found to be present in the body.
Of all drug-related deaths in 2020, the following substances were implicated1: • opiates/opioids (such as heroin/morphine and methadone) – 1,192 deaths (89% of the
total)• benzodiazepines (such as diazepam and etizolam) – 974 (73%)• gabapentin and/or pregabalin – 502 (37%)• cocaine – 459 (34%)
1 The percentages add up to more than 100 because more than one drug was implicated in most deaths
East RenfrewshireAberdeenshireEast Dunbartonshire
West LothianMorayHighland
East LothianAngusArgyll & Bute
Aberdeen CityCity of Edinburgh
Dumfries & GallowayPerth & Kinross
MidlothianScotland
FifeNorth Lanarkshire
StirlingClackmannanshire
South AyrshireFalkirk
South LanarkshireWest Dunbartonshire
North AyrshireRenfrewshireEast Ayrshire
Glasgow CityInverclyde
Dundee City
0.0 5.0 10.0 15.0 20.0 25.0 30.0 35.0 40.0 45.0 50.0
Cou
ncil
area
s
Age-standardised death rate (per 100,000 population)
Figure 6B: Drug-related deaths for selected council areas, age-standardised death rates, change between 2000-2004 and 2016-2020
Drug-related death rates of problem drug users
The Additional Analyses provide information about the drug-related death rates of problem drug users, for Scotland as a whole and for health board and local authority areas.

16
© Crown Copyright 2021
The proportion of deaths in which opiates/opioids were implicated has remained similar over the last 25 years, with numbers rising broadly in line with the total number of drug-related deaths. In recent years, there have been large increases in the numbers of deaths in which heroin/morphine were implicated (from 345 in 2015 to 651 in 2019, although falling to 605 in 2020) and in which methadone was implicated (from 251 in 2015 to 708 in 2020). .
Drug-related deaths where benzodiazepines were implicated have risen sharply in the last five years, from fewer than 200 deaths per year prior to 2016 to nearly 1,000 in 2020. This increase is largely due to deaths where ‘street’ benzodiazepines (such as etizolam) were implicated, which rose from 58 in 2015 to 879 in 2020. ‘Street’ benzodiazepines were implicated in 66% of all drug-related deaths in 2020.
0
200
400
600
800
1,000
1,200
1,400
1,600
2008 2009 2010 2011 2012 2013 2014 2015 2016 2017 2018 2019 2020
Dru
g-R
elat
ed D
eath
s
Year
Figure 7A: Number of drug-related deaths in Scotland: in total, and for which certain opiates or opioids were implicated in the cause of death
All drug-related deaths Any opiate or opioid Heroin / morphineMethadone Codeine or a compound Dihydrocodeine or a compound
The basis of statistics about individual drugs
In NRS’s statistics, the normal basis for the figures for individual drugs is ‘drugs which were implicated in, or which potentially contributed to, the cause of death’. More information about this is given in paragraphs C2 to C6 of Annex C

17
© Crown Copyright 2021
The number of drug-related deaths in which gabapentin and/or pregabalin were implicated has risen rapidly in recent years, from 131 in 2015 to 502 in 2020 (37% of all drug-related deaths). There has also been a large increase in cocaine deaths, from 93 in 2015 to 459 in 2020 (34% of all drug-related deaths).
0
200
400
600
800
1,000
1,200
1,400
1,600
2008 2009 2010 2011 2012 2013 2014 2015 2016 2017 2018 2019 2020
Dru
g-R
elat
ed D
eath
s
Year
Figure 7B: Number of drug-related deaths in Scotland: in total, and for which certain benzodiazepines were implicated in the cause of death
All drug-related deaths Any benzodiazepine "Prescribable" benzodiazepines
Diazepam "Street" benzodiazepines Etizolam

18
© Crown Copyright 2021
.
In 2020, there were 872 deaths for which so-called ‘New Psychoactive Substances’ (NPSs) were implicated in the cause of death. In almost all cases, the only NPSs present were benzodiazepines (usually etizolam, but sometimes – for example - diclazepam or phenazepam). The definition of NPSs and further figures are in Annex E
8. Drug-related deaths by cause of death
In 2020, the vast majority (93%) of drug-related deaths were classified as accidental poisonings. This proportion has increased in recent years. Four per cent of deaths were believed to be due to intentional self-poisoning, and a further two per cent were poisonings of undetermined intent. In one per cent of drug-related deaths, the underlying cause of the death was believed to be long-term drug abuse, rather than poisoning/overdose.
0
200
400
600
800
1,000
1,200
1,400
1,600
2008 2009 2010 2011 2012 2013 2014 2015 2016 2017 2018 2019 2020
Dru
g-R
elat
ed D
eath
s
Year
Figure 7C: Number of drug-related deaths in Scotland: in total, and for which gabapentin/ pregabalin, cocaine, ecstasy-type drugs, amphetamines and alcohol
were implicated
All drug-related deaths Gabapentin and/or pregabalin CocaineEcstasy-type drugs Amphetamines Alcohol

19
© Crown Copyright 2021
9. Comparisons with UK and European countries
Scotland’s drug-death rate was over 3½ times the rate for the UK as a whole, and also higher than those reported for the other European countries for which figures are readily available.
In 2019, there were 1,280 drug-related deaths registered in Scotland, representing 234 drug-related deaths per million population. There were 4,328 such deaths in the UK, equating to 65 per million population. So the Scottish rate was 3.6 times that of the UK as a whole.
The next highest rates were in the North East of England and in Northern Ireland, both with 87 deaths per million population.
0
200
400
600
800
1,000
1,200
1,400
1,600
2011 2012 2013 2014 2015 2016 2017 2018 2019 2020
Dru
g-re
late
d D
eath
s
Year
Figure 8: Number of drug-related deaths, by underlying cause of death, Scotland, 2011 to 2020
Accidental poisoning Drug abuse Intentional self-poisoning Undetermined intent

20
© Crown Copyright 2021
On the basis used for European comparisons (described in the box below), Scotland had a drug-death rate of 318 per million population aged 15-64 in 2019. This was much higher than the rates reported for any other country, the next largest being 77 per million for both Sweden and Norway.
234
87 87
67 65 6352 49 48 46
38 38 34 32
0
50
100
150
200
250
crud
e ra
te p
er m
illio
n po
pula
tion
UK Countries and Regions
Figure 9 - Drug-related deaths, crude rates per million population, UK countries and regions, 2019
The basis of comparisons with other countries
The comparison with European countries uses the number of ‘drug-induced’ deaths aged 15 to 64, relative to the population of that age. This is defined in the ‘European Drug Report 2021’ published by the European Monitoring Centre for Drugs and Drug Addiction (EMCDDA). It notes that there are issues of coding, coverage and under-reporting in some countries. In the latest report, most countries’ figures are for 2019.
The comparison with the UK as a whole uses the overall drug-related death rate per head of population (also referred to as ‘drug misuse deaths’). As it covers all ages, the rates are lower than the EMCDDA’s rates, which covers only people aged 15 to 64.
More information about these comparisons is available in Annex G and in the diagram on page 7.

10. Links to related statistics
• Deaths related to Drug Poisoning in England and Wales is published annually by theOffice for National Statistics
• Drug-Related and Drug Misuse Deaths, Northern Ireland is published annually by theNorthern Ireland Statistics and Research Agency
• Deaths from various causes are published annually by National Records of Scotland(NRS), and include statistics of alcohol-specific deaths, homeless deaths, probablesuicides, and deaths from various other causes
• Vital Events Reference Tables are published by NRS and contain annual statistics ondeaths.
• Births, Deaths and Other Vital Events, Quarterly Figures are published by NRS andcontain statistics on deaths for the most recent quarter (with a limited breakdown bycause of death).
11. Notes on statistical publications
National Statistics
The United Kingdom Statistics Authority (UKSA) has designated these statistics as National Statistics, in line with the Statistics and Registration Service Act 2007 and signifying compliance with the Code of Practice for Official Statistics (available on the UKSA website).
National Statistics status means that official statistics meet the highest standards of trustworthiness, quality and public value.
All official statistics should comply with all aspects of the Code of Practice for Official Statistics. They are awarded National Statistics status following an assessment by the Authority’s regulatory arm. The Authority considers whether the statistics meet the highest standards of Code compliance, including the value they add to public decisions and debate.
It is National Records of Scotland’s responsibility to maintain compliance with the standards expected of National Statistics. If we become concerned about whether these statistics are still meeting the appropriate standards, we will discuss any concerns with the Authority promptly. National Statistics status can be removed at any point when the highest standards are not maintained, and reinstated when standards are restored.
Information on background and source data
Further details on data source(s), timeframe of data and timeliness, continuity of data, accuracy, etc can be found in the About this Publication document that is published alongside this publication on the NRS website.
National Records of Scotland
We, the National Records of Scotland, are a non-ministerial department of the devolved Scottish Administration. Our aim is to provide relevant and reliable information, analysis and
21
© Crown Copyright 2021

advice that meets the needs of government, business and the people of Scotland. We do this as follows:
Preserving the past – We look after Scotland’s national archives so that they are available for current and future generations, and we make available important information for family history.
Recording the present – At our network of local offices, we register births, marriages, civil partnerships, deaths, divorces and adoptions in Scotland.
Informing the future – We are responsible for the Census of Population in Scotland which we use, with other sources of information, to produce statistics on the population and households. You can get other detailed statistics that we have produced from the Statistics section of our website. Scottish Census statistics are available on the Scotland’s Census website.
We also provide information about future publications on our website. If you would like us to tell you about future statistical publications, you can register your interest on the Scottish Government ScotStat website.
You can also follow us on twitter @NatRecordsScot
Enquiries and suggestions
Please get in touch if you need any further information, or have any suggestions for improvement.
For media enquiries, please contact [email protected]
For all other enquiries, please contact [email protected]
Lead Statistician: Frank Dixon
© Crown Copyright You may use or re-use this information (not including logos) free of charge in any format or medium, under the terms of the Open Government Licence. Further information is available within the Copyright & Disclaimer section of the National Records of Scotland website.
22
© Crown Copyright 2021