DRUG OFFENDERS COMMITTED TO STATE PRISON,
38
-----------------------.--------- ,) DRUG OFFENDERS COMMITTED TO STATE PRISON, U.S. Department of Justice National Institute of Justice 142812 This document has been reproduced exactly as received from the or organization originating it. Points of view or opinions stated In this are those of the authors and do not necessarily represent the official position or policies of the National Institute of Justice. Permission to reproduce this copyrighted material has been granted bL New State Department of Correctional Services to the National Criminal Justice Reference Service (NCJRS). Further outside of the NCJRS system requires permission of the copYright owner. ST A TE OF NEW YORK DEPARTMENT OF CORRECTIONAL SERVICES SION OF PROGRAM PLANNING, RESEARCH AND EV ALUA TION I ' THE STATE OFFICE BUILDING CAMPUS ALBANY, NEW YORK 12226 1991 If you have issues viewing or accessing this file contact us at NCJRS.gov.
Transcript of DRUG OFFENDERS COMMITTED TO STATE PRISON,
~---- -----------------------.---------
,)
DRUG OFFENDERS COMMITTED TO STATE PRISON,
U.S. Department of Justice National Institute of Justice
142812
This document has been reproduced exactly as received from the p~rson or organization originating it. Points of view or opinions stated In this doc~ment are those of the authors and do not necessarily represent the official position or policies of the National Institute of Justice.
Permission to reproduce this copyrighted material has been granted bL
New ~ork State Department of Correctional Services
to the National Criminal Justice Reference Service (NCJRS).
Further repr~ductlon outside of the NCJRS system requires permission of the copYright owner.
ST A TE OF NEW YORK DEPARTMENT OF CORRECTIONAL SERVICES
SION OF PROGRAM PLANNING, RESEARCH AND EV ALUA TION I'
THE STATE OFFICE BUILDING CAMPUS ALBANY, NEW YORK 12226
1991
If you have issues viewing or accessing this file contact us at NCJRS.gov.
,-~---~-' -~~~-
CHESTER H. CLARK Assistant Commissioner
G. RONALD COURINGTON Director of MIS/Research
PAUL H. KOROTKIN Assistant Director of MIS/Research
HENRY C. DONNELLY Director, Program Planning
Research and Evaluation
Prepared by: Elaine S. Humphrey Program Research Specialist 11 Division 0/ Program Planning Research and Evaluatioll
)1 {(
* THOMAS A. COUGHLIN III
COMMISSIONER
STATE OF NEW YORK
DEPARTMENT OF CORRECTIONAl.. SERVICES
THE STATE OFFICE BUILDING CAMPUS
ALBANY, N.Y. 12226 CHESTER H. CLARK
ASSISTANT COMMISSIONER
DRUG OFFENDERS COMMITTED TO STATE PRISON
This report provides a legal profile of drug offenders committed to the New York state Department of Correctional services. The report examines drug offenders admi tted to the Department as new court commitments from January 1, 1987 through December 31, 1990, those undercustody on December 31, 1990 and offenders releas'ed to parole from 1987 through 1990.
DIVISION OF PROGRAM PLANNING, RESEARCH AND EVALUATION
1991
Colltents Drug Offenders Committed to State Prison
TABLE OF CONTENTS
Table of Contents ................................................................ i
Sunzmary . . . . . . . . . . . . . . . . . . . . . . . . . . . . . . . . . . . . . . . .. . . . . . . . . . . . . . . . . . . . . . . . . . . .. ii-iii
Introduction . ................. " .................................................. I
1. Drug Offenders: New Court Commitments 1987-1990 .............. '" .. 2-15
a. Felony Offender Status . .......................................... 2-4 b. Commitments by Year . ........................................... 5-6 c. Sale or Possession of Controlled Substance . .......................... 7-9' d. Type of Drug Involved in Commitment ............................ 10-13 e. Mininzunl Sentence . ............................................ 14-15
2. Drug Offenders in the Undercustody Population .................... ". 16-22
a. Felon}', Offender Status . ........................................ 16-18 b. Sale or Possession of COlltrolled Substance . ........................... 19 c. Type of Drug Involved in Commitment ............................ 20-22
3. Drug Offenders:First Releases to Parole 1987-1990 ................... 23-27
a. 1990 First Releases to Parole .................................... 23-24 b. First Releases to Parole by Year. . . . . . . . . . . . . . . . . . . . . . . . . . . . . . . . .. 25-26 c. Time Served Distribution for 1990 First Releases ...................... 27
Conclusion 28-29
Appendix A .............•..•.......•...•............••.....•.......•.•...... 30-32
March 1991 Page i
Summary Drug Offenders Committed to State Prisoll
DRUG OFFENDER COMMITMENTS TO STATE PRISON
SUMMARY
1. In the early 1980s, drug offenders accounted for roughly 10% of all new court commitments to the New York State Department of Correctional Services (DOCS). By 1990, 46.7% of all new court commitments were admitted for drug offenses (see Figure 1, p.1).
2. From 1987 to 1990, the years covered by this report, the number of individuals committed for drug offenses more than doubled, from 5,106 drug commitments in 1987 to 10,784 in 1990 (see Table 1.2, p.5).
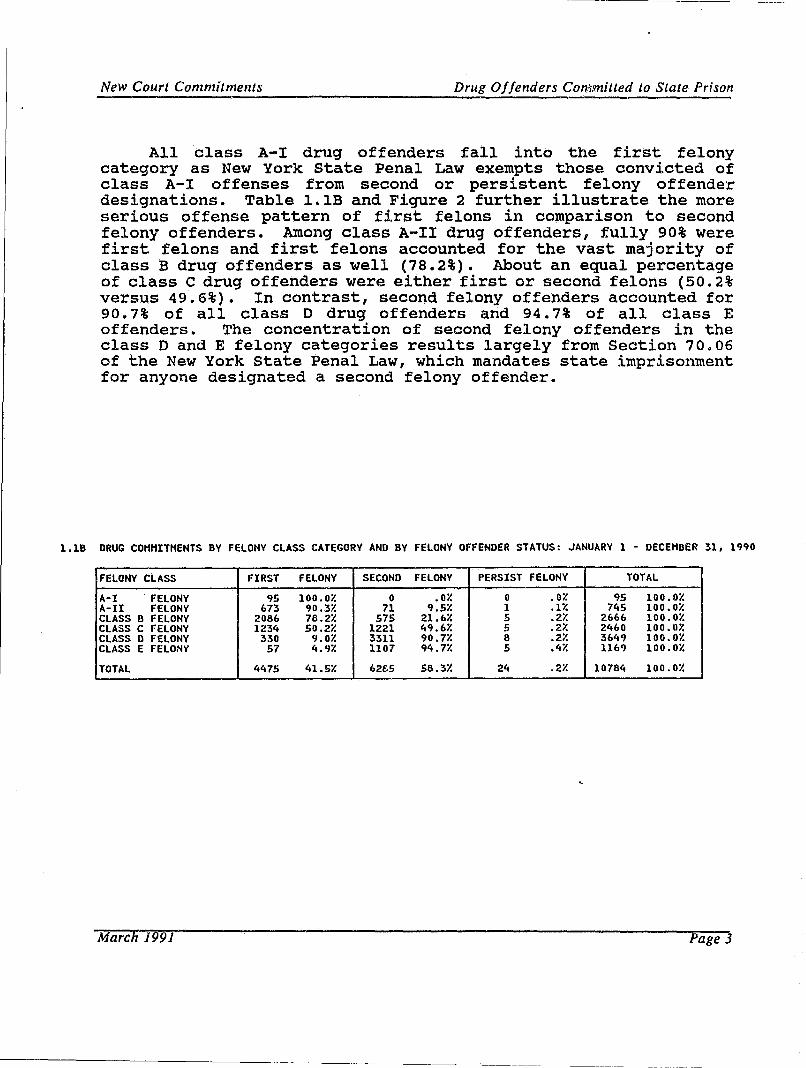
3. Of the 10,784 offenders committed for drug offenses in 1990, 6,285 (58.3%) were second felony offenders, 4,475 (41.5%) were first felony offenders, and 24 (.2%) were persistent felons (see Table 1.lB, p.3).
4. In 1990, first felony offenders accounted for 90.3% of class A-II drug commitments and 78.2% of class B drug commitments. In comparison, second felony offenders dominated admissions for the lowest level of drug felonies, class D (90.7%) and E (94.7%) offenses (see Table 1.lB, p.3).
5. Overall, 70.4% of all offenders committed for drug offenses in 1990 were admitted for the sale of a controlled substance, while 29.6% were admitted for the possession of a controlled substance (see Table 1.3A, p. 8) •
6. Among drug offenders committed in 1990, 41.1% stated their offense resulted from the sale or possession of cocaine and an almost equal proportion (40.8%), reported crack. About another 17% said their drug offense inv~lved some type of opiate (see Table 1.5B,· p.11).
7. Drug commitments which involved cocaine decreased from 50.0% in 198a to 41.1% in 1990, conversely, commitments for crack offenses rose from 33.1% in 1988 to 40.8% in 1990 (see Table 1.6, p.13).
March 1991 Page ii
Summary Drug Offenders Committed to State Prison
8 • The average minimum sentence for drug offenders decreased from a high of 31.7 months in 1987 to a low of 29.4 months in 1989 (in 1990, the average minimum sentence was 29.5 months) (see Table 1.7, p.14).
9. On December 31, 1990, there were 18,425 drug offenders undercustody for drug offenses. Of this number, 11,527 (62.6%) were second felony offenders and 6,839 (37.1%) were first felony offenders (see Table 2.15, p.17).
10. Average total time served for drug offenders first released to parole supervision in 1990, was 22.2 months. Among first felony offenders, average total time served WG'~S 19.6 months and for second felony offenders , it was 25.4 months (see Table 3.1, p.24).
11. In 1987, drug offenders before being paroled. paroled in 1990 served Table 3.2, p.25).
served, on average, 25.5 months In comparison, drug offenders an average of 22.2 months (see
12. Approximately 90% of drug offenders in 1990 served less than 36 months before first release to parole (see Table 3.3, p.27).
March 1991 Page iii
----~---~~~-----------------~~~-
Introductioll Drug Ojjenders Committed to Slate Prison
INTRODUCTION
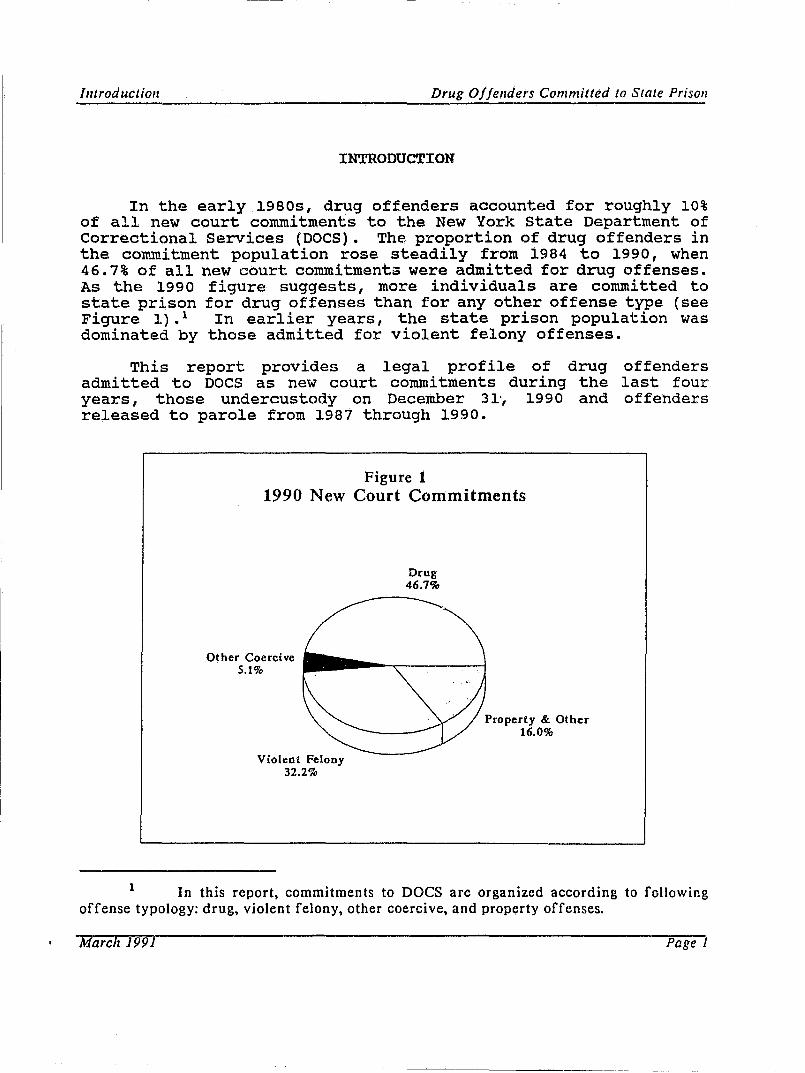
In the early 1980s, drug offenders accounted for roughly 10% of all new court commitments to the New York state Department of Correctional Services (DOCS). The proportion of drug offenders in the commitment population rose steadily from 1984 to 1990, when 46.7% of all new court commitments were admitted for drug offenses. As the 1990 figure suggests, more individuals are committed to state prison for drug offenses than for any other offense type (see Figure 1).1 In earlier years, the state prison population was dominated by those admitted for violent felony offenses.
This report provides a legal profile of drug offenders admitted to DOCS as new court commitments during the last four years, those undercustody on December 31', 1990 and offenders released to parole from 1987 through 1990.
Figure 1 1990 New Court Commitments
Other Coercive 5.1%
Violent Felony 32.2%
Drug 46.7%
Property & Other 16.0%
1 In this report, commitments to DOCS are organized according to following offense typology: drug, violent felony, other coercive, and property offenses.
March 1991 Page J
New Court Commitments Drug Offenders Committed to State Prison
SECTION ONE - NEW COURT COMMITMENTS 1987 -1990
commitments by Felony Offender Status
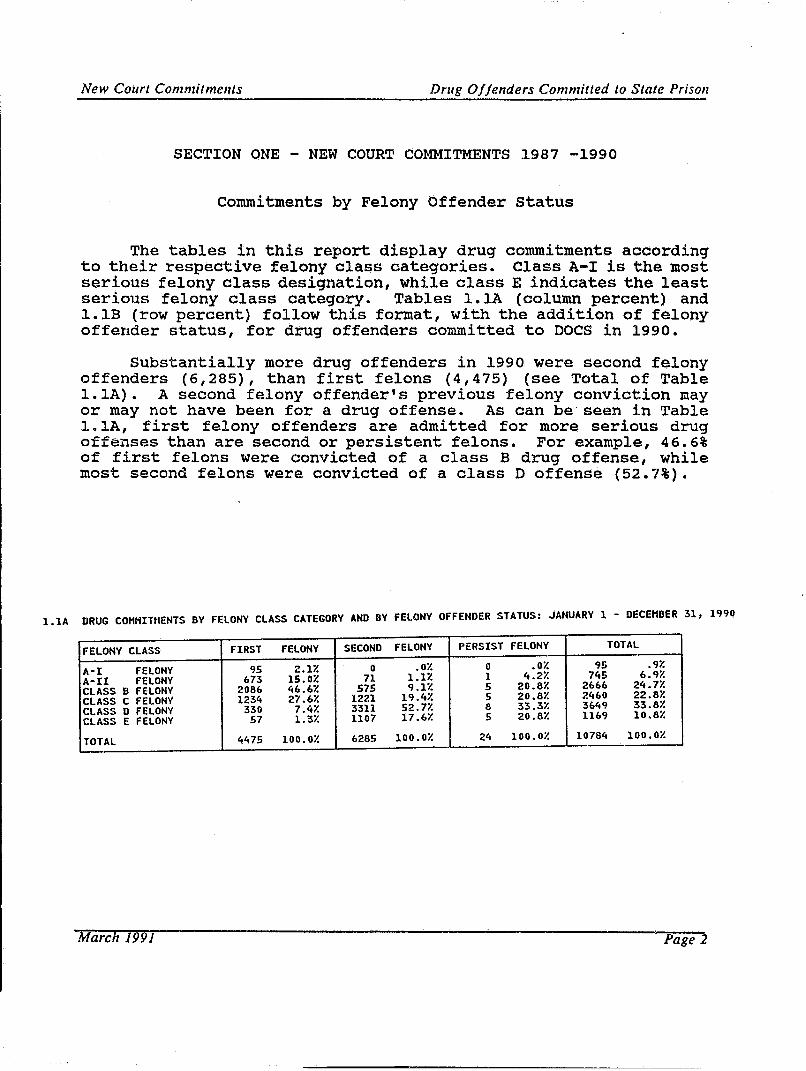
The tables in this report display drug commitments according to their respective felony class categories. Class A-I is the most serious felony class designation, while class E indicates the least serious felony class category. Tables 1.1A (column percent) and 1.lB (row percent) follow this format, with the addition of felony offender status, for drug offenders committed to DOCS in 1990.
Substantially more drug offenders in 1990 were second felony offenders (6,285), than first felons (4,475) (see Total of Table 1.lA). A second felony offender's previous felony conviction may or may not have been for a drug offense. As can be seen in Table 1.lA, first felony offenders are admitted for more serious drug offenses than are second or persistent felons. For example, 46.6% of first felons were convicted of a class B drug offense, while most second felons were convicted of a class D offense (52.7%).
1.lA DRUG COHHITHENTS BY FELONY CLASS CATEGORY AND BY FELONY OFFENDER STATUS: JANUARY 1 - DECEHBER 31, 1990
FELONY CLASS FIRST FELONY SECOND FELONY PERSIST FELONY TOTAL
A-I FELONY 95 2.1i! 0 .Oi! 0 .Oi! 95 .9i!
A-II felONY 673 15.0i! 71 1. Ii! 1 4.2i! 745 6.9i!
CLASS B FELONY 2086 46.6i! 575 9.1i! 5 20.8i! 2666 24.14
CLASS C FELONY 1234 27.6i! 1221 19.4% 5 20.8i! 2460 22.8Y.
CLASS D FELONY 330 7.4i! 3311 52.14 8 33.3i! 3649 33.8i!
CLASS E FELONY 57 1.3i! 1107 17.6% 5 20.8i! 1169 10.8i!
TOTAL 4475 100.0i! 6285 100.0i! 24 100.0i! 10784 100.0i!
March 1991 Page 2
LIB
New Court Commitments Drug Offenders Con'1milled to Slate Prison --~----------------------------~~------------------------
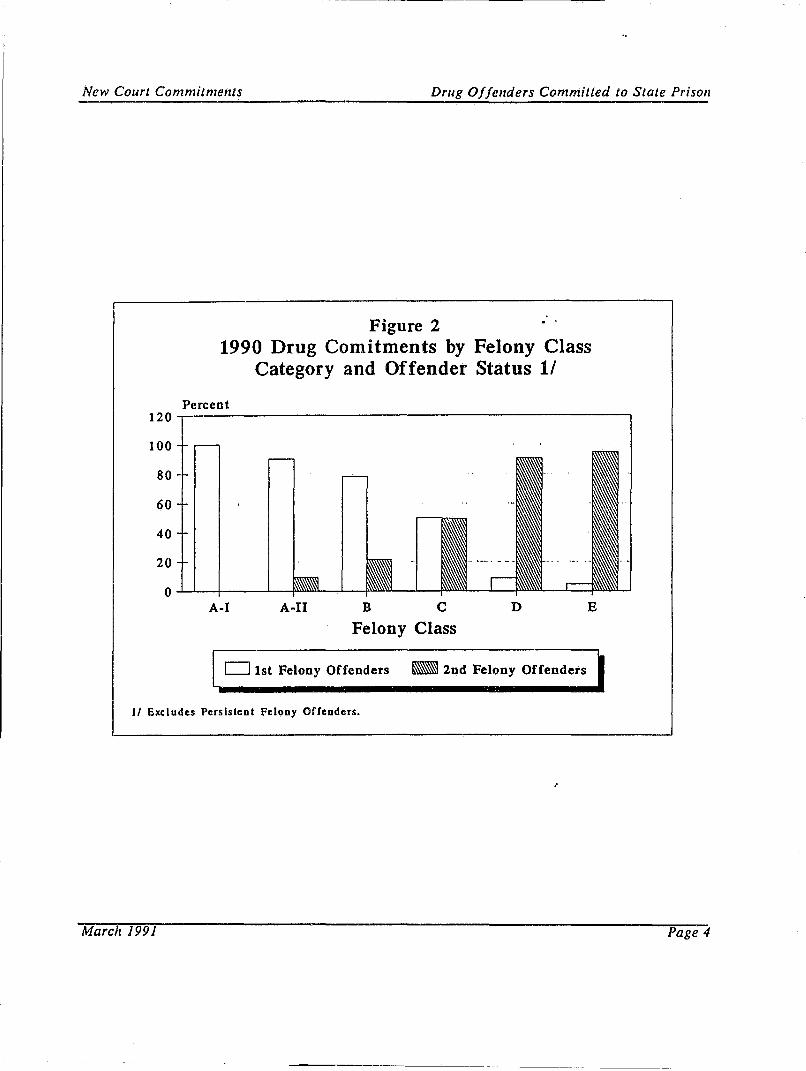
All class A-I drug offenders fall into the first felony category as New York state Penal Law exempts those convicted of class A-I offenses from second or persistent felony offender designations. Table 1.lB and Figure 2 further illustrate the more serious offense pattern of first felons in comparison to second felony offenders. Among class A-II drug offenders, fully 90% were first felons and first felons accounted for the vast majority of class B drug offenders as well (78.2%). About an equal percentage of class C drug offenders were either first or second felons (50.2% versus 49.6%). In contrast, second felony offenders accounted for 90.7% of all class D drug offenders and 94.7% of all class E offenders. The concentration of second felony offenders in the class D and E felony categories results largely from section 70.06 of the New York state Penal Law, which mandates state imprisonment for anyone designated a second felony offender.
DRUG COHHITHENTS BY FELONY CLASS CATEGORY AND BY FELONY OFFENDER STATUS: JANUARY 1 - DECEHBER 31, 1990
FELONY CLASS FIRST FELONY SECOND FELONY PERSIST FELONY TOTAL
A-I . FelONY 95 100.0% 0 .07. 0 .0% 95 100.0% A-II FelONY 673 90.3% 71 9.5% 1 .1% 745 100.0% CLASS B FELONY 2086 76.2% 575 21.6% 5 .2% 2666 100.0% CLASS C FelONY 1234 50.2% 1221 49.6% 5 .2% 2460 100.0% CLASS D FELONY 330 9.0% 3311 90.7% 8 .2% 3649 100.0% CLASS E FELONY 57 4.97. 1107 94.7% 5 .4% 1169 100.0%
TOTAL 4(.75 41.57. 62&5 56.3% 24 .2% 10764 100.0%
March 1991 Page 3
New Court Commitments Drug Offenders Committed to Siale Prisoll
120
100
80
60
40
20
0
Figure 2 .. 1990 Drug Comitments by Felony Class
Category and Offender Status 11
Percent
A·I A-II B C D E
Felony Class
D 1st Felony Offenders _ 2nd Felony Offenders
11 Excludes PerslsteDt FeloDY Offeuders.
March 1991 Page 4
New Court Commitments Drug Ojjetlders Committed to State Prison
Drug commitments by Year
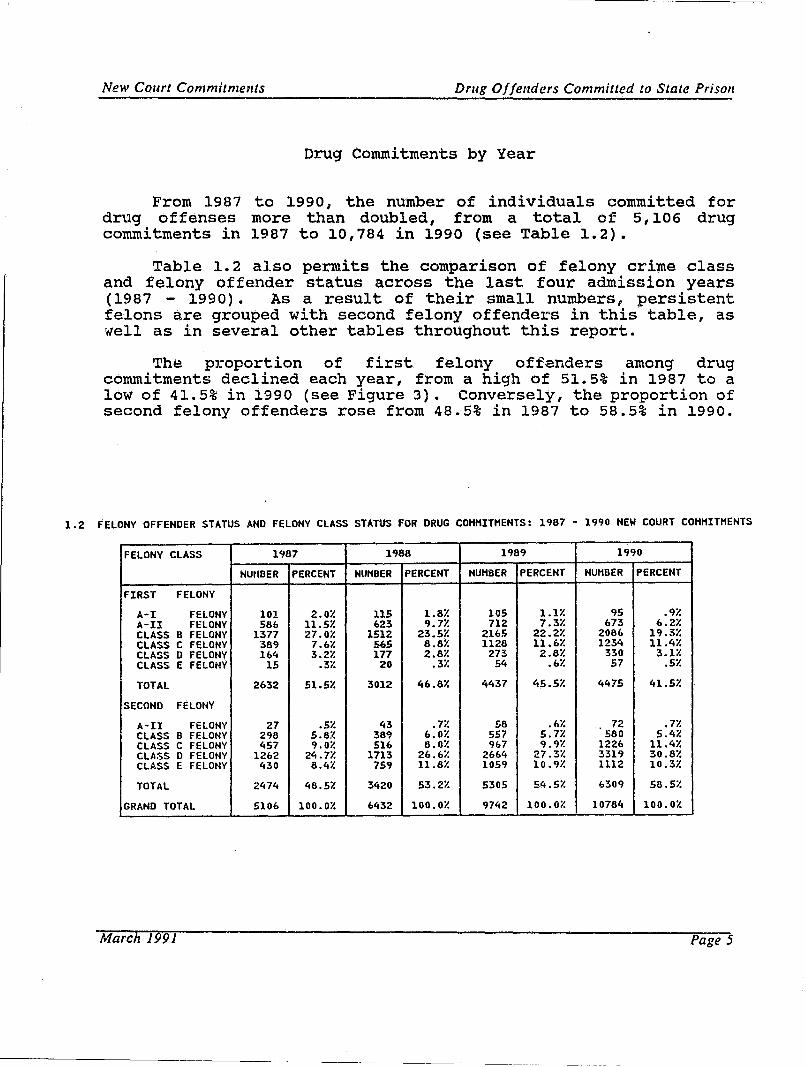
From 1987 to 1990, the number of individuals committed for drug offenses more than doubled, from a total of 5,106 drug commitments in 1987 to 10,784 in 1990 (see Table 1.2).
Table 1.2 also permits the comparison of felony crime class and felony offender status across the last four admission years (1987 - 1990). As a result of their small numbers, persistent felons are grouped with second felony offenders in this table, as 'Nell as in several other tables throughout this report.
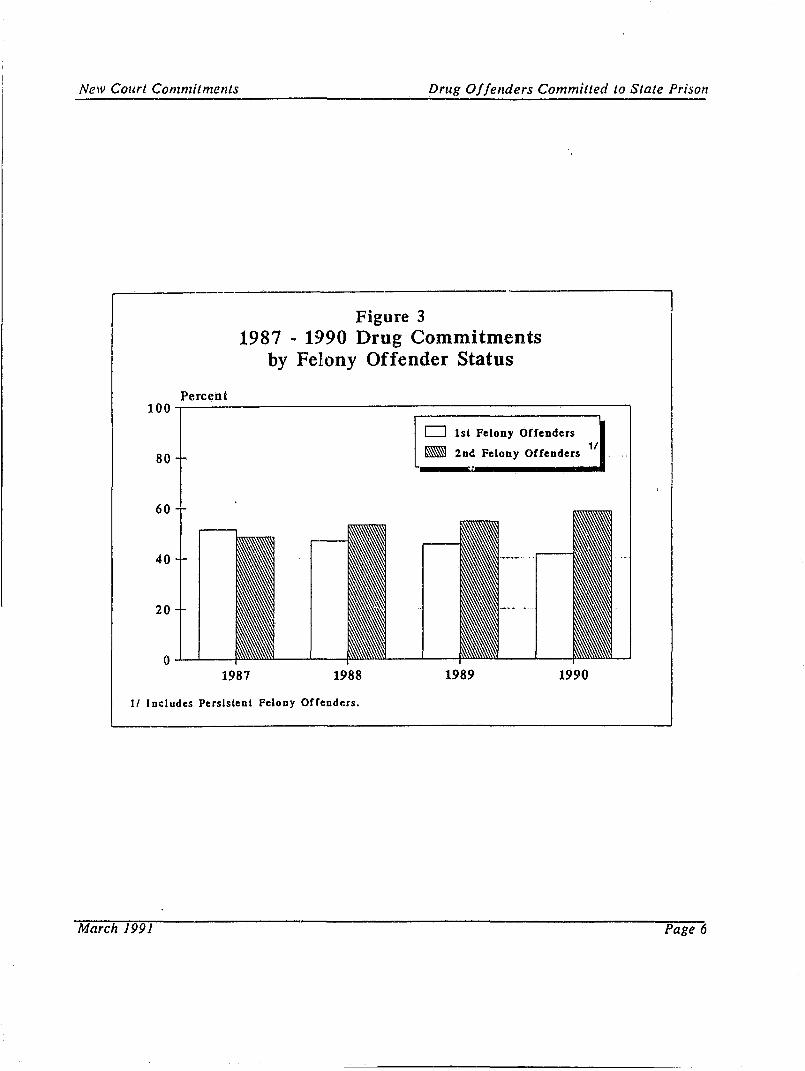
The proportion of first felony offenders among drug commitments declined each year, from a high of 51.5% in 1987 to a low of 41.5% in 1990 (see Figure 3). conversely, the proportion of second felony offenders rose from 48.5% in 1987 to 58.5% in 1990.
1.2 FELONY OFFENDER STATUS AND FELONY CLASS STATUS FOR DRUG COMMITMENTS: 1987 - 1990 NEW COURT COMMITMENTS
FELONY CLASS 1987 1'988 1989 1990
NUMBER PERCENT NUMBER PERCENT NUMBER PERCENT NUMBER PERCENT
FIRST FELONY
A-I FELONY 101 2.0% 115 1.8% lOS 1.1% 95 .9% A-II FELONY 586 11.5% 623 9.7% 712 7.3% 673 6.2% CLASS B FELONY 1377 27.0% 1512 23.5% 2165 22.2% 2086 19.3% CLASS C FELONY 389 7.6% 565 8.8% 1128 11.6% 1234 11.4% CLASS D FELONY lEo4 3.2% 177 2.8% 273 2.8% 330 3.1% CLASS E FELONY IS .3% 20 .3% 54 .6% 57 .5%
TOTAL 2632 51.5% 3012 46.8% 4437 45.5% 4475 41.5%
SECOND FELONY
A-II FELONY 27 .5% 43 .7% 58 .6% 72 .7% CLASS B FELONY 298 5.8? 389 6.0% 557 5.7% 580 5.4% CLASS C FELONY 457 9.0% 516 8.0% 967 9.9% 1226 11.4% CLASS D FELONY 1262 24.7% 1713 26.6% 2664 27.3% 3319 30.8% CLASS E FELONY 430 8.4% 759 11.8% 1059 10.9% 1112 10.3%
TOTAL 2474 48.5% 3420 53.2% 5305 54.5% 6309 58.5%
GRAND TOTAL 5106 100.0% 6432 100.0% 9742 100.0% 10784 100.0%
March 199i Pages
New COllrt Commitments Drug O//ellders Committed to State Prison
..----------------'------------------------,
Percent
Figure 3 1987 - 1990 Drug Commitments
by Fe!ony Offender Status
100~----·----------------------------------------,
80
60
1987 1988
II Includes Persistent Felony Offenders.
March 1991
lst Felony Offenders o - 11 2nd Felony Offenders I
1989 1990
Page 6
_N_e_w_C_oU_'_I_C_o_n_'m_it_m_e_"t_s ___________ D_'_u.::.,g....;O..:;f..:;.}_e,_,a_-e_,::;_' -"Cl!.!!'mitted to State Prison
Drug Commitments by Sale or Possession of Controlled Substance
Drug commitments are dichotomized below according to whether the offense was for the sale of controlled substance or the possession of a controlled substance.
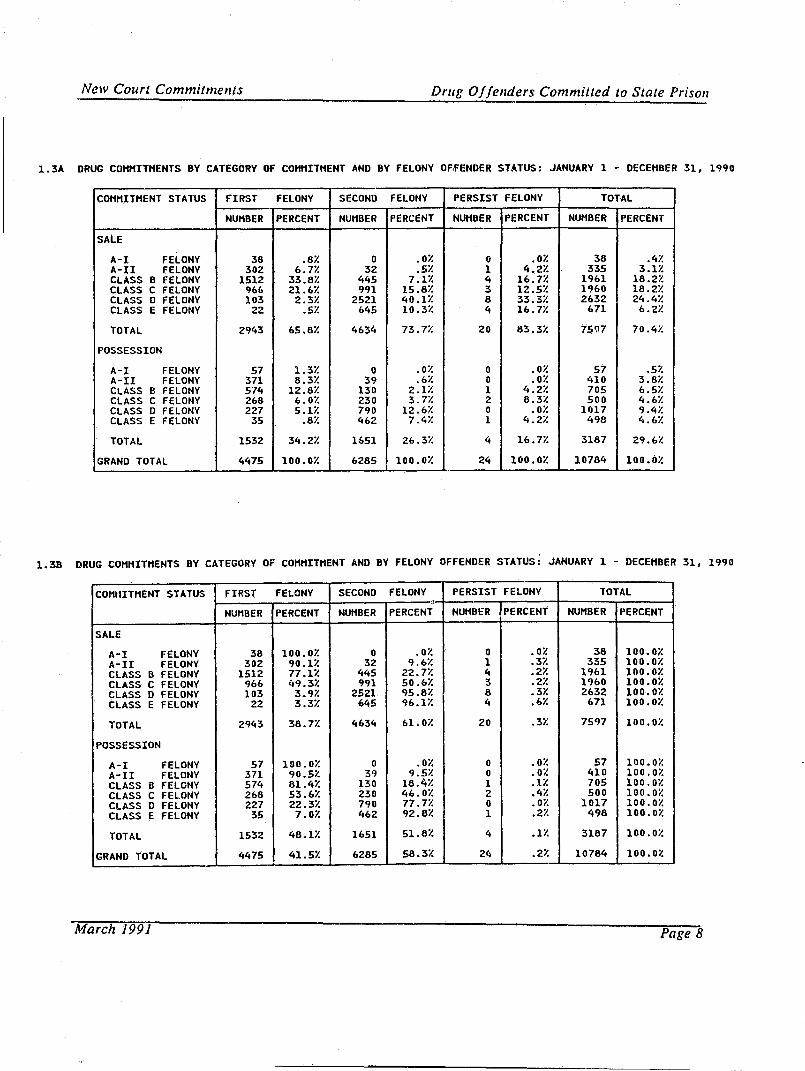
Overall, 70.4% of all offenders committed for drug offenses in 1990, were admitted for the sale of a controlled substance (see Table 1. 3A). Among first felony offenders, 65.8% were admitted for the sale of a controlled s~stance, as were 73.7% of second felony
,offenders and 83.3% of persistent felons. Conversely, 34.2% of first, 26.3% of second and 16.7% of persistent felony offenders were admitted for the possession of a controlled substance.
As can be seen in Table 1. 3B, the majority of offenders committed for the sale of a controlled substance were second felony offenders (61. 0%) • However, among offenders admitted for the possession of a controlled substance, the proportion of first and second felons was about equal (48.1% of first felons versus 51.8% of second felons).
Regardless of whether the offense was for the sale or possession of a controlled substance, first felony offenders dominated the more serious felony class categories (class A-I through class B) as second felony offenders did the least serious (class D and E). About an equal percentage of first and second felony offenders were incarcerated for class C drug offenses.
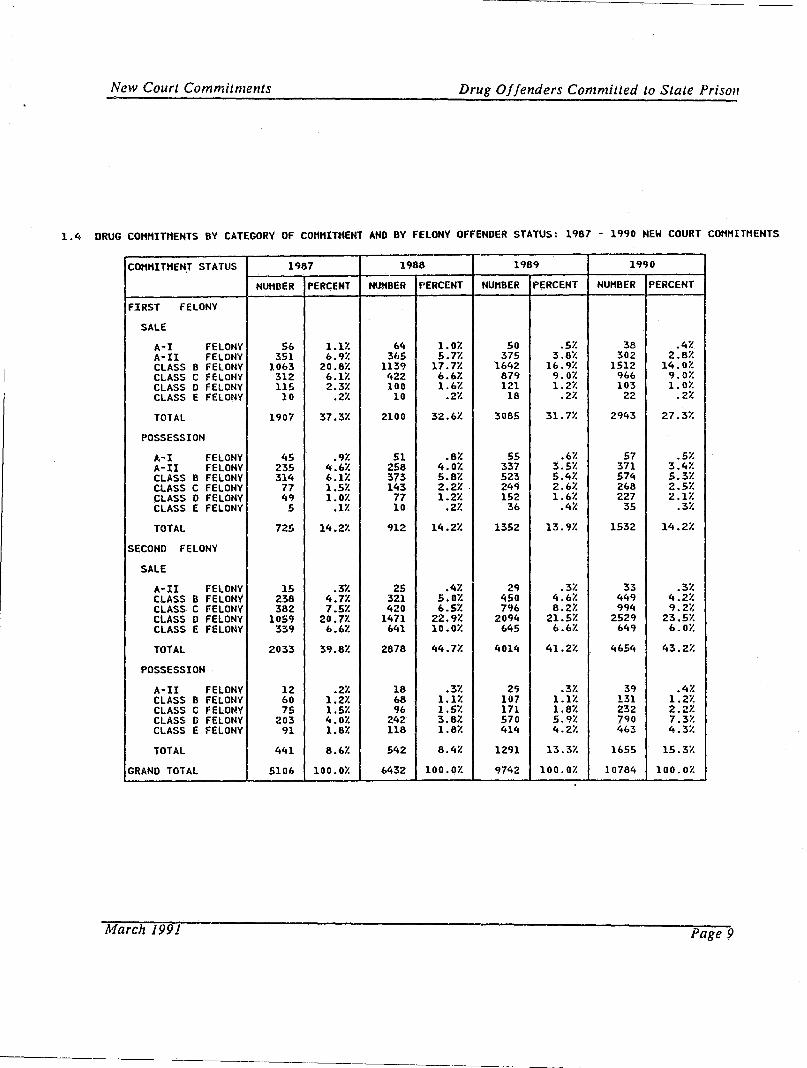
Table 1.4 looks at commitment offenses across the four year period 1987 to 1990. The percentage of offenders who were first felons imprisoned for drug sale offenses decreased from 37.3% in 1987 to 27.3% in 1990. with the exception of 1989, the proportion of offend,ers incarcerated for drug possession as first felony offenders remained at 14.2 percent.
The proportion of those admitted for drug sale offenses as second felony offenders, increased from 39.8% in 1987 to 43.2% in 1990. More significant was the percentage increase among those admitted for drug possession as second felony offenders, from 8.6% in 1987 to 15.3% in 1990.
March 1991 Page 7
New Court Commitments Drug Ojjenders Commilled to State Prison
1.3A DRUG COHMITHENTS BY CATEGORY OF COHHITHENT AND BY FELONY OFFENDER STATUS: JANUARY 1 - DECEHBER 31, 1990
COHHITHENT STATUS FIRST FELONY SECOND FELONY PERSIST FELONY TOTAL
NUHBER PERCENT NUMBER PERCENT NUHBER PERCENT NUMBER PERCENT
SALE
A-I FELONY 38 .8% 0 .0% 0 .0% 38 .4% A-II FELONY 302 6.7% 32 .5% 1 4.2% 335 3.1% CLASS B FELONY 1512 33.8% 445 7.1% 4 16.7% 1961 18.2% CLASS C FELONY 966 21.6% 991 15.8% 3 12.5% 1960 18.2% CLASS D FELONY 103 2.3% 2521 40.1% 8 33.3% 2632 24.4% CLASS E FELONY 22 .5% 645 10.3% 4 16.7% 671 6.2%
TOTAL 2943 65.8% 4634 73.7% 20 83.3% 7597 70.4%
POSSESSION
A-I FELONY 57 1.3% 0 .0% 0 .0% 57 .5% A-II FELONY 371 8.3% 39 .6% 0 .0% 410 3.8% CLASS B FELONY 574 12.8% 130 2.1% 1 4.2% 705 6.5% CLASS C FELONY 268 6.0% 230 3.7% 2 8.3% 500 4.6% CLASS D FELONY 227 5.1% 790 12.6% 0 .0% 1017 9.4% CLASS E FELONY 35 .8% 462 7.4% 1 4.2% 498 4.6%
TOTAL 1532 34.2% 1651 26.3% 4 16.7% 3187 29.6%
GRAND TOTAL 4475 100.0% 6285 100.0% 24 100.0% 10784 100.0%
1.3B DRUG COHHITHENTS BY CATEGORY OF COHMITMENT AND BY FELONY OFFENDER STATUS: JANUARY 1 - DECEMBER 31, 1990
COHflITMENT STATUS FIRST FELONY SECOND FELONY PERSIST FELONY TOTAL " NUMBER PERCENT NUMBER PERCENT NUMBER PERCENT NUMBER PERCENT
SALE
A-I FELONY 38 100.0% 0 .0% 0 .0% 38 100.0% A-II FELONY 302 90.1% 32 9.6% 1 .3% 335 100.0% CLASS B FELONY 1512 77.1% 445 22.7% 4 .2% 1961 100.0% CLASS C FELONY 966 49.3% 991 50.6% 3 .2% 1960 100.0% CLASS D FELONY 103 3.97. 2521 95.8% 8 .3% 2632 100.0% CLASS E FELONY 22 3.3% 645 96.1% 4 .6% 671 100.0%
TOTAL 2943 38.7% 4634 61.0% 20 .3% 7597 100.0%
POSSESSION
A-I FELONY 57 100.0% 0 .0% 0 .0% 57 100.0% A-II FELONY 371 90.5% 39 9.5% 0 .0% 410 100.0% CLASS B FELONY 574 81.47. 130 18.4% 1 .1% 705 100.0% CLASS C FELONY 268 53.67. 230 46.0% 2 .4% 500 100.0% CLASS 0 FELONY 227 22.3% 790 77.7% 0 .0% 1017 100.0% CLASS E FELONY 35 7.0% 462 92.8% 1 .2% 498 100.0%
TOTAL 1532 48.1% 1651 51.8% 4 .1% 3187 100.0%
GRAND TOTAL 4475 41.5% 6285 58.3% 24 .2% 10784 100.0%
March 1991 Pages
New Courl Commilmenls Drug Offenders Committed Lo Slale Prison
1.4 DRUG COMHITMENTS BY CATEGORY OF COHHITHENT AND BY FELONY OFFENDER STATUS: 1987 - 1990 NEW COURT COHHITHENTS
COHHITHEN! STATUS 1987 1988 1989 1990
NUHBER PERCENT NUHBER PERCENT NUHBER PERCENT NUHBER PERCENT
FIRST FELONY
SALE
A-I FELONY 56 1.1% 64 1.0% 50 .57. 38 .4% A-II FELONY 351 6.97. 3b5 5.77. 375 3.8% 302 2.87. CLASS B FELONY 1063 20.8% 1139 17.77. 1642 lb.9% 1512 14.07. CLASS C FELONY 312 6.1% '122 6.1.7. 879 9.0% 966 9.0% CLASS D FELONY 115 2.3% 100 1.1.% 121 1.2% 103 1.0% CLASS E FELONY 10 .2% 10 .2% 18 .2% 22 .2%
TOTAL 1907 37.3% 2100 32.6% 3065 31. 77. 2943 27.3%
POSSESSION
A-I FELONY 45 .9% 51 .8% 55 .6% 57 .5% A-II FELONY 235 4.6% 258 4.0% 337 3.5% 371 3.4% CLASS B FELONY 314 6.1% 373 5.8% 523 5.4% 574 5.3% CLASS C FELONY 77 1.5% 143 2.2% . 249 2.6% 21.8 2.5% CLASS 0 FELONY 49 1.0% 77 1.2% 152 1.6% 227 2.17. CLASS E FELONY 5 .1% 10 .27. 36 .47. 35 .37.
TOTAL 725 14.2% 912 14.27. 1352 13.9% 1532 14.2%
SECOND FELONY
SALE
A-II FELONY 15 .3% 25 .47. 29 .3% 33 .3% CLASS B FELONY 238 4.77. 321 5.0% 450 4.6% 449 4.2% CLASS C FELONY 382 7.5% 420 6.5% 796 8.2% 994 9.2% CLASS 0 FELONY 1059 20.77. 1471 22.9% 2094 21.5% 2529 23.5% CLASS E FELONY 339 6.67. 641 10.0% 645 b.6% 649 6.0%
TOTAL 2033 39.8% 2878 44.77. 4014 41.2% 4654 43.27.
POSSESSION
A-II FELONY 12 .2% 18 .3% 29 .3% 39 .4% CLASS B FELONY 60 1.27. 68 1.1% 107 1.1% 131 1.2% CLASS C FELONY 75 1.5% 96 1.5% 171 1.8% 232 2.2% CLASS 0 FELONY 203 4.0% 242 3.87. 570 5.9% 790 7.3% CLASS E FELONY 91 1.8% 118 1.8% 414 4.2% 463 4.3%
TOTAL 441 8.6% 542 8.4% 1291 13.3% 1655 15.3%
GRAND TOTAL 5106 100.0% 6432 100.07. 9742 100.07. 10764 100.07.
March 1991 Page 9
------~~~------------------
New Court Commitments Drug Offenders Committed to State Prison
Drug commitments by Type of Drug Involved in commitment
The tables in this subsection provide some indication of the type of controlled substance (drug type) for which the offender was convicted of selling or possessing. Information pertaining to drug type is self-reported at initial classification. These tables exclude those unsure of the drug involved in the crime, those denying guilt in the instant offense and those choosing not to respond to the question.
.-'
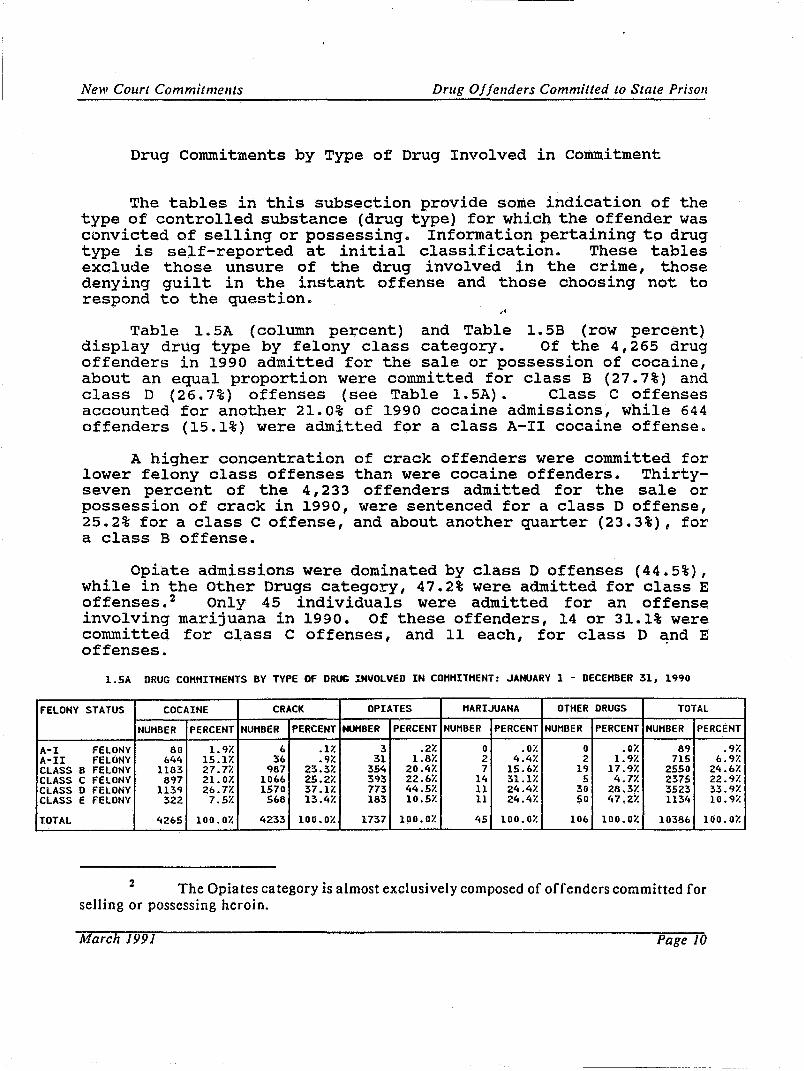
Table 1.5A (column percent) and Table 1.5B (row percent) display drug type by felony class category. Of the 4,265 drug offenders in 1990 admitted for the sale or possession of cocaine, about an equal proportion were committed for class B (27.7%) and class D (26.7 %) offenses (see Table 1. 5A) • Class C offenses accounted for another 21.0% of 1990 cocaine admissions, while 644 offenders (15.1%) were admitted for a class A-II cocaine offense.
A higher concentration of crack offenders were committed for lower felony class offenses than were cocaine offenders. Thirtyseven percent of the 4,233 offenders admitted for the sale or possession of crack in 1990, were sentenced for a class D offense, 25.2% for a class C offense, and about another quarter (23.3%), for a class B offense.
Opiate admissions were dominated by class D offenses (44.5%), while in the Other Drugs category, 47.2% were admitted for class E offenses. 2 Only 4 5 individuals were adrni tted for an offense involving marijuana in 1990. Of these offenders, 14 or 31.1% were committed for class C offenses, and 11 each, for class D and E offenses. .
I.SA DRUG COMMITMENTS BY TYPE Of DRUG INVOLVED IN COMMITMENT: JANUARY 1 - DECEMBER 31, 1990
FELONY STATUS COCAINE CRACK OPIATES MARIJUANA OTHER DRUGS TOTAL
NUMBER PERCENT NUMBER PERCENT NUHBER PERCENT NUMBER PERCENT NUMBER PERCENT NUMBER PERCENT
A-I felONY 80 1.9% 6 .1% 3 .2% 0 .0% 0 .0% 89 .9% A-II FELONY 644 15.1% 36 .9% 31 1.8% 2 4.4% 2 1.9% 715 6.9% CLASS B FELONY 1183 27.7% 987 23.3% 354 20.4% 7 15.6% 19 17.9% 2550 24.6% CLASS C FELONY 897 21.0% 1066 25.2% 393 22.6% 14 31.1% 5 4.7% 2375 22.9% CLASS D FELONY 1139 26.7% IS70 37.1% 773 44.5% 11 24.4% 30 28.3% 3523 33.9% CLASS E FELONY 322 7.5% 568 13.4% 183 10.5% 11 24.4% 50 47.2% 1134 10.9%
TOTAL 4265 100.0% 4233 100.0% 1737 100.0% 45 100.0% 106 100.0% 10386 100.0%
2 The Opia tes category is almost exclusively composed of offenders committed for selling or possessing heroin.
March 1991 Page 10

New COllrt Commitments Drug Offenders Committed to State Prison
Table 1.5B permits comparison of felony crime class across drug types. Analysis concerning this table will be limited to cocaine and crack offenses, as there were about an equal number of these offenders admitted in 1990 (4,265 commitments for cocaine versus 4,233 for crack). (See Figure 4 for the drug type composition of 1990 admissions.)
Among drug offenders admitted for a class A-I offense in 1990, 89.9% (80) stated their offense involved cocaine compared with 6.7% (6) who reported crack involvement (see also Figure 5). The same pattern exists Jor class A-II drug offenses, with 90.1% (644) reporting cocaine as the drug sold or possessed, versus 5.0% (36) who reported crack. The number of class B drug offenders reporting the sale or possession of cocaine was still greater than that for crack (1,183 versus 987), although the gap between the two narrowed considerably.
In the remaining felony class categories, the proportion of crack commitments exceeded those for cocaine, particularly as the felony class of the offense decreased. For example, 44.9% of class C drug offenses involved crack as opposed to cocaine (37.8%), while among class E drug felons, 50.1% were committed for crack offenses but only 28.4% for offenses involving cocaine.
1.58 DRUG COHHITHENTS BY TYPE OF DRUG INVOLVED IN COHHITHENT: JANUARY 1 - DECEHBER 31, 1990
FELONY STATUS COCAINE CRACK OPIATES HARIJUANA OTHER DRUGS TOTAL
NUHBER PERCENT NUHBER PERCENT NUHBER PERCENT NUHBER PERCEN1' NUH8ER PERCENT NUHBER PERCENl'
A-I FELONY 80 89.9% 6 6.7% 3 3.4% 0 .0% 0 .0% 89 100.0% A-II FELONY 644 90.1% 36 5.0% 31 4.3% 2 .3% 2 .3% 715 100.0% CLASS B FELONY 1183 46.4% 987 38.7% 354 13.9% 7 .3% 19 .7% 2550 100.0% CLASS C FELONY 897 37.8% 1066 44.9% 393 16.5% 14 .6% 5 .2% 2375 100.0% CLASS D FELONY 1139 32.3% 1570 44.6% 773 21.9% 11 .3% 30 .9% 3523 100.0% CLASS E FELONY 322 28.4% 568 50.1% 183 16.1% 11 1.0% 50 4.4% 1134 100.,0%
TOTAL 4265 41.1% 4233 40.8% 1737 16.7% 45 .4% 106 1.0% 10386 100.0%
March 1991 Page 11

~~------------------------
New Court Commitments Drug Offenders Committed to State Prison
Figure 4 1990 Drug Commitments By Type
Of Drug Involved 11
Crack 40.8%
II Information pertaining to drug type is self.reported at Initial classl r 1catlon.
Cocaine .._--_ 41.1%
Figure 5
Other Drugs 1.0%
1990 Drug Commitments by Type of Drug Involved and Felony Crime Class 11
Percent 100~----------------------------------------------~
80
60
A-I A-II
II Excludes MulJuana and Otber Drugs categories.
March 1991
[ 0 Cocaine _ Crack _ Opiates I.
B C D E
Felony Class
Page 12
New Court Commitments Drug Offenders Committed to State Prison
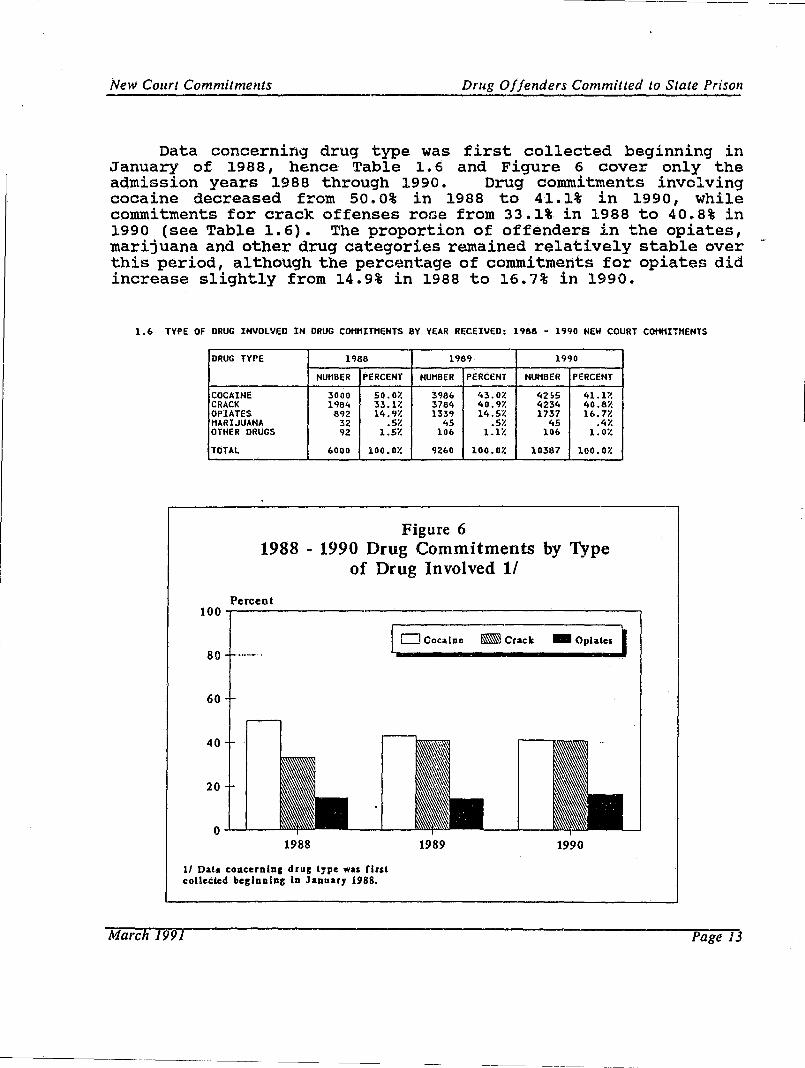
Data concerning drug type was first collected beginning in January of 1988, hence Table 1. 6 and Figure 6 cover only the admission years 1988 through 1990. Drug commitments involving cocaine decreased from 50.0% in 1988 to 41.1% in 1990, while commitments for crack offenses raoe from 33.1% in 1988 to 40.8% in 1990 (see Table 1.6). 'I'he proportion of offenders in the opiates, marijuana and other drug categories remained relatively stable over this period , although the percentage of commitments for opiates did increase slightly from 14.9% in 1988 to 16.7% in 1990.
1.6 TYPE OF DRUG INVOLVED IN DRUG COMMITHENTS BY YEAR RECEIVED: 1988 - 1990 NEW COURT COHHITHENTS
DRUG TYPE 1988 1989 1990
NUMBER PERCENT NUHBER PERCENT HUI1BER PERCENT
COCAINE 3000 50.0% 3986 43.0% 42&5 41.1% CRACK 1<)84 33.1% 3784 40.9% 4234 40.8% OpIATES 892 14.9% 133<) 14.5% 1737 16.7% HARIJUANA 32 .5% 45 .5% 45 .4% OTHER DRUGS 92 1.5% 106 1.1% lab 1.0%
TOTAL 6000 100.0% 9260 100.0% 10387 100.0%
Figure 6 1988 Q 1990 Drug Commitments by Type
of Drug Involved 11
Percent 100~----------------------------------------------~
80 [ 0 Cocalae _ Crack _ Opiates I
60
1988 1989 1990
11 Data coaceralac drug type was first collected be,laalar; la January 1988.
March 1991 Page 13
~- ---------------------------------------------------
New Court Commitments Drug Offenders Committed to State Prison
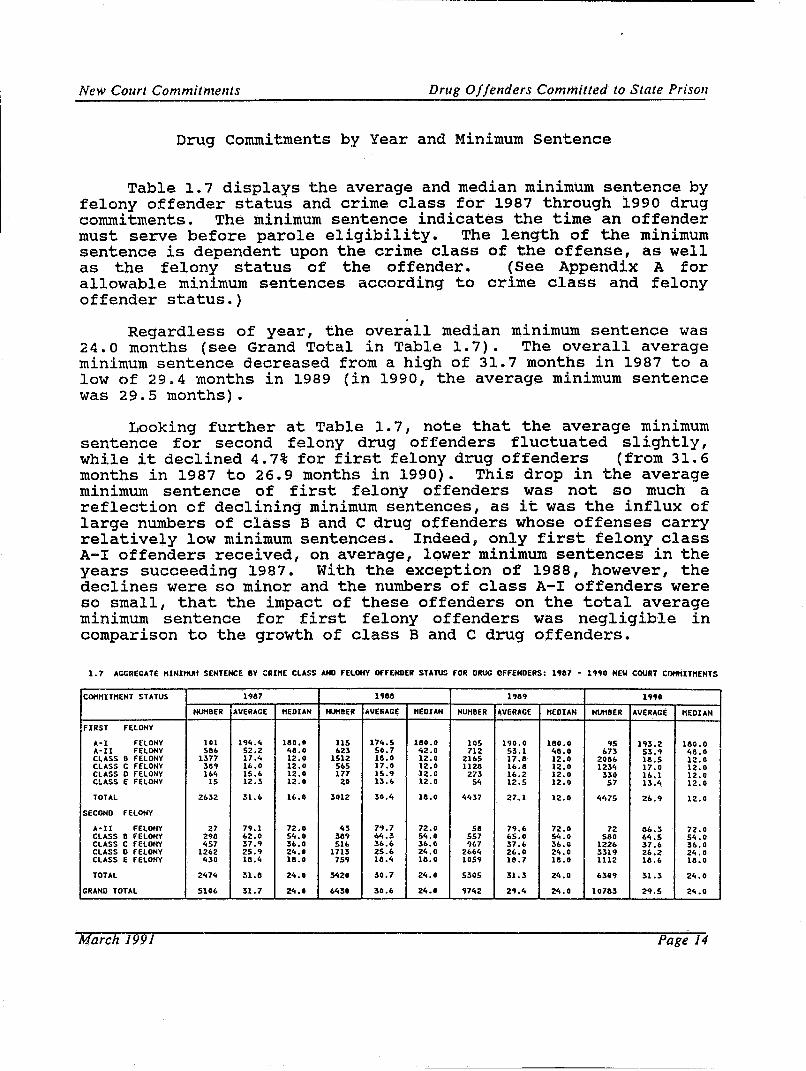
Drug commitments by Year and Minimum sentence
Table 1.7 displays the average and median minimum sentence by felony offender status and crime class for 1987 through 1990 drug commitments. The minimum sentence indicates the time an offender must serve before parole eligibility. The length of the minimum sentence is dependent upon the crime class of the offense, as well as the felony status of the offender. (See Appendix A for allowable minimum sentences according to crime class and felony offender status.)
Regardless of year, the overall median minimum sentence was 24.0 months (see Grand Total in Table 1.7). The overall average minimum sentence decreased from a high of 31.7 months in 1987 to a low of 29.4 months in 1989 (in 1990, the average minimum sentence was 29.5 months).
Looking further at Table 1.7, note that the average minimum sentence for second felony drug offenders fluctuated slightly, while it declined 4.7% for first felony drug offenders (from 31. 6 months in 1987 to 26.9 months in 1990). This drop in the average minimum sentence of first felony offenders was not so much a reflection of declining minimum sentences, as it was the influx of large numbers of class Band C drug offenders whose offenses carry relatively low minimum sentences. Indeed, only first felony class A-I offenders received, on average, lower minimum sentences in the years succeeding 1987. with the exception of 1988, however, the declines were so minor and the numbers of class A-I offenders were so small, that the impact of these offenders on the total average minimum sentence for first felony offenders was negligible in comparison to the growth of class Band C drug offenders.
1.7 AGGRECATE HINIHUH SENTENCE BY CRIHE CLASS AND FELONY OfFENDER STATUS FOR ORUG OFFENDERS: 1'117 - 1"0 NEW COURT COHHITHENTS
COHHITHENT STATUS l'1117 naa 1'111' 1"0
NUHBER AVERAGE HEDIAN _BEll AVERAGE HEDIAN NUNBER AVERAGE HEDIAN tMlBER AVERAGE tlEDIAN
FIRST FELONY
A-I FELONY 101 1'4.4 1110.~ 11S 174.5 1110.0 105 1'0.0 1110.0 '15 1'13.2 1&0.0 A-II FELONY 586 52.2 48.0 623 50.7 42.0 712 53.1 411.0 673 53.'1 48.0 CLASS B fELONY 1377 17.4 12.0 1512 111.0 12.0 2165 17.11 12.0 20116 111.5 12.0 CLASS C FELONY 38' 16.0 12.0 565 17.0 12.0 11211 1&.11 12.0 1234 17.0 12.0 CLASS D fELONY 164 15.& 12.0 177 15.' 12.0 273 1&.2 12.0 330 16.1 12.0 CLASS E FELONY 15 12.3 12.0 20 13.6 12.0 54 12.5 12.0 57 13.4 12.0
TOTAL 2&32 31.6 1&.0 3012 30.4 111.0 4437 27.1 12.0 "475 26.'1 12.0
SECOND FELONY
A-II FELONY 27 79.1 72.0 43 7'1.7 72.0 511 7'1.& 72.0 72 116.3 72.0 CLASS 8 FELONY 2'8 62.0 54.0 311' 1.4.3 54.0 557 65.0 54.0 5eo 1.4.5 54.0 CLASS C HlONY 457 37.'1 36.0 516 36.6 36.0 '167 37.6 36.0 1226 37.6 3/0.0 CLASS D FELONY 1262 25.' 24.' 1713 25.6 24.0 21064 26.0 24.0 331' 26.2 24.0 CLASS E FELONY 430 111.4 111.0 75' 111.4 111.0 105' 18.7 111.0 1112 18.6 111.0
TOTAL 2474 31.11 24.' 342' 30.7 24.' 5305 31.3 24.0 631'1 31.3 24.0
GRAND TOTAL 5106 31.7 24.' 6431 30.6 24.' '742 2"1.4 24.0 107113 2'1.5 24.0
March 1991 Page 14

New Court Commitments Drug Ojjenders Committed to State Prison
In Table 1.8, the felony crime class categories of Table 1.7, are replaced by the type of drug sold or possessed. 3 Offenders admitted for offenses involving cocaine received longer average minimum sentences than did offenders admitted for crack. (Cocaine and crack offenses accounted for the large majority of all drug commitments.) For example, in 1990, first felony cocaine offenders received an average minimum sentence of 34.6 months, while crack offenders, received an average of 17.8 months. Average minimum sentences for second felony cocaine and crack offenders in 1990 were not as dissimilar, with cocai.ne offenders receiving an average minimum sentence of 34.4 months and crack offenders, an average of 29.7 months.
Average minimum sentences for first felony cocaine offenders exceeded those of second felony offenders across all years because of the lengthy minimum sentences received by class A-I offenders (see Table 1.7). The predominance of cocaine offenders in the Class A-I category is also responsible for the large discrepancy in the average minimum sentences received by first felony cocaine and crack offenders (see Table 1.SB).
The overall decline in the average minimum sentence noted in Table 1.6 is the result of the changing composition of the drug commitment population. As discussed above, offenses involving crack are generally of a lower felony class than those involving cocaine, hence the minimum sentences received by crack offenders are also generally lower. Increasing numbers of crack offenders, particularly in 1989 and 1990, were most likely responsible for the decrease in the overall average minimum sentences noted for those years in Table 1.6.
1.11 A~GREGATE "INI"UH SENTENCE IIV DRUG TVPE AND FELONV OFFENDER STATUS FOR DRUG OFFENDERS: 1~1I11 • 19~0 NEW COURT COMMITMENTS
CO~ITMENT STATUS 1~1I1I 1~8~ 1990
NUMBER' AVERAGE "EDIAN NUHBER AVERAGE MEDIAN NUMBER AVERAGE "EDIAN FIRST FELONY
COCAINE 16S7 36.2 24.0 2158 33.11 111.0 2213 34.10 24.0 CRACK 815 1'1.0 12.0 151'1 17.1 12.0 1547 17.8 12.0 OPIATES 236 23.7 12.0 416 22.4 12.0 453 1~.8 12.0 MARIJUANA 13 14.5 12.0 30 17.'1 16.0 23 22.0 lI..O OTHER DRUGS 28 27.5 14.0 28 23.7 1~.0 31 21.0 16.0 TOTAL 274'1 2'1.8 18,0 4151 26.3 12.0 4267 26.8 12.0
SECOND FELONV
COCAINE 1343 33.3 24.0 1828 33.7 24.0 2052 34.4 30.0 CRACK 116'1 29.0 24.0 2265 2'1.8 24.0 2687 2~.7 24.0 OPIATES 656 2'1.3 24.0 '123 30.3 24.0 1284 30.2 24.0 "ARIJUANA 19 26.'1 24.0 15 35.0 24.0 22 31.9 24.0 OTHER DRUGS 64 21.2 18.0 78 22.4 18.0 75 22.6 18.0 TOTAL 3251 30.7 24.0 510'1 31.2 24.0 6120 31.3 24.0
GRANO TOTAL 5~'I1I 30.3 24.0 ~2bO 29.0 24.0 103116 2~.4 24.0
3 Data concerning drug type was not available until 1988,
March 1991 Page 15
Undercustody Population Drug Offenders Committed to State Prison
SECTION TWO - UNDERCUSTODY POPULATION ON DECEMBER 31, 1990
This section profiles drug offenders in the Department's custody on December 31, 1990. Characteristics of the undercustody dl:'ug population discussed in this section include: the felony class category of the offense, felony offender status, sale or possession status of the offense and the type of drug involved in the offense.
Drug Offenses by Felony Offender Status
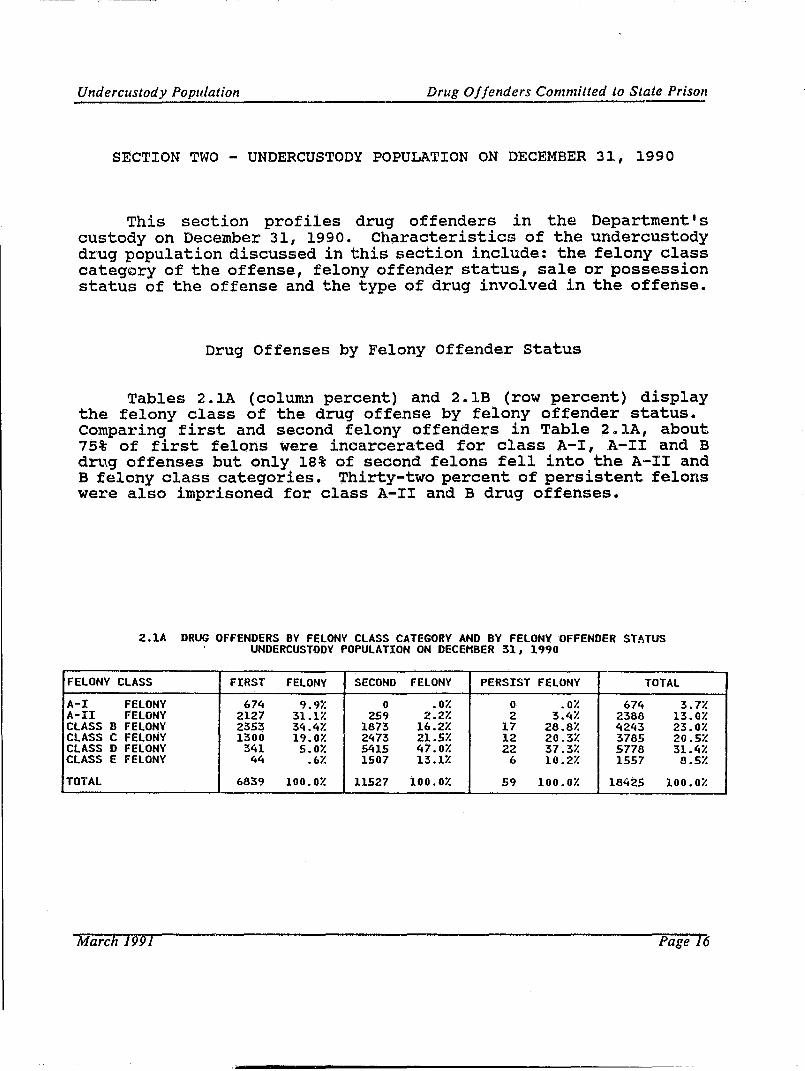
Tables 2.1A (column percent) and 2.1B (row percent) display the felony class of the drug offense by felony offender status. Comparing first and second felony offenders in Table 251A, about 75% of first felons were incarcerated for class A-I, A-II and B drt1g offenses but only 18% of second felons fell into the A-II and B felony class categories. Thirty-two percent of persistent felons were also imprisoned for class A-II and B drug offenses.
2.1A DRUG OFFENDERS BY FELONY CLASS CATEGORY AND BY FELONY OFFENDER STATUS . UNDERCUSTODY POPULATION ON DECEHBER 31, 1990
FELONY CLASS FIRST fELONY SECOND FelONY PERSIST FelONY TOTAL
A-I FELONY 674 9.9% 0 .0% 0 .0% 674 3.7% A-II FELONY 2127 31.1% 259 2.2% 2 3.4% 2388 13.0% CLASS B FELONY 2353 34.4% 1873 16.2% 17 28.8% 4243 23.0% CLASS C FELONY 1300 19.0% 2473 21.5% 12 20.3% 3785 20.5% CLASS D FelONY 341 5.0% 5415 47.0% 22 37.3% 5778 31.4% CLASS E FELONY 44 .6% 1507 13.1% 6 10.2% 1557 8.5%
TOTAL 6839 100.0% 11527 100.0% 59 100.0% 18425 100.0%
March 1991 Page 16

Undercustody Population Drug O//enders Committed to State Prison
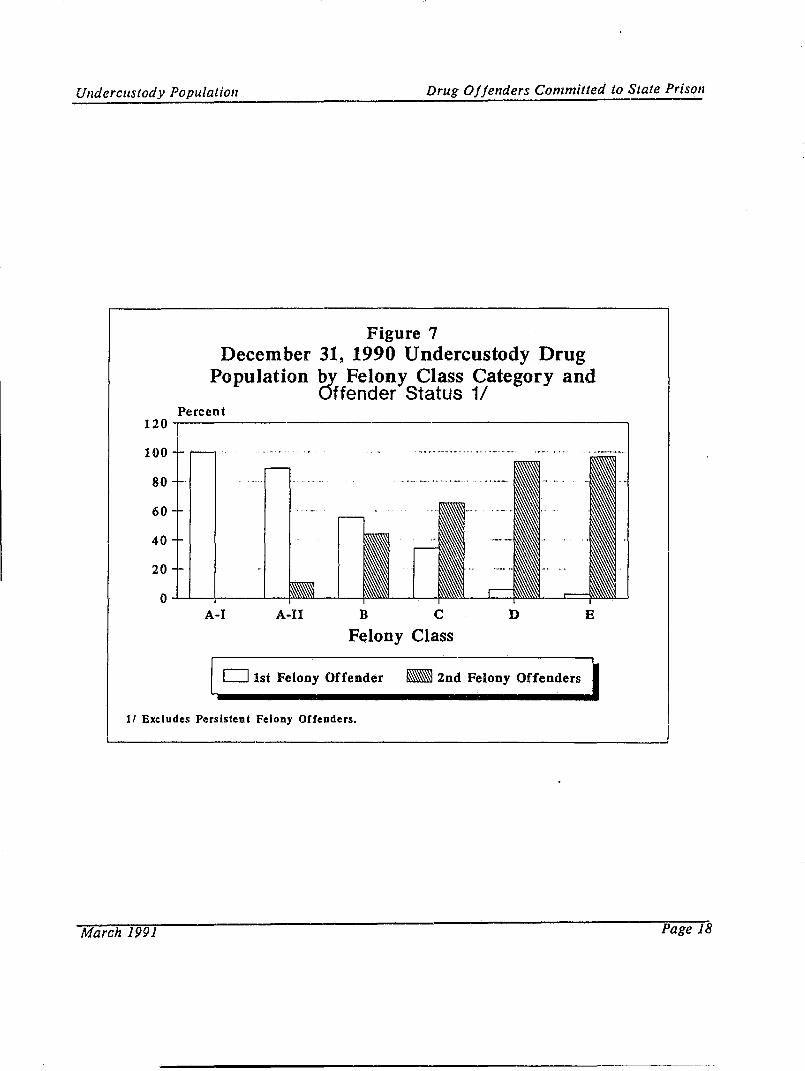
The pronounced division between first and second felony offenders in regards to the seriousness of the commitment offense is more clearly seen in Table 2.1B and Figure 7. As mentioned in section One, those convicted of class A-I offenses are not additionally sentenced as second or persistent felony offenders. First felony offenders also accounted for 89.1% of class A-II drug offenses. There was still a higher percentage of first felony, class B drug offenders than there were second felony, class B drug offenders (55.5% versus 44.1%). Sixty-five percent of class C drug offenders were second felons compared with 34.3% of first felony offenders. In the lowest felony class categories, 93.7% of class D drug offenders were second felons, as were 96.8% of class E offenders.
Overall, 62.6% of those undercustody for drug offenses on December 31, 1990 were sentenced as second felony offenders and 37.1% were first felons (see Table 2 .1B) • contrasting these figures with those for 1990 drug commitments, where 41. 5% were first felons and 58.3% were second felons (see Table 1.lB, section One), it might appear that there is a minor shift towards a higher percentage Qf first felony offenders in the commitment population. However, the greater proportion of second felony offenders in the undercustody population reflects the longer sentences these offenders must serve before parole eligibility.
2.1B DRUG OFFENDERS BY FELONY CLASS CATEGORY AND BY FELONY OFFENDER STATUS UNDERCUSTODY POPULATION ON DECEMBER 31, 1990
FELONY CLASS FIRST FELONY SECOND FELONY PERSIST FELONY TOTAL A-I FELONY 674 100.0% 0 .0% 0 .0% 674 100.0% A-II FELONY 2127 89.1:~ 259 10.8% 2 .1% 2388 100.0% CLASS B FELONY 2353 55.5% 1873 44.1% 17 .4% 4243 100.0% CLASS C FELONY 1300 34.3% 2473 65.3% 12 .• 3% 3785 100.0% CLASS D FELONY 341 5.9% 5415 93.7% 22 .4% 5778 100.0% CLASS E FELONY 44 2.8% 1507 96.8% 6 .4% 1557 100.0% TOTAL 6639 37.1% 11527 62.6% 59 .3% 1 8425 100.0%
March 1991 Page 17
UndercustodY Population Drug Offenders Committed to State Prison
120
100
80
60
40
20
0
Figure 7 December 31, 1990 Undercustody Drug
Population by Felony Class Category and Offender Status 11
Percent
A-I A-II B C D E
Felony Class
o 1st Felony Offender _ 2nd Felony Offenders
11 Excludes Persistent Felony Offenders.
March 1991 Page 18
Undercustody Population Drug Offenders Committed to State Prison
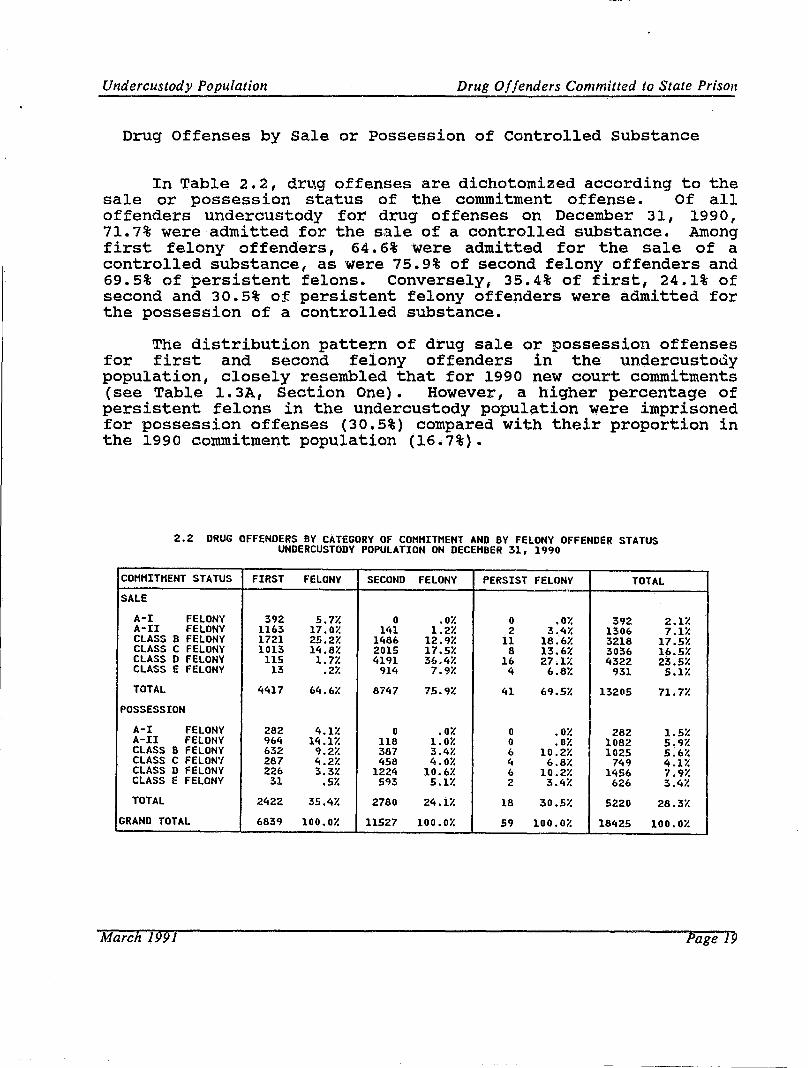
Drug Offenses by Sale or Possession of Controlled Substance
In Table 2.2, drug offenses are dichotomized according to the sale or possession status of the commitment offense. Of all offenders undercustody for drug offenses on December 31, 1990, 71.7% were admitted for the s,ale of a controlled substance. Among first felony offenders, 64.6% were admitted for the sale of a controlled substance, as were 75.9% of second felony offenders and 69.5% of persistent felons. Conversely, 35.4% of first, 24.1% of second and 30.5% of persistent felony offenders were admitted for the possession of a controlled substance.
The distribution pattern of drug sale or possession offenses for first and second felony offenders in the undercustody population, closely resembled that for 1990 new court commitments (see Table 1.3A, section One). However, a higher percentage of persistent felons in the undercustody population were imprisoned for possession offenses (30.5%) compared with their proportion in the 1990 commitment population (16.7%).
2.2 DRUG OFFENDERS BY CATEGORY OF COMMITMENT AND BY FELONY OFFENDER STATUS UNDERCUSTODY POPULATION ON DECEMBER 31, 1990
COMMITMENT STATUS FIRST FELONY SECOND FELONY PERSIST FELONY TOTAL "" SALE
A-I FELONY 392 5.n 0 .0% 0 .0% 392 2.1% A-II FELONY 1163 17.0% litl 1.2% 2 3.,4% 1306 7.1% CLASS B FELONY 1721 25.2% 1486 12.9% 11 18.6% 3218 17.5% CLASS C FELONY 1013 14.8% 2015 17.5% 8 13.6% 3036 If,.5% CLASS D FELONY 115 1.n 4191 36.4% 16 27.1% 4322 23.5% CLASS E FELONY 13 .2% 914 7.9% 4 6.8% 931 5.1%
TOTAL 4417 64.6% 8747 75.9% 41 69.5% 13205 71.7%
POSSESSION
A-I FELONY 282 4.1% 0 .0% 0 .0% 282 1.5% A-II FELONY 964 14.1% 118 1.0% 0 .0% 1082 5.9% CLASS B FELONY 632 9.2% 387 3.4% 6 10.2% 1025 5.6% CLASS C FELONY 287 4.2% 458 4.0% 4 6.8% 749 4.1% CLASS D FELONY 226 3.3% 1224 10.6% 6 10.2% 1456 7.9% CLASS E FELONY 31 .5% 593 5.1% 2 3.4% 626 3.4%
TOTAL 2422 35.4% 2780 24.1% 18 30.5% 5220 28.3%
GRAND TOTAL 6839 100.0% 11527 100.0% 59 100.0% 18425 100.0%
March 1991 Page 19
Undercllstody Population Drug Ojjenders Committed to State Prison
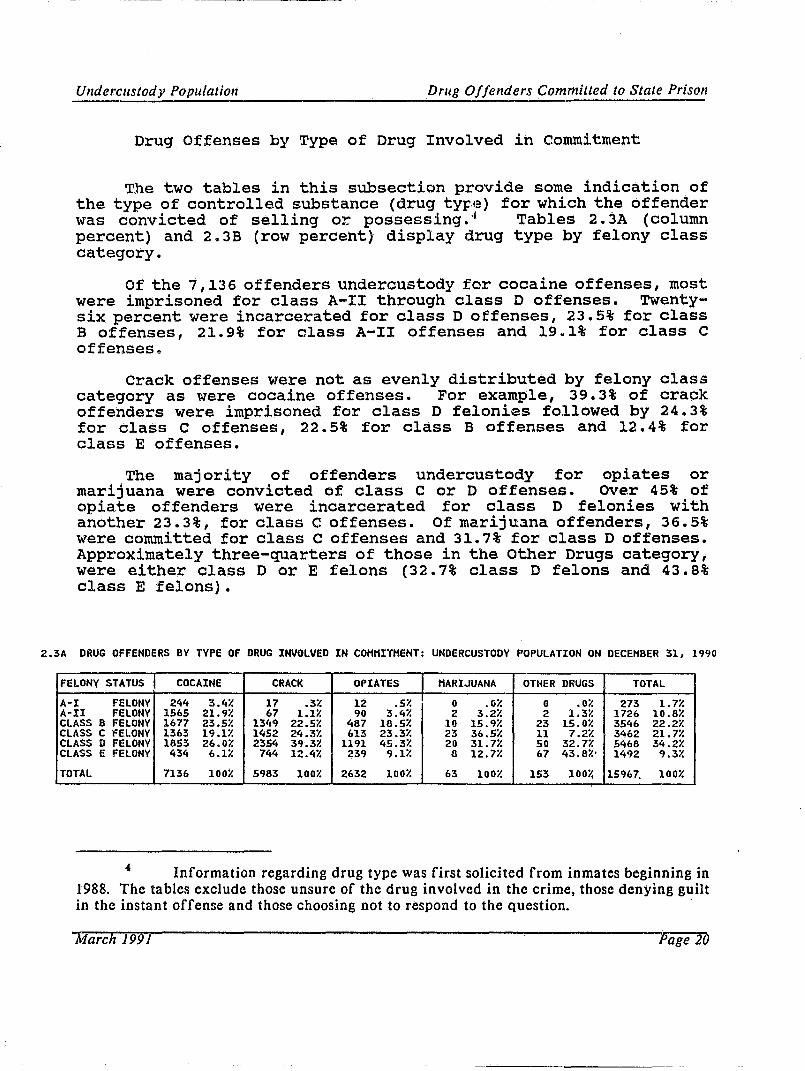
Drug Offenses by Type of Drug Involved in commitment
The two tables in this subsection provide some indication of the type of controlled substance (d.rug typia) for which the offender was convicted of selling or possessing.·( Tables 2. 3A (column percent) and 2.3B (row percent) display drug type by felony class category.
Of the 7, 136 offenders undercustody for cocaine offenses, most were imprisoned for class A-II through class D offenses. Twentysix percent were incarcerated for class D offenses, 23.5% for class B offenses, 21.9% for class A-II offenses and 19.1% for class C offenses.
Crack offenses were not as evenly distributed by felony class category as were cocaine offenses. For example, 39.3% of crack offenders were imprisoned for class D felonies followed by 24.3% for class C offenses, 22.5% for class B offenses and 12.4% for class E offenses.
The majority of offenders undercustody for opiates or marijuana were convicted of class C or D offenses. Over 45% of opia.te offenders were incarcerated for class D felonies wi th another 23.3%, for class C offenses. Of marijuana offenders, 36.5% were committed for class C offenses and 31.7% for class D offenses. Approximately three-quarters of those in the Other Drugs category, were either class D or E felons (32.7% class D felons and 43.8% class E felons).
2.3A DRUG OFFENDERS BY TYPE OF DRUG INVOLVED IN COHHITHENT: UNDERCUSTODY POPULATION ON DECEHBER 31, 1990
FELONY STATUS COCAINE CRACK OPIATES HARIJUANA OTHER DRUGS TOTAL
A-I FELONY 244 3.4% 17 .3% 12 .5%' 0 .6% 0 .0% 273 1.7% A-II FELONY 1565 21.9% 67 1.1% 90 3.4% 2 3.2% 2 1.3% 1726 10.8% CLASS B FelONY 1677 23.5% 13(,9 22.5% 487 18.5% 10 15.9% 23 15.0% 3546 22.2% CLASS C fELONY 1363 19.1% 1452 24.3/. 613 23.3% 23 36.5% 11 7.2% 3462 21.7% CLASS D FELONY 1853 26.0% 2354 39.3% 1191 45.3% 20 31.7% 50 32.7% 5468 34.2% CLASS E FELONY 434 6.1% 744 12.4% 239 9.1% 8 12.7% 67 43.8%' 1492 9.3%
TOTAL 7136 100% 5983 100% 2632 100% 63 100% 153 100% 15967. 100%
Information regarding drug type was first solicited from inmates beginning in 1988. The tables exclude those unsure of the drug involved in the crime, those denying guilt in the instant offense and those choosing not to respond to the Question.
March 1991 - Page 20
Undercustody Population Drug Offenders Committed to Slale Prison
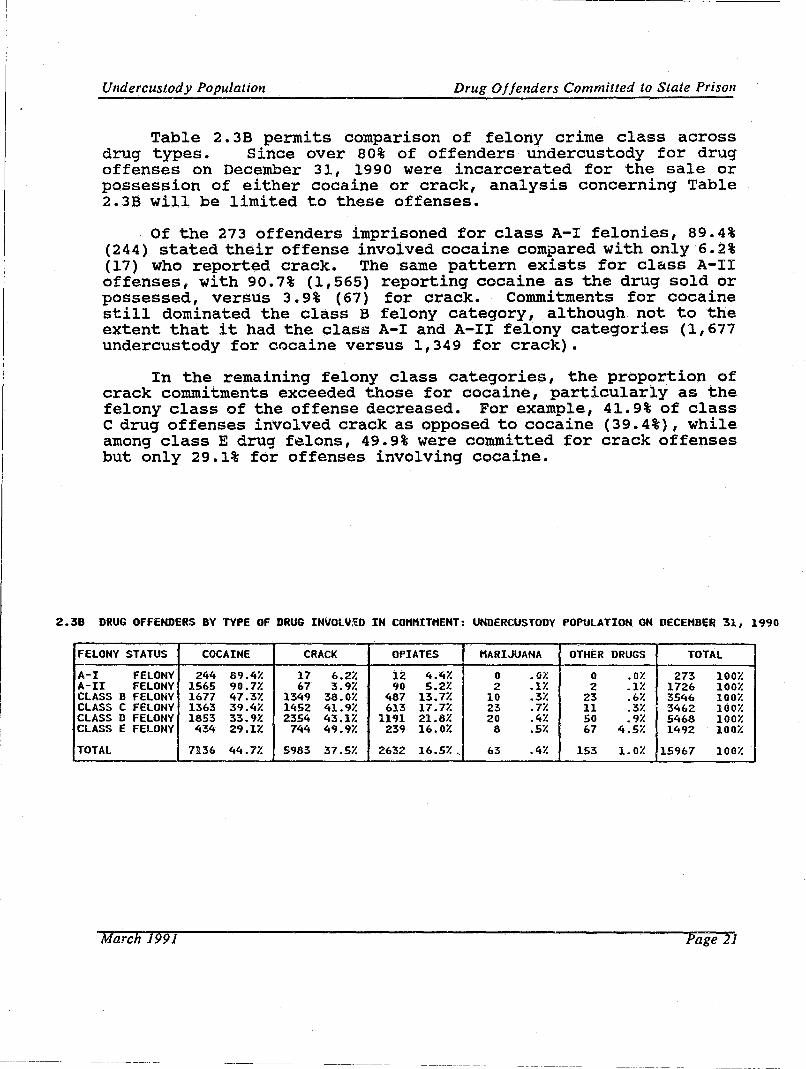
Table 2.3B permits comparison of felony crime class across drug types. Since over 80% of offenders undercustody for drug offenses on December 31, 1990 were incarcerated for the sale or possession of either cocaine or crack, analysis concerning Table 2.3B will be limited to these offenses.
Of the 273 offenders imprisoned for class A-I felonies, 89.4% (244) stated their offense involved cocaine compared with only 6.2% (17) who reported crack. The same pattern exists for claSS A-II offenses, with 90.7% (1,565) reporting cocaine as the drug sold or possessed, versus 3.9% (67) for crack. Commitments for cocaine still dominated the class B felony category, although not to the extent that it had the class A-I and A-II felony categories (1,677 undercustody for cocaine versus 1,349 for crack).
In the remaining felony class categories, the proportion of crack commitments exceeded those for cocaine, particularly as the felony class of the offense decreased. For example, 41.9% of class C drug offenses involved crack as opposed to cocaine (39.4%), while among class E drug felons, 49.9% were committed for crack offenses but only 29.1% for offenses involving cocaine.
2.38 DRUG OFFENDERS BY TYPE OF DRUG INVOLU~D IN COHHITHENT: UNDERCUSTODV POPULATION ON DECEHBeR 31, 1990
FELONY STATUS COCAINE CRACK OPIATES MARIJUANA OTHER DRUGS TOTAL
A-I FELONY 244 89.4% 17 6.2% 12 4.4% 0 .Ol- 0 .0% 273 100% A-II FELONY 1565 90.77. 67 3.9% 90 5.2% 2 .1% 2 .1% 1726 100% CLASS B FELONY 1677 47.3% 1349 38.0% 487 13.77. 10 .3% 23 .6% 3546 100% CLASS C FELONY 1363 39.4% 1452 41.9% 613 17.7% 23 • TI. 11 .3% 3462 100% CLASS D FELONY 1853 33.9% 2354 43.1% 1191 21.8% 20 .4% 50 .9% 5468 100% CLASS E FELONY 434 29.1% 744 49.9% 239 16.0% 8 .5% 67 4.5% 1492 100%
TOTAL 7136 44.7% 5983 37.5% 2632 16.5% '. 63 .4% 153 1. 0% 15967 100%
March 1991 Page 21
Undercustody Population Drug Offenders Committed to State Prison
The undercustody drug population differs little from the 1990 admission population discussed in section One. This is expected as 1990 commitments contributed heavily to the composition of the December 31, 1990 undercustody population. A minor variation between the undercustody and 1990 commitment populations mentioned earlier in this section, regarded the slightly higher proportion of second felony offenders in the undercustody drug population (see p.17).
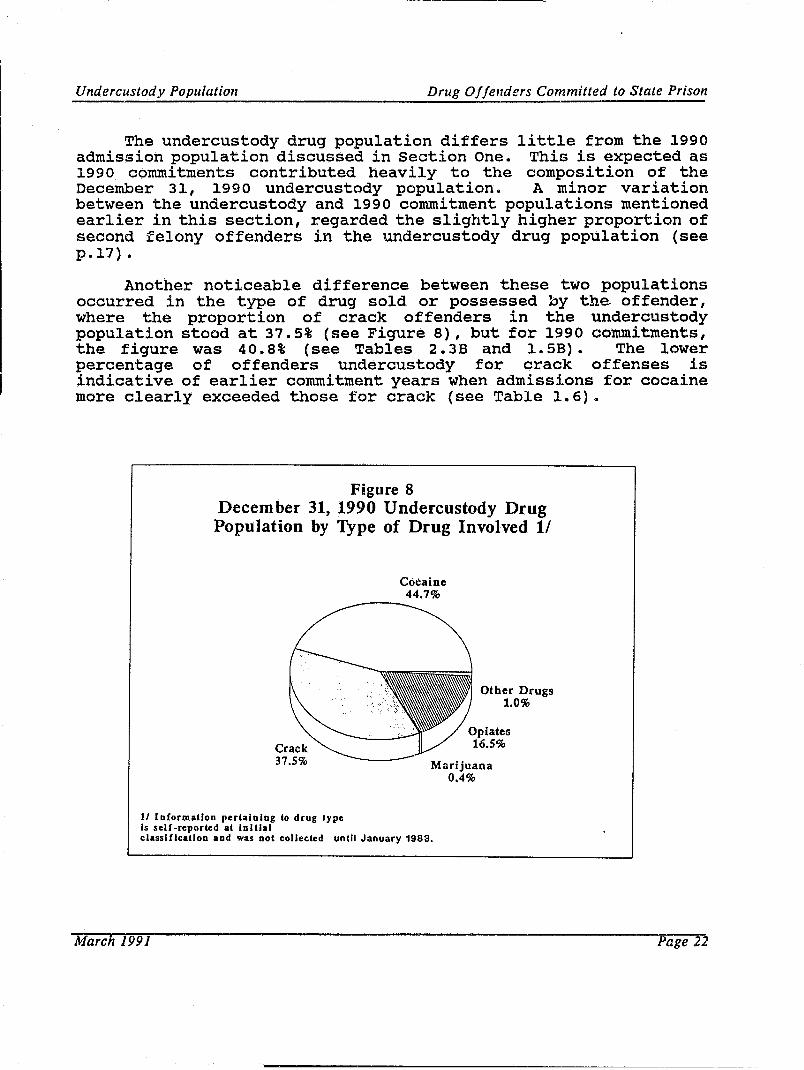
Another noticeable difference between these two populations occurred in the type of drug sold or possessed by the offender, where the proportion of crack offenders in the undercustody population stood at 37.5% (see Figure 8), but for 1990 commitments, the figure was 40.8% (see Tables 2.3B and 1.5B). The lower percentage of offenders undercustody for crack offenses is indicative of earlier commitment years when admissions for cocaine more clearly exceeded those for crack (see Table 1.6).
Figure 8 December 31, 1990 Undercustody Drug Population by Type of Drug Involved 11
Crack 31.5%
11 Information pertaining to drug type is self-reported at initial
Coeaine 44.1%
Other Drugs 1.0%
Marijuana 0.4%
classification and was not collected until January 1988.
March 1991 Page 22
First Releases to Parole Drug Offenders Committed to State Prison
SECTION THREE - FIRST RELEASES TO PAROLE 1987 -1990
The length of time drug offenders serve before first release to parole supervision is discussed in this section. Two types of time served data are presented here. First, the length of time an offender is incarcerated in state prison (state time served) and second, the total time an offender is imprisoned for the instant offense, which includes both state time and any time spent in jail prior to trial or sentencing (total time served).
1990 First Releases to Parole6
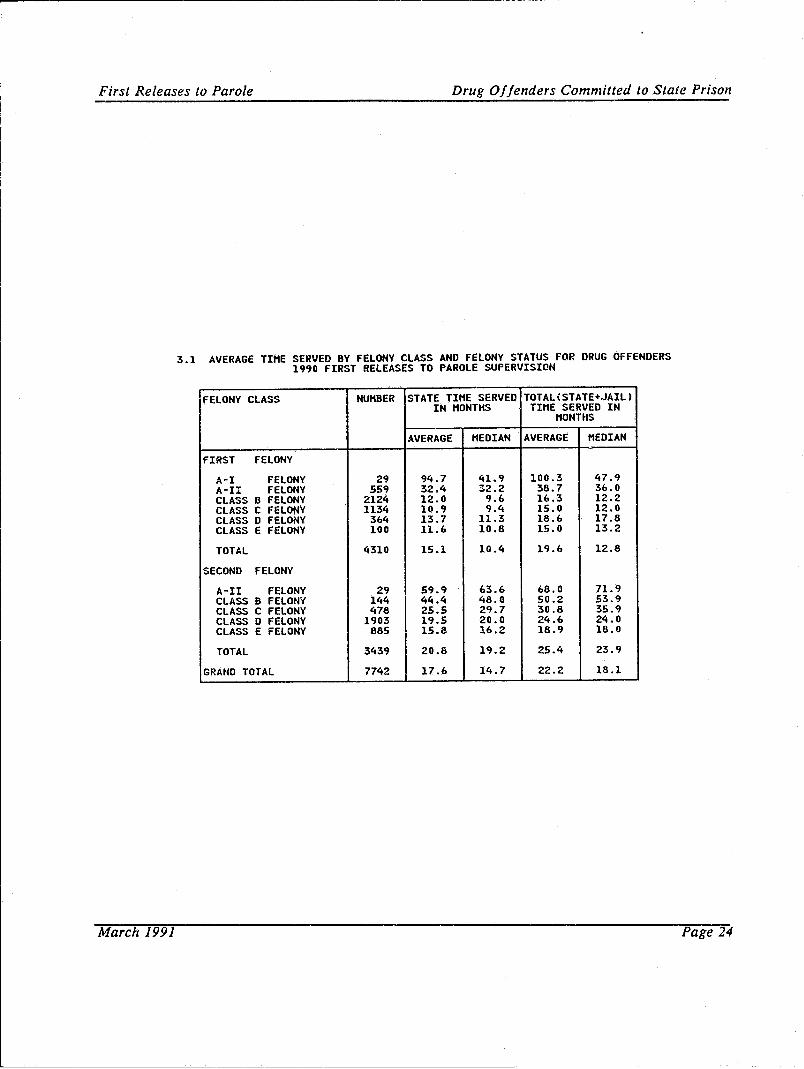
Time served data for drug offenders first released to parole supervision in 1990 appears in Table 3.1. Average total time served for all drug offenders in this table was 22.2 months. As would be expected, average total time served was higher for second felony offenders than for first felony offenders. For example, among second felony offenders imprisoned for class A-II and B offenses, average total time served was 68.0 and 50.2 months respectively, compared with first felony offenders who served 38.7 months for class A-II offenses and 16.3 months class B offenses. Overall, average total time served for first felony offenders was 19.6 months and for second felons, 25.4 monthso
6 A first release indicates either an inmate released to parole supervision by the Board of Parole after serving his minimum period of incarceration, or. a first release can indicate an inmate conditionally released to parole supervision after serving two-thirds of his maximum sentence.
March 1991 Page 23
First Releases to Parole Drug Offenders Committed to SLate Prison
March 1991
3.1 AVERAGE TIME SERVED BY FELONY CLASS AND FELONY STATUS FOR DRUG OfFENDERS 1990 FIRST RELEASES TO PAROLE SUPERVISION
fELONY CLASS NUMBER STATE TIME SERVED TOTAL(STATE+JAIL) IN MONTHS TIME SERVED IN
MONTHS
AVERAGE HEDIAN AVERAGE HEDIAN
fIRST FELONY
A-I FELONY 29 94.7 41.9 100.3 47.9 A-II FELONY 559 32.4 ~2.2 38.7 36.0 CLASS B fELONY 2124 12.0 9.6 16.3 12.2 CLASS C FELONY 1134 10.9 9.4 15.0 12.0 CLASS D FELONY 364 13.7 11.3 18.6 17.8 CLASS E FELONY 100 11.6 10.8 15.0 13.2
TOTAL 4310 15.1 10.4 19.6 12.8
SECOND FELONY
A-II FELONY 29 59.9 63.6 68.0 71.9 CLASS B FELONY 144 44.4 48.0 50.2 53.9 CLASS C FELONY 478 25.5 29.7 30.8 35.9 CLASS D FELONY 1903 19.5 20.0 24.6 24.0 CLASS E FELONY 885 15.8 16.2 18.9 18.0
TOTAL 3439 20.8 19.2 25.4 23.9
GRAND TOTAL 7742 17.6 14.7 22.2 18.1
PageU
First Releases to Parole Drug Ojjenders Committed to Slale Prisml
First Releases to Parole by Year
Examined below is the total time served experience of drug offenders across the last four release years.
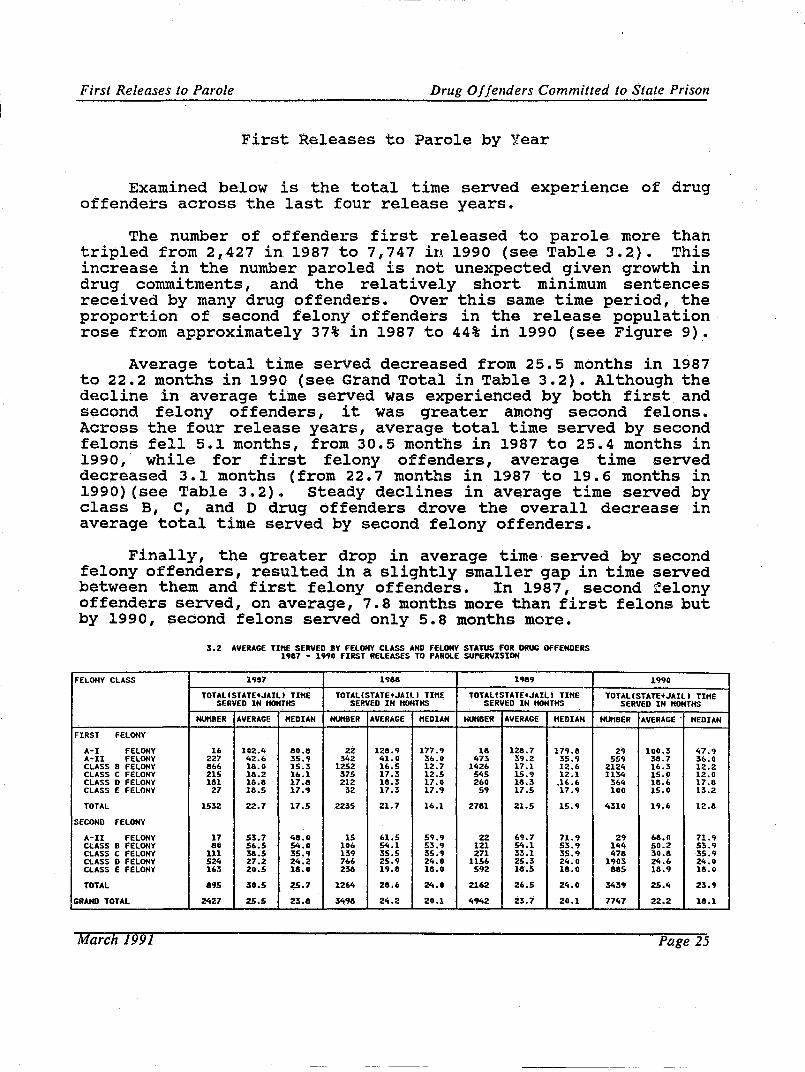
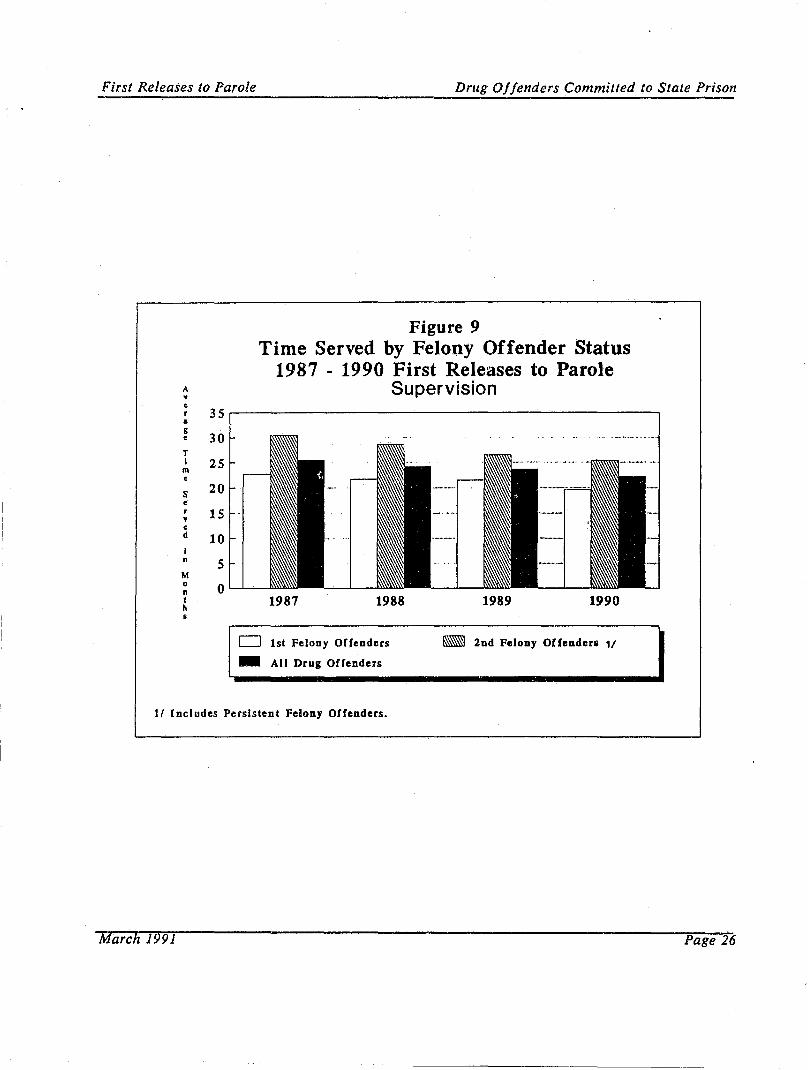
The number of offenders first released to parole more than tripled from 2,427 in 1987 to 7,747 ih 1990 (see Table 3.2). This increase in the number paroled is not unexpected given growth in drug coromi tments, and the relatively short minimum sentences received by many drug offenders. Over this same time period, the proportion of second felony offenders in the release population rose from approximately 37% in 1987 to 44% in 1990 (see Figure 9).
Average total time served decreased from 25.5 months in 1987 to 22.2 months in 1990 (see Grand Total in Table 3.2). Although the decline in average time served was experienced by both first and second felony offenders, it was greater among second felons. Across the four release years, average total time served by second felons fell 5.1 months, from 30.5 months in 1987 to 25.4 months in 1990, while for first felony offenders, average time served decreased 3.1 months (from 22.7 months in 1987 to 19.6 months in 1990) (see Table 3.2). Steady declines in average time served by class B, C, and D drug offenders drove the overall decrease in average total time served by second felony offenders.
Finally, the greater drop in average time· served by second felony offenders, resulted in a slightly smaller gap in time served between them and first felony offenders. In 1987, second felony offenders served, on average, 7.8 months more than first felons but by 1990, second felons served only 5.8 months more.
FELONV CLASS
FIRST FELONV
A-I FELONV A-II FELONV CLASS B FELONY CLASS C FELONV CLASS D FELONV CLASS E FELONV
TOTAL
SECOND FELONY
A-II FELONY CLASS B FELONV CLASS C FELONY CLASS D FELONY CLASS E FELONY
TOTAL
GRAND TOTAL
March 1991
3.2 AVERAGE TIHE SERVED BY FELONV CLASS AND FELONY STATUS FOR DRUG OfFENDERS 19B7 - 1990 FIRST RELEASES TO PAROlE SUPERVISION
1987 191111 19119
TOTALISTATEtJAILI TINE TOTALISTATEtJAILI TINE TOTAL(STATE+JAILI TINE SERVED IN HOHTNS SERVED IN NDNTNS SERVED IN HOHTNS
HUltBER AVERAGE NED IAN HUI1lIER AVERAGE NED IAN HUHBER AVERAGE NEDIAN
16 102." BO.II 22 1211.9 177.9 IB 1211.7 17'1.11 227 "2.6 35.'1 342 .. 1.0 36.0 .. 73 39.2 35.'1 BioI. 18.0 15.3 1252 16.5 12.7 1 .. 26 17.1 12.6 215 18.2 16.1 375 17.3 12.5 545 15.9 12.1 1111 1I~.1I 17.B 212 111.3 17.0 260 111.3 .16.6
27 18.5 17.9 32 17.3 17.9 59 17.5 17.'1
1532 22.7 17.5 2235 21.7 16.1 27111 21.5 15.9
17 53.7 "B.O IS 61.5 5'1.9 22 69.7 71.9 BO 56.5 54.0 106 54.1 53.9 121 54.1 53.9
111 311.5 35.9 139 35.5 35.'1 271 33.1 35.9 52 .. 27.2 2".2 766 25.9 2".0 1156 25.3 2".0 163 20.5 111.0 2311 19.11 111.0 592 111.5 IB.O
B95 30.5 25.7 1264 211.6 2 .... 2162 26.5 Z ... O
2427 25.5 23.B 34911 24.2 20.1 .. ""Z 23.7 20.1
1990
TOTALISTATE+JAILI TINE SERVED IN HONTNS
NUtlBER AVERAGE' NEDIAN
2'1 100.3 "7.'1 .559 311.7 36.0
2124 16.3 12.2 1134 15.0 12.0
364 IB.6 17.8 100 15.0 13.2
.. 310 l'I.6 12.B
29 68.0 71.9 1 .... 50.2 53.'1 .. 7B 30.B 35.'1
1903 24.6 2".0 N5 111.9 IB.O
3439 25 ... 23.9
7747 22.2 111.1
Page 25
First Releases to Parole Drug Offenders Committed to State Prison
A v c r
• g ~
T I m c
S c r
" c d
I n
M 0 n t h •
35
30
25
20
15
10
5
0
Figure 9 Time Served by Felony Offender Status
1987 - 1990 First Releases to Parole Supervision
1987 1988
o lst Felony Offenders
_ All Drug Offenders
1989 1990
_ 2nd Felony Offenders 11
11 Includes Persistent Felony Offenders.
March 1991 Page 26
First Releases to Parole Drug Offenders Committed to State Prison
Time Served Distribution for 1990 First Releases
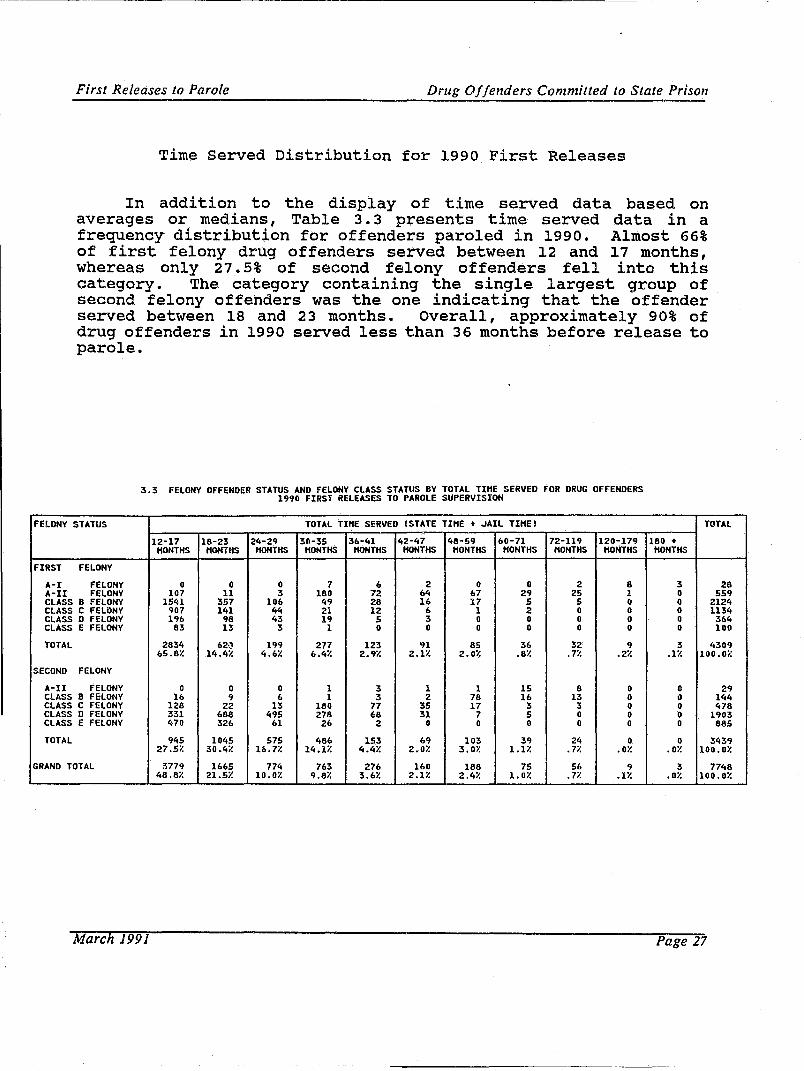
In addition to the display of time served data based on averages or medians, Table 3.3 presents time served data in a frequency distribution for offenders paroled in 1990. Almost 66% of first felony drug offenders served between 12 and 17 months, whereas only 27.5% of second felony offenders fell into this category. The category containing the single largest group of second felony offenders was the one indicating that the offender served between 18 and 23 months. Overall, approximately 90% of drug offenders in 1990 served less than 36 months before release to parole.
3.3 FELONY OFFENDER STATUS AND FELONY CLASS STATUS BY TOTAL TIHE SERVED fOR DRUG OFFENDERS 1990 FIRST RELEASES TO PAROLE SUPERVISION
FELONY STATUS TOTAL TIHE SERVED (STATE TIHE + JAIL TIHEI TOTAL
12-17 18-23 24-29 30-35 31>-41 42-47 48-59 (,0-71 72-1'19 120-179 180 + HONTHS HONTHS HONTHS HONTHS HOtITHS HOtITHS HONTHS HONTHS HONTHS HONTHS HONTHS
FIRST fELONY
A-I FELONY 0 0 0 7 I> 2 0 0 2 8 3 28 A-II FELONY 107 11 3 180 72 1>4 1>7 29 25 1 0 559 CLASS B FELONY 1541 357 101> 49 28 II> 17 5 5 CJ 0 2124 CLASS C FELONY 907 141 44 21 12 6 1 2 0 C 0 1134 CLASS 0 FELONY 196 98 43 19 5 3 0 0 0 0 0 31>4 CLASS E FELONY 83 13 3 1 0 0 0 0 0 0 0 100
TOTAL 2834 62'~ 199 277 123 91 85 36 32 9 3 4309 1>5.8% 14.4% 4.1>% 1>.4% 2.9% 2.1% 2.0% .8% .7% .2% .1% 100.0%
SECOND FELONY
A-II FELONY 0 0 0 1 3 1 1 15 8 0 0 29 CLASS B FELONY 16 9 6 1 3 2 78 16 13 0 0 144 CLASS C FELONY 128 22 13 180 77 35 17 3 3 0 0 478 CLASS 0 FELONY 331 688 495 278 68 31 7 5 0 0 0 1903 CLASS E FELONY 470 326 61 26 2 0 0 0 0 0 0 885
TOTAL 945 1045 575 486 153 69 103 39 24 0 0 3439 27.5% 30.4% 16.7% 14.1% 4.4% 2.0% 3.0% 1.1% .7% .0% .0% 100.0%
GRAND TOTAL 3779 1665 774 763 276 160 188 75 56 9 3 7748 48.8% 21.5% 10.0% 9.8% 3.6% 2.1% 2.4% 1.0% .7% .1% .0% 100.0%
March 1991 Page 27
Conclusion Drug Offenders Committed to State Prison
CONCU;SION
This report presented a legal history profile of three populations of drug offenders sentenced to DOCS. Among those committed for drug offenses during the 1987 through 1990 admission years, it was noted that first felony offenders tended to be sentenced for more serious felony class offenses than second felony offenders. This commitment pattern most likely reflects the practice of sentencing many first felony offenders convicted of minor drug felonies to probation or jail, rather than state prison. For those with a prior.felony conviction, a current conviction for even the most minor drug felony mandates a state prison term.
Another trend identified in the 1987 - 1990 drug commitment population was a slight decline in average minimum sentence, from 31.7 months in 1987 to 29.4 months in 1989. The decrease in average minimum sentence was attributed to the influx of those committed for lower felony class crack offenses.
Examination of drug offenders first released to parole supervision from 1987 through 1990, revealed that average total time served decreased, especially for second felony offenders. The decline in average total time served may be attributed to several factors; for example, the large numbers of crack offenders sentenced for lower felony class offenses and state prison program participation. 6
Since admissions for drug offenses expanded rapidly in recent years and drug offenders serve relatively short sentences in state prison, the profile of the December 31, 1990 undercustody drug population varied little from the profile drawn of the 1990 drug commitment population.
6 The Earned Eligibility Program provides for the release of inmates at their parole eligibility date, if they satisfactorily complete certain prescribed programs (see Earned Eligibility Program: July 1987 through September 1990. New York State Department of Correctional Services, December 1990). The Shock Incarceration Program permits early release to parole supervision for inmates successfully completing a six month program of intensive physical training, counseling and drug treatment (see The Third Annual Report to the Legislature: Shock Incarceration in New York State. New York State Department of Correctional Services, January 1991).
March 1991 Page 28
Conclusion Drug Ojjenders Committed to State Prison
Once again it should be emphasized that this report covers only the legal characteristics of certain drug offender populations. Further reports, such as one covering offender demographics, are needed to develop a more comprehensive profile of the drug offender sentenced to state prison.
. .
March 1991 Page 29
----------- ~~~~~-
Appendix A Drug Offenders Committed to State Prison
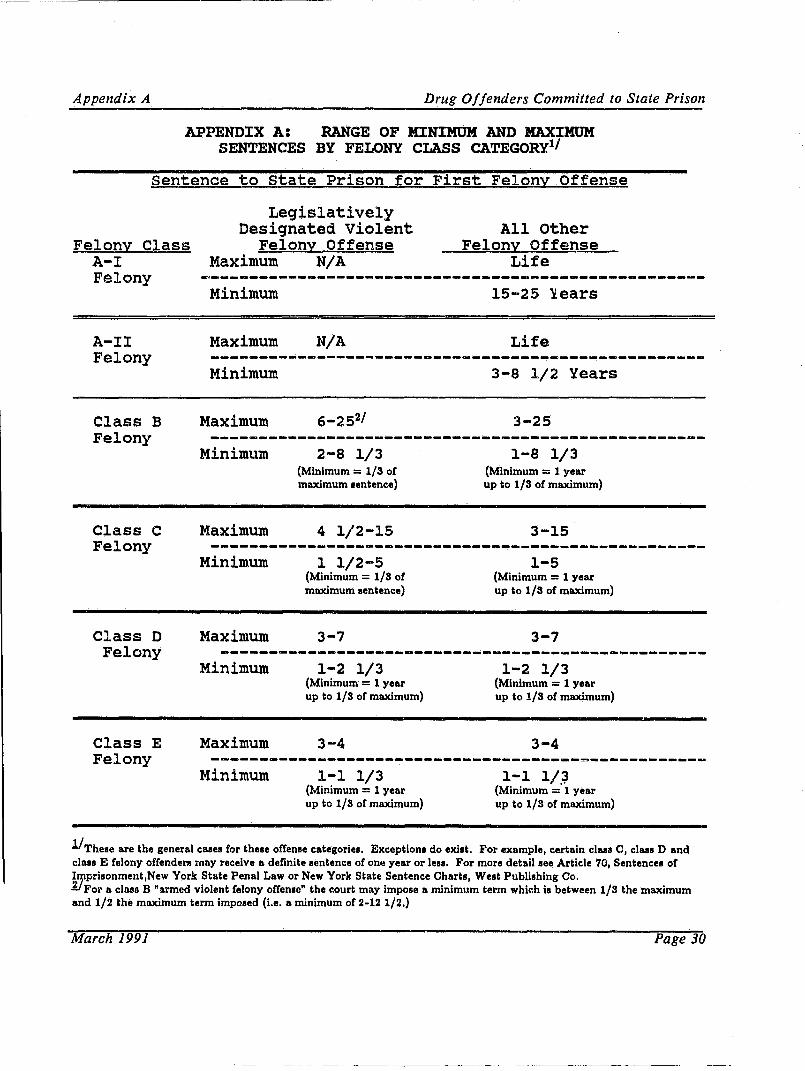
APPENDIX A: RANGE OF MINIMUM AND MAXIMUM SENTENCES BY FELONY CLASS CATEGORy11
sentence to state Prison for First Felony Offense
Felony Class A-I Felony
A-II Felony
Class B Felony
Class C Felony
Class D Felony
Class E Felony
Legislatively Designated Violent
Felony Offense Maximum N/A
Minimum
Maximum N/A
All Other Felony Offense
Life
15-25 lears
Life ---------------------------------------------------Minimum
Maximum
Minimum
Maximum
2-8 1/3 (Minimum = 1/3 of maximum .entence)
4 1/2-15
3-8 1/2 Years
3-25
1-8 1/3 (Minimum = 1 year up to 1/3 of maximum)
3-15 ---------------------------------------------------
Minimum
Maximum
Minimum
Maximum
Minimum
1 1/2-5 (Minimum = 1/3 of maximum lIentence)
3-7
1-2 1/3 (Minimum = 1 year up to 1/8 of maximum)
3-4
1-1 1/3 (Minimum = 1 year up to 1/8 of maximum)
1-5 {Minimum = 1 year up to l/S of maximum}
3-7
1-2 1/3 (Minimum = 1 year up to 1/3 of maximum)
3-4
1-1 1/.~ (Minimum = 1 year up to 1/8 of maximum)
11 These are the general cases for these offense categoriell. Exception. do exist. For example, certain clase C, class D and clasll E felony offenders may receive a definite sentence of one year or lells. For more detail lee Article 70, Sentence! of !~pri8onment,New York State Penal Law or New York State Sentence Charts, West Publishing Co. YFor a class B "armed violent felony ofCenle" the r.ourt may impole a minimum term which is between 1/8 the maximum and 1/2 the maximum term imposed (i.e. a minimum of 2-12 1/2.)
March 1991 Page 30
Appendix A Drug Offenders Committed to State Prison
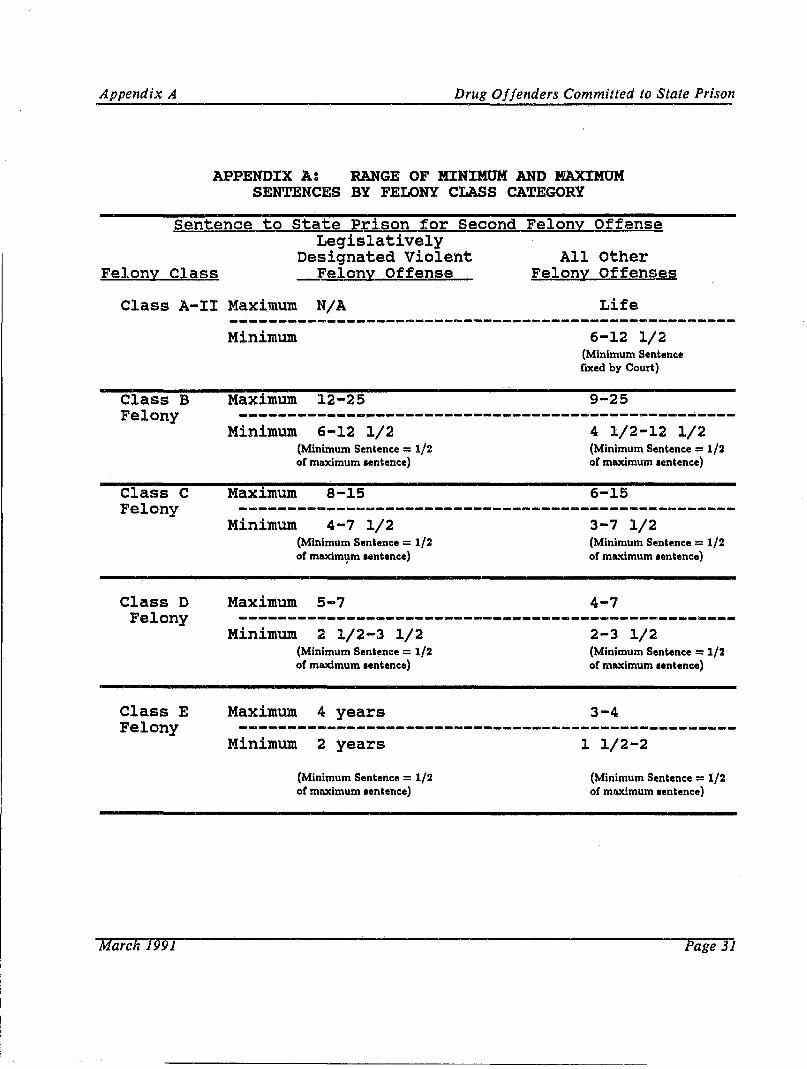
APPENDIX A: RANGE OF MINIMUM AND MAXIMUM SENTENCES BY FELONY CLASS CATEGORY
sentence to state Prison for Second Felony Offense Legislatively
Designated Violent Felonv Class Felony Offense
All Other Felony Offenses
Class A-II Maximum N/A Life
Class B Felony
Class C Felony
Class D Felony
Class E Felony
March 1991
------------------~-----------------------~---------Minimum
Maximum 12-25
Minimum 6-12 1/2 (Minimum Sentence = 1/2 of maximum lentence)
Maximum 8-15
Minimum 4-7 1/2 (Minimum Sentence = 1/2 of maxim,;,m lentence)
Maximum 5-7
6-12 1/2 (Minimum Sentence fIXed by Court)
9-25
4 1/2-12 1/2 (Minimum Sentence = 1/2 of maximum lentence)
6-15
3-7 1/2 (Minimum Sentence = 1/2 of mL'Cimum .entence)
4-7
------------------------~----------------------~---Minimum 2 1/2-3 1/2 (Minimum Sentence = 1/2 of maximum lentence)
Maximum 4 years
Minimum 2 years
(Minimum Sentence = 1/2 of maximum lentence)
2-3 1/2 (Minimum Sentence = 1/2 of maximum lentence)
3-4
1 1/2-2
(Minimum Sentence = 1/2 of maximum lentence)
Page 31
Appendix A Drug Offenders Committed to State Prison
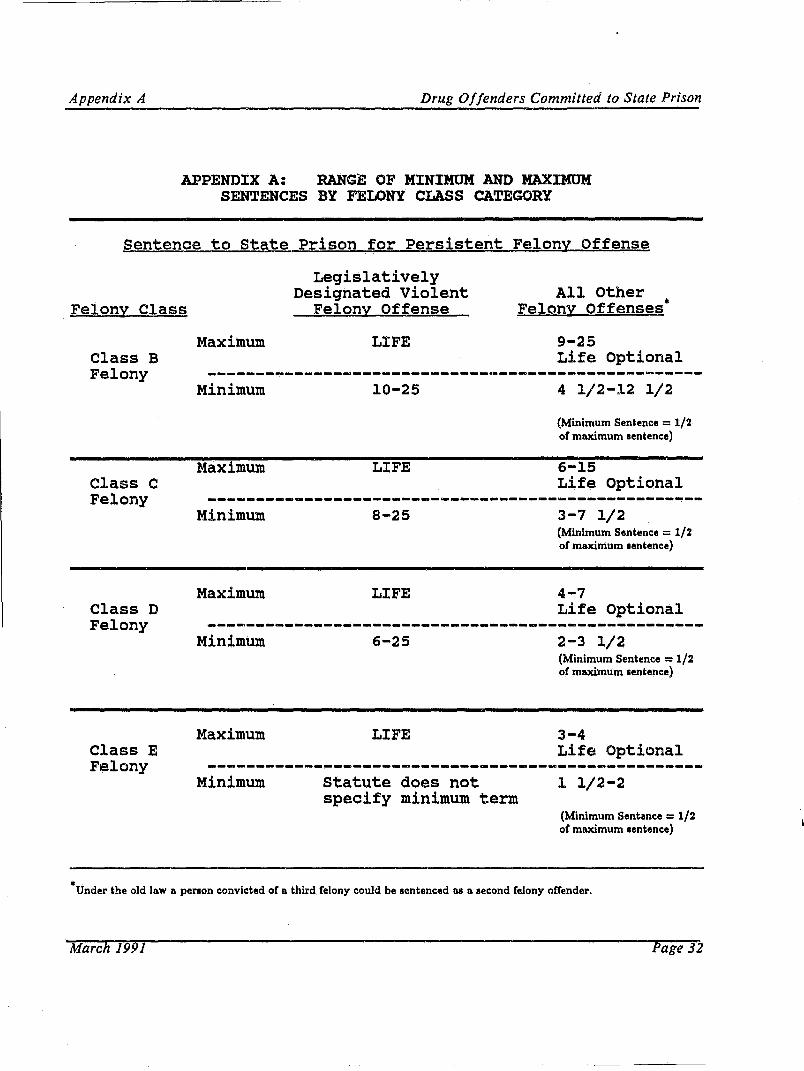
APPENDIX A: RANGE OF MINIMUM AND MAXIMUM SENTENCES BY FELONY CLASS CATEGORY
sentence to state Prison for Persistent Felony Offense
Felony Class
Class B Felony
Class C Felony
Class D Felony
Class E Flelony
Maximum
Legislatively Designated Violent
Felony Offense
LIFE
All Other Felony Offenses •
9-25 Life optional
---------------------------------------------------Minimum 10-25
Maximum LIFE
4 1/2-12 1/2
(Minimum Sentence = 1/2 of maximum sentence)
6-15 Life optional
---------------------------------------------------Minimum
Maximum
Minimum
Maximum
Minimum
8-25
LIFE
6-25
LIFE
Statute does not specify minimum term
3-7 1/2 (Minimum Sentence = 1/2 of maximum lentence)
4-7 Life Optional
2-3 1/2 (Minimum Sentence = 1/2 of maximum lentence)
3-4 Life Optional
1 1/2-2
(Minimum Sentence = 1/2 of maximum sentence)
·Under the old law a penon convicted of a third felony could be lIentenced as a second felony ()ffender.
March 1991 Page 32

![The Mekelle Prison Project · of highly committed prison managers fully engaged in supporting the inmates by providing skills training, DECSI was able to start WYV]PKPUN TPJYVÄUHUJL](https://static.fdocuments.us/doc/165x107/5e77cba9459acc3dbb3d2677/the-mekelle-prison-project-of-highly-committed-prison-managers-fully-engaged-in.jpg)