Drug analysis by mass spectrometry
186
A thesis Doctor DRUG ANALYSIS BY MASS SPECTROMETRY sented for the degree of Philosophy in Chemistry in the University of Canterbury, Christchurch, New Zealand by David Winter 1986
Transcript of Drug analysis by mass spectrometry
A thesis
Doctor
DRUG ANALYSIS BY
MASS SPECTROMETRY
sented for the degree of
Philosophy in Chemistry
in the University of Canterbury,
Christchurch, New Zealand
by
David Winter
1986

! ~~6 ABSTRACT
1. The pharmacokinetics of morphine have been measured in
four patients with renal failure and three healthy
volunteers following intramuscular administration of
papaveretum. Morphine blood levels were determined
using GCMS with specif ion monitoring. The
significantly shorter drug elimination half-life found
for the patients suggests that renal failure does not
impair the elimination of morphine.
2. A CI GCMS assay with specific ion monitoring has been
developed for measuring the anti parkinsonian drug
benztropine in post-mortem specimens. The assay is
potentially more sensitive than a similar assay using
electron impact ionisation.
3. The level of atropine in an aqueous extract of Datura
stramonium has been measured by GCMS with selected ion
monitoring. The results show that such an extract
will contain most the atropine present in the plant
material. The levels are such that several medium
sized glassfuls will contain sufficient atropine to
constitute a dangerous drug dose.
4. A Hewlett-Packard 5982A GCMS has been successfully
modified to allow it to be used to record in-beam
2 7 JU L 2004

mass with a commercially available DCI probe.
The effectiveness of these modifications is discussed
and mass spectra of some physiologically
active compounds are presented.
CHAPTER 1
CHAPTER 2
CONTENTS
INTRODUCTION
1.1 Drug Analysis by Mass Spectrometry
1.2 The HP5982A GCMS
1.3 Modifications to the HP5982A GCMS
MORPHINE DISPOSITION DURING RENAL FAILURE
INTRODUCTION
2.1 Morphine
1
4
8
12
2.2 Morphine Disposition During Renal Failure 13
2.3 This Work 17
RESULTS AND DISCUSSION
2.4 Analytical Methods
2.4.1 Discussion
Procedures
Preparative
19
2.4.2 Derivative Formation 21
2.4.3 Extraction'Method for Morphine 21
2.4.4 Hydrolysis of Conjugated Morphine 24
2.4.5 Mass Spectrometry of Derivatised
Morphine 25
2.4.6 Instrument Preparation 30
2.4.7 Quantitative GCMS Analysis 32
2.5 Patient Study
2.5.1 Patients and Healthy Volunteers 38
2.5.2 Clinical Protocol
2.5.3 Analysis of Serum Samples
40
41

CHAPTER 3
2.6 Pharmacokinetic Analysis
2.6.1 Selection of a Model for Unchanged
Morphine
2.6.2 Pharmacokinetic Parameters for
Unchanged Morphine
2.6.3 Statistical Analysis for Unchanged
53
55
Morphine 57
2.6.4 Pharmacokinetic Interpretation 63
2.6.5 This Work and The Renal Hypothesis 67
2.7 Conclusion
A CI GCMS ASSAY FOR BENZTROPINE
INTRODUCTION
3.1 Benztropine
3.2 Analytical Methods For Benztropine
3.3 This Work
RESULTS AND DISCUSSION
73
74
76
78
3.4 Discussion of Preparative Procedures 79
3.5 Extraction Methods for Benztropine 81
3.6 Gas Chromatography 84
3.7 Mass Spectrometry of Benztropine 84
3.8 GCMS Analysis 90
3.9 Interference by.other Drugs 94
3.10 Interpretation of Results 96

CHAPTER 4
CHAPTER 5
THE ATROPINE CONCENTRATION OF AN AQUEOUS
DATURA EXTRACT
INTRODUCTION
4.1 Datura Stramonium
4.2 Poisoning by Datura Stramonium
4.3 This Work
RESULTS AND DISCUSSION
98
98
99
4.4 Discussion of Preparative Procedures 101
4.5 Plant Material 101
4.6 Preparation of an Aqueous Plant Extract 103
4.7 Soxhlet Extraction of Plant Material 104
4.8 Gas Chromatography of Atropine and
Scopolamine
4.9 Mass Spectrometry of Atropine and
Scopolamine
4.10 Analysis of Plant Material
4.11 Interpretation of Results
4.12 Conclusion
ANALYSIS OF INVOLATILE COMPOUNDS WITH THE
HP5982A GCMS
INTRODUCTION
5.1 Mass Spectrometry of Involatile And
104
104
106
110
112
Thermally Labi Compounds 113

CHAPTER 6
5.2 Desorption Electron Ionisation
and Desorption Chemical Ionisation 114
5.3 This Work 118
RESULTS AND DISCUSSION
5.4 Probe Installation
5.4.1 General Considerations 121
5.4.2 The DCI Probe 121
5.4.3 Solid Probe Insertion Lock 123
5.4.4 Ion Source Modifications 123
5.4.5 Initial Probe Set-up 125
5.5 Evaluation of Modifications 126
5.6 In-Beam Operating Parameters 128
5.7 Selected DEI and DCI Mass Spectra 130
5.7.1 Barbitone and Amobarbitone 130
5.7.2 Meprobamate and Ephedrine 130
5.7.3 Dicorhabdin C and Discorhabdin A 133
5.7.4 Morphine-3-g1ucuronide
5.8 Conclusion
EXPERIMENTAL METHODS
6.1 General
6.1.1 Reagents
6.1.2 Biological Material
6.1.3 Glassware
6.1. 4 Instrumentation
6.1.5 Mass Spectra
135
137
138
138
139
139
140
140

6.2 Experimental Section Relating To Chapter 2
6.2.1 Preparative Procedures
6.2.2 Preparation of Calibration
Standards
6.2.3 Determination of Solvent Extraction
Efficiency
6.2.4 Extraction of Morphine from Serum
and Plasma
6.3 Experimental Section Relating To Chapter 3
6.3.1 Preparative Procedures
6.3.2 Preparation of Calibration
Standards
6.3.3 Determination of Solvent Extraction
Efficiency
6.3.4 Extraction of Benztropine from
141
142
143
143
144
147
147
Post-mortem Blood 148
6.3.5 Extraction of Benztropine from
Post-mortem Liver
6.4 Experimental Section Relating To Chapter 4
6.4.1 Preparative Procedures
6.4.2 Preparation of Calibration
Standards
6.4.3 Preparation of Aqueous Plant
Extract
6.4.4 Extraction of Aqueous Plant
Extract
6.4.5 Soxhlet Extraction of Plant
Material
148
149
150
151
151
151

ACKNOWLEDGEMENTS
REFERENCES
APPENDIX A
APPENDIX B
APPENDIX C
153
158
174
175
177

CHAPTER 1
INTRODUCTION
1.1 Drug Analysis By Mass Spectrometry
1
Mass spectrometry is a powerful instrumental method for
chemical analysis. The information contained in a single
mass spectrum, recorded using very small amounts of sample,
will often allow the unambiguous identification or
structural elucidation of an unknown compound. The
development of ionisation techniques which remove the
requirement that the sample be vaporised be~ore ionisation
has made a whole range of compounds of biomedical and
biochemical importance amenable to mass spectrometric
analysis.
The high sensi vity and specificity of the mass
spectrometer are enhanced by using a gas chromatograph as
the mass spectrometer inlet, and" combined gas
chromatography-mass spectrometry (GCMS) is one of the most
powerful analytical techniques available today. The
combination of the very high sensitivity and specificity of
GCMS is unobtainable even with highly sensitive
immunological techniques. A number of major developments
have occurred in recent years in GCMS methodology. These
include the direct coupling ot capillary gas chromatographic
columns to mass spectrometers, the widespread availability
of ion sources for chemical ionisation, and the increasing
use of isotopically labelled internal standards in assays
using quantitative selected ion monitoring (QSIM).
Capillary columns offer two main advantages over packed
columns. An assay sensitivity is greatly increased by using

a capillary column, and separations of components in a
complex mixture that were previously unobtainable with
packed columns can often be performed almost routinely.
2
Chemical ionisation (CI), although it has some disadvantages, is
well suited for many analyses. The intense peaks usually
seen in the molecular ion region of a Cl spectrum will
often allow rapid identification of an unknown compound.
The ions producing these peaks can also be monitored in a Cl
QSlM assay for the compound, often giving greater
sensitivity and specificity than is possible in a similar
assay using electron impact (El) ionisation. Stable
isotopically-labelled analogues of compounds to be measured
come closest to meeting the characteristics of ideal
internal standards. These compounds behave almost
identically to the analyte throughout the extraction,
chromatographic separation and ionisation processes, so that
the weight ratio of the added internal standard to analyte
will remain unaffected by any of these operations.
This thesis is concerned with drug analysis by mass
spectrometry. The detection and identification of drugs and
their metabolites, often at very low levels in a complex
biological matrix such as blood, can be a very difficult and
demanding task. Mass spectrometry is often the only
analytical method with the necessary sensitivity and
specificity to unambiguously identify and then measure the
analyte. The first three sections of this thesis describe
the application of GCMS facilities available in the
Chemistry Department at the University of Canterbury to
three specific drug-related problems. The first section
describes a study of morphine pharmacokinetics in patients

3
with renal failure. Plasma morphine concentrations in four
patients with renal failure and in three healthy volunteers
were measured using CI QSIM, and morphine pharmacokinetics
in the two groups compared. The second on describes
the development of a CI QSIM assay for measuring the
anti parkinsonian drug benztropine in post-mortem specimens.
This assay was developed for use by a nearby Government
laboratory which had reported difficulties in detecting this
drug. The third section describes the measurement of the
atropine concentration in an aqueous extract prepared from
the Solanaceous plant Datura stramonium. There is an
increasing incidence of intoxication and poisoning following
abuse of preparations from this plant and was of interest
to determine level of atropine likely to be present in
aqueous Datura stramonium extracts.
The fourth and final section of the thesis is concerned
with drug analysis by mass spectrometry using a heated
probe. There are a significant number of biochemically
important compounds which are not sufficiently volatile or
which are too thermally labile to be analysed using a,
conventional heated solids probe. Desorption chemical
ionisation (DCI) and desorption electron ionisation (DEI)
are two simi techniques which have recently been
developed for obtaining spectra of such compounds. This
section describes modifications made to a quadrupole mass
spectrometer to allow it to be used with a commercially
available DCI probe.

4
1.2 The HP5982A GCMS
The work described in this thesis was carried out using
a Hewlett-Packard 5982A GCMS. This is a quadrupole
instrument with an ion source that can be configured for
either EI or CI operation. Reconfiguring the source
physically changes the ion chamber and can be accomplished
without breaking the source vacuum. The mass filter is
actually a "dodecapole " because it has four pairs of tunable
electrodes or "blades" between the cylindrical quadrupole
rods (Figure 1). These blades modify the electric f Id
produced by the radio frequency and direct current voltages
applied to the rods so that it approximates the f Id which
would be generated by an hyperbo c rod assembly. The mass
spectrometer is pumped differentially by two high capacity
oil diffusion pumps. Each diffusion pump is backed by a
mechanical rotary pump. Samples are admitted to the mass
spectrometer via two gas chromatographic column inlets, or
through a direct insertion probe (DIP) let using a batch
inlet probe or a heated solids probe. The CI reagent gas is
admitted through the DIP inlet, or through the
chromatographic column inlets when it is the GC carrier gas.
Mass spectra can be recorded over the mass range 3-1000
atomic mass units, or up to four separate ions monitored
using a multiple ion detector. Spectra are recorded with a
light-beam oscillograph on light sensitive chart paper, and
selected ion chromatograms are recorded with a conventional
chart recorder connected to the multiple ion detector. A
block diagram of the instrument is presented in Figure 2.

Figure 1. Cross
the HP5982A GCMS
filter
COLUMN B
COLUMN A
section agram of
dodecapole mass
VACUUM SENSOR GAUGE
5
. ION SOURCE MANI FOLD ION GAUGE TUBE
VACUUM SENSOR
TRAP tWATER
GAUGE 60RELINE
OUT
FORE PlJMP VAPOR
DIFFUSION PUMP
VAPOR DIFFUSION PUMP
Figure 2. Block diagram of the HP5892A GCMS

6
Several substant 1 modifications were made to the
HP5982A GCMS used for the work described in this thesis.
These changes were largely to the mass spectrometer ion
source. To aid in describing these modifications in later
sec ons a detailed description of the original ion source
is given here.
Exploded-view scale drawings of the ion source are
presented in Figures 33 to 35. The source proper is housed
inside a gold plated shroud (1) containing the source
heater, which is controlled by a thermocouple (2), and two
electron beam collimating magnets (3). Attached to the
shroud is the entrance lens (4) which injects ions from the
source into the quadrupole mass analyser. The EI ion
chamber is a circular cavity in the ion chamber body (5) to
which is attached the electron filament assembly (6) and the
electron trap assembly (7). The ion chamber has four
apertures, one each for the electron beam entrance, the
electron beam exit, the inlet for the first GC column, and a
combined DIP inlet and inlet for the second GC column. The
GC column effluents are delivered to their respective inlets
via glass-lined stainless steel tubes (8), and DIP which
is introduced into the source via the solids probe insertion
lock is correctly positioned near the ion chamber by the DIP
sleeve (9). The plunger assembly (10), mounted on a support
shaft (11) and held in position by a screw (12), houses the
CI ion chamber. The chamber is formed by the repeller (13),
the ion exit (14) and a spacer (15). These components are
electrically insulated from the plunger body by two ceramic
insulators (16) and are held in position by a lock ring
(17). A needle assembly (18) makes electrical contact with
7
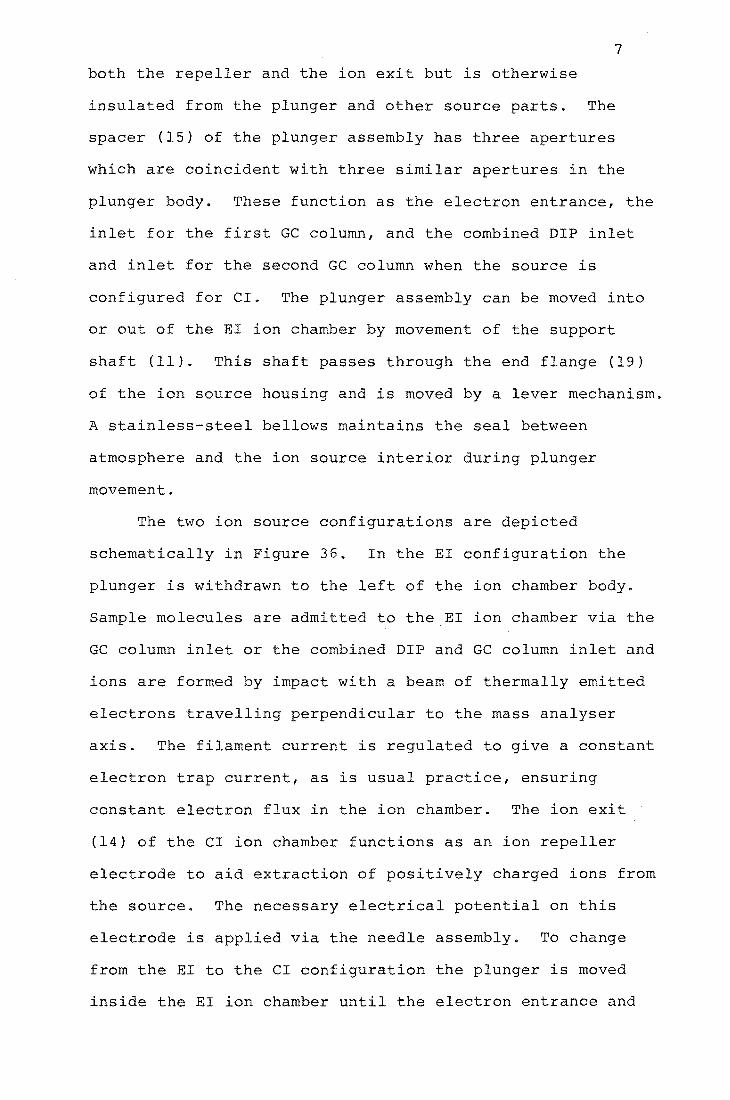
both the ller and the ion exit but is otherwise
insulated from the plunger and other source parts. The
spacer (15) of the plunger assembly has three apertures
which are coincident with three similar apertures in the
plunger body. These function as the electron entrance, the
inlet for the first GC column, and the combined DIP inlet
and inlet for the second GC column when the source is
configured for CIa The plunger assembly can be moved into
or out of the EI ion chamber by movement of the support
shaft (11). This shaft passes through the end flange (19)
of the ion source housing and is moved by a lever mechanism.
A stainless-steel bellows maintains the seal between
atmosphere and the ion source interior during plunger
movement.
The two ion source configurations are depicted
schematically in Figure 36. In the EI configuration the
plunger is withdrawn to the left of the ion chamber body.
Sample molecules are admitted to the EI ion chamber via the
GC column inlet or the combined DIP and GC column inlet and
ions are formed by impact with a beam of thermally emitted
electrons travelling perpendicular to the mass analyser
axis. The filament current is regulated to give a constant
electron trap current, as is usual practice, ensuring
constant electron flux in the ion chamber. The ion exit
(14) of the CI ion chamber functions as an ion repeller
electrode to aid extraction of positively charged ions from
the source. The necessary electrical potential on this
electrode is applied via the needle assembly. To change
from the EI to the CI configuration the plunger is moved
inside the EI ion chamber until the electron entrance and
8
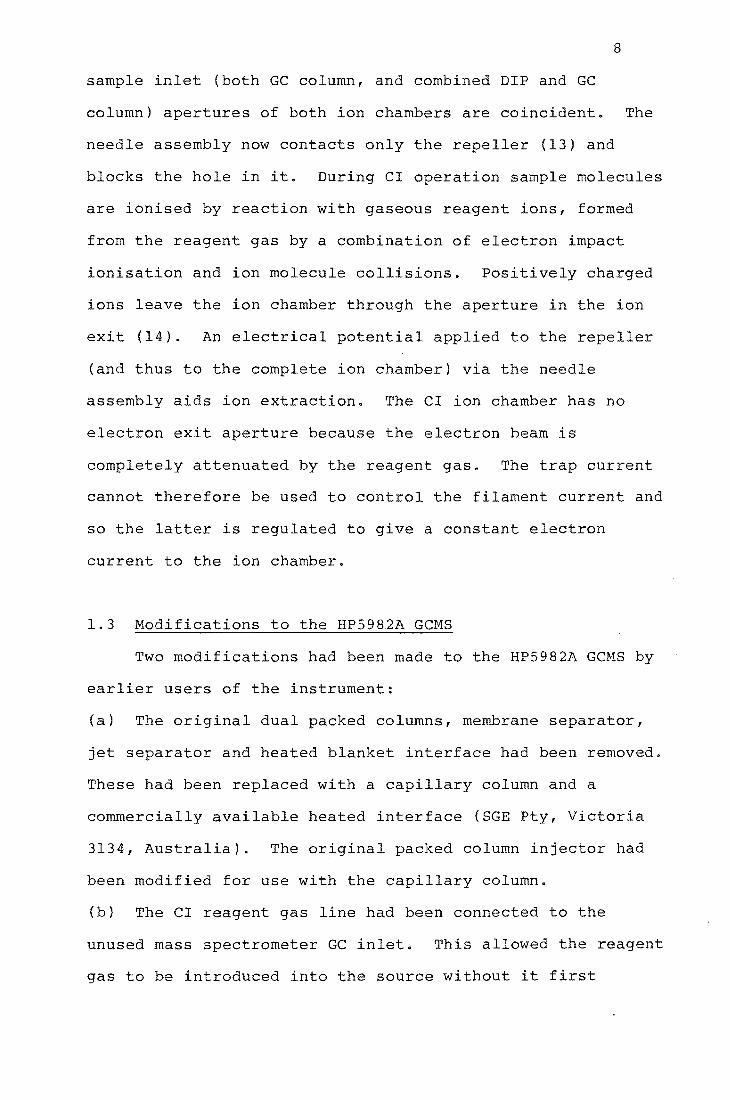
sample inlet (both GC column, and combined DIP and GC
column) apertures of both ion chambers are coincident. The
needle assembly now contacts only the repeller (13) and
blocks the hole in it. During CI operation sample molecules
are ionised by reaction with gaseous reagent ions, formed
from the reagent gas by a combination of electron impact
ionisation and ion molecule collisions. Positively charged
ions leave the ion chamber through the aperture in the ion
exit (14). An electrical potential applied to the repeller
(and thus to the complete ion chamber) via the needle
assembly aids ion extraction. The CI ion chamber has no
electron exit aperture because the electron beam is
completely attenuated by the reagent gas. The trap current
cannot therefore be used to control the lament current and
so the latter is regulated to give a constant electron
current to the ion chamber.
1.3 Modifications to the HP5982A GCMS
Two modifications had been made to the HP5982A GCMS by
earlier users of the instrument:
(a) The original dual packed columns, membrane separator,
jet separator and heated blanket interface had been removed.
These had been replaced with a capillary column and a
commercially available heated interface (SGE pty, Victoria
3134, Australia). The original packed column injector had
been modified for use with the capillary column.
(b) The CI reagent gas line had been connected to the
unused mass spectrometer GC inlet. This allowed the reagent
gas to be introduced into the source without it first

passing through the GC column when CI spectra of probe
samples were being recorded.
9
When this work began considerable difficulty was
experienced with two needle valves in the SGE heated
interface between the gas chromatograph and the mass
spectrometer. These valves, one for isolating the mass
spectrometer from the gas chromatograph and the other for
controlling the gas flow passing through the interface, were
found to leak. Further problems were encountered with
cracks developing in the glass-lined metal tube (8) inside
the source which delivers the GC column effluent to the EI
and CI ion chambers (in the modified instrument one glass
lined tube carries the CI reagent gas). These cracks
exposed the column effluent to a bare metal surface, causing
a dramatic loss in sensitivity when measuring trace amounts
of analyte. In an attempt to solve these problems the
capillary column was fed directly into the source (bypassing
the two troublesome valves) and through the glass-lined tube
to within 1 cm of the ion chamber. Unfortunately, the
sharp bends in the glass-lined tube placed considerable
strain on the column, causing it to break frequently. This
also occurred when the glass-lined tube was replaced with an
all-glass tube of the same dimensions but having bends of a
slightly larger radius. The following modifications to the
source were therefore made. A 6 mm diameter hole was cut in
the side of the source mounting ring (20) and similar holes
were cut in the source sealing shoe shim springs (21). The
hole in the ion chamber body (5) and the hole in the source
sealing shoe (22), both for receiving the original
glass-lined tube carrying the column effluent, were
10
counter-bored to a diameter of 3.97 mrn. A short length of 4
mrn Teflon tubing was passed down through the ion chamber
body supporting cylinder (23) and through the new holes in
the source mounting ring and in the shim springs. One end
of the Teflon tubing was pushed tightly into the enlarged
hole in the ion chamber body and the other end was pushed
tightly into the enlarged hole in the source sealing shoe.
The unused hole in the ion chamber body (which in the
modified instrument was the entry port for the CI reagent
gas) was blocked off with a short length of stainless steel
rod. The ion source was then reassembled and returned to
the instrument. The external inlet for the second column
was capped, and the capillary column was fed into the
remaining in , through the Teflon tubing, which acted as a
guide, and directly into the ion source. A T-connector at
the external inlet allowed the CI reagent gas to enter at
this point and flow through the Teflon tubing (and around
the column) and into the ion chamber:
In any assay using QSIM it is important to ensure that
the mass spectrometer is set to monitor the correct m/z
values, and that there is no drift from these values once
they are set. Each channel of the HP5982A's multiple ion
detector (MID) supplies a tuning voltage of a to +10 volts
to control the mass spectrometer over the mass range a to
1000 atomic mass units. The four (or less) masses to be
monitored are selected by adjusting four ten-turn
potentiometers on the MID's front panel. The selected mass
is displayed on a digital voltmeter (DVM). In this work,
setting the required masses on the MID as originally
supplied proved difficult. The large mass range covered by
11
each turn of the mass selection potentiometers meant that
considerable care was required in adjusting these controls.
Also, the last digit on the DVM displaying the selected
masses was difficult to read and changed frequently,
although numerous checks of the MID output voltages showed
them to be stable. To solve these difficulties a new DVM
was attached to the MID, and two resistors were inserted in
the mass selection potentiometer circuit to reduce the mass
range covered by the potentiometers. The details of this
modification are described in Appendix A.
An OCI-3 on-column injector (8GE Pty.) was fitted to
the HP5982A's gas chromatograph and used for much of the
work described in this thesis. The fitting the injector
and its associated gas lines (including a flow controller)
was straightforward and will not be described.

2.1 Morphine
CHAPTER 2
INTRODUCTION
Morphine, an alkaloid isolated from opium, is generally
considered to be the most valuable of all pain relieving
drugs. It is widely used to relieve moderate to severe pain
associated with acute and chronic disorders, to provide
analgesia during diagnostic and orthopaedic procedures and
as a preoperative medication before surgery_
Morphine is variably absorbed from the gastrointestinal
tract after oral ingestion and is thought to have a high
first-pass hepatic extraction ratio (see note 1, Appendix B)
so it is usually administered subcutaneously (S.C.),
intramuscularly (I.M.) or intravenously (I.V.). After S.C.
or I.M. injection absorption into the bloodstream is rapid
and the drug is distributed throughout the body, but mainly
in the kidneys, liver, lungs and spleen, with lower
concentrations in the muscles .. The brain is the main s
of action of morphine but relatively little of an
administered dose penetrates the blood-brain barrier, the
mechanism which prevents many substances in the blood from
entering the central nervous systeml .
The dosage of morphine that must be administered to a
patient in pain to provide analges depends on the degree
of analgesia required, the patient's response and the route
by which the drug is given. Morphine given parenterally in
a dose of 0.1-0.15 mg/kg body weight will achieve a plasma
concentration of about 0.05 ug mL-l. This is the plasma
concentration of morphine required to relieve moderate to
severe pain and peak analgesia occurs within 20-90 minutes.
12
13
The excretion of morphine from the body is mainly via
the urine, and is preceded by extensive metabolism to
derivatives which are excreted more rapidly than the parent
drug. The main metabolic pathway is conjugation with
glucuronic acid to form morphine-3-glucuronide. Minor
morphine metabolites which have been identified in human
morphine addicts and/or non-addict patients are
morphine-6-glucuronide in plasma and urine, and
morphine-3,6-diglucuronide, morphine-3-ethereal sulphate,
normorphine, normorphine-6-glucuronide and (tentatively)
normorphine-3-glucuronide in urine. In healthy subjects
(i.e. non-addict patients) with normal renal function 3-10%
of an administered dose is excreted unchanged in the urine,
about 70% as morphine-3-glucuronide and about 5% as
normorphine. About 90% of total urinary excretion occurs
within 24 hours. A small amount of a morphine dose is
excreted unchanged into the faeces, largely in the bile2 .
2.2 Morphine Disposition During Renal Failure
Patients with renal failure often appear to be more
sensitive to the effects of morphine than patients with
normal renal function 3- 8 • Adverse drug reactions by renal
failure patients to a therapeutic morphine dose include an
unexpected degree of respiratory depression and a prolonged
duration of drug action. The implication is that morphine
distribution and elimination (disposition) is altered in
some way by renal failure, in spite of the traditional
belief that the liver is the main site of morphine
metabolism9 .

14
Disturbances of drug-protein binding during renal
failure have been suggested as a cause, at least in part,
for increased sensitivity to morphine lO . Most drugs,
including morphinell , normally bind reversibly to some
extent to plasma proteins and changes to this binding',
caused by altered concentrations or an altered binding
capacity of proteins, can lead to unusually high or low
plasma levels of unbound and active drug. Morphine binding
in renal failure has been shown to depend on the
concentration of total serum proteins and albumin lO and both
of these concentrations are often diminished by renal
failure lO .
Morphine disposition during impaired renal function has
been studied by comparing the pharmacokinetics of I.V.
morphine in healthy volunteers and in patients with
end-stage renal failure 12 . Plasma unchanged morphine was
measured using high pressure liquid chromatography (HPLC).
The rates of morphine elimination in the two groups were
similar but morphine concentrations were higher in the
patients than in the volunteers for the first 15 min after
administration, implicating high early morphine
concentrations in increased sensitivity to the drug. It was
suggested that morphine-3-glucuronide, a major morphine
metabolite9 ,13 that can produce analgesia and respiratory
depression in dogs 14 but which is thought to be inactive in
humans15 , probably accumulates in the plasma of anuric
patients (those with no kidney function).
The pharmacokinetics of morphine in patients undergoing
renal transplantation and in control subjects have also been

15
compared16 . Using a "specific" radioimmunoassay (RIA)
method17 to measure unchanged plasma morphine, the
transplant patients were shown not to eliminate the drug
from plasma until the transplant kidney began to function,
at which point there was an abrupt change to the same
elimination half-Ii as the controls. This suggested that
patients with renal lure would accumulate morphine,
rather than'eliminate the drug normally as had been
previously reported.
The group that demonstrated altered morphine
pharmacokinetics in renal transplantation has recently
reported unchanged morphine accumulation and reduced
morphine clearance (volume of plasma cleared in unit time)
in patients with renal failure 8 ,18. The clearance of
morphine was related linearly to creatinine clearance18 .
(Creatinine clearance is considered a good indicator of
glomerular filtration rate and thus of renal function19 ).
There has also been another report, by a fferent group, of
morphine accumulation and reduced clearance during renal
failure 20 . In all studies reporting sustained high plasma
morphine concentrations the analytical method used to
measure morphine was RIA.
The finding that morphine elimination began only after
the recovery of renal function during renal transplantation
has been interpreted as demonstrating an important role for
the kidney in unchanged morphine elimination, and led, in
part, to the suggestion that the kidney, and not the liver,
is the main site of morphine metabolism. This
"renal hypothesis" or "renal glucuronidation theory",
proposed by McQuay and Moore 6 , was supported by the reports

16
of unchanged morphine accumulation and reduced clearance
during renal failure, and by other evidence that hepatic
morphine metabolism may not be as important as is widely
believed. Patients with severe hepatic cirrhosis have been
found to tolerate morphine normally (although intolerance
has also been reported 21 ) and to have morphine clearances
similar to those in volunteers with normal liver function 22 .
Drugs metabolised by the liver would be expected to have
reduced clearance during cirrhosis and this has been found
for pethidine and pentazocine 23 . Coadministration with
morphine of drugs that lower liver blood flow would also be
expected to reduce morphine clearance if morphine metabolism
were primarily hepatic but two such drugs, cimetidine24 and
propranolo1 25 , both appear to have no effect on clearance.
Biochemical evidence suggests that a renal mechanism for
morphine metabolism in humans may exist; rabbit kidney
tubule is able to accumulate morphine and to metabolise the
drug to its glucuronides 26 .
All in all, there is considerable confusion regarding
the disposition of morphine in renal failure and the role of
the kidney in morphine metabolism. The studies suggesting
that unchanged morphine elimination is impaired in renal
failure, and which support the renal hypothesis, used an RIA
method to determine plasma unchanged morphine
concentrations. The validity of this assay has recently
been questioned 27 ,28. An RIA using a similar antiserum
(from the same animal) has been shown to overestimate
unchanged morphine when morphine:morphine-3-g1ucuronide
concentration ratios are greater than 1:10 27 .
Morphine-3-g1ucuronide is present in chronically treated

17
patients at a concentration up to twenty-five times that of
morphine 29 and this may have contributed significantly to
the unchanged morphine concentration being measured.
Another morphine metabolite, morphine-6-glucuronide 29 may
also have cross-reacted with the morphine antisera28 .
2.3 This Work
Papaveretum (Omnopon@, Roche) is a standardised mixture of
four opium alkaloid hydrochlorides. It contains the
equivalent of anhydrous morphine 47.5 to 52.5%, anhydrous
codeine 2.5 to 5%, noscapine 16 to 22%, and papaverine 2.5
to 7%30. Papaveretum is widely considered superior to
morphine in providing analgesia and sedation3l ,32, and is
the most commonly used opoid in many New Zealand
hospitals 33 .
This section of the thesis describes a preliminary
pharmacokinetic study of unchanged morphine in four patients
with renal failure (one anephric) and three healthy
volunteers after the intramuscular administration of
papaveretum. The pharmacokinetics of morphine glucuronides
in two of the patients were also studied. Unchanged
morphine concentrations in serum samples were determined
using GeMS with ammonia chemical ionisation mass
spectrometry and quantitative selected ion monitoring.
Morphine glucuronide concentrations were determined as the
difference between morphine concentrations measured before
and after liberation of the conjugates by enzyme hydrolysis.
The study was prompted by the observation that papaveretum

18
occasionally has an excessive effect in renal failure
patients33 and the disposition of morphine in such patients
is still uncertain.
19
RESULTS AND DISCUSSION
2.4 Analytical Methods
2.4.1 Discussion of Preparative Procedures
(a) N-Trideuteriomethylnormorphine
N-Trideuteriomethylnormorphine ([2H3]-morphine,
D3-morphine) was used as the internal standard for the
quantitation of morphine in plasma and serum by GCMS. This
compound is a stable isotope analogue of morphine and
provides a number of advantages over other types of internal
standard (see Section 1.1).
D3-morphine was already available34 . To ensure the
compound's purity it was recrystallised from methanol/water
and then sublimed under vacuum. Mass spectral analysis
showed the level of [lH3]-morphine (DO-morphine) contained
in the purified D3-morphine to be less than 1%.
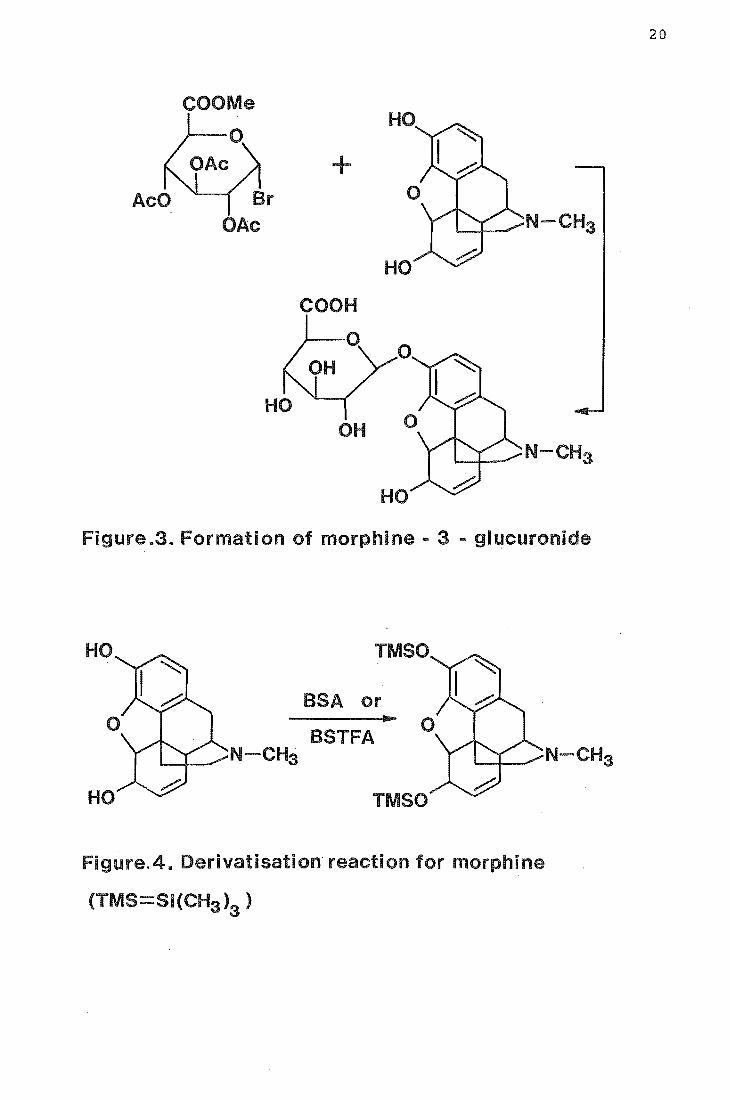
(b) Morphine-(3B-D-glucopyranosyl)-uronate
Morphine-(3S-D-glucopyranosyl)-uronate (morphine-3
glucuronide) was prepared from morphine and methyl
(tri-O-acetyl-a-D-glucopyranosyl bromide)-uronate using the
method of Berrang35 (Figure 3). The crude product was
purified by repeated recrystallisation from methanol.
Methyl(tri-O-acetyl)-a-D-glucopyranosyl bromide)-uronate was
formed by the acid catalysed acetylation of glucuronolactone
to give methyl(tetra~O-acetyl-S-D-glucopyranuronate)36 which
was then treated with hydrobromic acjd 36 .
+
HO
COOH
OH N-CHa
HO
Figure.3. Formation of morphine - 3 - glucuronide
HO
HO
TMSO
BSA or
BSTFA '"""-+__ N -CH3
...
TMSO
Figure.4. Derivatisation reaction for morphine
(TMS- i(CH3 )a)
20

21
2.4.2 Derivative Formation
The gas chromatographic behaviour of morphine base is
improved by derivatisation. This procedure increases the
drug's volatility, and prevents its phenolic and hydroxyl
groups interacting with the GC column to cause adsorption
and tailing. Trimethylsilylmorphine derivatives were formed
(Figure 4), prior to GCMS analysis, by reacting the dried
residue of serum or plasma extracts containing morphine with
N,O-bis-{trimethylsilyl)-acetamide (BSA) or
N,O-bis{trimethylsilyl)-trifluoroacetamide (BSTFA) for 1 h
at 600 C. GC analysis showed that derivatisation was
completed in this time.
2.4.3 Extraction Method for Morphine
Morphine was extracted from plasma and serum by
liquid-liquid extraction. The procedure was based on
previously reported methods 37 ,38 and is fully described in
the experimental section. All glassware was silanised to
avoid loss of analyte and internal standard by adsorption
onto glass surfaces.
Plasma and serum were extracted as 1 mL aliquots in 10
mL glass tubes with ground glass stoppers. The aliquots
were spiked with internal standard, thoroughly mixed, and
allowed to stand overnight to equilibrate (samples being
analysed for total morphine were incubated with
S-glucuronidase before extraction). Proteins were
precipitated with acetone, and the acidified aqueous phase
washed with benzene to remove acidic and neutral endogeneous
material. (Washing the aqueous phase with toluene, a
solvent which is less toxic than benzene, reduced the

22
recovery of morphine). The aqueous phase was then made
alkaline, and morphine extracted with dichloroethane
containing 30% (v/v) isopropyl alcohol. Morphine is an
amphoteric drug and most efficiently extracted into an
organic solvent from aqueous solution at a pH near its
isoelectric point of S.9. This pH was attained using sodium
hydroxide and a borate buffer. The dichloroethane-isopropyl
alcohol was selected after evaluating six solvents or
solvent mixtures by GC with flame ionisation detection, and
ammonia CI GCMS for convenience, efficiency of morphine
extraction, and ability to discriminate against unwanted
endogeneous material (Table 1). After the extraction
procedure was completed, the organic solvent was reduced in
volume, transferred to a Reacti-vial and evaporated to
dryness. The dried residue containing morphine was
derivatised just prior to GCMS analysis.
The recovery of morphine from plasma, using the
extraction procedure finally ad~pted, was determined at
morphine concentrations of 50 ng mL-l and 200 ng mL-l by
ammonia CI GCMS and the results are shown in Table 2.
No morphine was detected in plasma spiked with
morphine-3-g1ucuronide at 200 ng mL-l.
Solid phase extraction techniques offer a number of
advantages over liquid-liquid extractions 39 ,40, and an
attempt was made to extract morphine from plasma using
Sep-pak CIS reverse phase cartridges (Waters Assoc.).
Plasma spiked with morphine and morphine-3-g1ucoronide was
aspirated through prewashed (methanol, water, buffer)
cartridges and the morphine eluted with methanol. A good
recovery of morphine was obtained but morphine-3-g1ucuronide

Solvent
n-butyl chlor
Hexane
Ethyl acetate
Toluene-butanol
Benzene
23
% morEhine Notes recovery
from plasma* (n=5)
'15-25% very clean extracts
55-70% Problems with emulsions
30-38% High level of co-extracted material
60-70% Difficult to evaporate
58-62% Toxic
Table 1. Solvents evaluated for extraction of morphine
1'P1asma morphine concentration 50 ng mL -1.
Plasma morphine
concn.
50 ng mL-l
200 ng mL-l
% Recovery
(mean of 5)
76
83
Range
73-81
79-87
Table 2. Recovery of morphine from plasma using
dichloroethane containing 30% (v/v) isopropyl alcohol.

24
was also detected in the extracts. Elution of the conjugate
could be prevented by washing the cartridge with water but
this lowered the recovery of morphine to an unacceptable
level.
2.4.4 Hydrolysis of Conjugated Morphine
Conjugated morphine in plasma and serum was hydrolysed
using the enzyme S-glucuronidase (Sigma Type H-l from
Helix pomatia). This enzyme also has some sulphatase
activity. Plasma and serum samples were hydrolysed as 1 mL
aliquots in the same glass tubes that were used for
extracting unconjugated morphine. The samples were buffered
to pH 5 and hydrolysed with the enzyme in a heated water
bath at 370 for 24 h, in accordance with the enzyme
manufacturer's instructions. The minimum quantity of
S-glucuronidase (measured in Fishman Units) required to give
the maximal yield of liberated drug was determined by the
following procedure: Plasma containing
morphine-3-glucuronide at a concentration of 5 ~g mL-l was
prepared by adding a known mass of the conjugate to
drug-free plasma. Aliquots of this plasma were spiked with
D3-morphine and these samples were then hydrolysed with 50,
100, 500, 1000, 2000, 3000, 4000 or 5000 Fishman Units of
enzyme using the method which has just been described.
After hydrolysis the samples were extracted and analysed
using the method for unconjugated morphine. The yield of
liberated drug, determined by measuring the ratio of DO- and
D3-morphine, was found to increase and maximise at 2000
Fishman units. The exact yield of liberated morphine was
25
not determined as no calibration graph was constructed, but
this was estimated to be about 80% of available morphine.
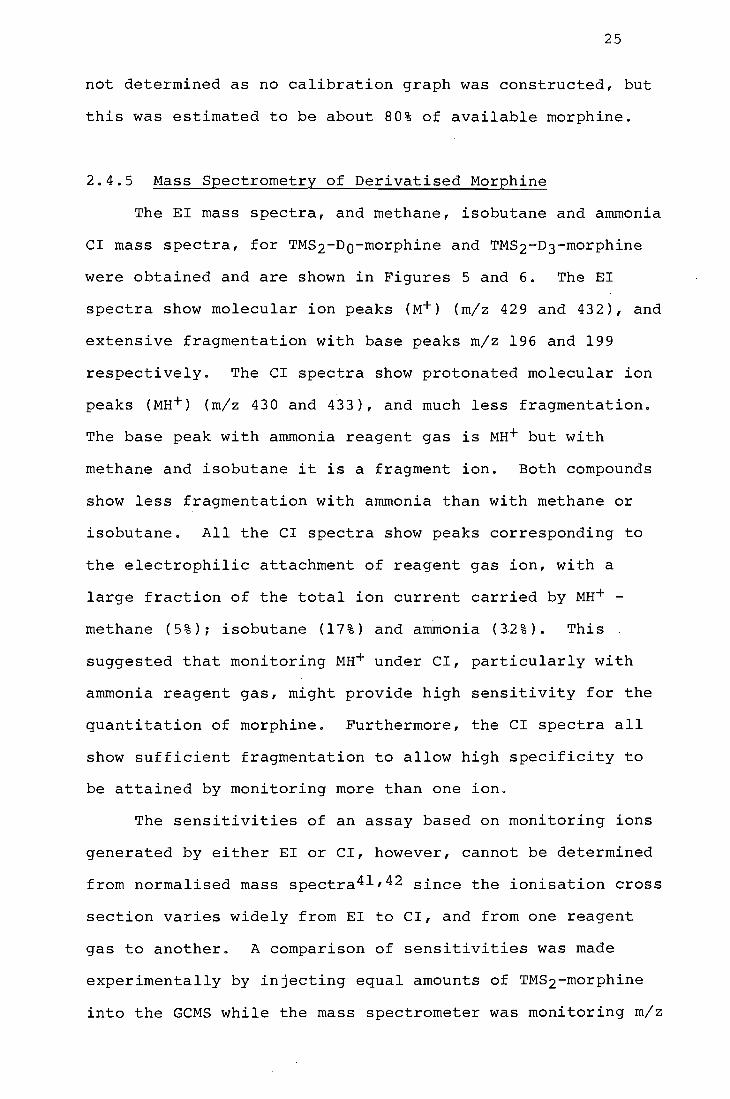
2.4.5 Mass Spectrometry of Derivatised Morphine
The EI mass spectra, and methane, isobutane and ammonia
CI mass spectra, for TMS2-DO-morphine and TMS2-D3-morphine
were obtained and are shown in Figures 5 and 6. The EI
spectra show molecular ion peaks (M+) (m/z 429 and 432), and
extensive fragmentation with base peaks m/z 196 and 199
respectively. The CI spectra show protonated molecular ion
peaks (MH+) (m/z 430 and 433), and much less fragmentation.
The base peak with ammonia reagent gas is MH+ but with
methane and isobutane it is a fragment ion. Both compounds
show less fragmentation with ammonia than with methane or
isobutane. All the CI spectra show peaks corresponding to
the electrophilic attachment of reagent gas ion, with a
large fraction of the total ion current carried by MH+ -
methane (5%)~ isobutane (17%) and ammonia (3.2%). This
suggested that monitoring MH+ under CI, particularly with
ammonia reagent gas, might provide high sensitivity for the
quantitation of morphine. Furthermore, the CI spectra all
show sufficient fragmentation to allow high specificity to
be attained by monitoring more than one ion.
The sensitivities of an assay based on monitoring ions
generated by either EI or CI, however, cannot be determined
from normalised mass spectra41 ,42 since the ionisation cross
section varies widely from EI to CI, and from one reagent
gas to another. A comparison of sensitivities was made
experimentally by injecting equal amounts of TMS2-morphine
into the GCMS while the mass spectrometer was monitoring m/z

26
Figure 5. EI mass spectra of TMS2-DO- and TMS2-D3-morphine.
100
50
>, 4-' ..... III C <lJ 4-' C ....
..-<lJ ex:
236
100 200 300 m/z
400
(a) EI mass spectrum of TMS2-DO-morphine
200 300 400 m/z
(b) EI mass spectrum of TMS2-D3-morphine
500
432
500
27
Figure 6. CI mass spectra of TMS2-DO- and TMS2-D3-morphine
using CH41 C4HIO and NH3 as reagent gases.
>, +> .,... II>
'" OJ +> '" ......
.--OJ
0::
>, +> II>
'" OJ +> '"
.--OJ
0::
100 .
.
---
50.
--
300 m/z
340
414
430
371
458
400
(a) CI(CH4) mass spectrum of TMS2-Do-morphine
100
--
50-
----
I 100 300
m/z
417
433
343
371 461
l 400
(b) CI(CH4) mass spectrum of TMS2-D3-morphine
~o
500

28
10 340
--- 4 0
>, +.:>
Vl -~ (])
50.. +.:> t:::
1-1 . ..... (])
0::: .. 472
.. -
• • I
100 200 300 400 500 m/z
100_ 343
.. -.. 433
>, +.:> -Vl ~ (]) 50-+.:> t:::
1-1 -..... (])
0::: 475 . ..
I • • • 100 200 300 400 500
m/z

100
>, +> til <= (1J 50 +> <= ......
r-
~
100
>, +> til <= (1J 50 +' <= ......
...... Q) ~
100 200 300 m/z
430
3 0
400
(e) CI(NH3) mass spectrum of TMS2-DO-morphine
100 200 300
m/z
433
343
400
(f) CI(NH3) mass spectrum of TMS2-D3-morphine
29
500
500

30
429 using EI and then m/z 430 using CI for all three reagent
gases. (The MS was retuned for maximum sensitivity in each
case). Ion intensities were determined and compared by
measuring peak heights on a chart recorder. The CI response for
1·1H+ vii th ammonia was about twice that obtained with methane or
isobutane, which in turn gave about the same response as the
EI molecular ion. CI sensitivities were also compared for
the base peak of TMS2-morphine with methane (m/z 414),
isobutane (m/z 340) and ammonia (m/z 430), and again the
response was greatest with ammonia. Based on these results,
ammonia CI was selected for the quantitation of morphine in
plasma and serum extracts.
Ammonia CI was found to offer another advantage over
EI, in addition to a lower detection limit. An ammonia
plasma generally protonates only those compounds containing
either a basic nitrogen or certain carbonyl functions 43 . At
least four compounds with retention times close to that of
morphine were detected in derivatised plasma and serum
extracts when monitoring M+ at high gain by EI GCMS. Only
one other compound was detected when monitoring MH+ in CI
with ammonia reagent gas.
2.4.6 Instrument Preparation
A serious limitation to the sensitivity obtainable when
determining trace levels of an organic compound by GeMS is
imposed by adsorption or absorption of the analyte and the
internal standard onto the mass spectrometer inlet system.
There have been many reports of this problem,42,44 which is
solved, in part, by saturating the inlet system with the
compounds being determined. In this work the GC column and

31
the ion source were saturated with TMS2-DO-morphine and
TMS2-D3-morphine before beginning analysis of the serum
extracts, and following any dismantling, cleaning or change
to the ion source or transfer line. Saturation was achieved
by 20-30 injections of 100 ng of the two derivatives, and
was followed by repeated injections of methanol until no
mass spectrometer response was observed under conditions of
high gain at m/z 430 and 433.
The mass spectrometer's sensitivity was found to vary
significantly from day to day. The instrument was therefore
retuned on each occasion plasma or serum extracts were
analysed. Reference compounds used for tuning were
introduced into the ion source using a conventional
direct-insertion probe. The mass spectrometer was tuned for
ammonia CI operation by maximising the m/z 490 peak of
chloropentaiodobenzene45 and using this peak and the 37C1
isotope at m/z 492 for resolution adjustment. Final tuning
was optimised using a 1:1 mixture of TMS2-DO-morphine and
TMS2-D3-morphine. After adjusting the various ion-source
and ion-focussing electrode potentials, the multiple ion
detector (MID) control unit was used to set the mass
spectrometer to monitor m/z 433, m/z 430 and m/z 340. The
exact m/z monitored, which may be slightly different from
these values because of mass defect and instrument
calibration error, was set by scanning across each peak and
setting MID mass scale control to give maximum ion
current, as measured by pen deflection on the MID chart
recorder.

32
2.4.7 Quantitative GCMS Analysis
Quantitation of morphine was based on the MH+ ion
intensities from TMS2-Do-morphine (m/z 430) and
TMS2-D3-morphine (m/z 433). The resulting ion intensity
ratio (intensity m/z 430/intensity m/z 433) was converted to
a DO/D3 mass ratio using a calibration graph. Ion
intensities were determined by measuring peak heights on a
chart recorder. In order to reduce the measuring error the
mass spectrometer sensitivity was adjusted to bring the
peaks to as close as possible to full-scale deflection.
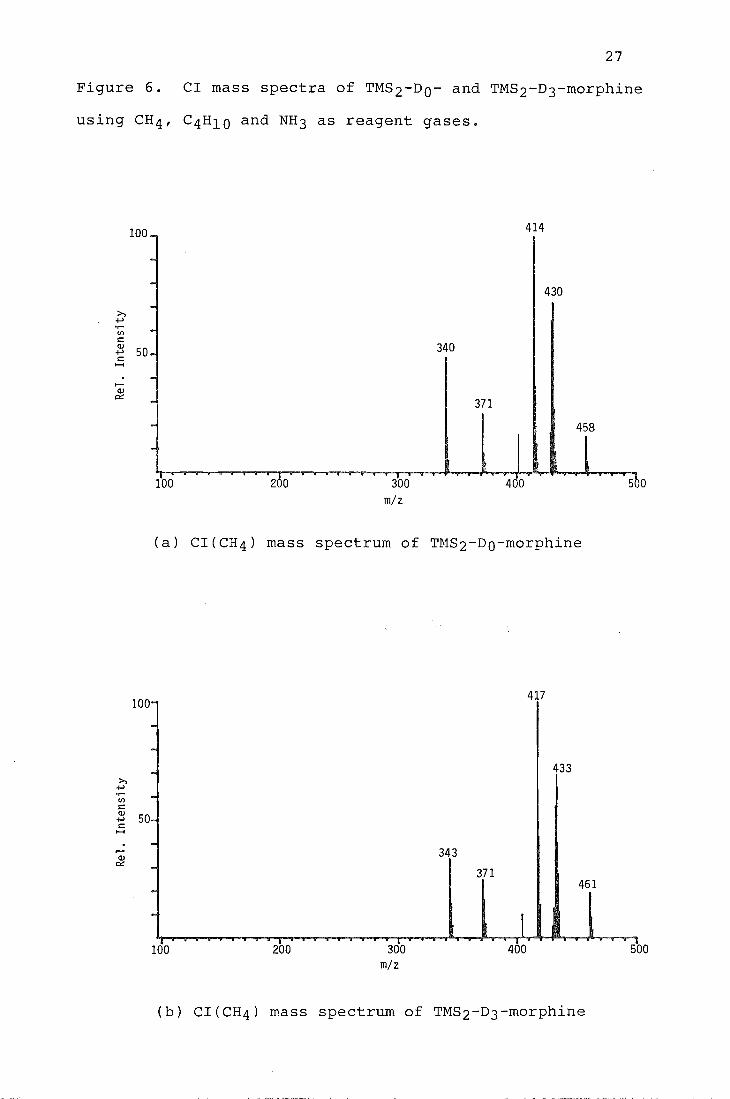
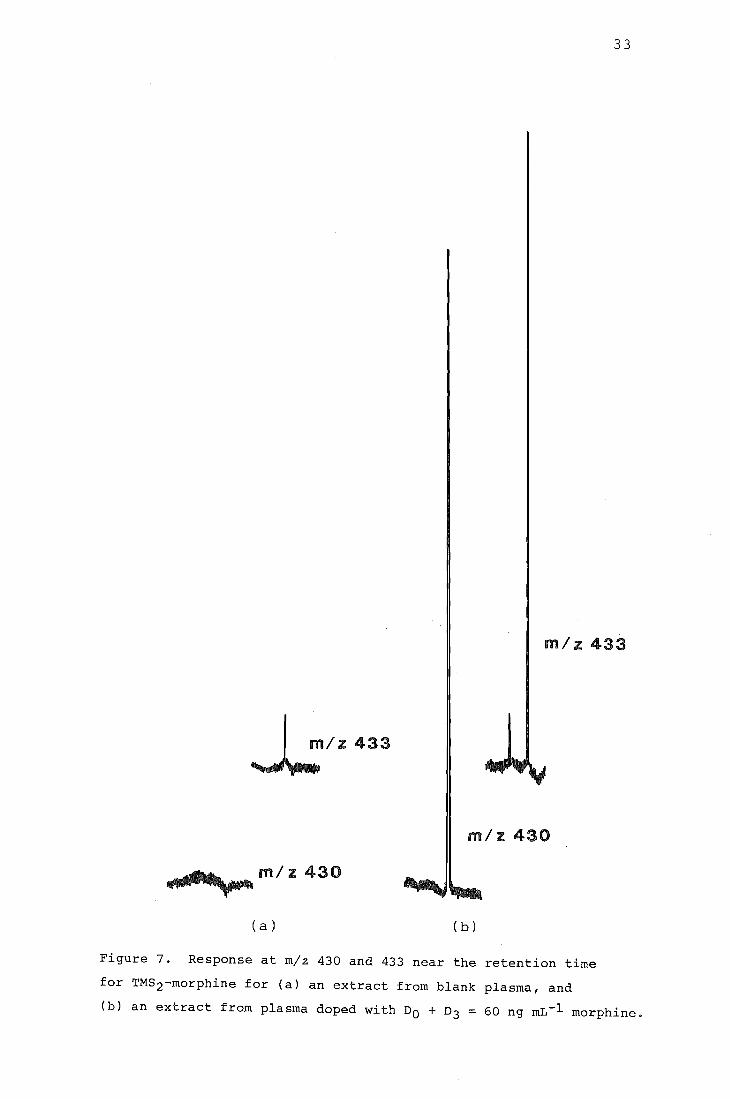
Figure 7 shows the response at m/z 430 and 433 for an
injection of a derivatised extract from plasma that
contained DO- and D3-morphine, and for a derivatised extract
from blank plasma. A set of initial calibration graphs was
prepared to establish that the relationship between the mass
spectrometer ratios and mass ratios was linear, and to
define the errors in the analysis. The calibration graphs
were constructed using extracted and derivatised plasma
samples that contained DO- and D3-morphine in the ratios
0.25, 0.50, 1.0 and 2.0 DO:D3. The preparation of the
standard mixtures of DO- and D3-morphine used to spike the
plasma samples is discussed in the experimental section.
Two calibration graphs, one at a total DO + D3 concentration
of 60 ng mL-l of plasma and the other at 400 ng mL-l, were
obtained prior to beginning the pharmacokinetic study.
These graphs are shown in Figures 8 and 9, and the ion
intensity ratios and statistical analysis are given in
Tables 3 and 4. A weighted linear least-squares
procedure 46 (see Appendix C) was used to find the regression
line for both calibration graphs. The absolute standard
33
m/z 433
~/Z433
m/z 430
... ~~_m/z 430
(a) (b)
Figure 7. Response at m/z 430 and 433 near the retention time
for TMS2-morphine for (a) an extract from blank plasma, and
(b) an extract from plasma doped with DO + D3 = 60 ng mL-l morphine.

34
0 2.5 'r-l +J cO l-I
2.0 +J ..c1 b1
.r-l G.l 1.5 ..c1
~ cO G.l P..! 1.0 (Y')
c
" 0 c 0.5
0.0 0.0 0.2 0.4 0.6 0.8 1.0 1.2 1.4 1.6 1.8 2.0 2.2 2.4 2.6
DO/D3 mass 0
Fi 8. Calibration graph morphine in plasma
(DO + D3 = 60 ng mL-l, 8 mean of five measurements)
2.0
0.0 1::--...L.._....I..----I._-1-_.l----L._....I-.---Jl----L_..I...----L_.....l---I
0.0 0.2 0.4 0.6 0.8 1.0 1.2 1.4 1.6 1.8 2.0 2.2 2.4 2.6
Do/D3 mass ratio
9. Calibration graph for morphine in plasma
(DO + D3 = 400 ng mL-l, - = mean of three measurements)
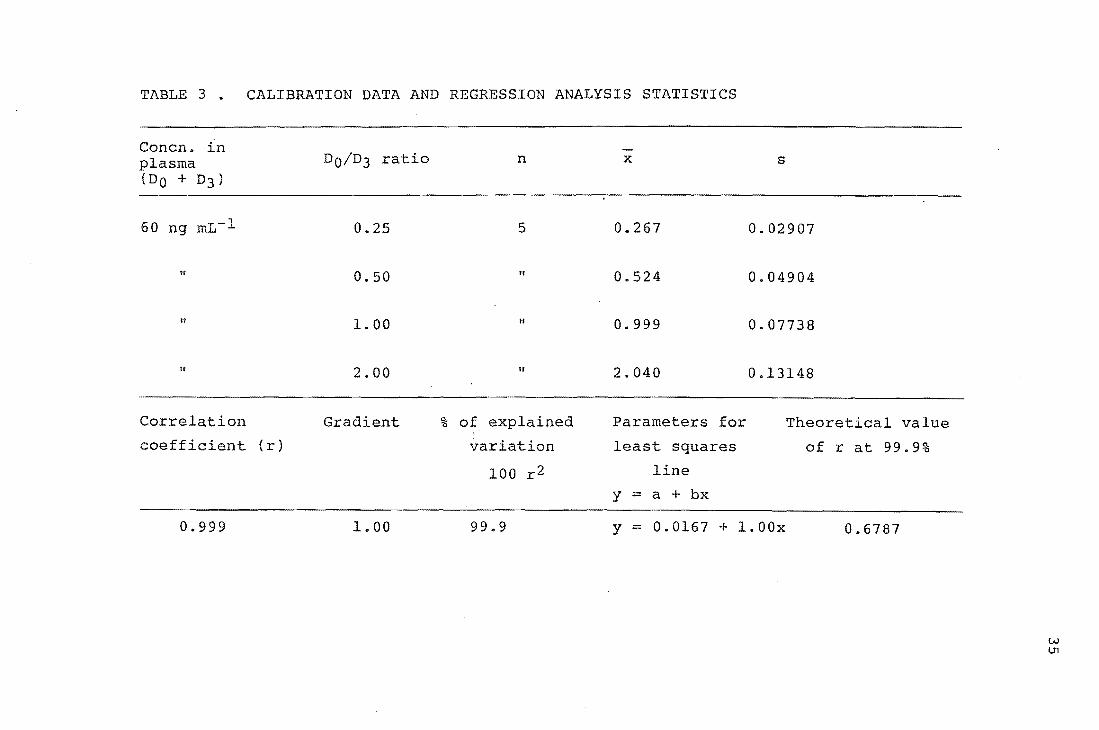
TABLE 3. CALIBRATION DATA AND REGRESSION ANALYSIS STATISTICS
Concn. ln plasma (DO + D3)
60 ng mL-l
If
II
II
Correlation
coefficient (r)
0.999
DO/D3 ratio
0.25
0.50
1. 00
2.00
Gradient
1.00
n
5
n
II
II
% of explained
variation
100 r2
99.9
x s
0.267 0.02907
0.524 0.04904
0.999 0.07738
2.040 0.13148
Parameters for Theoretical value
least squares
line
y = a + bx
y = 0.0167 + 1.00x
of r at 99.9%
0.6787
w U1
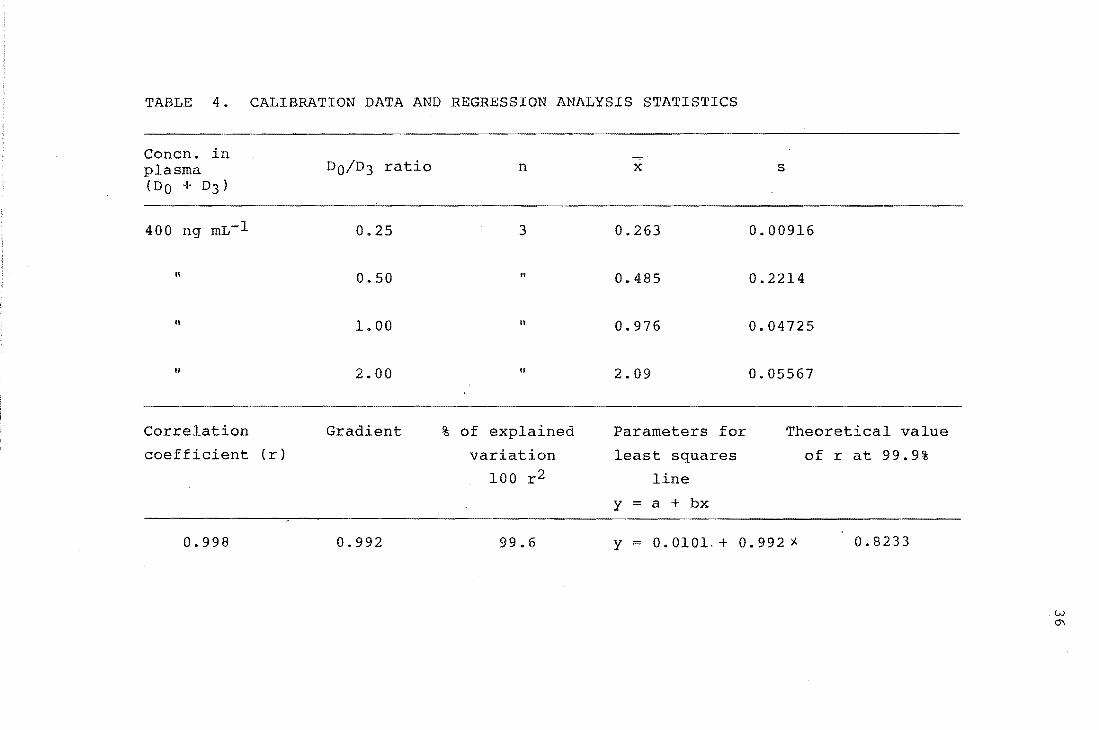
TABLE 4.
Concn. in plasma (DO + D3)
400 ng mL-l
II
"
II
Correlation
coefficient
0.998
CALIBRATION DATA AND REGRESSION ANALYSIS STATISTICS
DO/D3 ratio n x s
0.25 3 0.263 0.00916
0.50 " 0.485 0.2214
1.00 II 0.976 0.04725
2.00 It 2.09 0.05567
Gradient % of explained Parameters for Theoretical value
(r) variation least squares of r at 99.9%
100 r2 line
y = a + bx
0.992 99.6 Y = 0.0101.+ 0.992'j.. 0.8233
w ~

37
deviation in the measured intensity ratios was found to
decrease as the DO/D3 ratio decreases, causing the smaller
isotope ratios to be defined with greater precision.
Weighting the regression line ensures that it is less
sensitive to the large absolute errors at the upper extreme
of the calibration and forces it to pass close to the more
precisely defined points near the origin. The weighting
factor used at each point was the inverse of the variance in
the measured intensity ratios 41,42,46.
The regression analyses were carried out by treating
the mass ratios from the standard plasma samples as the
independent variable and the measured ion intensity ratios
as the dependent variable. This approach, which is
sometimes used incorrectly41, assumes that the variance in
mass ratios is less than the variance in the ion-intensity
ratios 46 . It was adopted in this work because, although the
60 ng mL-l and 400 ng mL-l calibration data were obtained
from extracted plasma samples p~epared using two independent
sets of standard DO- and D3-morphine mixtures, (one set for
each level) a statistical analysis showed the two regression
lines to be indistinguishable.
Plasma samples containing DO- and D3- morphine in the
ratio 4:1, were excluded as calibration standards. Two such
samples were found consistently to give points below the
least-squares line on the 60 ng mL-l calibration graph.
This deviation was attributed to the (MH+3) peak (m/z 433)
of TMS2-DO-morphine contributing significantly to the
intensity of the MH+ ion of TMS2-D3-morphine (m/z 433) in a
mixture with a large proportion of DO-morphine. Curvature
in a calibration graph can also be caused by isotopic
38
impurity of the labelled compound. In the 1:4 DO:D3 case,
TMS2-D3-morphine will show a low intensity ion at (MH-3) due
to the presence of a small amount of unlabelled
TMS2-DO-morphine. The degree of non-linearity introduced by
this impurity was negligible, as shown by r values of better
than 0.99 for both the 60 ng mL-l and 400
ng mL-l calibration graphs.
The accuracy of the procedure for determining morphine
in plasma was assessed using a single doped plasma sample
containing morphine at a concentration of 30 ng mL-l. Five
1 mL aliquots of this plasma were doped with D3-morphine so
that DO:D3 = 1, and another five 1 mL aliquots were doped
with D3-morphine so that DO:D3 = 0.5. All ten samples were
extracted and analysed using the procedures which have been
described. Measured morphine concentrations were
29.3 ± 1.4 ng mL-l when DO:D3=1 and 28.4 ± 1.7 ng mL-l when
DO:D3=0.5.
2.5 Patient Study
2.5.1 Patients and Healthy Volunteers
The four patients were men with renal failure, one (4,
Table 5) being anephric (without kidneys). All four were on
maintenance haemodialysis (see note 2, Appendix B). The
important characteristics and laboratory data for each
patient were supplied by medical staff at Christchurch
Hospital and are given in Table 5.
All patients had normal' serum concentrations of the
enzyme aspartate aminotransferase (AST), indicating that
they were free of liver disease. The concentration of this

Table 5 Important characteristics and laboratory data for the renal failure patients.
Patient Age Weight (years) (kg)
1 60 80
2 54 65
3 41 60
4 33 88
a. Normal range 36-55
Months on dialysis
2
1
1
114
Cause of renal failure
Polycystic kidney disease
Membranous glomerulo-nephritis
unknown
Goodpasture's syndrome or anti-glomerular basement membrane disease
b. Serum aspartate aminotransferase; normal range <50
c. Normal range 140-180
Other medical Drugsd Albumina ASTb HaemoglobinC
problems (gL-l ) IU/L (gL-l )
41 11 84
Ischaemic Amphogel heart disease (aluminium
hydroxide gel) 29 Chronic
14 50
bronchitis
Amphogel 45 14 75
Anephric Alutab 6 3x daily
38 12 51
d. All patients also receiving: Ferrous Gluconate 300 mg/day
Calcitriol 0.25 ~g/day
vitamin C 50 mg 3x week
Vitamin B complex 3x week
W 1.0

40
enzyme is normally high in liver but low in blood. Damage
to liver cells, caused by disease, liberates the enzyme
causing a rise in the normal serum AST concentration. It
was important to establish the absence of liver disease in
the patients studied because of the major role the liver is
believed to have in morphine metabolism. Serum albumin
concentrations were in the normal range for all patients
except one (2). Morphine in plasma, binds to this protein
and the suggestion has been made lO that reduced albumin
concentrations during renal failure may cause unusually high
unbound plasma morphine concentrations. All patients had
lower than normal haemoglobin concentrations. Anaemia
frequently accompanies renal failure and is likely to cause
increased cardiac output 47 . This increase in cardiac
output, and hence in the circulation of the' blood, is a
compensatory mechanism to maintain tissue oxygenation. The
reduced haemoglobin concentrations observed suggested that
the patients in this study had higher than normal blood
flows.
The volunteers were three male physicians, aged 34-41
years. All were free of medical disease and were taking no
regular medication.
2.5.2 Clinical Protocol
The study was approved by the Canterbury Hospital Board
Ethical Committee, and all subjects gave written informed
consent. All medical procedures were performed by medical
staff at Christchurch Hospital. Papaveretum (0.25 mg/kg
body weight) was injected into the deltoid muscle (a muscle
in the upper arm). In the patients this was the fistula arm

41
(see note 3; Appendix B) Blood was obtained from a venous
cannula (a tube inserted into a vein) in the contralateral
arm immediately before injection and at intervals over the
next 24 h. Samples were collected into plain tubes and the
serum separated and stored at -20oC until assayed.
The clinical response following papaveretum injection
for both patients and healthy volunteers ranged from
vomiting and somnolence to mild elation and hyperactivity.
2.5.3 Analysis of Serum Samples
Serum samples from the patients and healthy volunteers
were analysed for morphine by ammonia CI GCMS, using the
procedures which have been described. The intensities of
MH+ ions from TMS2-DO-morphine (m/z 430) and
TMS2-D3-morphine (m/z 433) were monitored for quantitation,
and m/z 430 was monitored to rigorously establish morphine
as the analyte. The samples were analysed in a random
sequence and the time of sample. collection was unknown at
the time of analysis. No morphine was detected in the serum
samples taken immediately before papaveretum administration.
The results for the analysis of the serum samples, and the
calibration data and statistical analysis of these data, are
shown in Tables 6-16.
A calibration graph, at a total DO + D3-morphine
concentration of 60 ng mL-l of plasma, was obtained and used
on each occasion that unchanged morphine was measured.
A similar, single, calibration graph, at a total DO +
D3-morphine concentration of 400 ng mL-l of plasma was
obtained for the determination of total (conjugated and
unchanged) morphine in samples from two patients.

TABLE 6 CALIBRATION DATA FOR MORPHINE STUDY -- ---------
Mass ratio Calibration lines
(00/0 3) 1 2 3 4 5 6
0.25 0.29 0.27 0.22 0.25 0.29 0.28 0.26 0.22 0.29 0.30 0.28 0.28
0.50 0.63 0.48 0.57 0.47 0.56 0.56 0.53 0.57 0.45 0.56 0.55 0.61
1. 00 0.92 0.93 1.12 0.93 0.98 0.99 1. 04 1.12 1. 20 0.98 1. 07 1.06
2.00 1. 87 2.15 2.21 1.87 2.01 2.14 1. 97 2.08 2.14 2.19 1. 91 2.00
1-7 DO + D3 = 60 ngmL-1 extracted from plasma
B DO + 03 = 400 ngmL-1 " " " 9 DO + 03 = 200 ngmL-1 II " II
10 DO + 03 = 20 ngmL-1 " " ..
7 8
0.26 0.27 0.29 0.25
0.26
0.49 0.51 0.55 0.47
0.48
1.17 1.02 0.92 0.96
1.03
2.18 1. 94 2.13 2.01
2.07
9
0.29 0.27 0.26
0.53 0.48 0.51
1. 03 0.94 0.97
2.08 1.93 2.06
10
0.32 0.19 0.25
0.49 0.44 0.60
1.16 0.89 0.92
1.87 2.21 2.32
.",.
IV

TABLE 7 REGRESSION ANALYSIS STATISTICS FOR CALIBRATION DATA
Calibration graph r Gradient 100r2 Least squares Line
1 0.9916 0.9484 98.32 Y = 0.0523 + 0.9484x
2 0.9939 1.0615 98.78 Y -0.0181 + 1.0615x
3 0.9929 1.1277 98.58 Y = -0.0293 + 1.1277x
4 0.9918 0.9727 98.37 Y = 0.0285 + 0.9727x
5 0.9982 0.9697 99.64 Y = 0.0493 + 0.9697x
6 0.9966 1.0199 99.32 Y = 0.0348 + 1.0199x
7 0.9934 1. 0571 98.68 Y 0.0052 + 1.0571x
8 0.9983 0.9894 99.64 Y = 0.0094 + 0.9894x
9 0.9974 0.9781 99.48 Y = 0.0250 + 0.9781x
10 0.9814 1.0489 96.31 Y = -0.0141 + 1.0489x
Theoretical value of r at 99.9%
0.9249
"
II
.. II
"
"
0.8233
II
"
~ w

TABLE 8
Time after injection
(min)
15
30
45
60
75
90
105
120
150
180
210
240
RESULTS FOR UNCHANGED MORPHINE IN SERUM SAMPLES FROM HEALTHY VOLUNTEER 1
D3-morphine Peak height Calibration Measured morphine conc. ngmL-l ratio graph conc. ngmL-l
serum DO/D3 serum
30.0 1.11 2 31. 9
II 1. 83 " 52.2
II 1. 57 II 45.0
" 1. 23 " 35.3
" 1.16 " 33.3
" 1.11 " 31. 9
" 1.09 " 31. 3
" 1. 02 If 29.3
II 0.98 II 28.2
" 0.78 II 22.6
" 0.63 " 18.3
" 0.48 II 14.1
~
~
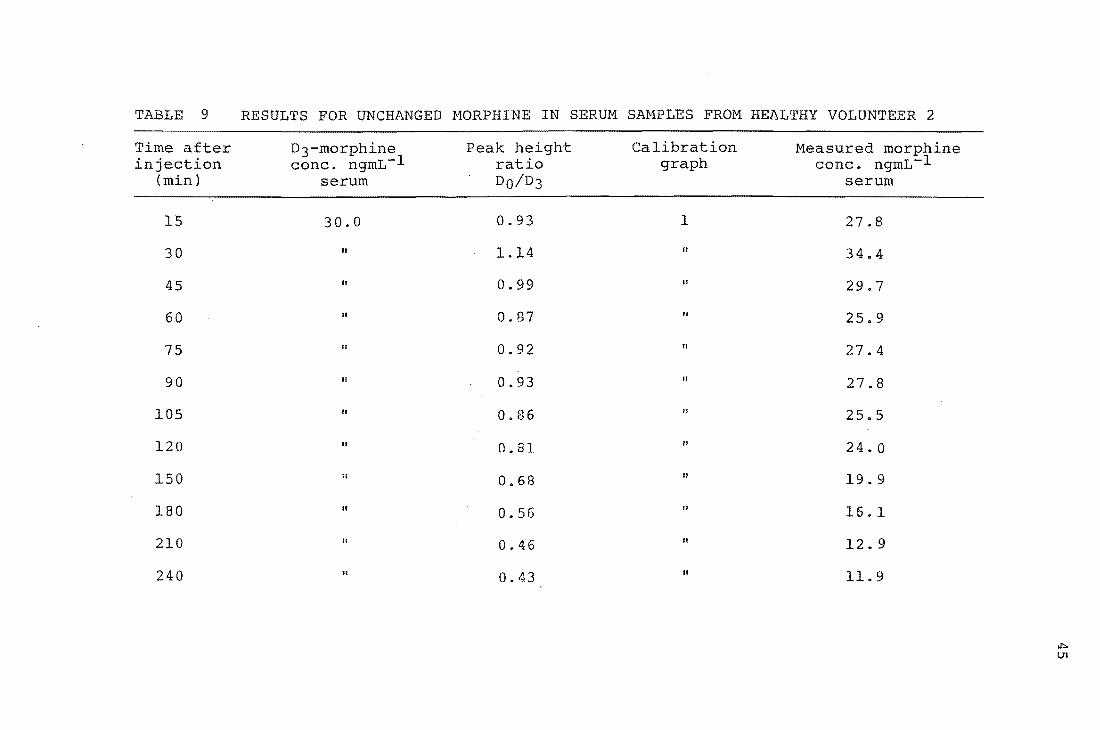
TABLE 9
Time after injection
(min)
15
30
45
60
75
90
105
120
150
180
210
240
RESULTS FOR UNCHANGED MORPHINE IN SERUM SAMPLES FROM HEALTHY VOLUNTEER 2
D3-morphine Peak height Calibration Measured morphine conc. ngmL-l ratio graph conc. ngmL-l
serum 00/0 3 serum
30.0 0.93 1 27.8
" 1.14 II 34.4
II 0.99 II 29.7
II 0.87 " 25.9
/I 0.92 /I 27.4
/I 0.93 " 27.8
" 0.86 II 25.5
" 0.81 " 24.0
II 0.68 " 19.9
.. 0.56 " 16.1
.. 0.46 " 12.9
.. 0.43 " 11.9
~
111

TABLE 10 RESULTS FOR UNCHANGED MORPHINE IN SERUM SAMPLES FROM HEALTHY VOLUNTEER 3
Time after jection (min)
2
5
10
15
20
25
30
35
40
45
55
70
80
100
130
180
240
360
480
1440
D3-morphine conc. ngmL-1
serum
30.0
" " " " " "
"
"
" " II
" "
" 10.0
"
" " II
n.d. none detected
Peak height ratio DO/D3
0.46
1. 42
1. 09
1.15
1. 41
1. 06
1.19
1. 35
1.11
1.15
1. 03
0.94
0.94
0.73
0.67
1. 39
0.85
0.65
0.25
Calibration graph
7
"
" " "
" " n
" " " " " 11
n
10
" II
II
"
Measured morphine conc. ngmL-1
serum
12.9
40.2
30.8
32.5
39.9
29.9
33.7
38.2
31.4
32.5
29.1
26.5
26.5
20.1
18.9
13.4
8.2
6.3
2.5
n.d. ~
01

TABLE 11 RESULTS FOR UNCHANGED MORPHINE IN SERUM SAMPLES FROM PATIENT 1
Time after D3-morphine Peak height Calibration Measured morphine inj on conc. ngmL-l ratio graph conc. ngmL-l
(min) serum DO/D3 serum
15 100.0 0.54 9 53.0
30 30.0 1.79 3 4B.4
45 " 1.49 " 40.4
60 II 1.27 " 34.6
75 II 1.08 " 29. 5
90 " 0.96 II 26. 3
105 " 0.77 II 21. 3
120 " 0.69 " 19. 1
150 " 0.66 " IB.3
180 " 0.50 " 14. 1
215 10.0 1.20 10 11.6
245 " 1. 02 II 9.9
300 " 0.73 .. 7.1
365 " 0.53 " 5.2
420 II 0.52 11 5.1
1430 " " n.d.
n.d. none detected
~
-...l

TABLE 12 RESULTS FOR UNCHANGED MORPHINE IN SERUM SAMPLES FROM PATIENT 2
Time after D3-morphine Peak height Calibration Measured morphine injection conc. ngmL-l ratio graph conc. ngmL-l
(min) serum 00/0 3 serum
19 30.0 1. 66 5 49.8
30 .. 1. 0.4 " 30.6
45 II 1.15 II 34.1
60 II 1. 02 " 30.0
75 II 0.611 II 19.5
90 " 0.64 " 18.3
105 II 0.62 II 17.7
125 n 0.61 n 17.3
150 II 0.55 .. 15.5
180 10.0 J .02 10 9.9
210 II 0.93 " 9.0
240 " 0.50 " 7.8
300 II 0.52 11 6.0
360 " 0.55 II 5.4
420 II 0.43 " 4.2
480 II II n.d.
1425 " II n.d.
n.d. none detected ,.!::leo

TABLE 13 RESULTS FOR UNCHANGED MORPHINE IN SERUM SAMPLES FROM PATIENT 3
Time after D3-morphine Peak height Calibration Measured morphine injection conc. ngmL-l ratio graph conc. ngmL-l
(min) serum DO/D3 serum
5 30.0 1. 31 6 37.5
10 " 1. 38 II 39.6
15 " 1.23 " 35.2
30 " 1. 61 " 46.3
45 " 1. 4f) II 41. 9
60 " 1. 05 " 29.9
75 " 0.77 II 21. 6
90 " 0.81 " 22.8
105 " 0.74 II 20.7
120 " 0.74 " 20.7
150 " 0.57 II 15.7
210 10.0 0.96 10 9.3
240 " 0.84 .. 8.1
300 II 0.56 " 5.5
""" '-0 360 " 0.43 " 4.2

TABLE 14
Time after injection
(min)
15
30
45
60
75
90
120
150
180
210
240
300
RESULTS FOR UNCHANGED MORPHINE IN SERUM SAMPLES FROM PATIENT 4
D3-morphine Peak height Calibration Measured morphine conc. ngmL-1 ratio graph conc. ngmL-l
serum DO/D3 serum
100.0 0.73 9 72.1
" 0.65 II 63.9
30.0 1.G3 4 55. 6
" 1. 49 II 45. 1
" 1. 44 II 43.5
" 0.43 " 12. 4
II 0.39 " 11.1
10.0 0.74 10 7.2
" 0.75 " 7.3
" 0.52 " 5.1
" 0.44 " 4.3
" 0.25 " 2. 5
V1 o
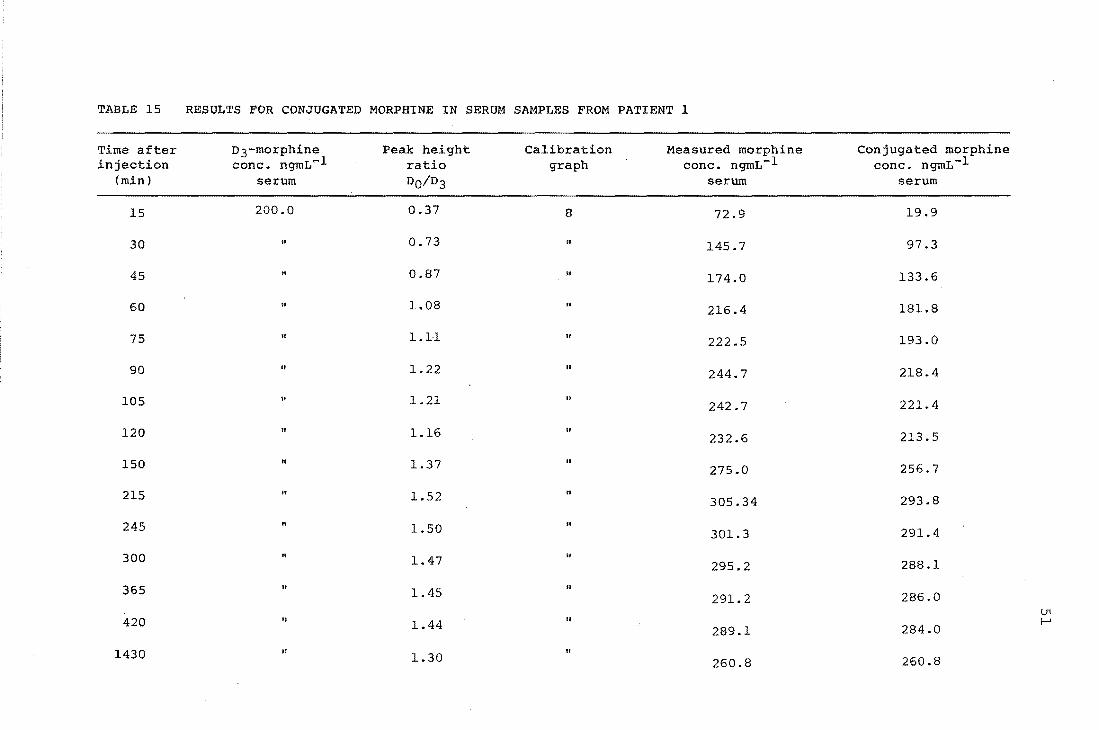
TABLE 15 RESULTS FOR CONJUGATED MORPHINE IN SERUM SAMPLES FROM PATIENT 1
Time after D3-morphine Peak height Calibration Measured morphine Conjugated morphine injection conc. ngmL.,...l ratio graph conc. ngmL-1 conc. ngmL-1
(min) serum DO/D3 serum serum
15 200.0 0.37 8 72.9 19.9
30 .. 0.73 " 145.7 97.3
45 .. 0.87 " 174.0 133.6
60 .. 1.08 " 216.4 181.8
75 " 1.11 .. 222.5 193.0
90 " 1.22 " 244.7 218.4
105 " 1.21 " 221.4 242.7
120 " 1.16 " 232.6 213.5
150 " 1.37 " 275.0 256.7
215 If 1.52 .. 305.34 293.8
245 1.50 .. 301.3 291.4
300 " 1.47 II
295.2 288.1
365 1.45 " 291.2 286.0
U1 420 " 1.44 " f-'
289.1 284.0
1430 If " 1.30 260.8 260.8

TABLE 16 RESULTS FOR CONJUGATED MORPHINE IN SERUM SAMPLES FROM PATIENT 2
Time after D3-morphine Peak height Calibration Measured morphine Conjugated morphine injection conc. ngmL-l ratio graph conc. ngmL-l conc. ngmL-l
(min) serum 00/0 3 serum serum
19 100 1.17 9 117.1 67.3
30 If 1.41 .. 141.6 111.0
60 .. 1.86 .. 187.6 157.6
90 200.0 1.02 8 204.3 186.0
105 II 1.17 .. 234.6 216.9
125 .. 1.18 .. 236.6 219.3
180 " 1.16 II 232.6 222.7
240 to 1.31 " 262.9 255.1
360 " 1.31 II
262.9 257.5
420 " 1.24 " 244.6 248.8
480 " to
1.31 262.9 262.9
1425 It .. 1.04 208.3 208.3
U1 N

53
Samples found to have a DO + D3 ratio outside the 0.25 -
2.0 range covered by these calibration graphs were analysed
again, after spiking with a more appropriate amount of
internal standard, and using a DO- + D3-morphine = 20 ng
mL-l or 200 ng mL-l calibration graph. Samples found to
have a DO:D3 ratio near the extremes of the calibration
graphs were also re-analysed if sufficient serum was
available.
A weighted linear least-squares procedure (Appendix C)
was used to calculate the regression lines. The weighting
factors used for the 60 ng mL-l calibration
graphs were those calculated for similar graphs obtained
earlier (Section 2.4.7). These weights were based on five,
rather than two, replicate determinations at each mass
ratio, and were thus more accurate. The weighting factors
used for the 20, 200 and 400 ng mL-l graphs were ohtained from
the actual calibration data.
2.6 Pharmacokinetic Analysis
2.6.1 Selection of a Model For Unchanged Morphine
Various mathematical models can be used to simulate the
processes of drug absorption, distribution and elimination
in the body. These models provide equations to which
experimental data can be fitted, allowing calculation of
pharmacokinetic parameters.
The simplest pharmacokinetic model is the
"one-compartment-open model" in which the body is considered
to be a single compartment. The model assumes that drug in
the plasma reaches instantaneous equilibrium with drug in
the tissues and that any changes occurring in the plasma

54
concentration reflect proportional changes in tissue drug
levels. Drug elimination from the single compartment
follows first order kinetics, giving a simple monophasic
decline in drug concentration.
Some drugs require a more sophisticated model to
explain their plasma concentration-time curve. The
"two-compartment-open model" assumes that a drug distributes
into two compartments. The first or central compartment
represents the blood, extracellular water and highly
perfused tissues which the drug enters rapidly, and the
second or peripheral compartment represents tissues that the
drug enters more slowly. The two-compartment model predicts
a biphasic decline in plasma concentrations during drug
elimination. The initial and rapid a phase or distribution
phase corresponds to drug in the first compartment entering
the second compartment. After distribution, the decline in
drug concentration enters the slower S phase or elimination
phase, representing elimination.of drug from the central
compartment.
With both these models, and more complicated
mUlticompartment models, drug can enter the system
instantaneously (corresponding to a rapid intravenous
injection), by a zero-order process (corresponding to an
intravenous infusion) or by a first-order process
(corresponding to absorption from the gastrointestinal tract
or any other extravascular site).
In this work serum unchanged morphine concentration
data for each subject was analysed by computer using the
non-linear least-squares regression analysis program

55
NONLIN 48. The data points were fitted, without weighting,
to the following two functions.
Cp
Cp
=
=
e-kat )
e-kat ) + Be-yt
( 1 )
( 2 )
The quantity Cp represents the serum morphine
concentration at time t, and A, B, ka, Sand yare
coefficients which were varied iteratively by the program to
give curves of best fit, determined by comparison of the sum
of squares of the residual errors. These two functions
represent one and two compartment open pharmacokinetic
models respectively. The choice between equations (1) and
(2) as functions of best fit to the experimental data for
each subject was determined by a standard F-ratio test and
the criterion that the model selected be the one with the
fewest number of compartments which are necessary to
adequately describe the experimental data. For all subjects
there was no advantage gained by using equation (2) over the
simple equation (1).
2.6.2 Pharmacokinetic Parameters For Unchanged Morphine
All pharmacokinetic parameters for unchanged morphine
were calculated using conventional methods 49 • The
coefficientkain equation (1) represents the first-order
rate constant for absorption of morphine into the systemic
circulation from the site of injection. These coefficients
were used in equation (3) to calculate values for the
absorption ha life (t~abs)
t~ abs = ~n2 ( 3 )

56
The coefficient S in equation (1) represents the
first-order rate constant for morphine elimination. This
elimination may be due to drug metabolism or excretion. The
coefficients were used in equation (4) to calculate values
for the elimination half-life (tk elim), which is the time 2
for the amount of morphine in the systemic circulation to
fall to half of that initially present.
t~ elim = ~n2 S
( 4 )
Two other pharmacokinetic parameters were calculated
for each subject, the total body clearance (CL) and the
apparent volume of distribution (V). Clearance, like
t~ elim, characterises drug elimination, and is the volume
of blood or plasma cleared of drug per unit time. For most
drugs the clearance is constant over the plasma or blood
concentration normally found: that is, elimination is not
saturable, and the rate of elimination is directly
proportional to concentration. Clearance values were
calculated using equation (5).
CL = F.D AUC
( 5 )
The quantity F is the fraction of the administered morphine
dose absorbed which reached the general circulation. The
systemic availability of I.M. morphine has been shown to be
100%50, and F was assumed to be 1. D is the dose of
morphine administered. The usual form of morphine used in
clinical practice is morphine sulphate, rather than
anhydrous morphine as contained in papaveretum, so D was
expressed as morphine sulphate equivalents. AUC is the area
under the plasma morphine concentration versus time curve
determined by the least-squares regression analysis. Values
of AUC for each subject were calculated using equation (6),
1 1 AUC = A (S - ka)
where A, sand ka are as defined earlier.
57
( 6 )
The apparent volume of distribution is that volume of
fluid into which a drug appears to distribute with a
concentration equal to that in plasma. The volume, which
does not necessarily correspond to a real anatomic volume
(e.g. the blood volume), gives an indication of the extent
to which the drug passes from the plasma into the tissues.
Values of V for each subject were calculated using
equation (7),
V = CL S
where cl and S are as previously defined.
(7)
Table 17 gives the dose of morphine administered
(expressed as morphine sulphate equivalents), the
coefficients to equation (1) calculated by NONLIN, and the
derived pharmacokinetic parameters for each subject. Figure
10 shows unchanged morphine concentration versus time
curves, fitted by computer, for. the healthy volunteers and
the renal failure patients.
2.6.3 Statistical Analysis For Unchanged MorEhine
Pharmacokinetic parameters for the healthy volunteer
and renal failure groups were compared using unpaired
Student's t-test (2-tailed). The mean half life of morphine
absorption (t~ abs) and the mean half life of morphine
elimination (tk elim) were significantly shorter in the 2
patients compared with the healthy volunteers (p < 0.05).
The difference between the two groups in mean clearance (CL)
and in mean volume of distribution (V) corrected for body
weight did not reach statistical significance.

Table 17 Pharmacokinetic parameters of papaveretum disposition after intramuscular administration.
Healthy Dose A ka f3 t~ abs t~ elim AUC Volunteers (mg) (llg!L) (h) (h) (llgL-lh)
1 13 .3 55.9 5.28 0.3255 .0.13 2.13 161.18
2 15.3 39.24 6.29 0.2865 O.ll 2.42 130.74
3 13.3 40.08 19.84 0.3515 0.03 1.97 112.02
Mean 0.09 2.17 134.62
± s.e.m. 0.03 0.13 14.32
Renal Failure Patients
1 13 .1 58.52 31.22 0.495 0.02 1.40 116.37
2 11.3 48.58 22.77 0.526 0.03 1.32 90.16
3 10.0 48.43 17.06 0 .. 455 0.04 1.52 103.71
4 14.7 128.77 6.14 1.1015 O.ll 0.63 95.92
Mean 0.05 1.21 101. 54
± s.e.m. 0.02 0.20 5.67
CL (Lh-l kg- 1 )
1.03
1.30
1.52
1.28
0.14
1.22
2.17
1. 59
1. 73
1.67
0.19
V (Lkg-1 )
3.17
4.54
4.33
4.01
0.43
2.92
4.14
3.51
1. 57
3.05
0.55
V1 (X)

,....f I ....:l
6, .: . .: t> .: 0 t> Q) .: 'ri .c: 0. I-l 0
::<:
59
80 I , I I I I I I
Healthy volunteer 1
70 -
60 I- -I)
50 I-
0 r ...
40 I- I "" .... -1 .... 1 0 .... b o ~"b...
30 -I -, , 0 , ,
1 ',0 20 J
..... ..... , "'<l.. ..... , 11 ....... r ........ -10 ... -r ...... --- -"'- -- ...... -
I I , I I
0 0 50 100 150 200 250 300 350 400 450 500
Time (minutes)
80 ~-----~I--~I~---~I--~I------I~--~I----~I~---~I--~T------
70 I-Healthy volunteer 2 . '"
60 ·
50 -40 I-
o ........ 30 I- r 0'
G 'e. 0 I 0 .......... 0 0 1 ..........
20 t"l ..... 00...,
I "'0" ... I ...... 10 ~ 0 "'l:t-- _____ _
·
· - ........... -.......... _- .... _---
I I I I
50 100 150 200 250 300 350 400 450 500
Time (minutes)
Figure lOa. Measured serum morphine concentrations (0) and the computer-fitted curve (---) for healthy volunteers I and 2.

60
80 I I I I I I I T I
Healthy volunteer 3
70
60 .-I I ...:l S, 50 ~ . fi 40 ~ o t)
000
~"'~ Q) 30 I 0 'III .~ I 'b.p .c .... 0. 20 I "O ........ a, ~ .... ~ .......
~ b_, O '-1 ~ o~~~~~
-
-
-
-
........... -.E ------ ..... --0--OL-___ L-I ___ L-I ___ L-I __ -L ____ L-I ___ L-I __ ~~I--~~I--~~~
o 50 100 150 200 250 300 350 400 450 500
Time (minutes)
Figure lOb. Measured serum morphine concentrations (0) and the computer-fitted curve (---) for healthy volunteer 3 and patient 1.

61
80~---r---'----'----~1---r_,---r-1--"----~---~1--1
Patient 2 70
60 ,...; I H ~ 50 - I)
a I'
40 ~' '\ I \0
30 I I) ''0 , , , , 20 I) I) '0,
10
~ .... I)
........ ..... ... .$J (I
............................. " " 0
-
.
.
---°0L---5~0---1LOO---1L50---2~OO~~2~570~3~O=O~~=~~;---~~~~~~-~4~;~O~-~500
Time {minutes}
80----~1~--.,----.-,---~,---r_,---.r_--,,----~1---~·--1
70
,...; 60 I-' I
~ a 50 t-. a
o
§ 40 iP'" {) () [To, m I , a 30 tt eo,
:.a I , 0. I ~, ~ 20 ~ I) o-.~ :::: .... 'a...
10 ......
"'~-Q. """'" "'""" ..... -..a...
Patient 3
-
-
.... - ...... .!J I I I I 'I I I -------y---°0L---5LO---10LO---15LO--2~O~O~=25~O~=30~0~3~5~0~4~0~O~4~5~0~5~OO
Time (minutes)
Figure lOco Measured serum morphine concentrations (0) and the computer-fitted curve (---) for patients 2 and 3.

62
80 -, I I I I I I
Patient 4 -70 I- 0,\ I \ I c\
60 I \ (.... \
.-I
• b I ~ I \ e, 50 . \ -~ M \ . I 'P ~
I \ 0
tJ 40 ~ \ ~ I \ 0 tJ I \
30 I \ -OJ I \ ~
• .-j I \ ..c:: I \ -0.. 20 \ H \ 0 ~ '\
0 '\ 0' 10 ....
bo ..... 0 ......... _0 0 _~
I - ...... - ..... _-I 0
100 150 200 250 300 350 400 450 500 0 50
Time (minutes)
Figure IOd. Measured serum morphine concentrations (0 ) and
the computer-fitted curve (---) for patient 4.
Time (minutes)
Figure· II. Plasma morphine concentration versus time curves reproduced from the literature.

2.6.4 Pharmacokinetic Interpretation
(a) Unchanged Morphine
63
The literature contains several plasma unchanged
morphine concentration versus time curves for healthy
subjects who have been administered I.M. morphine 50 ,51.
These are shown in Figure 11 as plots reproduced from the
published curves using a grid to accurately read off the
data points. Curves 1-3 are computer fitted curves that
represent pharmacokinetic functions determined by non-linear
least squares regression analysis which describe the plasma
morphine concentrations at various times for three subjects
who each received 10 mg of morphine sulphate. Morphine
concentrations were measured by RIA. Curve 4 is a line
which was drawn through mean measured plasma morphine
concentrations for six subjects who each received 5.75 mg of
N-methyl-14c morphine sulphate per square metre of body
surface area. Morphine concentrations were determined by
measuring the radioactivity of extracted plasma samples.
Comparision of the pharmacokinetic curves calculated for
unchanged morphine in the healthy volunteers in the present
study with the literature curves shows that unchanged
morphine concentrations for the healthy volunteers in this
study were in the same range as those in the earlier
reports. In this study morphine absorption into the
systemic circulation from the site of injection was altered
in the patients with renal failure. The shorter absorption
half life shows that absorption was more rapid in the
patients than in the healthy subjects. The most likely
reason for the observed increase in the rate of morphine
absorption in the patients is an increased blood flow at the

64
site of injection which would transfer drug into the
systemic circulation more rapidly than normal. Cardiac
output is likely to be greater in patients with renal
failure 47 and there was reason to believe that the patients
in this study had higher than normal blood flows (section
2.5.1). Papaveretum was injected I.M. into the fistula arm
of the patients, and blood flow is also likely to be greater
in an arm with an arteriovenous fistula.
The rate of morphine elimination was also altered in
the patients with renal failure. The shorter elimination
half life for the patients shows that this group eliminated
morphine more rapidly than the healthy volunteers. Drug
elimination half life is dependent on both the ability to
eliminate drug (clearance) and the volume of distribution.
This can be seen from rearrangement of equations 4 and 7:
( 8 )
The mean volume of distribution was smaller and the mean
clearance higher for the patients than for the healthy
volunteers in this study. Unfortunately it was not possible
to establish whether a change in the volume of distribution
or a change in the clearance was responsible for the
decrease in the elimination half life because the difference
in the mean volume of distribution and in the mean clearance
for the two groups did not reach statistical significance.
Renal failure is known to cause a significant change in the
volume of distribution for a number of drugs 52 • Changes in
volumes of distribution are most often caused by unusually
low binding of drugs to plasma proteins. The binding of
many acidic drugs is decreased and the binding of many basic
drugs is increased in renal failure. These changes in

65
binding are usually due to a combination of a decrease in
serum albumin and a decrease in the binding capacity of the
albumin due to a change in molecular configuration or an
accumulation of an endogenous inhibitor. During renal
failure there is excessive retention of protein metabolism
by-products in the blood, a condition termed uremia. These
endogenous substances, normally excreted in the urine, but
retained in renal failure, can compete with drug at drug
receptor sites on proteins and in tissues. A decrease in
the protein binding of drugs which are normally highly
protein bound makes more free (unbound) drug available for
binding to the tissues and for possible clearance by the
liver (but see below) thus decreasing the total (bound plus
unbound) concentration of drug in the circulation and
increasing the volume of distribution. Drugs which are not
highly protein bound usually have little or no change in
their volume of distribution. The protein binding of
morphine in uremic patients has been shown to be impaired by
lowered concentrations of plasma proteins and albuminlO .
Because all patients except one in this study had serum
albumin concentrations in the normal range (Table 5), and
the extent of morphine's binding to plasma proteins is
normally small (30%)10, changes in the protein binding of
morphine in the patients studied are unlikely to have
contributed to a change in the mean volume of distribution
for this group. Impairment of drug binding at tissue sites
would be expected to cause a decrease in the volume of
distribution for drugs which are bound to a significant
extent to tissues but which are not bound to a significant
extent to plasma proteins. With one exceptionS3 , there is

66
little information on this point in the literature.
Impairment of morphine binding at tissue sites due to
retained endogenous substances, may have had some effect on
the volume of distribution for the patients in this study,
although this is unlikely because all patients were on
maintenance haemodialysis.
Clearance is a measure of the efficiency with which a
drug is removed from the body. The sum of individual organ
clearances equals the total drug clearance from the systemic
circulation. Severe renal failure could be expected to
reduce, or even prevent, drug clearance (by excretion and
possibly metabolism) by the kidney, leaving the liver as
(possibly) the main eliminating organ. Drugs which are
efficiently eliminated from the blood by the liver (drugs
with a high hepatic extraction ratio) have a clearance which
depends on blood flow to the liver, and which is independent
of any drug-protein binding. The clearance of drugs which
are not efficiently extracted by the liver depends on the
extent of drug-protein binding but is insensitive to changes
in liver blood flow. That is, clearance depends on the
liver's intrinsic clearance and not on the rate of drug
presentation. Morphine has been reported to have a high
hepatic extraction ratio (0.6-0.8) in healthy subjects 50 , so
a change blood flow but not a change in the extent of its
protein binding is likely to alter clearance by the
liver via conjugation with glucuronic acid. The patients in
this study probably had higher than normal blood flows, so
that morphine clearance by the liver may have been
increased.

67
(b) Conjugated Morphine
Conjugated morphine concentrations were measured in
the serum samples from patients 1 and 2. The conjugated
morphine concentration versus time curves for these two
patients are presented in Figure 12. The Figure also shows
a mean plasma conjugated morphine concentration versus time
curve reproduced from the literature5l for six healthy
subjects who each received 5.75 mg of morphine sulphate per
square metre of body surface area. The Figure shows that
morphine glucuronides accumulated in the patients in the
present study, and that high concentrations of metabolite(s)
were present even after 24 hours following papaveretum
administration. Morphine glucuronides in blood are excreted
primarily by the kidney into the urine in heathly subjects.
Some non-renal elimination also occurs via the faeces and
via enterohepatic recirculation (see note 4, Appendix B).
Renal failure would thus be expected to cause accumUlation
of the conjugated metabolites, assuming the rate of
conjugate formation is unaltered from normal.
2.6.5 This Work and the Renal Hypothesis
Morphine concentrations in the serum samples from the
subjects who took part in this study were measured by a
highly sensitive and specific analytical method, GCMS with
QSIM. The results show that renal failure did not impair
the elimination of morphine in the patients. The
elimination half lives for morphine were not prolonged, and
were actually slightly shorter than for the healthy
subjects. It is worth noting that the anephric patient had
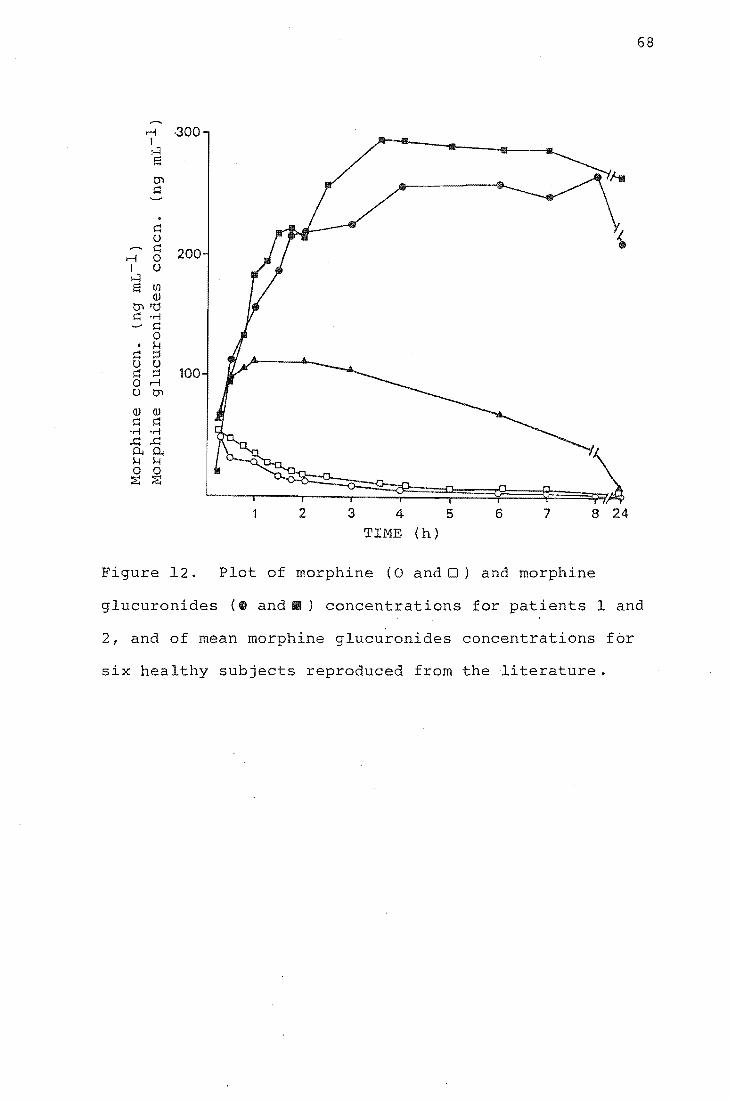
r-l I :---=l S tn ~
. ~ U ~
r-l 0 I U H S U)
ill tJ"l"d ~ 'r-!
~ 0 . i-l
~ :::::l U U ~ :::::l 0 r-l U tJ"l
·300
200
100
2 3 4 TIME (h)
5 6 7 8 24
gure 12. Plot of morphine (0 andO) and morphine
68
glucuronides (~ and.) concentrations for patients 1 and
2, and of mean morphine glucuronides concentrations for
six healthy subjects reproduced from the literature.

69
the shortest elimination half life. Morphine glucuronides,
measured in two patients, were eliminated slowly.
The renal hypothesis questions the traditional belief
that the liver is the main site of morphine metabolism, and
suggests that the kidney may have the major role. Morphine
elimination and production of morphine metabolites should
both be impaired in renal failure patients if the renal
hypothesis is valid. The results from this work show that
morphine elimination is not impaired by renal failure and
strongly suggest that the renal hypothe s is not correct.
The studies that have reported impaired morphine
elimination in patients with renal insufficiency, and on
which the renal hypothesis is largely based, have all used
an RIA method to measure morphine concentrations. Results
based on immunoassay determinations of morphine should be
viewed with caution. The antisera used in immunoassays for
morphine are unlikely to be completely specific for this
drug and may cross-react to some extent with morphine
metabolites. The antisera used by McQuay and Moore had a
cross-reactivity with morphine-3-g1ucuronide of less than
1%. The cross-reactivity with morphine-6-g1ucuronide was
not investigated. Figure 12 suggests that shortly after
morphine administration the concentration of conjugated
morphine metabolites in serum from renal failure patients
greatly exceeds the concentration of the parent drug, so
that even a low level of cross-reactivity may lead to an
overestimation of true morphine concentrations.
Cross-reactivity by a morphine antiserum could be reduced,
or even eliminated, by separating morphine from potentially
interfering metabolites by extraction before the immunoassay

determination is performed. The disadvantage of this
procedure is that an unknown recovery of drug will be
obtained.
70
Other evidence has been used to support the renal
hypothesis. The oral bioavailability of a
controlled-release morphine tablet has been measured and
found to be 100%54. Oral bioavailability indicates the
relative amount of an oral drug dose reaching the systemic
circulation as unchanged drug, and depends on the dosage
form of the drug (solubility, particle size etc.), and the
drug's metabolism. After oral administration morphine (and
other drugs) may be metabolised in the gut, the gut wall,
the portal blood or the liver prior to entry into the
systemic circulation. An oral bioavailability for morphine
of less than 100% would be predicted if significant
pre-systemic metabolism of morphine by the liver occurs.
The study reporting an oral bioavailability of 100% for
morphine used RIA to measure morphine concentrations, and
cross-reactivity by the antiserum with conjugated morphine
metabolites may have caused the estimate of bioavailability
to be erroneously high. Other measurements of morphine oral
bioavailability have produced figures in the range
15-64%55 (morphine concentrations measured by gas
chromatography). A significant difference exists between
the relative potency of orally and parenterally administered
morphine (30 mg orally is required for an analgesic action
equivalent to that of 10 mg by injection). As has been
noted in the literature, there is no simple explanation for
this difference if the kidney is the major site of morphine
metabolism.
71
The results of an investigation of morphine elimination
in patients with liver disease have been interpreted as
evidence that an important extrahepatic site for morphine
metabolism may exist22 (although this site need not
necessarily be the kidney). Patients with moderate to
severe cirrhosis who were administered I.V. morphine were
found to eliminate morphine and conjugated morphine
normally. Plasma morphine concentrations, both before and
after enzyme hydrolysis, were measured by gas
chromatography, so lack of specificity for morphine, such as
can occur with RIA, is less likely to have been a problem.
A number of other drugs which are metabolised in the liver
by conjugation with glucuronic acid, for example
10razepam56 and oxazepam57 (drugs with low hepatic
clearances), have also been found to have normal clearances
in patients with liver disease. A possible explanation for
these observations may be that the enzymes involved in
glucuronidation are located deep within liver microsomes,
making them less susceptible to liver damage. Another
possible explanation may be that glucuronidating enzyme
activity is not diminished by liver disease. Experiments
with rats have shown that damaged liver tissue can have
unaltered or even increased glucuronyl transferase
activity 58,59. A difficulty with both of these explanations
is that a frequent consequence of chronic liver disease is
the development of intra- and extrahepatic vascular shunts
that may carry drug in the portal circulation directly into
the systemic circulation, reducing drug presentation to the
liver's conjugating enzymes. There was evidence to suggest
that such shunts existed in the patients in the morphine

72
metabolism-cirrhosis study, so the finding of normal
morphine elimination makes it difficult not to postulate an
extrahepatic site for morphine conjugation.
The results from the present study do not explain the
anecdotal observations made by many nephrologists of delayed
recovery from the effects of morphine in patients with renal
failure. Because morphine does not accumulate in these
patients it is unlikely to be responsible for the prolonged
duration of drug action. Morphine glucuronides do
accumulate, but morphine-3-glucuronide is believed to be
pharmacologically inactive in humans lS •
Morphine-6-glucuronide may have considerable analgesic
activity14,60,6l, and this metabolite may be present in the
plasma of renal failure patients at concentrations exceeding
those of morphine itself. In this study no attempt was made
to distinguish between morphine-3-glucuronide and
morphine-6-glucuronide when determining morphine metabolites
conjugated with glucuronic acid. The glucuronide
concentrations determined for two patients will almost
certainly represent the total concentration of these two
compounds. The presence of morphine-3-glucuronide did not
affect determinations of morphine, and it is extremely
unlikely that the presence of morphine-6-glucuronide would
have any affect; morphine-6-glucuronide will be highly water
soluble, and the results themselves suggest freedom from
interference.

73
2.7 Conclusion
This study has shown that morphine elimination is not
impaired in patients with renal failure after the I.M.
administration of papaveretum, and that morphine
glucuronides are eliminated slowly in these patients. The
resu s suggest that renal failure patients may eliminate
morphine more rapidly than healthy subjects. This study has
been unable to confirm the observation that patients with
renal ilure have prolonged half lives for morphine
elimination. Immunoassay determinations of morphine are
unrel ble and probably overestimate morphine concentrations
because the antisera cross-react with conjugated morphine
metabolites. The renal hypothesis of morphine metabolism is
probably not valid, and some other explanation is required
to onalise the prolonged duration of morphine's action
in patients with renal failure. The major site of morphine
metabolism is also still uncertain. ~iore work is required
to establish this site to enable rational dosing of patients
with this valuable analgesic drug.
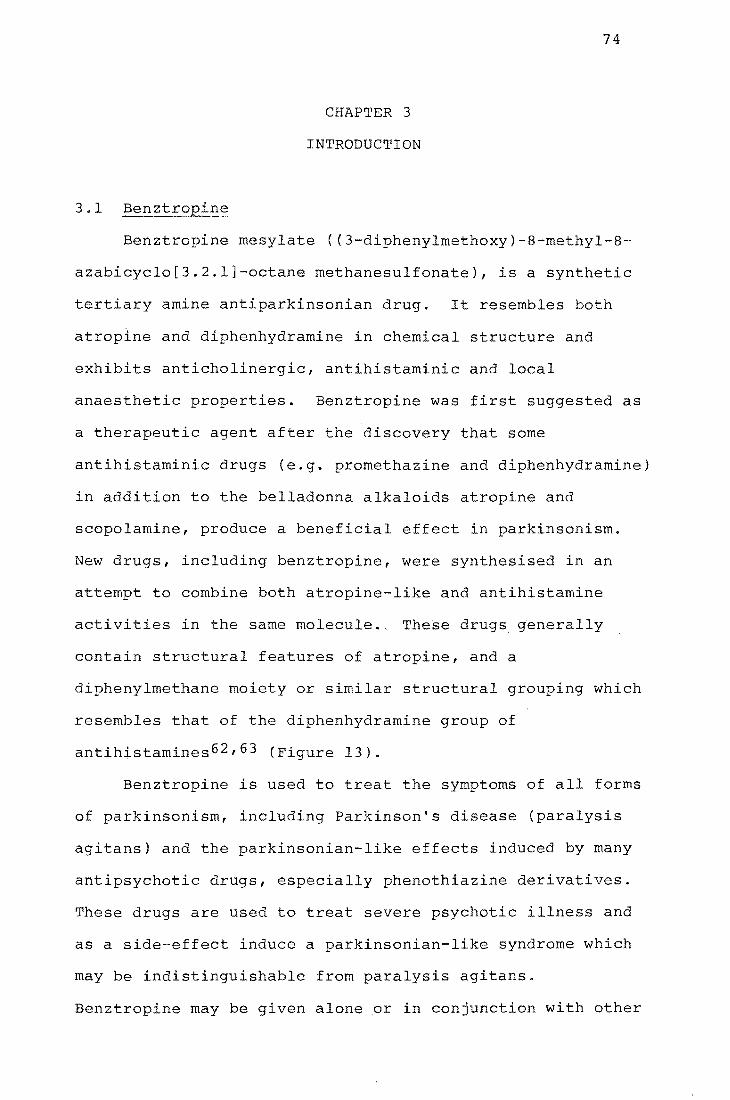
3.1 Benztropine
CHAPTER 3
INTRODUCTION
74
Benztropine mesylate «3-diphenylmethoxy)-8-methyl-8-
azabicyclo[3.2.1]-octane methanesulfonate), is a synthetic
tertiary amine antiparkinsonian drug. It resembles both
atropine and diphenhydramine in chemical structure and
exhibits anticholinergic, antihistaminic and local
anaesthetic properties. Benztropine was first suggested as
a therapeutic agent after the discovery that some
antihistaminic drugs (e.g. promethazine and diphenhydramine)
in addition to the belladonna alkaloids atropine and
scopolamine, produce a beneficial effect in parkinsonism.
New drugs, including benztropine, were synthesised in an
attempt to combine both atropine-like and antihistamine
activities in the same molecule .. The~e drugs generally
contain structural features of atropine, and a
diphenylmethane moiety or similar structural grouping which
resembles that of the diphenhydramine group of
antihistamines 62 ,63 (Figure 13).
Benztropine is used to treat the symptoms of all forms
of parkinsonism, including Parkinson's disease (paralysis
agitans) and the parkinsonian-like effects induced by many
antipsychotic drugs, especially phenothiazine derivatives.
These drugs are used to treat severe psychotic illness and
as a side-effect induce a parkinsonian-Ii syndrome which
may be indistinguishable from paralysis agitans.
Benztropine may be given alone or in conjunction with other
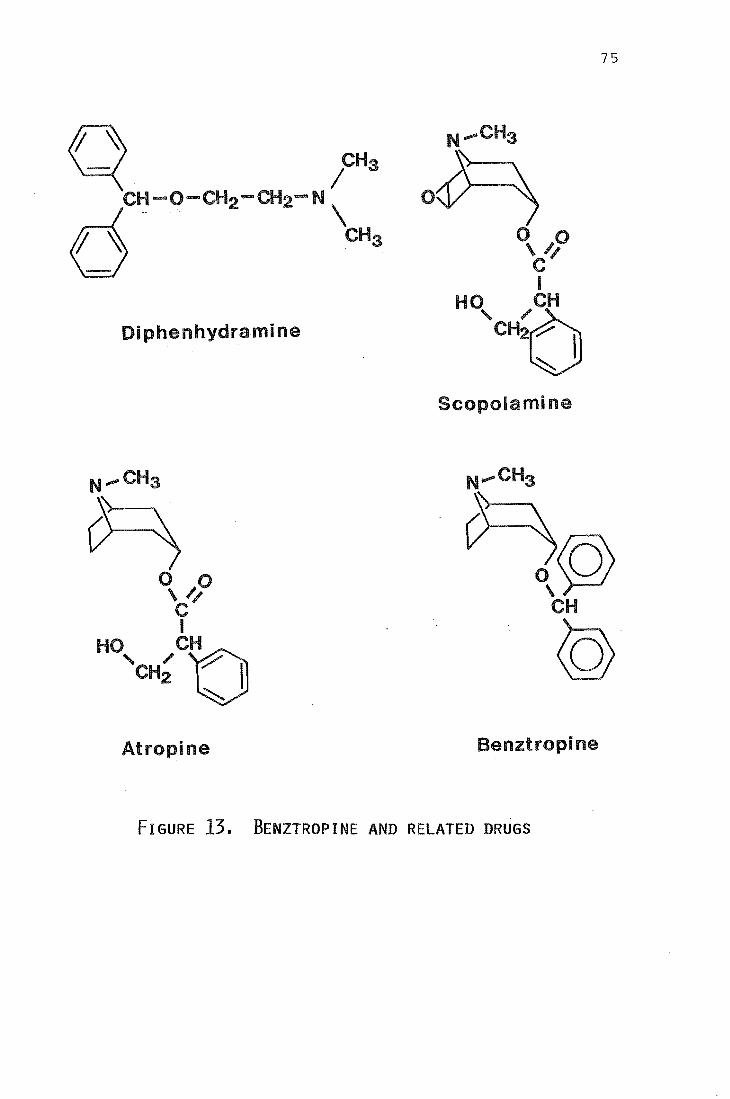
75
Di phenhydrami ne
Scopola mi ne
N ..... CHa
Atropine Benztropine
FIGURE 13. BENZTROPINE AND RELATED DRUGS

76
drugs, and may produce a number of adverse side-effects, for
example dryness of mouth, blurred vision and urinary
retention.
Benztropine is dispensed under the proprietry names
Benztropine, Benztropine mesylate, Congentin and Congenitol.
It is available, by prescription, in tablets of 0.5, 1 and
2 mg, and in a 1 mg mL-l solution for intramuscular or
intravenous injection. The normal therapeutic daily dose is
initially 0.5 to 1 mg and this is gradually increased up to
2-6 mg 64 .
There have been several reports describing the c nical
s of therapeutic and excessive benztropine
dosage 65 ,66 but very little information is available about
concentrations in body fluids and organs. Plasma and urine
concentrations of 79.5-125.6 ng mL-l and 5.3-123
ng mL-l respectively have been measured in four psychiatric
patients receiving antipsychotic medication and 2 mg
benztropine twice daily67. There have been no reported
pharmacokinetic studies for benztropine.
3.2 Analytical Methods for Benztropine
A spectrophotometric method for determining
diphenhydramine and other compounds having a diphenylmethyl
group, and thus applicable to benztropine, was
described in 197568 . Acid hydrolysis of the ether linkage
followed by oxidation gave benzophenone derivatives having a
higher ultra-violet (UV) absorption coefficient than the
original compounds, thus lowering the detection limit. The
method was sufficiently sensitive to determine drug
concentrations in urine after therapeutic dosages.
77
Gas chromatography using electron capture detection
(e.c.d.) has been investigated as a method to assay diphenyl
substituted compounds 69 . The electron capture sensitivity
was enhanced by oxidising the compounds to benzophenone
vatives prior to chromatography. The determination of
benz tropine was not specifically considered but the method
would appear sufficiently sensitive to detect the drug at
nanogram concentrations. A problem with methods using
oxidation is obtaining a high and reproducible yield of the
benzophenone product, and a number of oxidising agents have
been investigated70 ,71.
Benztropine and two other anticholinergic agents have
been included in an investigation of HPLC conditions
suitable for the quantitative determination of common
neuroleptic and antihistamine drugs in plasma72 - 74 . The
anticholinergics are likely to be coprescribed with these
drugs and may be present in the plasma samples being
analysed. The conditions of the assay were optimised for
measuring the neuroleptics and antihistamines by u.v., and
later, electrochemical detection. Quantitation of the
anticholinergics was not attempted but benztropine was
reported to g only a small signal.
The first and only assay specifically designed for
determining benztropine was recently reported by Jindal et
7 Using gas chromatography-mass spectrometry (GCMS),
with the mass spectrometer operating under electron-impact
conditions, benztropine concentrations in plasma and urine
were found by measuring the rat of specific fragment ion
intensities from benz tropine and a S.I.A. internal standard,
trideuteriomethylnorbenztropine ([2H3]-benztropine). The
78
assay could measure 5 ng mL-I with about 6% precision and
was used to measure drug concentrations in plasma and urine
samples from patients on benztropine therapy.
3.3 This Work
A GCMS procedure with electron impact ionisation has
been reported for determining benztropine in plasma and
urine. This section the thesis describes a method for
determining benztropine by GCMS with ammonia chemical
ionisation mass spectrometry. [2H3]-benztropine was
synthesised by a new method and used as an internal
standard. The assay was developed for measuring benztropine
concentrations in post-mortem blood and for detecting
benztropine in post-mortem liver samples submitted for
analysis to the Christchurch Laboratory of the Chemistry
Division of the Department of Scienti c and Industrial
Research (DSIR). This laboratory is responsible
providing an analytical service for the Coroners in its
area. The development of the assay was prompted by reports
from the laboratory of difficulty in detecting benztropine
using its normal drug screening procedures.
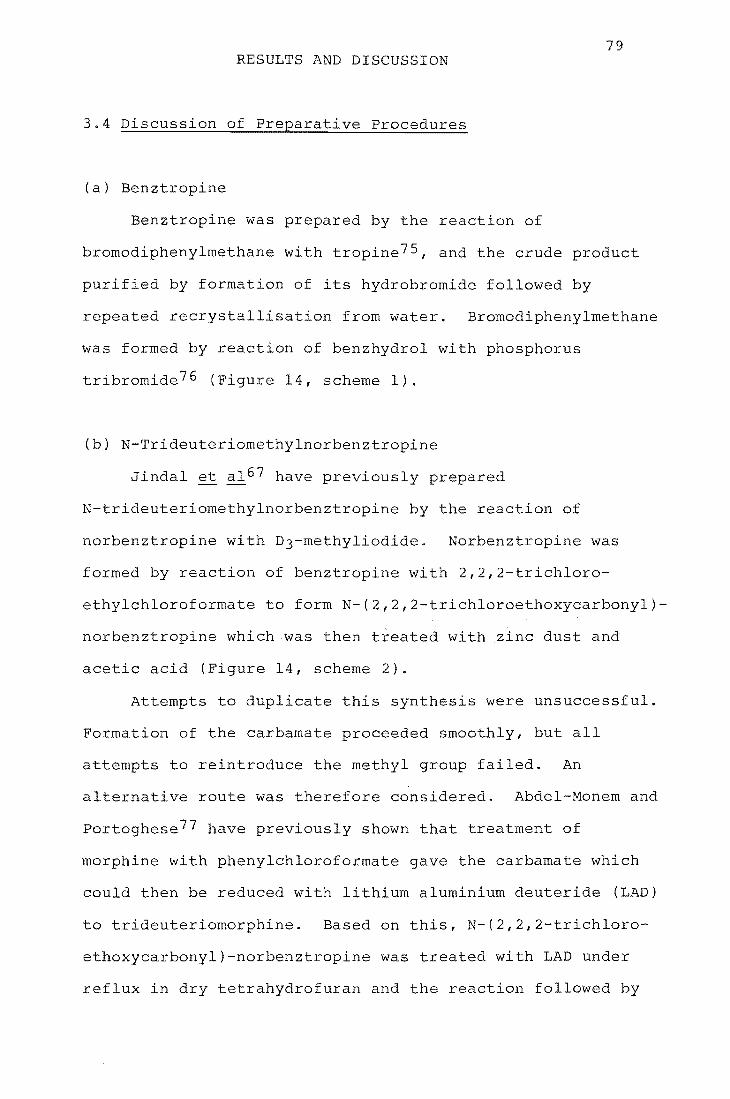
79 RESULTS AND DISCUSSION
3.4 Discussion of Preparative Procedures
(a) Benztropine
Benztropine was prepared by the reaction of
bromodiphenylmethane with tropine 75 , and the crude product
purified by formation of its hydrobromide followed by
recrystal s on from water. Bromodiphenylmethane
was formed by reaction of benzhydrol with phosphorus
tribromide 76 (Figure 14, scheme 1).
(b) N-Trideuteriomethylnorbenztropine
Jindal et a1 67 have previously prepared
N-trideuteriomethylnorbenztropine by the reaction of
norbenztropine with D3-methyliodide. Norbenztropine was
formed by reaction of benztropine wi
ethylchloroformate to form N-(2,2,2
2,2,2-trichloro
chloroethoxycarbonyl)-
norbenztropine which was then treated with zinc dust and
acid (Figure 14, scheme 2).
Attempts to duplicate this synthesis were unsuccessful.
Formation of the carbamate proceeded smoothly, but all
attempts to reintroduce the methyl group failed. An
alternative route was therefore considered. Abdel-Monem and
portoghese77 have previously shown that treatment of
morphine with phenylchloroformate the carbamate which
could then be reduced with lithium aluminium deuteride (LAD)
to trideuteriomorphine. Based on s, N-(2,2,2-trichloro-
ethoxycarbonyl)-norbenztropine was treated with LAD under
reflux in dry tetrahydrofuran and reaction fol by

80
Scheme 1:
A + ...
OH
Scheme 2:
Zn- AcOH
Scheme 3:
li
Figure 14. Preparative methods for DO- and D3-benztropine
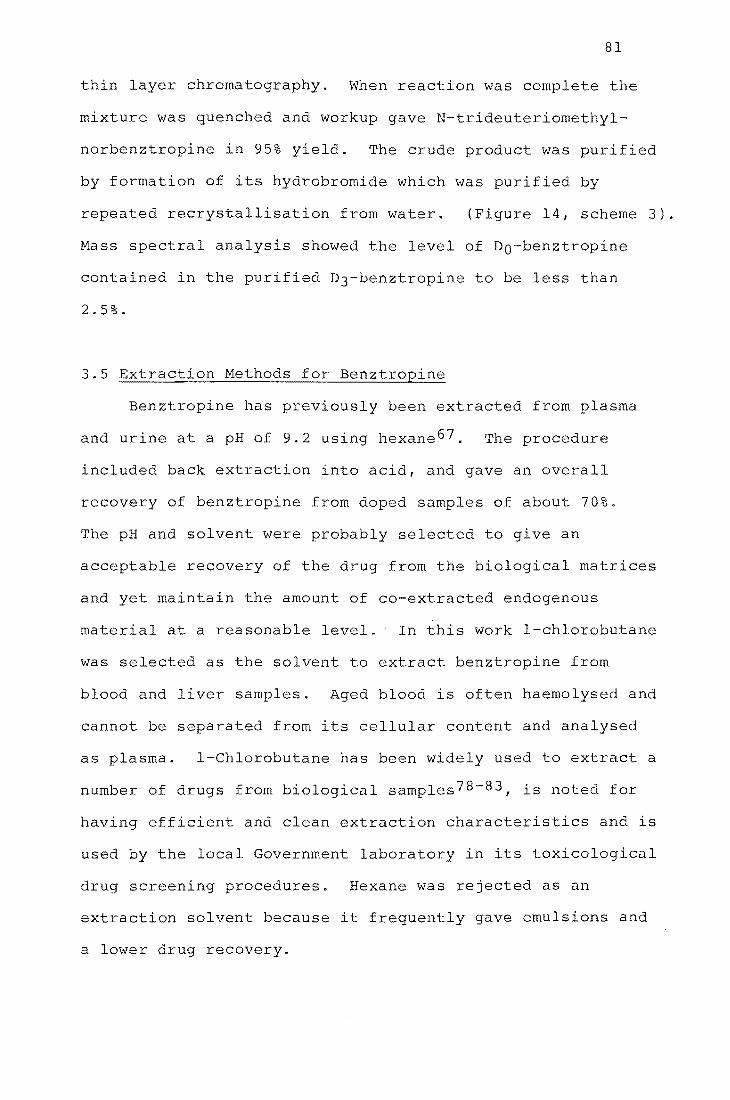
81
thin layer chromatography. When reaction was complete the
mixture was quenched and workup gave N-trideuteriomethyl
norbenztropine in 95% yield. The crude product was purified
by formation of its hydrobromide which was purif by
repeated recrystallisation from water. (Figure 14, scheme 3).
Mass spectral analysis showed the level of Do-benztropine
contained in purified D3-benztropine to be less than
2.5%.
3.5 Extraction Methods for Benztropine
Benztropine has previously been extracted from plasma
and urine at a pH of 9.2 using hexane 67 . The procedure
included back extraction into a d, and gave an overall
recovery of benztropine from doped samples of about 70%.
The pH and solvent were probably se cted to give an
acceptable recovery of the drug from the biological matrices
and yet maintain the amount of co-extracted endogenous
material at a reasonable 1. - In this work l-chlorobutane
was selected as the solvent to extract benztropine from
blood and liver samples. Aged blood is often haemolysed and
cannot be separated from its cellular content and analysed
as plasma. l-Chlorobutane has been widely used to extract a
number of drugs from biological samples 78 - 83 , is noted for
having efficient and clean extraction characteristics and is
used by the local Government laboratory in its toxicological
drug screening procedures. Hexane was rejected as an
extraction solvent because it frequently gave emulsions and
a lower drug recovery.

82
Post-mortem Blood
Haemolysed blood was extracted as 1 mL aliquots in
10 mL glass tubes with ground glass stoppers. The blood was
made basic with sodium hydroxide and extracted twice with
l-chlorobutane. The combined organic phase was reduced in
volume and extracted into acid. After washing with the
extraction solvent the aqueous phase was made alkaline and
re-extracted with l-chlorobutane. Several drops of a 1%
solution of hydrochloric acid in methanol were added and the
organic solvent was evaporated. The extracts were
reconstituted in ethanol and analysed by ammonia CI GCMS.
The recovery of benztropine from blood using this
extraction procedure, shown in Table 18, was determined
using GCMS by spiking drug-free blood with benztropine at
the concentrations shown, extracting the blood and adding
D3-benztropine prior to evaporation of the organic solvent.
Post-mortem Liver.
Drugs in tissue samples must be released from their
encapsulating environment prior to extraction. Methods used
to destroy tissues rely upon the removal of proteins by
protein hydrolysis or protein precipitation. Protein
hydrolysis involves treating tissue homogenates with strong
acid or alkali 84 , or with a proteolytic enzyme 85 • Protein
precipitation involves the addition of a reagent, such as
tungstic acid, to denature protein molecules 86 . In this
work homogenised human post-mortem liver tissue was buffered
at a suitable pH and incubated with the bacterial
proteolytic enzyme subtilisin Carlsberge to hydrolyse tissue
proteins. An aliquot of the liver digest was then extracted

Blood benztropine
concn.
50 ng mL-l
200 ng mL-l
% Recovery
(mean of 5)
76
78
Range
68-85
73-82
Table 18. Recovery of benztropine from post-mortem
blood.
Liver benztropine
concn.
250 ng g-l
1 llg
% Recovery
(mean of 5)
72
74
Range
65-81
66-88
Table 19. Recovery of benztropine from post-mortem
liver (drug added to liver digest)
83

84
using the procedure described for blood and plasma, and
analysed by GCMS. Subtilisin Car1sberge has been used
previously to digest human liver tissues and
1-ch1orobutane has been reported to give clean and
emulsion-free extracts (determined using a
nitrogen-phosphorus detector) of the resulting digest 87 .
Enzyme hydrolysis avoids the disadvantages of drug
degradation or drug coprecipitation common with the more
traditional pre-extraction procedures used for drug analysis
in tissues. Subtilisin Car1sberge cleaves most peptide
bonds in proteins over a broad range of pH (7.0-11.0) and
exhibits maximum proteolytic activity at lower temperatures
than normally required for acid or alkaline hydrolysis.
The recovery of benztropine from post-mortem liver,
determined in a similar manner to blood, is shown in Table
19. The recovery of benztropine extracted from both
post-mortem blood and liver shows a variability that would
be unacceptable in a quantitative assay using external
standards. This variability presents no difficulties in the 1
assay described here, however, because an internal standard
is used which accommodates this.
3.6 Gas chromatography
Benztropine is thermally stable and sufficiently
volatile to be chromatographed without derivatisation.
3.7 Mass Spectrometry of Benztropine
The EI mass spectra, and methane, isobutane and ammonia
CI mass spectra, for Do-benztropine and D3-benztropine were
obtained and are shown in Figures 15 and 16. The EI spectra

Figure 15. EI mass spectra of DO- and D3-benztropine.
140 100 -
----.....
CJ')
t:: Q) 50 124 +' t:: ...... -
..... 201 Q) 167 c::
307 -
J -,1.L 'I • • ,
100 200 300 m/z
(a) EI mass spectrum of DO-benztropine
100_ 143
-
->, +' CJ')
127 165 t:: Q)
50. +' t:: ......
0- 167 & - 152 204
- 310
II II • • I I I
100 200 300 m/z
(b) EI mass spectrum of D3":"benztropine
85
• I 400
4bo
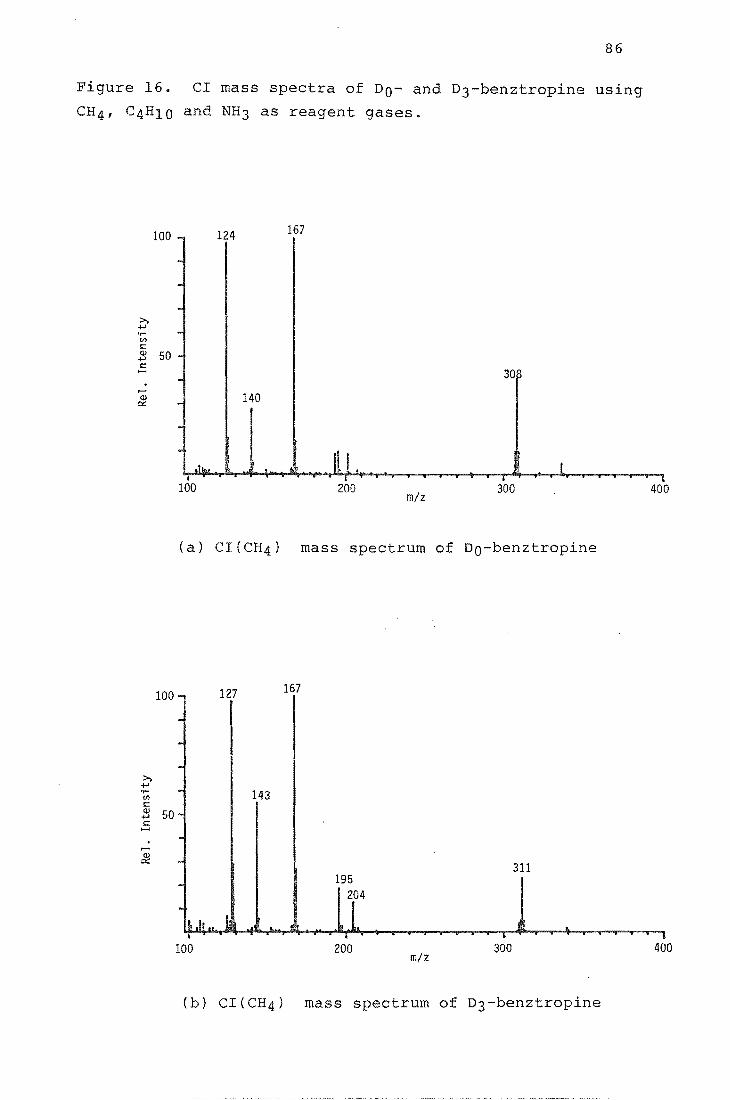
86
Figure 16. CI mass spectra of DO- and D3-benztropine using
CH4, C4H10 and NH3 as reagent gases.
100 124 167
>, .;..>
Vl 1= Q) 50 .;..> 1= ......
30~ ,...... Q)
0:: 140 ,
~.~~~~~~~~Il+,I~·~~~~~~~~I~~~l~~~~~1 100 200 300 400
m/z
(a) CI{CH4) mass spectrum of DO-benztropine
100 - 127 167
. >,
.;..> 'r- 143 Vl 1= Q) 50 -.;..> 1= ..... . ,...... Q) . 0::
311 195
ILII ... 1 ~ 2[4
j .. i l I
100 200 m/z
300 400
(b) CI(CH4) mass spectrum of D3-benztropine
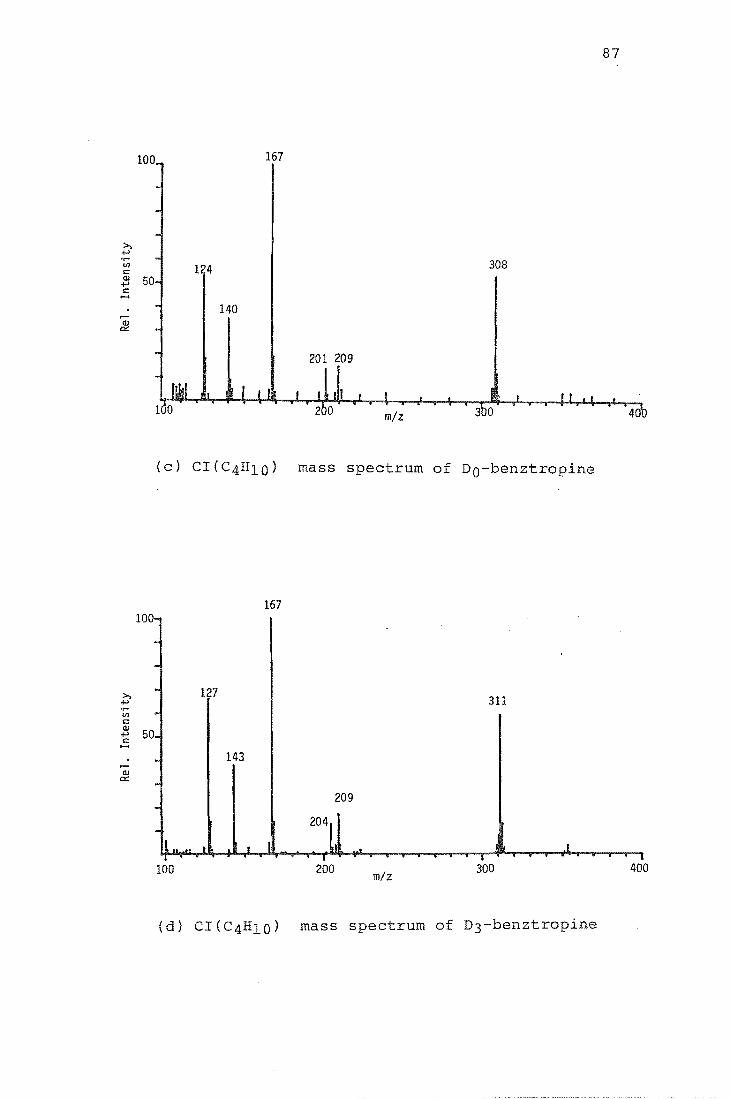
87
100 167
124 308
140
201 209
40'0
(c) CI(C4 0) mass spectrum of DO-benztropine
167 100-
--
>, 127 -4-> 311 U) -<:: Q)
50 -4-> <:: .....
- 143 .--
Q) c::
209 -- 2°l 1 .. ~.. t I .L
I I I
100 200 m/z 300 400
(d) CI(C4HIO) mass spectrum of D3-benztropine
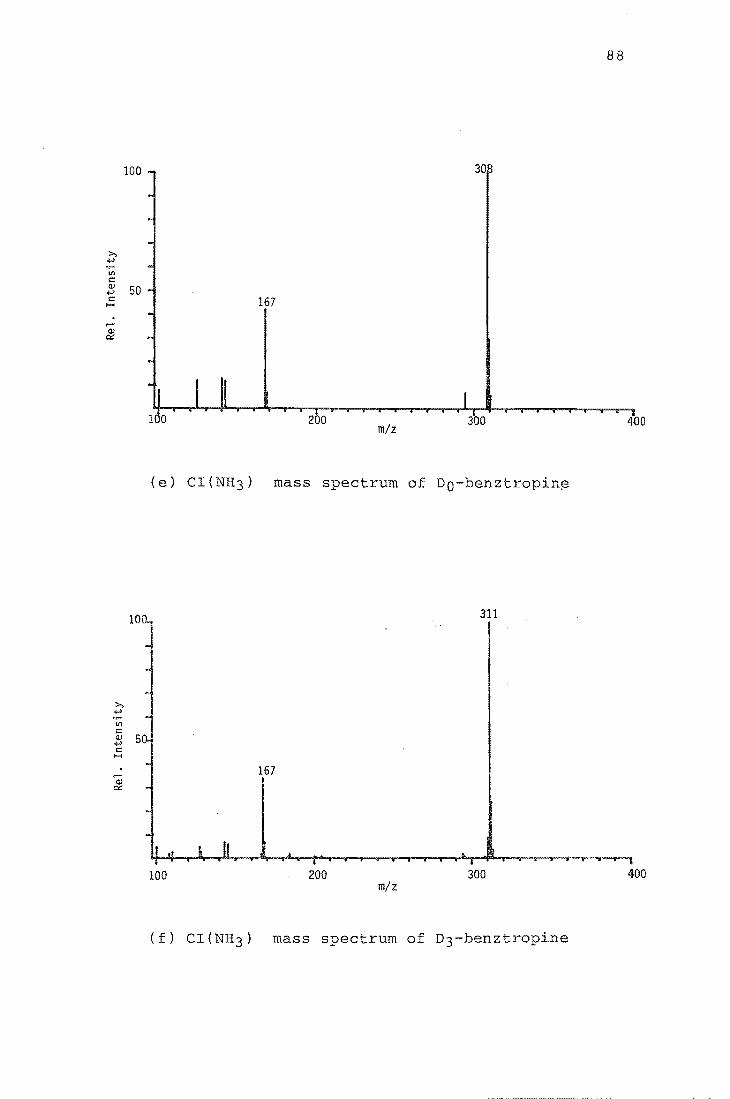
88
100 30
>, +' til <= Q) 50 +' <= 167 .....
..... Q) IX
2 a m/z
300 400
(e) CI(NH3) mass spectrum of Do-benztropin~
311
>, +' .~
til <= Q) 50; +' <=
I'-<
~ 167
Q) IX
100 200 300 400 m/z
(f) CI(NH3) mass spectrum of D3-benztropine

89
show molecular ion peaks (M+) (m/z 307 and 310), and
extensive fragmentation with base peaks m/z 140 and 143
respectively. The CI spectra show protonated molecu ion
peaks (MH+) (m/z 308 and 311), and much less fragmentation.
The base peak with ammonia reagent gas is MH+ but with
methane and isobutane it is a fragment ion. Both compounds
show less fragmentation with ammonia than with methane or
isobutane. A large fraction of the total ion current is
carried by MH+ - methane (7%); isobutane (12%) and ammonia
(43%). This suggested that monitoring MH+ under CI,
particularly with ammonia reagent gas, might provide high
sensitivity for the quantitation of benztropine. As was the
case with the CI spectra of TMS2-morphine, the CI spectra
all show sufficient fragmentation to allow high specificity
to be attained by monitoring more than one ion.
A comparison of sensitivities was made experimentally
by injecting equal amounts of benztropine into the GCMS
whi the mass spectrometer was monitoring the base peak
under EI (m/z 140) and then m/z 308 using CI for all three
reagent gases. Ion intensities were determined and
compared by measuring peak heights on a chart recorder. The
CI response for MH+ with ammonia was about one and a half
times that obtained with isobutane, which in turn was about
the same as that obtained with methane. The CI response
with all three reagent gases was greater than that obtained
while monitoring the base peak under EI. CI sensitivities
were also compared for the base peak of benz tropine with
methane (m/z 167), isobutane (m/z 167) and ammonia (m/z
308), and again the response was greatest with ammonia.
Based on these results, ammonia CI was selected for the

quantitation of benztropine in blood extracts and the
detection of benztropine in liver extracts.
3.8 GCMS Analysis
90
Quantitation of benztropine in blood was based on the
MH+ ion intensities from Do-benztropine (m/z 308) and
D3-benztropine (m/z 311). The procedures used were similar
to those which have been described earlier for the
quantitation of morphine in plasma. The GC column and the
ion source were saturated with DO- and D3- benztropine
before beginning analysis of the blood extracts. Figure 17
shows selected-ion chromatograms (m/z 308 and 311) near the
retention time for benztropine for extracts prepared from
doped blood and for extracts prepared from blank blood. A
calibration graph was prepared to establish that the
relationship between the mass spectrometer ratios and the
mass ratios was linear. The calibration graph was prepared
using extracted blood that contained DO- and D3-benztropine
in the ratios 0.25, 0.50, 1.0 and 2.0 DO:D3 with DO + D3 =
100 ng mL-l. The preparation of the standard mixtures of
DO- and D3-benztropine used to spike the blood is discussed
in the experimental section. A weighted linear least
squares procedure was used to find the regression line for
the calibration graph, in a similar manner to that which has
been described for morphine in the previous section of this
thesis. The ion intensity ratios and statistical analysis
are given in Table 20, and the calibration graph is
presented in Figure 18. The data firm a simple linear
relationship between the appropriate ion intensity ratios
and the concentration of benztropine in blood. The accuracy

m/z 311
m/z 308
m/z 308 ..... J~
(a) (b)
91
Figure 17. Response at m/z 308 and 311 near the retention time
for benztropine for (a) an extract from blank blood and (b) an
extract from blood doped with DO + D3 = 100 ng mL-l
benztropine.

TABLE 20. CALIBRATION DATA AND REGRESSION ANALYSIS STATISTICS
Concn. in blood DO/D3 ratio n x s (DO + D3)
100 ng mL-l 0.25 5 0.264 0.02904
" 0.50 " 0.532 0.04628
" 1. 00 " 1. 031 0.06283
" 2.00 II 1. 943 0.17388
Correlation Gradient % of explained Parameters for Theoretical value
coefficient (r) variation least squares of r at 99.9%
100 r2 line
y = a + bx
0.9992 0.9965 99.8 Y = 0.02088 + 0.9965x 0.6787
iJJ I'-J

o 2.5 .,...j
.jJ oj H .jJ 2.0 .L: tJl
.,...j
(!J
.L: 1.5 ~ oj (!J
p, 1.0 (Y")
Q ""-o Q 0.5
93
0.0 1::..---l...._..I....---.l.._-L---l_-L._..l..---L_-'-----.:I....-.....L_...L..--1
0.0 0.2 0.4 0.6 0.8 1.0 1.2 1.4 1.6 1.8 2.0 2.2 2.4 2.6
DO/D3 mass ratio
Figure 18. Cal ion graph for benztropine in blood
100 ng mL-l, • mean of 5 measurements)

94
of the procedure for measuring benztropine was assess by
six determinations of a single doped blood sample containing
benztropine at a concentration of 50 ng mL-l. Measured
levels were 47.4 ± 3.6 ng mL-l when DO:D3 = 1, and 46.2
± 6.3 ng mL-l when DO:D3 = 0.5.
Figure 19 shows selected-ion chromatograms (m/z 308 and
311) near the retention time for benztropine for extracts
prepared from doped and blank liver samples. The doped
sample contained benztropine at a concentration of 50 ng
gram- l of liver. The traces are free of interference at
both m/z values, and suggest that D3-benztropine could also
be used for the quantitation of benztropine in liver
samples.
3.9 Interference by other Drugs
A list of drugs with which benztropine is commonly
coadministered is presented in Table 2188. These drugs may
be present in biological specime~s presented for analysis of
their benztropine concentration. To determine if any of
these drugs would interfere with the detection of
benztropine in blood and liver samples analysed by the
present method, a blood and a liver sample were spiked with
each of the drugs listed in Table 21 at a concentration of
10 ~g mL-l and 50 ~g gram- l respectively, and then extracted
and analysed in the manner which has been described. No
peaks were detected near the retention time of benz tropine
while monitoring MH+ ions from DO- and D3- benztropine.

95
m/ z 311
m/ z 311
m/z 308 m/z 08
(a) (b)
Figure 19. Response at m/z 308 and 311 near the retention time
for benztropine for (a) an extract from liver doped with DO + D3
100 ng gram- l benztropine, and (b) an extract from blank liver.
Triflupromazine
Haloperidol
Chlorpromazine
Triazolam
Lorazepam
Lithium carbonate
Table 21. Drugs commonly coadmini with benztropine

3.10 Interpretation of Results
The CI GCMS assay presented here is sens ive and
specific for measuring benztropine concentrations in
post-mortem blood, and for detecting benztropine in
post-mortem liver. The assay is more spec and
96
potentially more sensitive than the GCMS assay using EI
ionisation which has previously been reported67 • The
absolute sensitivity obtainable depends on a number of
factors including the volume (or mass) of sample which is
prepared for analysis, and the amount of material which is
injected onto the gas chromatographic column for detection
by the mass spectrometer. In this work 1 mL blood samples
and 10 gram liver samples were extracted, but this volume
and mass could be increased to give a corresponding decrease
in the assay's detection limit. The detection limit could
be lowered still further by using an on-column injector on
the gas chromatograph - the on-column injector used during
the work described in Chapter 2 of this thesis was not
available when the present assay was developed. In its
present form a detection limit for benztropine of 2 ng
mL-l in blood and 10 ng gram- l in liver seems possible.
The extraction procedure described is adequate for
handling partially decomposed blood and liver samples. A
good recovery of benz tropine was obtained and the amount of
coextracted endogeneous material was minimal, as indicated
by a lack of any significant background ions when the total
ion current for a blood and a liver sample containing no
benz tropine was monitored.
Other drugs commonly coadministered with benztropine
were shown not to interfere with this assay. Blood and

97
ssue samples (liver in particular) are likely to contain
metabolites of these drugs, however, and further work is
required to determine if the chromatographic conditions used
need to be modified to eliminate interference by these
substances.
lusion
The procedure described here is highly specific and
sensitive for detecting and measuring benztropine in
post-mortem blood, and for detecting benztropine in I

4.1 Datura Stramonium
CHAPTER 4
INTRODUCTION
98
Datura stramonium, also called Thorn Apple, Jimson weed
and Jamestown weed, is a poisonous plant that grows in both
waste and cultivated land in various parts of New Zealand.
The plant is indigenous to the region of the Caspian Sea and
is one of fifteen to twenty species of Datura which range
from annual and perennial herbs to shrubs and trees. These
plants are all members of the Nightshade (Solanaceae)
family89,90.
All parts of the D. stramonium plant (leaves, flowers,
seeds and roots) contain the physiologically active tropane
alkaloids (-)-hyoscyamine and (-)-scopolamine (hyoscine).
The racemic form of (-)-hyoscyamine is atropine and this
alkaloid may also be present in parts of the plant.
Hyoscyamine and (-}-scopolamine are esters of tropic acid
with the bases tropine and scopoline respectively. The
structures of atropine and scopolamine have been presented
in Figure 13.
4.2 Poisoning by Datura Stramonium
Atropine and scopolamine act on the body by preventing
the neural transmitter acetylcholine from exerting its usual
effect on receptor sites at nerve junctions. Symptoms of
poisoning by these compounds are characterised by nausea and
vomiting, a dry mouth, dilated pupils and hallucinations and
fever. Accidental poisoning following ingestion of ~
stramonium is uncommon, both in humans and in livestock, in

99
this country and overseas. Accidental poisonings have
mainly involved young children eating the plant seeds 9l - 95 ,
which have a high alkaloid content. In recent years there
has been an increasing incidence of intoxication and
poisoning following abuse of this plant. This is largely
the result of the discovery that the leaves of D. stramonium
can yield a legal and readily obtainable hallucinogen.
Reported cases of abuse have usually involved the drinking
of an aqueous plant extract, referred to as "Datura tea".
The extent of the (often prolonged) effects of drinking such
a preparation are illustrated by a recent newspaper report
of three youths who were found experimenting with the
plant 96 :
"The teenagers were hallucinating some hours after they were
brought into the (police) station and one of them, who had
been released because he seemed better, was found upstairs
at the station taking his socks off and saying he was going
to bed. Another was convinced he was fixing the carburettor
of his car. They were away with the fairies •.••• "
4.3 This work
There are numerous references in the literature
concerning the alkaloid content of D. stramonium, but
nothing is known about the alkaloid content of aqueous
extracts prepared from the leaves. The chemical properties
of atropine 97 , the main alkaloid in D. stramonium leaves,
suggest that such extracts might contain high levels of this
compound.
THE LIBRARY UNIVERSITY OF CANTERBURY
CHRISTCHURCH, N.l.

100
This section of the thesis describes a brief
investigation to determine how efficiently atropine is
extracted into water when leaves of D. stramonium are used
to prepare a "Datura tea". The atropine concentration in an
aqueous extract, and in an extract prepared by exhaustive
organic solvent extraction of plant leaves was measured in a
CI QSIM assay for atropine using trideuterionoratropine as
an internal standard. The study was prompted by a request
from a nearby Government Laboratory for information about
atropine concentrations in aqueous D. stramonium extracts.
The Laboratory has recently experienced difficulty in
detecting atropine in post-mortem specimens taken from
people who have died from a drug overdose and who may also
have been drinking Datura tea at the time of the death.

101
RESULTS AND DISCUSSION
4.4 Discussion of Preparative Procedures
N-Trideute omethylnoratropine (D3-atropine) was prepared
from N-trideuteriomethylnortropine and acetyltropylchloride
using the method of Fung and DeGraw98 . Addition of formaldehyde
to the Grignard derivative of phenylacetic acid, gave after
hydrolysis, tropic acid 99 . This was treated with acetyl
chloride and then thionyl chloride to give acetyltropyl
chloridelOO (Figure 20, scheme 1). N-Trideuteriomethylnor
tropine was prepared by the lithium aluminium deuteride
reduction of N-ethoxycarbonylnortropine which was formed by ,
reaction of tropine with ethylchloroformate98 (Figure 20,
scheme 2). Addition acetyltropylchloride to N-trideuterio-
methylnortropine with heating gave, after acid hydrolysis and
workup, N-trideuteriomethylnoratropine which was purified by
repeated recrystallisation from acetone (Figure 20, scheme 3).
Mass spectral analysis showed the level of Do-atropine contained
in the purified D3-atropine to be less than 1%.
4.5 Plant Material
Seeds of D. stramonium were obtained from the Botany
Division of the Department of Scientific and Industrial
Research. The seeds were sed in the Dniversity1s Botany
Department glasshouse and several young plants were
transferred to the University nursery. Leaves of the plants
were collected when the plants were in the
flowering-fruiting stage of development, this having been

Scheme 1:
(1) HCHD -----
(Z) H30 +
Scheme 2: Q
A a AHl II
CH3CHZOCCl LiAlO4
OH a1
Scheme 3:
+ (1) 4hrs. at 90° A
OH
Figure 20. Preparative methods for D3-atropine
102
A OH
A
(1) CH3COCI
(2) SOCIZ
~o 0
HO o

103
reported as the time of maximum alkaloid content. The
leaves were air dried and stored in a tight containers.
4.6 Preparation of an Aqueous Plant Extract
Unsuccessful attempts were made to obtain information
about how Datura tea is usually prepared. Several people
who had been apprehended after drinking aqueous Datura
extracts were approached (by the Police) but were unwilling,
or unable, to give this information.
One book, describing the history, cUltivation and use
of garden herbs gives the following information concerning
herb teas lOl :
"They are made with an infusion fresh or dried leaves or
flowers and boiling water, and Ie to steep for a few
minutes with a lid on the pot or a cover over the cup, and
drunk either hot or cold .... the amount to use when making a
herb drink is a tablespoon of fresh l~aves to one pint of
water, and half that amount of herbs, or even
dried leaves. 1I
S, if using
Based on this recipe, dried D. stramonium leaves
(2.50 g) were soaked in boiling water (1140 mL) in a covered
glass beaker for several minutes. The aqueous extract was
made up to a volume 2 L with water and four 1 mL aliquots
of this extract were taken. To three of these samples was
added an appropriate amount of D3-atropine. All samples
were then made basic with concentrated ammonia solution and
extracted with chloroform in 10 mL glass tubes with ground
glass stoppers. The extracts were reconstituted in ethanol
and kept cold until analysed.
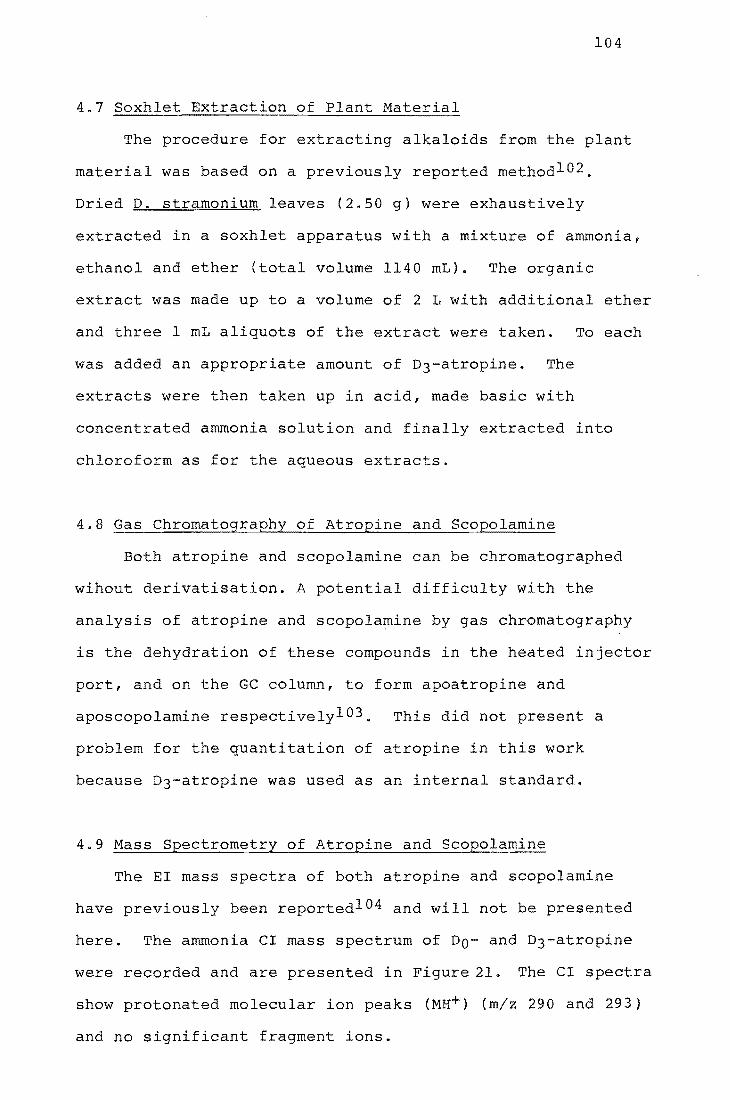
104
4.7 Soxhlet Extraction of Plant Material
The procedure for extracting alkaloids from the plant
material was based on a previously reported methodl02 .
Dried D. stramonium leaves (2.50 g) were exhaustively
extracted in a soxhlet apparatus with a mixture of ammonia,
ethanol and ether (total volume 1140 mL). The organic
extract was made up to a volume of 2 L with additional ether
and three 1 mL aliquots of the extract were taken. To each
was added an appropriate amount of D3-atropine. The
extracts were then taken up in acid, made basic with
concentrated ammonia solution and finally extracted into
chloroform as for the aqueous extracts.
4.8 Gas Chromatography of Atropine and Scopolamine
Both atropine and scopolamine can be chromatographed
wihout derivatisation. A potential difficulty with the
analysis of atropine and scopolamine by gas chromatography
is the dehydration of these compounds in the heated injector
port, and on the GC column, to form apoatropine and
aposcopolamine respectivelyl03. This did not sent a
problem for the quantitation of atropine in this work
because D3-atropine was used as an internal standard.
4.9 Mass Spectrometry of Atropine and Scopolamine
The EI mass spectra of both atropine and scopolamine
have previously been reportedl04 and will not be presented
here. The ammonia CI mass spectrum of DO- and D3-atropine
were recorded and are presented in Figure 21. The CI spectra
show protonated molecular ion peaks (MH+) (m/z 290 and 293)
and no significant fragment ions.
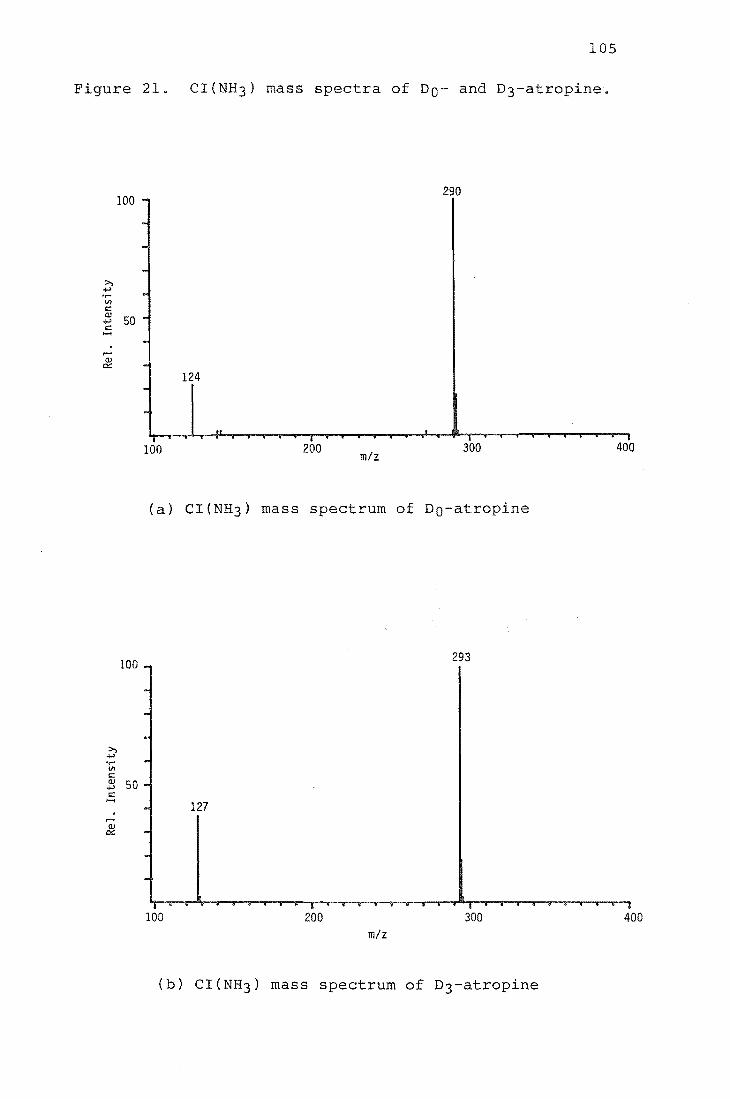
105
Figure 21. CI(NH3) mass spectra of DO- and D3-atropine.
290 100
124
100 200 m/z
300 400
(a) CI(NH3) mass spectrum of Do-atropine
100 293
>, 4-' ...... V)
s:: OJ 50 4-' s:: ......
127 .-OJ IX
100 200 300 400 m/z
(b) CI(NH3) mass spectrum of D3-atropine

106
4.10 Analysis of Plant Material
A total ion current chromatogram of the aqueous plant
extract to which no D3-atropine had been added was recorded
with the mass spectrometer operating under EI conditions.
Two peaks were seen which were identified from mass
spectrum as atropine and scopolamine. The major component
in the extract was atropine, as expected. The scopolamine
concentration was estimated to be twenty to twenty-five
times lower than the atropine concentration, based on
measurement of peak heights. Quantitative analysis for
atropine in both the aqueous and soxhlet extracts was
performed using GCMS with the mass spectrometer operating
under CI with ammonia reagent gas. Quantitation was based
on measuring the MH+ ion intensities of DO- and D3-atropine.
A calibration graph was constructed using standard solutions
that contained DO- and D3-atropine in the ratios 0.25, 0.5,
1.0, and 2.0 DO:D3 with DO + D3 = lOng ~L-l~ The
preparation of these standard mixtures is discussed in the
experimental section. A weighted linear least squares
procedure was used to find the regression line for the
calibration graph, in a similar manner to that which has
been described for morphine and benztropine in earlier
sections of s thesis. The measured ion intensity ratios
for the calibration standards and associated statistical
analysis, and the resulting calibration graph are presented
in Table 22 and Figure 22 respectively. The measured ion
intensity ratios for the aqueous and soxhlet plant extracts,
and the associated calculations to determine the atropine
concentrations in these extracts are presented in Table 23.

TABLE 22. CALIBRATION DATA AND REGRESSION ANALYSIS STATISTICS
Concn. of
injection
(DO + D3)
10 ng j.1L-l
II
II
II
Correlation coefficient (r)
0.9999
DO/D3 ratio
0.25
0.50
1. 00
2.00
Gradient
1. 0199
% of explained variation
99.8
n x s
3 0.257 0.01527
" 0.523 0.06028
It 1.034 0.04163
" 2.023 0.08145
Parameters for Theoretical value least squares of r at 99.9%
line
y = 0.0034 + 1.0199x 0.8233
f-J o -.J
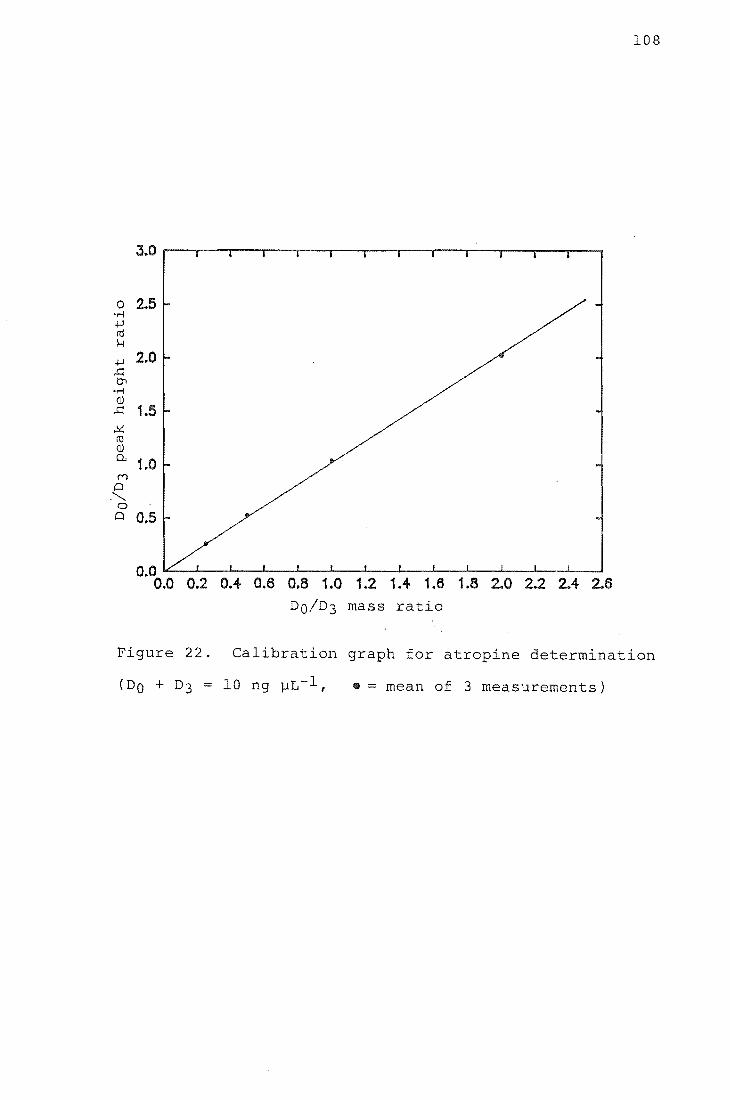
108
0 2.5 .~
..w m H
..w 2.0 ..c: tr> .~
(lJ ..c: 1.5 ..!<: m (lJ P.. 1.0 (V')
Q .'-..
0 Q 0.5
0.0 6 0.0 0.2 0.4 0.6 0.8 1.0 1.2 1.4 1.6 1.8 2.0 2.2 2.4 2.
DO/D3 mass ratio
Figure 22. Calibration graph for atropine determination
• = mean of 3 measurements)

TABLE 23. RESULTS FOR ATROPINE CONCENTRATIONS IN PLANT EXTRACTS
AQUEOUS EXTRACT
Sample No.
1
2
3
SOXHLET EXTRACT
1
2
3
D3-atropine concn. ng ].lL-l extract
5.0
"
II
5.0
"
II
Peak height ratio
0.59
0.62
0.61
0.66
0.63
0.65
Measured atropine concn. ng ].lL-l extract
2.88
3.02
2.97
mean (±SD) = 2.96 (± o.on
3.22
3.07
3.17
mean (±SD) = 3.15 (± 0.08)
I-' 0 !,.Q
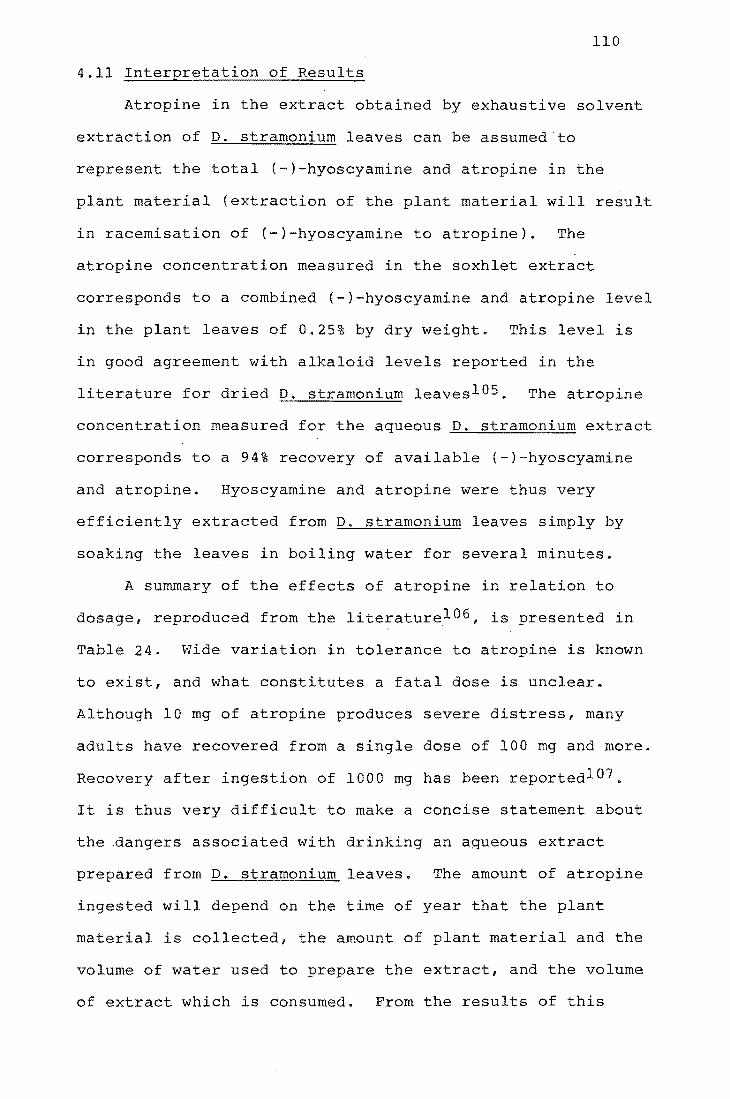
110
4.11 Interpretation of Results
Atropine in the extract obtained by exhaustive solvent
extraction of D. stramonium leaves can be assumed to
sent the total {-)-hyoscyamine and atropine in the
plant material {extraction of the plant material will result
in racemisation of (-)-hyoscyamine to atropine). The
atropine concentration measured in the soxhlet extract
corresponds to a combined (-)-hyoscyamine and atropine level
in the plant leaves of 0.25% by dry weight. This level is
in good agreement with alkaloid levels reported in the
literature for dried D. stramonium leaves l05 . The atropine
concentration measured for the aqueous D. stramonium extract
corresponds to a 94% recovery of available (-)-hyoscyamine
and atropine. Hyoscyamine and atropine were thus very
efficiently extracted from D. stramonium leaves simply by
soaking the leaves in boiling water for several minutes.
A summary of the s of atropine in relation to
dosage, reproduced from the literaturel06 , is presented in
Table 24. Wide variation in tolerance to atropine is known
to st, and what constitutes a fatal dose is unclear.
Although 10 mg of atropine produces severe distress, many
adults have recovered from a single dose of 100 mg and more.
Recovery after ingestion of 1000 mg has been reportedl07 .
It is thus very difficult to make a concise statement about
the .dangers associated with drinking an aqueous extract
prepared from D. stramonium leaves. The amount of atropine
ingested will depend on the time of year that the plant
material is collected, the amount of plant material and the
volume of water used to prepare the extract, and the volume
of extract which is consumed. From the results of this

Table 24.
DOSE
0.5 mg
1.0 mg
2.0 mg
5.0 mg
10.0 mg and more
EFFECTS OF ATROPINE IN RELATION TO DOSAGE (Reproduced from Ref. 106)
EFFECTS
Slight cardiac slowing: some dryness of mouth: inhibition of sweating
Definite dryness of mouth; thirst; acceleration of heart, sometimes preceded by slowing; mild dilation of pupil
Rapid heart rate; palpitation; marked dryness of mouth; dilated pupils; some blurring of near vision
All the above symptoms marked; speech disturbed; difficulty in swallowing; restlessness and fatigue; headache;
III
dry, hot skin; difficulty in micturition; reduced intestinal peristalsis
Above symptoms more marked; pulse rapid and weak; iris practically obliterated; vision very blurred; skin flushed, hot, dry, and scarlet; ataxia, restlessness and excitement; hallucinations and delirium; coma
112
study it could reasonably be expected that several
medium-sized glassfuls of an aqueous extract prepared from
D. stramonium leaves in the manner described in this thesis
would contain sufficient atropine to constitute a dangerous
drug dose.
4.12 Ius ion
An aqueous extract of D. stramonium leaves will contain
most of the atropine present in the plant material.
Drinking such an extract is likely to be highly dangerous.

CHAPTER 5
INTRODUCTION
113
5.1 Mass Spectrometry of Involatile and Thermally Labile
Compounds
A major limitation in the application of the more
common mass spectrometric techniques of electron impact
(EI), field ionisation (FI) and chemical ionisation (CI) to
the identification and structural determination of thermally
unstable or involatile compounds is that the sample must be
vaporised before ionisationl08 ,109. Such compounds often
decompose or fail to vaporise in the mass spectrometer ion
source, and the resulting spectra give very little useful
information. Chemical derivatisation of polar functional
groups, which reduces intermolecular hydrogen bonding, has
been widely used to increase the volatility and thermal
stability of "difficult" samples llO . Unfortunately
derivatisation adds an extra step to sample analysis, and
also gives an increase in molecular weight which is
proportional to the number of polar groups present.
In recent years a number of techniques have been
developed which allow many non-derivatised thermally
unstable and involatile compounds to be investigated almost
routinely by mass spectrometrylll-115. These techniques
have used a wide variety of methods to ionise sample
molecules, ranging from simple heating of a metal substrate
in the presence or absence of a strong electric field to
impact with very high energy particles. Three of these
techniques which are now commercially available are
described below.

114
(a) Field desorption (FD)lll
b A very strong electrostatic field (1-4 ViA) is used to
ionise sample molecules absorbed on a specially prepared
surface, and a combination of this field and thermal energy
desorbs the ionised sample molecules. This technique was
introduced by Beckey in 1969 and is probably still the most
widely used method for the analysis of non-volatile samples.
(b) Plasma desorptionl12
Simultaneous ionisation and desorption of sample
molecules is achieved by impact of high energy (100 MeV)
fission products from 252Cf onto the back side of metal foil
coated with a molecular layer of the sample. This technique
often gives molecular weight information when FD does not.
(c) Fast Atom Bombardment (FAB)115
A beam of rare gas atoms bombards the sample suspended
in a relatively involatile liquid carising desorption of
ions. This technique is perhaps the most important recent
development in mass spectrometry and it can provide
molecular weight information for very high molecular weight
compounds in addition to those which are involatile and
thermally fragile.
5.2 Desorption Electron Ionisation and Desorption Chemical
Ionisation
Another approach to obtaining useful mass spectral
information for involatile and thermally unstable compounds
has been to minimise the distance within the mass
spectrometer source between the site of sample

115
volatilisation and the site of ionisation. This strategy
has led to the development of the so called "in-beam"
techniques of desorption electron ionisation
(DEI)116-124 and desorption chemical ionisation
(DCI)125,126 mass spectrometry. In DEI and DCI the sample
to be analysed is deposited on a surface and introduced
directly inside the mass spectrometer ion source by means of
an extended direct insertion probe. This replaces the usual
practice of vaporising the sample outside of the source,
which generally results in pyrolysis of thermally labile
compounds. The sample or the ion source is then heated
(after the reagent gas has been introduced for DCI). Under
these conditions many involatile and thermally unstable
compounds give mass spectra which exhibit abundant
protonated molecular ion and fragment ion peaks which would
not be observed using a conventional solids probe. For DCI
spectra the extent of sample fragmentation is generally
greater than that observed under FD MS so the spectra give
more structural information about the samp
The main advantage of DEI and DCI MS is its simplicity.
Any mass spectrometer can be equipped with a direct exposure
probe without major modification, and at relatively low
cost. By comparison, FD, plasma desorption and FAB methods
are expensive and are usually only available on larger
magnetic sector instruments.
Two approaches have been taken in an effort to enhance
the volatility of thermally labile molecules deposited on
the tip of an extended probe - the use of inert surface$ and
rapid probe heating. Dispersal of molecu onto a
relatively inert surface reduces the binding energy of the

116
sample to the surface and makes the desorption process more
competitive with decomposition. Materials used as
vaporisation surfaces have included glass 125 ,127,
quartz l17 ,128-l30, Teflonl19 ,131,132, VespeI133 ,134, bare
and polyimide coated wires124 ,135-l38, and polyimide-coated
fused silica capillary tUbing139 . The rapid heating
technique is based on a kinetic analysis of the competitive
decomposition and evaporation processes. It has been
shownl19 ,120 that rapid heating of the probe tip favours the
desorption of intact neutral molecules over decomposition.
For this reason heating rates of lOoC per second (termed
"flash desorption") have been used. A consequence of rapid
sample heating is that desorption occurs very quickly so
scanning of the mass spectrum must be very rapid. Computer
data acquisition is usually necessary (alternatively,
simultaneous detection of all ions formed using a
photographic plate is possible with a mass spectrometer of
Mattauch-Herzog geometry124).
The mechanism of the ionisation process occurring at
the tip of the extended probe during DEI and DCI is still
uncertain. Rapid heating of the sample on an inert sur ce
presupposes the process to involve desorption of neutral
sample molecules from the surface followed by their
gas-phase ionisation by the electron beam (in DEI) or by the
reagent gas plasma (DCI)134. Direct ionisation of the
sample on the probe surface followed by desorption of ions
(i.e. a heterogeneous reaction), has also been suggested as
a mechanism132 , and experimental support for both hypotheses
has been presented. A review of the evidencel40 has
concluded that in most reported DEI and DCI experiments the

117
process has been one of short path thermal volatilisation
followed by gas phase ionisation.
Spectra from DEI and DCI experiments showing molecular
ions usually appear immediately after insertion of the
extended probe, and the spectra invariably exhibit
protonated molecular ions (MH+). Later spectra under DEI
begin to look like conventional EI spectra. The formation
of MH+ ions during DEI has been attributed to the rapid rise
in the ion source pressure as molecules are desorbed from
the probe surface, temporarily causing chemical ionisation
conditions. Most experiments have been conducted
essentially without regard to quantitative sample
measurements, and most spectra have been obtained from
sample sizes of 100 ng to a few micrograms. It appears that
the sensitivity of DCI is comparable to that of ordinary CI.
To date, most DEI- and DCI-MS studies have been
concerned with developing the in-beam technique, and
demonstrating its ability to provide molecular weight and
structural information for involatile and thermally unstable
compounds. Some classes of compound for which in-beam
spectra have been reported are listed in Table 25. The
following examples, taken from this list, illustrate the
potential of DEI- and DCI-MS.
Amino acids:
Most amino acids show molecular ion peaks in their EI,
CI and FI mass spectral09 ,145-148. Creatine and arginine
are exceptions, probably because both compounds undergo
thermal dehydration to form the corresponding cyclic
lactones at temperatures below that required for
118
volatilisation146 ,148. The DCI mass spectra obtained with
methane126 , isopentane132 and isobutane133 as reagent gas
show prominent MH+ ion peaks for both the parent compounds
and the dehydration products.
Carbohydrates:
The ability to analyse carbohydrates by mass
spectrometry is severely limited by the thermal instability
and extremely low volatility of these compounds124 • DEI
mass spectra which show prominent MH+ ions for sucrose and
lactose have been reported124 .
Polypeptides:
The low volatility of these compounds, and the small
number of fragment ion peaks in their FD spectra149 , limit
the utility of EI-, CI- and FD-MS for determining the
sequence of amino acids present. Derivatisation can be used
to increase the volatility but this can consume considerable
amounts of sample150 • DCI-MS spectra for a number of tri-,
tetra-, and pentapeptides have been recorded which exhibit
MH+ ion peaks and fragmentation sufficient to derive a
unique amino acid sequence120 ,125,126.
5.3 This Work
The laboratory in which the work described in this
thesis was undertaken operates an A.E.I. MS902 high
resolution magnetic sector mass spectrometer and a Hewlett
Packard 5982A GCMS. The MS902 is an EI-only instrument, and
the HP5982 prov~des EI and CI. Both instruments are used
for research projects in toxicology, pharmacology and

119
environmental analysis and to provide routine mass spectral
information for a number of research groups in other fields,
both within and external to the University. Neither
instrument has been able to provide satisfactory mass
spectra for the increasing number of unstable or high
molecular weight compounds being submitted, particularly
those from the large marine chemistry group. This section
of the thesis describes modifications made to the Hewlett
Packard instrument to allow it to be used in DEI or DCI mode
with a commercially available DCI probe. The effectiveness
of these modifications is discussed.

120
Table 25 Classes of compound previously studied by DEl
and/or DCI-MS.
1. Glucuronides 141,142,138,139
2. Carbohydrates 124,138,139
3. Steroids 143,142,138
4. Prostaglandins 142,138,139
5. Nucleotides 126
6. Amino acids 126,132,133
7. Nucleic acids 137
8. Antibiotics 144
9. polypeptides 125,120,126,139
10. Salts of organic acids 126
11. Nucleos s 126,142
12. Pesticides 126
13. Glycosides 135,142,138

121
RESULTS AND DISCUSSION
5.4 Probe Installation
5.4.1 General Considerations
In providing the HP5982A with DEI and DCI capability
two minimum goals were set:
1. Existing parts of the instrument which required
modification but which could not readily be replaced should
be refabricated to incorporate the necessary changes. In
this way the instrument could always be restored to its
original state.
2. The existing EI and CI sensitivities of the
instrument should not be significantly degraded at the
expense of obtaining DEI and DCI capability.
5.4.2 DCI Probe
The DCI probe was supplied by Vacumetrics (Vacumetrics,
Ventura, Ca.) and is a modification of that described by
Bruins135 • A scale drawing of the probe is presented in
Figure 37. All major parts of the probe are constructed
from stainless steel. The filament is a loop of platinum
wire mounted on two pins held in position by a ceramic
spacer. The filament assembly (1) is mounted on the inner
shaft (2) which can be slid along its axis within the outer
shaft (3) by moving the probe handle (4). This movement
permits the filament tip to be extended inside the ion
chamber after the probe has been inserted through the solids
probe insertion lock of the mass spectrometer. The maximum

122
possible extension of the inner shaft, and thus of the
filament assembly, can be fixed by tightening a grub screw
(accessible through a slot in the probe body) in a steel
ring (not shown) around the inner shaft. The gap between
the inner and outer shaft is sealed by the main vacuum seal
assembly (5) which maintains the ion source vacuum during
probe operation. The gas line (6) can be used to introduce
the CI reagent gas into the ion chamber. The reagent gas
exits through a hole in the ceramic feed-through (7)
sweeping the filament tip. For the work described in this
thesis the reagent gas was introduced into the ion chamber
via the GC column inlet (Section 1.3) so the reagent gas
inlet line of the probe was blocked off using a standard
Swagelok connector and a short length of metal rod. The BNC
connector (8) is used to deliver an electric current to the
filament which is earthed to one side of the probe body_
The probe is operated as folloWs:
A drop of sample solution is applied to the tip of the
filament using a microlitre syringe and the solvent is
allowed to evaporate. The filament assembly is then
retracted inside the outer shaft by moving the probe handle
downwards. The probe handle is locked in the retracted
position by slightly rotating the handle into a cut-out (not
shown) in the probe body - this prevents the probe extending
prematurely when exposed to the ion source vacuum. The
probe is then inserted through the mass spectrometer's
solids probe insertion lock into the ion source and the
filament is moved into the ion chamber by releasing the
probe handle and sliding the handle forward.

123
5.4.3 Solid Probe Insertion Lock
The HP5982A solid probe insertion lock has an internal
diameter of only 6.35 rom which is too narrow to admit the
12.7 rom diameter outer shaft of the Vacumetrics DCI probe.
This lock was replaced with a Con Vac solid probe insertion
lock (Consolidated Instruments Corp., Baltimore Md). The
rough-out 'port of the Con Vac lock will accept different
internal diameter probe entrance adaptors which are screwed
into position and sealed by an a-ring. A 6.35 rom adaptor
was fitted to this port to admit the HP5982A direct
insertion probe to the ion source and this was replaced when
appropriate with a 12.7 rom adaptor to admit the DCI probe.
The distance from the ion source housing to the entry port
of the new lock was identical with that for the existing
lock - one section of the lock was rebuilt to achieve this.
The conventional solids probe was therefore correctly
positioned in the ion source with the 6.35 rom entrance
adaptor. The length of the DCI,probe required the 12.7 rom
adaptor to be shortened from its original 76.2 rom to 46.5 rom
to position the probe's outer shaft when inserted up to the
hilt correctly near the ion source DIP s (part 9 Figure
34).
5.4.4 Ion Source Modifications
The HP5982A dual ion source has been described in
Section 1.2. The following modifications to the ion source
were made to allow the tip of the DCI probe filament to
enter the CI ion chamber.
124
1. The hole in the gold-plated heater shroud (part 1,
Figure 33) through which the existing solids probe passes
before entering the DIP sleeve (part 9, Figure 34) was
enlarged from 15 mm to 18 mm diameter to accommodate the
outer shaft of the DCI probe. The shroud was replated after
enlarging the hole. It was considered undesirable to modify
the existing shroud but a replacement could not be purchased
or constructed. In addition to the source heater the shroud
also contains two magnets which collimate the electron beam
in the ion chamber. The instrument manufacturer was
consulted before enlarging the shroud hole to determine
whether this modification would distort the magnetic field
produced by the magnets.
2. A problem inherent in the 5982A source design is the
difficulty of ensuring that the probe entrance in the source
block is in line with the DIP housing; this alignment
changes as the copper a-ring flange seal is compressed. The
original DIP sleeve was designed to guide the 6.35 mm probe
into place even if the alignment was not perfect, and to
seal the source ion chamber under CI conditions. The
alignment problem proved to be more critical with the
12.7 mm DCI probe, because the throat of the original sleeve
was too narrow to accept the end of the probe and provide
the necessary alignment. The new DIP sleeve, constructed of
19 mm AF hexagonal stainless steel, had a wider bore which
guided the 12.7 mm probe into position.
3. The ~xisting plunger body (referred to as the plunger)
had a 1.3 mm diameter DIP inlet hole which was too narrow to

125
admit the DCI probe filament tip. A new plunger body was
constructed with external dimensions identical to those of
the existing plunger and with a DIP inlet hole of 3.81 mm
diameter. The new plunger was machined from stainless steel
round bar. The fabrication of the mask for the electron
entrance slit in the existing plunger could not be
duplicated. The mask containing this slit for the new
plunger was formed by cutting a rectangular aperture in a
disc of stainless steel shim with a punch made for the
purpose and fitting this disc into a stepped circle having a
hole at its centre in the plunger wall. The disc was held
in position with a circlip.
4. The DIP sample inlet hole in the spacer (part 15, Figure
35) was enlarged from 1.3 mm to 3.81 rom diameter to
accommodate the DCI probe filament. A new spacer was not
fabricated because the existing spacer could be readily
replaced if necessary.
5.4.5 Initial Probe Set-up
The length of probe extension was adjusted initially
with the ion source removed, to position the tip of the
lament in the centre of the CI ion chamber. The DCI probe
was inserted through the solids probe insertion lock up to
the hilt and the filament was extended. A sight was taken
down the interior of the ion source housing towards the
quadrupole mass analyser and the length of probe extension
was adjusted to position the tip of the filament in the
centre of the ion optics axis. This position corresponds to
the centre of the CI ion chamber. The grub screw in the
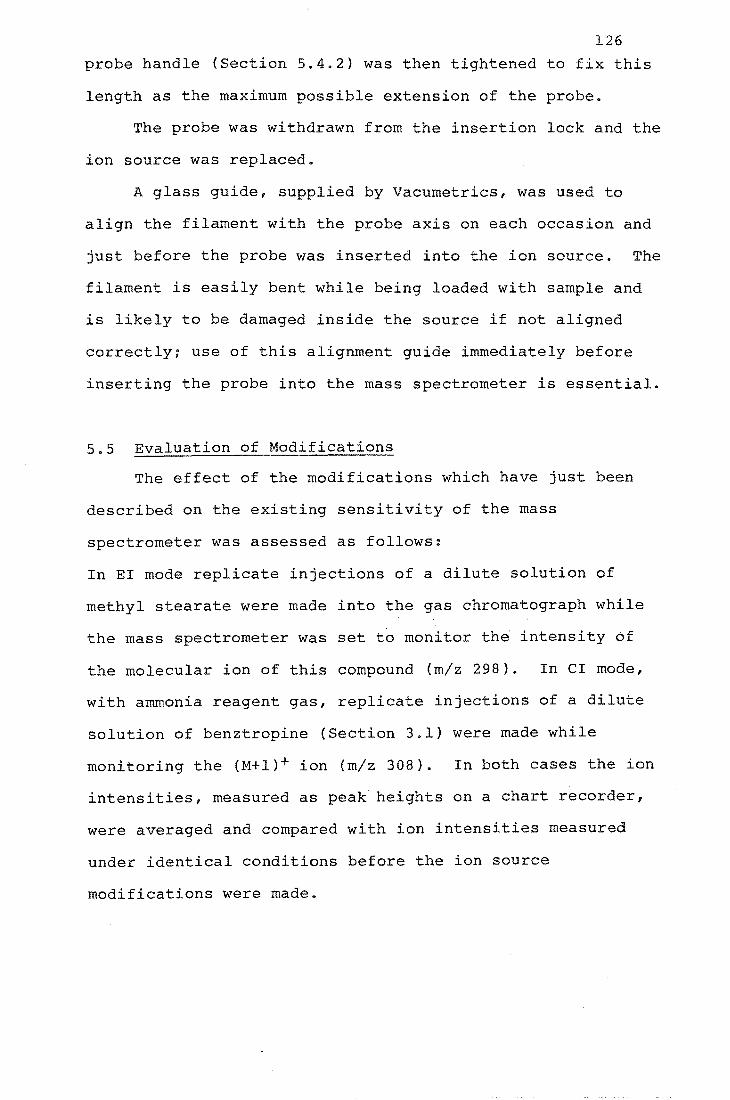
126
probe handle (Section 5.4.2) was then tightened to fix this
length as the maximum possible extension of the probe.
The probe was withdrawn from the insertion lock and the
ion source was replaced.
A glass guide, supplied by Vacumetrics, was used to
align the filament with the probe axis on each occasion and
just before the probe was inserted into the ion source. The
filament is easily bent while being loaded with sample and
is likely to be damaged inside the source if not aligned
correctly; use of this alignment guide immediately before
inserting the probe into the mass spectrometer is essential.
5.5 Evaluation of Modifications
The effect of the modifications which have just been
described on the existing sensitivity of the mass
spectrometer was assessed as follows:
In EI mode replicate injections of a dilute solution of
methyl stearate were made into the gas chromatograph while
the mass spectrometer was set to monitor the intensity of
the molecular ion of this compound (m/z 298). In CI mode,
with ammonia reagent gas, replicate injections of a dilute
solution of benztropine (Section 3.1) were made while
monitoring the (M+l)+ ion (m/z 308). In both cases the ion
intensities, measured as peak heights on a chart recorder,
were averaged and compared with ion intensit measured
under identical conditions before the ion source
modifications were made.

127
The results showed that the instrument modifications
caused no significant change in sensitivity in either EI or
CI mode.
The first sample to be examined using the DCI probe was
the amino acid creatine. This compound has previously been
selected for use in optimising experimental parameters
during DCI experiments132 . A 1 ~L aliquot of a freshly
prepared aqueous solution of creatine (SOD ng ~L-l) was
applied to the probe filament by the method described
earlier. The probe was inserted into the mass spectrometer
operating under CI conditions with methane reagent gas. The
probe tip was extended to the centre of the ion source and
then rapidly heated by passing a current 2.9A through the
filament. Spectra were recorded repetitively at the maximum
scan rate of 325 amu/second immediately after probe
insertion. The "bestll spectrum of creatine obtained is
presented in Figure 23. It shows a protonated molecular ion
peak (M+l)+ (m/z 132), and a base peak corresponding to the
protonated cyclic lactone creatinine (m/z 114).
100 114
132
100 200 m/z
Figure 23. DCI mass spectrum of creatine

128
5.6 In-Beam Operating Parameters
The appearance of an in-beam mass spectrum is very
dependent on experimental conditions. Spectra recorded
using non-metallic probes, where the temperature of the
source block determines the heating rate of the probe tip,
have a protonated molecular ion intensity which is very
sensitive to changes in both the source temperature and the
position of the probe tip relative to the electron beam
axis. Higher source temperatures have been reported to give
a better relative abundance of this ion132 ,139. The optimal
position for the probe tip has been found to be on139 , and
2.5 mm froml17 ,132 the electron beam axis. Spectra obtained
using metallic (directly heated) probes have been recorded
with the source temperature at normal135 and at lower-than
normal138 ,15l temperatures. The probe tip has been
positioned directly in the electron beam124 in DEI
experiments, and at various distances from
it120 ,135,15l,143, including at. the boundary of the
ionisation chamber138 , in DCI experiments. In the latter
case centering of the probe tip in the source was found to
cause increased sample decomposition.
In this work DEI and DCI mass spectra were recorded at
an ion source temperature of ca. 190°C. This temperature
(the normal source operating temperature) allowed the
instrument to be used without delay to also record spectra
for samples admitted to the ion source via the conventional
solids probe inlet or the GC inlet.
The effect of the probe insertion distance during DCI
and DEI operation was investigated as follows:

129
Spectra of creatine were recorded with the probe tip 0, 2.5,
5, 7.5, 10 and 15 mm from the electron beam axis while the
mass spectrometer was operating under CI conditions with
methane reagent gas. The relative intensity of the
protonated molecular ion was determined at each distance by
measuring the ratio (M+H)+/(M-OH)+. The results, presented
in Figure 24, show that the abundance of the (M+l)+ ion is
strongly dependent upon the position of the probe tip in the
ion source. The maximum value for the ratio of
(M+H)+/(M-OH)+ was obtained when the probe tip was 2.5 mm
from the electron beam axis. Spectra of creatine were also
recorded with the probe tip 0, 2.5, 5, 7.5, 10 and 15 mm
from the electron beam while the mass spectrometer was
operating under EI conditions. An (M+l)+ ion was only
observed when the probe tip was retracted 2.5 mm.
~
~
0 0 ~ M ~
.-. + Z ~ M I m ~
" + 15 M + ~ 10
5
00 2 4 I I 10 12 14 18
Distance (mm)
Figure 24. Variation of creatine (M+l)+/(M-17)+ ratio
with distance from the ion beam axis to DCI probe tip.
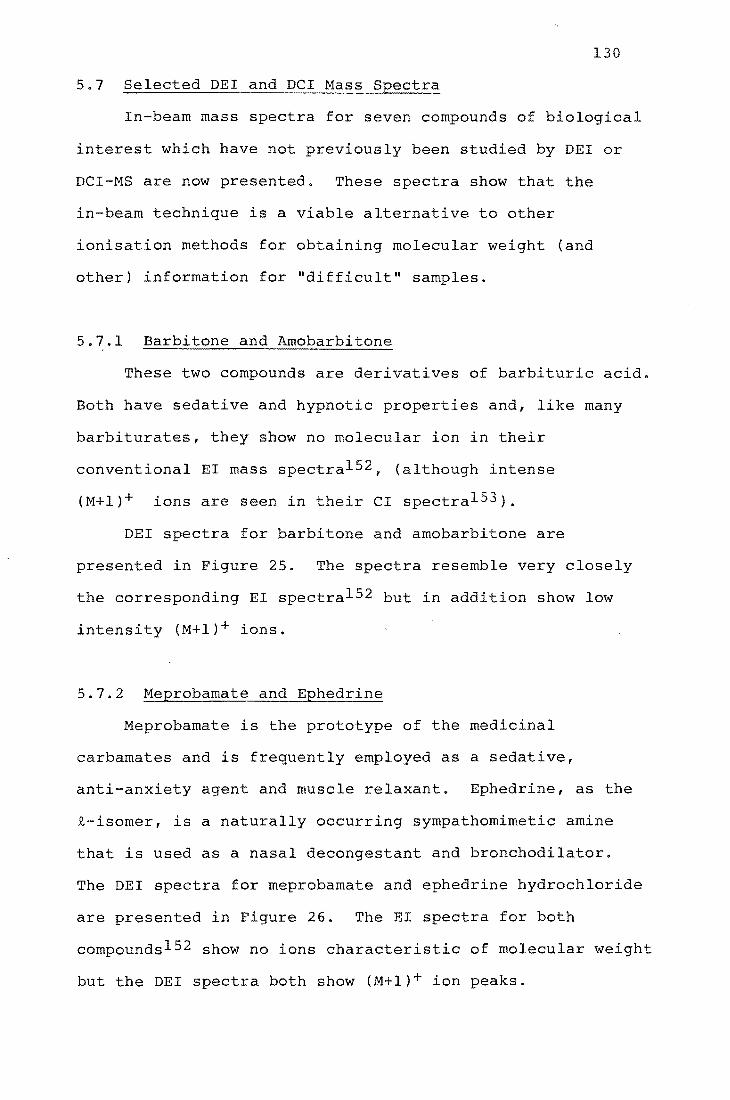
130
5.7 Selected DEI and DCI Mass Spectra
In-beam mass spectra for seven compounds of biological
interest which have not previously been studied by DEI or
DCI-MS are now presented. These spectra show that the
in-beam technique is a viable alternative to other
ionisation methods for obtaining molecular weight (and
other) information for "difficult" samples.
5.7.1 Barbitone and Amobarbitone
These two compounds are derivatives of barbituric acid.
Both have sedative and hypnotic properties and, like many
barbiturates, they show no molecular ion in their
conventional EI mass spectra152 , (although intense
(M+l)+ ions are seen in their CI spectra153 ).
DEI spectra for barbitone and amobarbitone are
presented in Figure 25. The spectra resemble very closely
the corresponding EI spectra152 but in addition show low
intensity (M+l)+ ions.
5.7.2 Meprobamate and Ephedrine
Meprobamate is the prototype of the medicinal
carbamates and is frequently employed as a sedative,
anti-anxiety agent and muscle relaxant. Ephedrine, as the
£-isomer, is a naturally occurring sympathomimetic amine
that is used as a nasal decongestant and bronchodilator.
The DEI spectra for meprobamate and ephedrine hydrochloride
are presented in Figure 26. The EI spectra for both
compounds152 show no ions characteristic of molecular weight
but the DEI spectra both show (M+l)+ ion peaks.

131
Figure 25. DEI mass spectra of barbitone and amobarbitone.
..... en c
100
11 50 c .....
>, .j..> ..... en C OJ
.j..> c .... . .... &
100
50
156
1 1
xlO
185
100 m/z 200
(a) DEI mass spectrum of barbitone
156
141
r XlO
197 211 55 98 112
m/z
(b) DEI mass spectrum of amobarbitone

132
Figure 26. DEI mass spectra of meprobamate and ephedrine
hydrochloride.
83 100 -
- 55
-->,
- 71 ....,
'" c
- r X10
- 75 96
114 144
(lJ 50 ...., c ......
.-(lJ
0::: -219
II LJ ~,I ib I IJ II I I , I 100
m/z 200
(a) DEI mass spectrum of meprobamate
58 100
r X10
166
100 m/z
200
(b) DEI mass spectrum of ephedrine hydrochloride
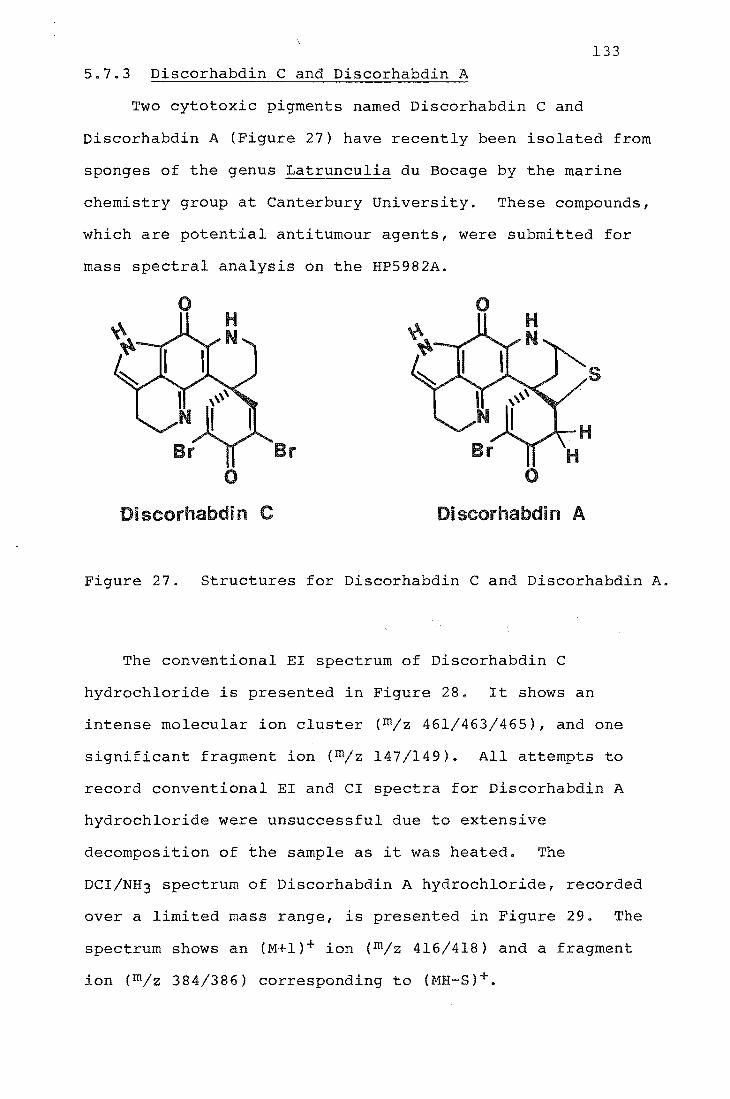
133
5.7.3 Discorhabdin C and Discorhabdin A
Two cytotoxic pigments named Discorhabdin C and
Discorhabdin A (Figure 27) have recently been isolated from
sponges of the genus Latrunculia du Bocage by the marine
chemistry group at Canterbury University. These compounds,
which are potential antitumour agents, were submitted for
mass spectral analysis on the HP5982A.
o o
s
r o
Di scorhabdi n Di scorhabdi n A
Figure 27. Structures for Discorhabdin C and Discorhabdin A.
The conventional EI spectrum of Discorhabdin C
hydrochloride is presented in Figure 28. It shows an
intense molecular ion cluster (m/z 461/463/465), and one
significant fragment ion (m/z 147/149). All attempts to
record conventional EI and CI spectra for Discorhabdin A
hydrochloride were unsuccessful due to extensive
decomposition of the sample as it was heated. The
DCI/NH3 spectrum of Discorhabdin A hydrochloride, recorded
over a limited mass range, is presented in Figure 29. The
spectrum shows an (M+I)+ ion (m/z 416/418) and a fragment
ion (m/z 384/386) corresponding to (MH-S)+.

100 ~
---
>, +> .... ~
VI I::: (J) 50. +> I::: ...... -.....
&! ---
149
147
m/z
46 465
Figure 28. EI mass spectrum of Discorhabdin C
hydrochloride
416 418
384
386
382
, 400
m/z
Figure 29. Partial DCI(NH3) mass spectrum of
Discorhabdin A hydrochloride
134
a

135
The utility of the in-beam technique in providing molecular
weight information further illustrated by FAB-MS results
for Discorhabdin A hydrochloride. The FAB spectrum of this
compound, recorded in a glycerol matrix, is presented in
Figure 30. It shows peaks (m/z 418/420) resulting from
in-situ reduction of the sample154 , making
a priori interpretation of the spectrum difficult.
T~J'10;;:::S SCAlI: 25 DISCORHABDlt-l A, HCL FAB ("LY 21/5/85 BH~E PEAI<: 369 WT. : I: 0 il: PEAKS: -439 T. I.: 10557
461 418
311
i~"lJ~~ llwwdtt~I~lul~'I'ull_~~~~~~~~.~~~f-350 40(1 450
Figure 30. FAB (argon) mass spectrum of Discorhabdin A
hydrochloride in glycerol. (Courtesy of Dr P.T. Holland,
Ruakura Plant Research Station, Hamilton N.Z.)
5.7.4 Morphine-3-g1ucuronide
This compound has been discussed in Section 2.4.1 •
The ammonia CI mass spectrum of the underivatised conjugate,
presented in Figure 31, shows no ion characteristic of
molecular weight. The two major peaks seen {m/z 286,303}
correspond to the protonated aglycon (Agly + l)+ and
(Agly + NH4)+ respectively. The DCI/NH3 spectrum of
morphine-3-g1ucuronide, presented in Figure 32, shows the
(M+l)+ ion (m/z 462).
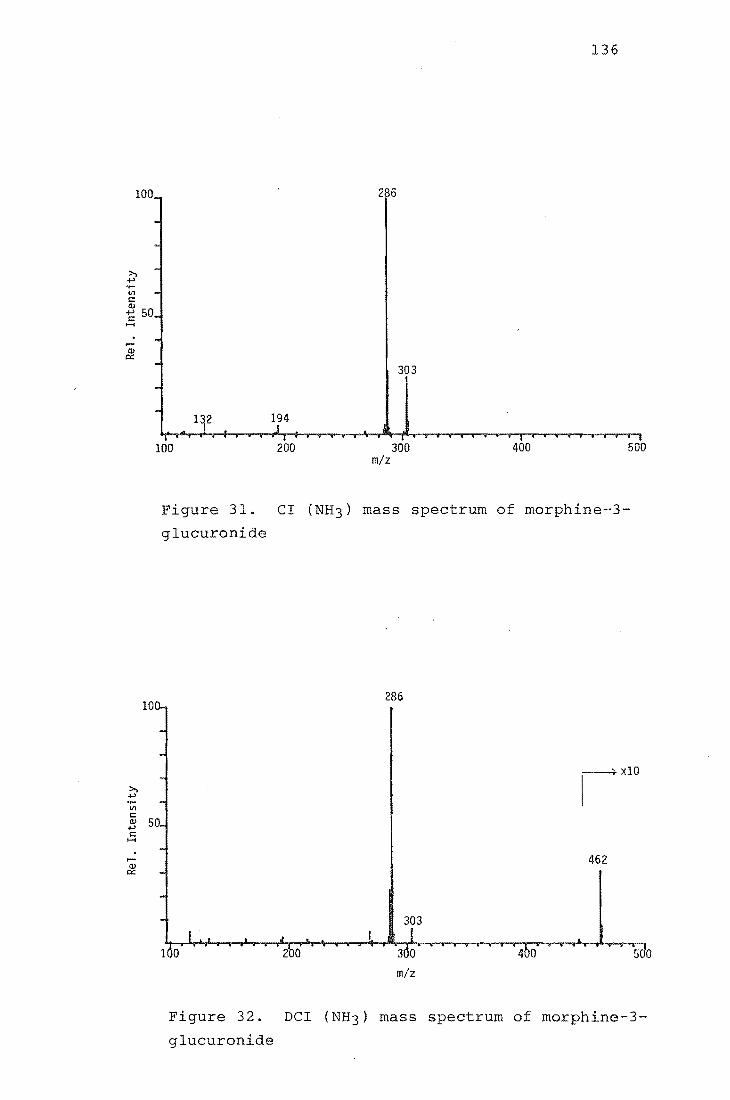
100 200
286
303
300 m/z
136
400 500
Figure 31. CI (NH3) mass spectrum of morphine-3-
glucuronide
286
xlO
462
303
2 0 4 0 500
m/z
Figure 32. DCI (NH3) mass spectrum of morphine-3-
glucuronide
137
5.8 ion
A Hewlett Packard 5982A GCMS has been successfully
modified to allow it to be used to record in-beam mass
spectra with a commercially available DCI probe.

6.1 General
CHAPTER 6
EXPERIMENTAL METHODS
138
Infrared spectra were recorded on a Shimadzu IR-27G
spectrophotometer for liquid films and nujol mulls.
lH n.m.r. spectra were obtained in deuterochloroform solvent
with tetramethylsilane as an internal reference on a Varian
T60 spectrometer. All chemical shifts are expressed as
parts per million (ppm) downf ld from TMS and are quoted as
position (0), multiplicity (s = singlet, d doublet,
t triplet, q = quartet, m
integral.
multiplet) and relative
Microanalyses were carried out by Professor A.D.
Campbell and associates, University of Otago.
Melting points were determined in open capillaries and
are uncorrected.
Weighings for standard solutions were performed on a
Cahn model G electrobalance.
Yields reported for preparative procedures are those
for the final purified product obtained after
recrystallisation.
6.1.1 Reagents
Lithium aluminium deuteride (Merck) had an isotopic
purity better than 98%. N,O-bis(trimethylsilyl)-acetamide
and N,O-bis(trimethylsilyl)trifluoroacetamide (both Pierce
Chemical Co., Rockford, Ill.) were analytical reagents. All
solvents used for extractions were of analytical grade (AR)
and were distilled twice in glass before being stored in

139
acid-washed glass jars with glass stoppers. All solvents
used for preparative procedures were analytical grade or
were purified (and dried when necessary) according to
standard procedures155 ,156. "Ether" refers to diethylether.
All drugs were supplied by the Chemistry Division of the
Department of Scientific and Industrial Research (D.S.I.R.)
or by the Department of Nephrology or the Department of
Anaesthetics, Christchurch Hospital.
6.1.2 Biological Material
Post-mortem blood and post-mortem liver were supplied
by the Chemistry Division of D.S.I.R. Out-dated plasma was
supplied by the Blood Bank, Christchurch Hospital. All
biofluid and tissue samples were stored frozen until needed.
6.1.3 Glassware
All glassware was initially cleaned by soaking in a
chromic acid bath (70 mL saturated sodium dichromate
solution and 2 L of concentrated sulphuric acid157 ) for
several hours and subsequently rinsed thoroughly several
times with hot water before being drained and oven dried.
All glassware used for drug extraction procedures, including
Reacti-vials, was silanised by soaking overnight in a
solution of dimethyldichlorosilane in toluene (1:20)
followed by a methanol wash. After use glassware used for
extraction procedures was soaked in boiling "Decon 90"
(Decon Laboratories Ltd., Hove, England) for about 5 h,
thoroughly rinsed with distilled water and oven dried before
being resilanised.

140
6.1.4 Instrumentation
The HP5982A GCMS used for this work has been described
in Sections 1.2 and 1.3. The gas chromatograph was fitted
with a 30 m x 0.32 mm i.d. fused silica BP-l capillary
column (SGE Pty. Vict. Australia). Helium was used as the
carrier gas and the flow rate through the column was 3 mL
min-I. The temperature of the transfer oven was 250oC. The
mass spectrometer ion source was operated in EI mode with an
ionising energy of 50 eVe In CI mode the reagent gas
pressure was optimised for the particular reagent gas used.
The ion source temperature was ca. 190oC. Morphine analyses
were performed using an OCI-3 on-column injector (SGE Pty.).
Injections (1 ~L) were made at an oven temperature of l20 o C;
after elution of the volatiles the oven temperature was
increased rapidly to 280oC, giving a retention time for
bis(trimethylsilyl)morphine of about 8 min. At the
completion of each run the oven temperature was held at
3000 C for 5 min. Benztropine and atropine analyses were
both performed using a split/splitless injector (Chromalytic
Technology Vict. 3150 Australia) operated in the split mode
with a split ratio of 10:1. Injections (1 ~L) were made at
an oven temperature of 230oC, giving a retention time for
benztropine of about 2 min. and for atropine of 3 min.
6.1.5 Mass Spectra
Mass spectra were recorded using a Datagraph 5-154
Recording Oscillograph (Bell and Howell, Pasadena, Ca.)
connected to the GCMS. Ion intensities were determined by
measuring peak heights with a ruler from the recorder paper.
Mass spectra were normalised before being plotted.

6.2 Experimental Section Relating to Chapter 2
6.2.1 Preparative procedures
Morphine and N-tri~~uteriomethylnormorphine
The crude compounds 34 were purified by repeated
recrystallisation from methanol:water followed by
sUblimation under vacuum.
Methyl(tetra-O-acetyl-S-D-glucopyranuronate)
141
Glucuronolactone (8.8 g) was treated with sodium
methoxide and then acetic anhydride using the acid-catalysed
acetylation procedure of Bollenback et a1 36 to give a white
solid which was recrystallised from ethanol. Yield: 5.08 9
(27%); m.p. 176-1770 (lit. 36 176.5-1780 ).
M.s (CI/DIP ammonia), m/z: 394(M+NH4+, 100%), 317 (53),
257(41).
Methyl(tri-O-acetyl-a-D-glucopyranosyl bromide)-uronate
Methyl (tetra-O-acetyl-S-D-glucopyranuronate) (2.5 g) was
treated with 30% hydrobromic acid in acetic acid (10 mL)
using the method of Bollenback et a1 36 to give a white solid
which was recrystallised from ethanol. Yield: 1.65 9 (62%);
m.p. 105-1060 (lit. 36 106-1070 ).
M.s (CI/DIP ammonia), m/z: 416/414 (M+NH4+, 71/100%),
317(28), 257(31).
Morphine-(3S-D-glucopyranosyl)-uronate
Morphine (0.10 g) was condensed with methyl
(tri-O-acetyl-a-D-glucopyranosyl bromide}-uronate (O.lO g)
using the method of Berrang et a1 35 . The crude product was

142
recrystallised twice from methanol. Yield: 40.2 mg (23%);
m.p. 240-24l0 C(dec.) (lit. 35 240-242 0 (dec)i lH n.m.r. :
Satisfactory spectra could not be obtained; I.R. (KBr):
vmax = 3610, 1633, 1503 and 14.56 em-I; M.s.(EI/DIP, as
penta-trimethylsilyl derivative), m/z: 821 (partial spectrum
only).
6.2.2 Preparation of Calibration Standards
Methanol stock solutions of DO- and D3-morphine were
prepared in silanised volumetric flasks according to the
scheme in Table 26. From these stock solutions standard
mixtures of the following ratios were made up to 50 mL in
silanised volumetric flasks using methanol solvent: 4:1
DO:D3 (800 ~L and 200 ~L), 2:1 (666 ~L and 333 ~L), 1:1
(500 ~L and 500 ~L, 1:2 (333 ~L and 666 ~L) and 1:4
(200 ~L and 800 ~L), using a 200-1000 ~L adjustable
micropipette.
The required standard mixtures (100 ~L) were added to
drug free plasma (1 mL), thoroughly mixed and left to stand
for lh before extraction and derivatisation using the method
for unchanged morphine (Section 6.2.4).
Solution concn. Mass of morphine Final volume
(ng ~L-l) (mg) (mL)
10 0.5000 50
30 1.500 50
100 5.000 50
200 5.000 25
Table 26. Scheme for preparing morphine standard solutions

143
6.2.3 Determination of Solvent Extraction Efficiency
An appropriate amount of DO-morphine was added to
aliquots (1 mL) of drug-free plasma. The spiked samples
were thoroughly mixed, left to stand for 1 h and then
extracted according to the procedure for unchanged morphine
(Section 6.2.4) but with the following change: D3-morphine
was added to the dry residue just prior to derivatisation.
6.2.4 Extraction of Morphine from Serum and Plasma
(a) Unchanged Morphine
An appropriate amount of D3-morphine was added to serum
(or plasma) (1 mL) in a 10 mL silanised-glass centrifuge
tube having a ground glass stopper, thoroughly mixed and
left to stand for 1 h. The serum (or plasma) was mixed with
acetone (6 mL), centrifuged for 5 min, the organic layer
transferred to a clean 10 mL centrifuge tube and the acetone
evaporated at 70-80oC under nitrogen. The dry residue was
taken up in 0.01 M hydrochloric acid (1 mL) and washed with
benzene (2 x 4 mL). The aqueous phase was adjusted to pH
8-9 by addition of 1 M sodium hydroxide, buffered to pH 8.9
with borate buffer (1 mL) and extracted twice with isopropyl
alcohol-dichloroethane (3:10 v/v) on a vortex mixer. The
combined organic phase was reduced in volume, transferred to
a 1 mL Reacti-vial (Pierce Chemical Co., Rockford, Ill.) and
evaporated to dryness at 70-80oC under nitrogen. The
residue was reacted with bis(trimethylsilyl) acetamide or
bis(trimethylsllyl)trifluoroacetamide (50 ~L) in a sealed
vial for 1 h at 60oC, and the resulting mixture used
directly for GCMS analysis.
144
(b) Total Morphine
An appropriate amount of D3-morphine was added to serum
(or plasma) (I mL) in a 10 mL silanised glass centrifuge
tube having a ground glass stopper, thoroughly mi and
left to stand for 1 h. The serum (or plasma) was bu red
at pH 5.0 with ca. 0.2 M acetate buffer (I mL), 2000 shman
Units of S-glucuronidase (Sigma G-0750) added and the
solution incubated in a water bath at 370C for 24h. The
procedure for unchanged morphine was then followed.
6.3 Experimental Section Relating to Chapter 3
6.3.1 Preparative procedures
Bromodiphenylmethane
Benzhydrol (16.80 g) was treated with phosphorus
tribromide (2 mL) using the method of Claisan76 to give a
wh solid which was purified by vacuum distillation (0.5
rom,1200C). Yield: 16.0 g (80%); m.p. 42-43 0C
76 43-450C).
Benztropine hydrobromide
Tropine (5.27 g) was reacted with bromodiphenylmethane
(la g) using the method of Weijlard75 . Benztropine was
isolated as its hydrobromide and recrystallised from
ethanol. Yield: 4.80 g (33%); m.p. 258.5-260o C
75 250-2510C).
Benztropine base
Benztropine hydrobromide (4.60 g) was dissolved in
water (20 mL), the solution was basified with sodium

145
carbonate and then extracted with chloroform (4 x 50 mL).
The combined chloroform extracts were dried over magnesium
sulphate, filtered (Whatman phase separating paper) and the
solvent removed under vacuum to give a pale yellow viscous
oil. Yield: 3.41 g (94%)i IH n.m.r. (CDC13) 1.75-2.15, m,
8H, ring CH2i 2.22, s, 3H, CH3i 2.90-3.40, m, 2H, CHNCH;
3.40-3.70, m, IH, HCO; 5.38, s, IH, OCH; 7.25, m, 10H,
aromatic Hi M.s. (CI/DIP ammonia), M/z: 308 (M+H+, 100%),
167 (38),140 (14),124 (11), 110 (40).
N-(2,2,2-trichloroethoxycarbonyl)-norbenztropine
To a mixture of benztropine base (3.23 g) and potassium
carbonate (0.05 g) in refluxing benzene (25 mL) was added
2,2,2-trichloroethylchloroformate (1.6 mL) dropwise over 0.5
h. Reflux was then continued for a further 2.5 h. The
solution was allowed to cool, washed twice with sodium
hydroxide (1M), once with water and dried over magnesium
sulfate. After filtering, the solvent was removed under
vacuum to leave a white solid which on trituration with
pentane:dichloromethane gave white crystals. Yield: 1.44 g
(29%)i m.p. 121-122oCi (Found: C, 59.0; H, 5.2; N, 2.8; Cl,
22.7. C23H24N03C13 requires C, 59.1; H, 5.1; N, 2.9; Cl,
22.5%); IH n.m.r. (CDC13) 1.70-2.40, m, 8H, ring CH2;
3.55-3.90, m, IH, HCO; 4.15-4.60, broad signal, 2H, CHNCHi
4.60-4.95, m, 2H, COOCH2i 5.45, s, IH, OCHi 7.28, m, 10H,
aromatic Hi M.s.(CI/DIP ammonia), m/z: 470/468, (M+H+,
18/16%), 308(34),293(26),182(11),167(100).

146
N-Trideuteriomethylnorbenztropine hydrobromide
A solution of N-(2,2,2-trichloroethoxycarbonyl)-
norben (0.25 g) in dry tetrahydrofuran (10 mL) was
added dropwise to a stirred slurry of lithium aluminium
deuteride (0.225 g) and tetrahydrofuran (40 mL) and the
reaction mixture was refluxed for 74 h. After cooling the
reaction was quenched by the cautious addition several
drops of sodium sulphate solution and filtered.
Removal of solvent under vacuum gave a pa
syrup which was ssolved in ether (10 mL) and
40% hydrobromic acid (0.1 mL). The mixture was
vigorously and allowed to stand for 1 h at room
yellow viscous
with
The resulting white precipitate was removed by filtration
and recrystallised from water. Yield: 0.085 g (41%); m.p.
259-260 o C.
N-Trideuteriomethylnorbenztropine base
N-Trideuteriomethylnorbenztropine hydrobromide
(0.060 g) was dissolved in water (5 mL), the solution was
basified with sodium carbonate and then extracted with
chloroform (4 x 5 mL). The combined chloroform extracts
were dried over magnesium sulphate, filtered (Whatman phase
separating paper) and the solvent removed under vacuum to
give a pale yellow viscous oil. Yield: 0.042 (88%), IH
n.m.r. (CDC13) 1.75-2.28, m, 8H, ring CH2i 2.90-3.40, m,
2H, CHNCHi 3.40-3.70, m, IH, HCOi 5.37, s, IH, OCH; 7.26, m,
10H, aromatic Hi M.s. {CI/DIP ammonia), m/z: 311 (M+H+,
~OO%), 167(34).
147
6.3.2 Preparation of Calibration Standards
Methanol stock solutions of DO- and D3-benztropine were
prepared by weighing 2.500 mg of DO- or D3-benztropine into
a silanised volumetric flask (50 mL) and making up to the
mark with methanol. From these stock solutions standard
mi~tures of the following ratios were made up to 50 mL in
silanised volumetric flasks using methanol solvent: 4:1
DO:D3 (800 ~L and 200 ~L), 2:1 (666 ~L and 333 ~L), 1:1
(500 ~L and 500 ~L, 1:2 (333 ~L and 666 ~L) and 1:4
(200 ~L and 800 ~L), using a 200-1000 ~L adjustable
micropipette.
The required standard mixtures (100 ~L) were added to
drug free blood (1 mL), thoroughly mixed and left to stand
for lh before extraction using the method for benztropine.
6.3.3 Determination of Solvent Extraction Efficiency
(a) Blood
An appropriate amount of DO-benztropine was added to
aliquots (1 mL) of drug-free blood. The spiked samples were
thoroughly mixed, left to stand for 1 h and then extracted
according to the procedure for benztropine in blood.
(Section 6.3.4) but with the following change:
D3-benztropine was added just prior to evaporation of the
organic solvent.
(b) Liver
An appropriate amount of DO-benztropine was added to
samples of homogenised liver. The spiked samples were then
extracted according to the procedure for benztropine in

148
liver (Section 6.3.5) but with the following change:
D3-benztropine was added just prior to evaporation of the
organic solvent.
6.3.4 Extraction of Benztropine from Post-mortem Blood
An appropriate amount of D3-benztropine hyrobromide was
added to post-mortem blood (1 mL) in a 10 mL silanised glass
centrifuge tube having a ground glass stopper, thoroughly
mixed and left to stand for 1 h. The blood was made
alkaline (pH 11-12) with 0.5 M sodium hydroxide (360 ~L) and
extracted twice with l-chlorobutane (2 x 5 mL) on a vortex
mixer for 2 min. The combined organic phase was reduced in
volume to 2 mL and extracted into 0.05 M suphuric acid
(1 mL) in the same manner as before. The upper organic
phase was discarded and the aqueous phase washed with 1 mL
of extraction solvent before re-alkini on with 0.5 M
sodium hydroxide (220 ~L). The extraction was then repeated
as before with 5 mL of extraction solvent. The solvent was
evaporated to dryness at 40-50o C under nitrogen and the
residue reconstituted in ethanol (50 ~). The centrifuge
tube was stoppered and the lower portion of the tube heated
to 40-50oC in a hot block for several minutes to reflux the
ethanol and wash down the inside of the tube. The sample
was cooled and used directly for GCMS analysis.
6.3.5 Extraction of Benztropine from Post-mortem Liver
Liver (10 g) was blended with Tris base (40 mL) and
crystalline subtilisin (0.2 g) in a Waring electric blender.
The resulting suspension was transferred to a 100 mL conical
flask, covered with a watch glass and heated with stirring

149
at 50-60o C for 1 h. An aliquot (1 mL) of the cooled liver
digest was then extracted with l-chlorobutane using the
procedure for post-mortem blood.
6.4 Experimental Section Relating to Chapter 4
6.4.1 Preparative Procedures
N-Ethoxycarbonylnortropine
Tropine (2.50 g) was treated with ethylchloroformate
(20 mL) using the method of Fung and DeGraw9S . The crude
product was recrystallised from ether to give a white solid.
Yield: 1.SO g (51%): m.p. 72-75 0 C (lit. 96 74-7S; I.R.
(nujol): v max 3420 (OH), 16S0 cm- l (C=O); lH n.m.r. (CDC13)
1.35 1.75, m, 3H, CH3; 1.75-2.45, m, SH, ring CH2i
4.0-4.90, m, 5H, COOCH2, CHNCH, HCO; M.s. (CI/DIP ammonia),
m/z: 200 (M + H+,lOO%).
N-Trideuteriomethylnortropine.
N-Ethoxycarbonylnortropine (1.76 g) was reduced with
lithium aluminium deuteride using the method of Fung and
DeGraw 9S to give a pale yellow viscous oil. Yield: 0.73 g
(57%); I.R. (nujol): vmax = 3320, (OH), 2200, 2070
cm- l (C-D); lH n.m.r. (CDC13): 1.40-2.35, m, SH, ring CB2;
2.90-3.40, broad signal, 2H, CHNCH; 3.90-4.lS, m, IH, BCD;
M.s. (CI/DIP ammonia), m/z: 145 (M+B+, 100%).
Tropic acid.
Phenylacetic acid (19.75 g) was reacted with magnesium
and isopropylchloride to form the corresponding Grignard
derivative, which was then treated with formaldehyde and

150
hydrolysed to tropic acid, all by the method of Blicke99 .
The crude product was recrystallised from benzene. Yield:
12.58g (52%); m.p. 114-115 0 (lit. 99 116-117);
IH n.m.r. (D6DMSO/CDC13): 3.40-4.20, m, 3H, CH, CH2i 7.30,
s, 5H, aromatic.
Acetyltropyl chloride
Tropic acid (3.0 g) was treated with acetyl chloride
and then thionyl chloride using the method of Toomey and
RiegellOO . The acetyltropyl chloride was used immediately.
Yield: 2.90 g (66%);
IH n.m.r. (D6DMSO/CDC13i 1.95, s, CH3; 3.60-4.95, 3H,
CH,CH2; 7.32, s, 5H, aromatic.
N-Trideuteriomethylnoratropine.
N-Trideuteriomethylnortropine (0.70 g) was reacted with
acetyltropyl chloride (1.40 g) using the method of Fung and
DeGraw98 to give a white solid which was recrystallised from
acetone. Yield: 0.75 g (53%); m.p. 106-108oC
(lit. 98 105-108); I.R. (Nujol): vmax = 3500, 3320 (OR),
2200, 2070, 2050 cm- l ; lR n.m.r. (CDC13): 1.50-2.30, m, 8R,
ring CH2i 2.60-3.20, broad signal, 3R, OH, CHNCR; 4.90-5.10,
m, IH, RCO; 7.30, s, 5H, aromatic H.
6.4.2 Preparation of Calibration Standards
Stock solutions of DO- and D3-atropine were prepared by
weighing 0.500 mg of DO or D3-atropine into a silanised
volumetric flask (10 mL) and making up to the mark with
methanol. From these stock solutions std mixtures of the
following ratios were made up to 5 mL in silanised

151
volumetric flasks using methanol solvent: 4:1 DO:D3 (800 ~L
and 200 ~L), 2:1 (666 ~L and 333 ~L), 1:1 (500 ~L and
500 ~L, 1:2 (333 ~L and 666 ~L) and 1:4 (200 ~L and
800 ~L), using a 200-1000 ~L adjustable micropipette.
The std mixtures were used directly as calibration
standards.
6.4.3 Preparation of Aqueous Plant Extract
The preparation of the aqueous plant extract is
described in Section 4.6.
6.4.4 Extraction of Aqueous Plant Extract
An appropriate amount of D3-atropine was added to the
aqueous plant extract (1 mL) in a 10 mL silanised glass
centrifuge tube having a ground glass stopper and the tube
shaken. The extract was made basic (9-10) with aqueous
ammonia solution and extracted twice with chloroform. The
combined organic phase was evaporated to dryness at 70-80o C
under nitrogen and the residue reconstituted in ethanol (100
~L). The centrifuge tube was stoppered and the lower
portion of the tube heated to 40-50 oC in a hot block for
several minutes to reflux the ethanol and wash down the
inside of the tube. The sample was cooled and used directly
for GCMS analysis.
6.4.5 Soxhlet Extraction of Plant Material
Dried plant material (2.50 g) was extracted in a
soxhlet apparatus with a mixture of 0.880 ammonia (60 mL),
ethanol (120 mL) and ether (960 mL) for 24 h. The extract
was allowed to cool, and then was filtered into a 2 L

152
volumetric flask and made up to the mark with additional
ether. An aliquot (1 mL) of the extract was placed in a 10
mL silanised glass tube having a ground glass stopper, an
appropriate amount of D3-atropine added, and the tube
shaken. The organic phase was extracted into 0.05 M
sulphuric acid (1 mL) and the organic phase discarded. The
aqueous phase was made basic (pH 9-10) with aqueous ammonia
solution and extracted twice with chloroform. The combined
organic phase was evaporated to dryness at 70-80 0 under
nitrogen and the residue reconstituted in ethanol (100 ~L).
The centrifuge was stoppered and the lower portion of the
tube heated to 40-50 0 C in a hot block for several minutes to
reflux the ethanol and wash down the inside of the tube.
The sample was cooled and used directly for GCMS analysis.

153
ACKNOWLEDGEMENTS
I am particularly grateful to Dr G.J. Wright for his
encouragement and help in this study.
The technical assistance of Dr L.K. Pannell (formerly
of Chemistry Division, Department of Scientific and
Industr 1 Research, Christchurch) and Mr R.K. Panckhurst
(Technical Staff, Chemistry Department) is very much
appreciated.
I would like to thank Drs D.F. Woolner and E.J. Begg
(Christchurch Clinical School of Medicine) and Dr K.L. Lynn
(Department of Nephrology, Christchurch Hospital) for their
assistance with the morphine study.
The award of a Teaching Fellowship (1982-1984) by
the University of Canterbury is gratefully acknowledged.
Finally, I would like to express my sincere thanks
to my parents and to my wi Karen for their patience,
help, and understanding during the course of this work.

154
19
Figure 33 lon source Exploded view of .

Figure 34. Exploded view of the ion source
Figure 35. Exploded view of
the plunger assembly
155

156
ELECTRON IMPACT CONFIGURATION
ELECTRON COLLECTOR
CHEMICAL IONIZATION CONFIGURATION
SAMPLE INLET
I
ENTRANCE LENS
-+- MASS FILTER
t ION REPELLER
PUMP
Figure 36. Ion source configurations

"0" Ring
M}FmUl .. ...., "'""--- Cajon Nut
~.
(5)
Connector
(8)
Figure 37.
Cerlll1lic Feedthrougn
(7)
Reagent Gas Line
(6)
157
_Filament Assembly (1)
(2)
Outer Shaft (3)
rdl---""' __ liilt
Probe Body
Cross section scale drawing
of the DCI probe

158
REFERENCES
1. Jaffe, J.H. and Martin,W.R.,In "The Pharmacological
Basis Of Therapeutics", 6th. ed.j Goodman, L.S.
and Gilman, A.,
pp.495-5l3
.; Macmillan: New York (1975).
2. Yeh, S.y., Gorodetzky, C.W. and Krebs, H.A.
J. Pharm. Sci., (1977), .§£, ~, 1288.
3. Mostert, J.R., Evers, J.L., Hobika, G.H. et ala
Br. J. Anaesth. (1971) il, 1053.
4. Don, F.H., Dieppa, R.A. and Taylor, P. Anaesthesiology
(1975) 11., 745.
5. Hanks, G.W. and Twycross R.G. Lancet (1984) i, 1477.
6. McQuay, H. and Moore, A. Lancet (1984) ii, 284.
7. Barnes, J.N., Williams, A.J., Toseland, P.A. and
Goodwin, F.J. Lancet (1984) ii, 748.
8. Michie, C., Chapman, J.R., Sear, J. and Moore, R.A.
Lancet (1985) i, 586.
9. Jaffe, J.H. and Martin, W.R. In ref. 1, p. 505.
10. Olsen, G.D., Bennett, W.M. and Porter, G.A.
Clin. Pharmacol. Ther. (1975) 17, 677.

159
11. Olsen, G.D. Clina Pharmacol. Ther. (1975) 17, 31.
12. Aitkenhead, A.R., Vater, M., Achola, K., Cooper, C.M.S.
and Smith, G. Br. J. Anae . (1984) ~, 813.
13. Way, E.L. and Alder, T.K. Pharmacol. Rev. (1960) 12,
383.
14. Sasajima, M. Keio Igaku (1970) 47, 421.
15. Berkowitz~ B.A. Clin. Pharmacokinetics. (1976) !, 219.
16. Moore, A., Sear, J., Baldwin, D., Allen, M.,
Hunniset, A., Bullingham, R. and McQuay, H.
Pharmacol. Ther. (1984) 12, 641.
17. Moore, R.A., Baldwin, D., Allen, M.C., Watson, P.J.Q.,
Bullingham, R.E.S. and McQuay, H.J.
Ann. Clin. Biochem. (1984) 21, 318.
18. Ball, M., Moore, R.A., Fischer, A., McQuay, H.J., Allen,
M.C. and Sear, J. Lancet (1985) i, 784.
19. Morgan, T. In "Nephrology"~ Hamburger, J., Crosnier, J.
and Grunfeld, J.P., Eds.; Wiley-Flammarion: New York
(1979) p. 64.
20. Shelly, M. and Park, G.R. Lancet (1985) i, 1100.

160
21. Laidlaw, J., Read, A.E. and Sherlock, S.
Gastroenterology (1961) iQ, 389.
22. Patwardhan, R.V., Johnson, R.F., Hoyumpa, A. et ala
Gastroenterology (1981) ~, 1006.
23. Neal, E.A., Meffin, P.J., Gregory, P.B. and Blaschke,
T.F. (1979) 77, 96.
24. Mojaverian, P., Fedder, I.L., Vlasses, P.H. et ala
Br. J. Clin. Pharmacol. (1982) 14, 809.
25. Brunk, S.F., Delle, M. and Wilson, WaR.
Clin. Pharmacol. Ther. (1975) 16, 1039.
26. Schali, C. and Roch-Ramel, F.
J. Pharmacol. EXp. Ther. (1982) 223, 811.
27. Hanks, G.W. and Aherne, G.W. Lancet (1985) i, 221.
28. Joel, S.P., Osborne, R.J., Nixon, N.S. and Slevin, M.L.
Lancet (1985) i, 1099.
29. Svensson, J.O., Rane, A., Sawe, J. and Sjoqvist, F.
J. Chromatogr. (1982) 230, 427.
30. "Martindale The Extra Pharmacopoeia"; 27th ed.: Wade, A.
Ed.; The Pharmaceutical Press: London (1977)
pp. 976-977.

161
31. Loan, W.B., Dundee, J.W. and Clarke, R.S.J.
Br J. Anaes • (1966) ~, 891.
32. Keeri-Szanto, M. Canad. Anaesth. Soc. J. (1976) ~, 239.
33. Lynn, K.L. and Woolner, D. Private communications
(1985).
34. Lee, H.K., Gnad, P.A., Trebilco, R.R., Wright, G.J. and
Pannell, L.K. Biomed. Mass Spectrom. (1980) 1, 418.
36. Bollenback, G.N., Long, J.W., Benjamin, D.G. and
Lindquist, J.A. J. Amer. Chern. Soc. (1955) 77, 3310.
37. Ebbighausen, W.O.R., Mowat, J.H., Stearns, H. and
Vestergaard, P. Biomed. Mass Spectrom. (1974) !, 305.
38. Yeh, S.Y. J. Pharmacol. Exp. Ther. (1975) 192, 201.
39. "Sample Preparation & Separation Science " (1985) Catalog
from Analytichem International, Inc.; 24201 Frampton
Avo, Harbor City, CA 90710 USA.
40. "'Baker'-lO SPE Applications Guide Vol.II" (1984) J.T.
Baker Chemical Co., 222 Red School Lane, Phillipsburg,
NJ 08865 USA.
41. Millard, B.J. "Quantitat Mass Spectrometry";
Heydon & Son: London (1978) pp. 149-151.

162
42. Garland, W.A. and Powell M.L. J. Chromat. Sci. (1981)
19, 392.
43. Hunt, D.F. Finnigan Spectra (1976) 6.
44. In ref. 41, Chapter 6, pp. 155-158.
45. Page, S.W. and Poppiti, J.A. Anal. Chern. (1981) 53, 574.
46. Schoeller, D.A. Biomed. Mass Spectrom. (1976) 3, 265.
47. Ikram, H., Lynn, K.L., Bailey, R.R. and Ie, P.J.
Kidney Int. (1983) ~, 371.
48. Metzler, C.M., Elfring, G.L. and McEwen, A.J.,
A package of computer programs for pharmacokinetic
modelling. Biometrics, (1974), 572.
49. Gibaldi, M. and Perrier, D. Pharmacokinet s,
2nd Ed., Marcel Dekker Inc., New York, (1982).
50. Stanski, D.R., Greenblatt, D.J. and Lowenstein, E.
Clin. Pharmacol. Ther., (1978), ~, 52-9.
51. Brunk, S.F. and Delle, M. Clin. Pharmacol. Ther.,
(1974), ~, 51-7.
52. Gambertoglio, J.G., In "Pharmacokinetic Basis for
Drug Treatment", (1984), Ed. L.Z. et al.,
Publ. Raven Press, p. 157.

163
53. Reuning, R.H., Sams, R.A. and Notari, R.E. J. Clin.,
Pharmacol., (1973), ll, 127-41.
54. McQuay, H.J., Moore, R.A., Bullingham, R.E.S. et ale
Roy. Soc. Med. Int. Congr. Symp. Ser., (1984),
&...i, 149.
55. Sawe, J., Dahlstrom, B., Paalzow, L. and Rane, A.
Clin. Pharmacol. Ther., (1981) lQ, 629.
56. Krauss, J.W., Desmond, P.V., Marshall, J.P. et ale
Clin. Pharmacol. Ther., (1978), ~, 411.
57. Shull, H.J., Wilkinson, G.R., Johnson, R. and
Schenker, S. Ann. Intern. Med., (1976), ~,
420.
58. Desmond, P.V., James, R., Schenker, S., Gerkens, J.F.
and Branch, R.A. Biochem. Pharmacol., (1981),
lQ, 993.
59. James, R., Desmond, P., Kupfer, A., Schenker, S. and
Branch, R.A. J. Pharmacol. EXp. Ther., (1981),
217, 127.
60. Shimomura, K., Kamato, 0., Ueki, S., Ida, S., Oguri, K.,
Yoshimura, H. and Tsukamoto, H. Tohoku J. Exp. Med.,
(1971), 105, 45.
164
61. Yoshimura, H., Natsuki, R., Ida, S. and Oguri, K.
Chern. Pharm. Bull., (1976), 24(S), 901.
62. Bianchine, J.R. In ref. 1, p484.
63. Bowman, W.C. and Rand, M.J. In IITextbook of
Pharmacology", 2nd ed.i Blackwell Scientific:Me1bourne
(1980) pp. 18.18-18.19.
64. The New Ethica1s Catalogue, Issue No. 1,1986,
Vol. 23, No.1 (1986) p. 78; Adis Press.
65. Goldstein, M.R. and Kasper, R.
Southern Medical Journal (1968) 61, 984.
66. West, R.R. and Newgreen, D.B.
Comprehensive Psychiatry (1978) 19, 557.
67. Jindal, S.P., Lutz, T., Hallstrom, C. and Vestergaard,
P. Cline Chima Acta (1981) 112, 267.
68. Caddy, B., Fish, F. and Tranter, J. Analyst (1975)
100, 563.
69. Hartvig, P. and Hand1, W.
(1975) 12, 349.
Pharm. Suec.
70. Caddy, B., Fish, F. and Tranter, J. Analyst
(1974) ~, 555.

165
71. Hartvig, P., Sundin, H. and Vessman, J. Acta Pharm.
Suec. (1972) 9, 269.
72. Curry, S.H. and Brown, E.A. IRCS Med. Sci. (1981)
9, 166.
73. Curry, S.H., Brown, E.A. and Perrin, J.H.
IRCS Med. Sci. (1981) ~, 168.
74. Curry, S.H. and Brown, E.A. IRCS Med. Sci.
(1981) ~, 170.
75. Weij1ard, J., u.S. Patent 2,706,198 (1955).
76. C1aisen, L. Justus Liebigs Ann. Chem. (1925) 442, 210.
77. Abde1-Monem, M.M. and Portoghese, P.S. J. Med. Chem.
(1972) 15, 208.
78. Garriott, J.C., Sturner, W.Q. and Mason, M.F. C1in.
Toxico1. (1973), .§., 163.
79. Garriott, J.C. In "Methodology for Analytical
Toxicology", Ed. I. Sunshine, CRC Press, Cleveland,
(1975), p. 121.
80. Garriott, J.C. and Latman, N. J. Forensic Sci.,
(1976), ~, 398.

166
81. DiMaio, V.J.M. and Garriott, J.C. J. Forensic Sci.,
(1977), ll, 152.
82. Pierce, W.O., Lamoreaux, T.C., Urry, F.M., Kopjak, L.
and Finkle, E.S. J. Anal. Toxicol., (1978) ~,
26.
83. Foerester, E.H., Hatchett, D. and Garriott, J.C.
Ana 1 . ., ( 19 78) ~ , 5 0 .
84. Dubost, P. and Pascal, S. AnnIs Pharm. Fr.,
(1953), 11, 615.
85. Osselton, M.D., Hammond, M.D. and Twitchett, P.J.
J Pharm. ., ( 1977 ), ~ , 46 0 .
86. Valov, P. Ind. Engng. Chem. Analyst. Edn.,
(1946), 18, 456.
87. Dickson, S.J., Cleary, W.T., Missen, A.W.,
Queree, E.A. and Shaw, -S.M. J. Anal. Toxicol.,
(1980), i, 74.
88. MacInnes, A., Private Communication, (l985).
89. Connor, H.E. "The Poisonous Plants in New Zealand",
E.C. Keating, Government Printer: Wellington (1977).
90. Claus, E.P., Tyler, V.E. and Lynn, R.B. In
"Pharmacognosy", 6th ed.; Lea and Febiger: Philadelphia
(1970) pp. 238-9.

167
91. Arena J.M. Cline Pediatr. (1963) ~, 182-4.
92. Blattner, R.J. J. Pediatr. (1962) 61 941-3.
93. Jennings, R. J. Pediatr. (1935) ~, 657-64.
94. Rosen, C.S. and Lechner, M.
267, 448-50.
~-=~-=~-===. (1962)
95. Schumacher, M. Med. J. Aust., (1965) 1, 547-8.
96. "Drunk on Datura", Christchurch Star, 30 April (1984).
97. "The Merck Index", Merck & Co., Inc., Ninth Edition,
(1976) p. 897.
98. Fung, V.A. & DeGraw, J.I. Synthesis, (1976), 311.
99. Blicke, F.F., U.S. Patent 2,716,650 (1955).
100. Toomey, R.F. and Riegel, E.R.
1492.
101. MacDonald, C., "Garden Herbs For Australia and
New Zealand", A.H. & A.W. Reed, (1969) p 88.
102. Mechler, E. and Kohlenback, H.W. Plant Medica, (1978)
li, 350.

, J
168
103. Solomon, M.J., Crane, B.L., Wu Chu, B.L. and Mika, E.S.
J. Pharm. Sci., (1969) ~, 264.
104. Heller, S.R. and Milne, G.W.A. "EPA/NIH Mass Spectral
Data Base"; Natl. Bur. Stand., u.S. Govt. Print.
Off., Washington, D.C., (1980).
105. Szepczynska, K., Dissert. Pharm. Pharmacal., (1970)
22, 333.
106. Weiner, N., In ref 1, p 127.
107. Alexander, E. (Jr)., Morris, D.P. and Eslick, R.L.
N. Eng. J. Med., (1946), 234, 258-9.
108. Milne, G.W.A. and Lacey, M.J. In "Modern Ionisation
Techniques in Mass Spectrometry",
Crit. Rev. Anal. Chern. (1974) 45.
109. Fales, H.M., Milne, G.W.A., Winkler, H.U., Beckey, H.D.,
Damico, J.N. and Barron, R. Anal. Chern. (1975) 47,
207.
110. Blau, K. and King, G. "Handbook of Derivatives for
Chromatography." Heyden (1979).
Ill. Beckey, H.D. Int. J. Mass. Spectrom. Ion Phys. (1969)
~, 500.

169
112. MacFarlane, R.D. and Tagerson, D.F. Science (1976) 191,
920.
113. Day, R.J., Unger, S.E. and Cooks, R.G., Anal. Chern.,
(1980), 2l, 557A.
114. Mumma, R.O. and Vastola, F.J. Org. Mass Spectrom. (1972)
.§.' 1373.
115. Barber, M., Bordoli, R.S., Elliot, G.J., Sedgwick, R.D.
and Tyler, A.N. Anal. Chern. (1982) 2±, 645A.
116. Dell, A., Williams, D.H., Morris, H.R., Smith, G.A.,
Feeney, J. and Roberts, G.C.K. J. Amer. Chern. Soc.
(1975) 22, 2497.
117. Ohashi, M., Tsujimoto, K. and Yasuda, A. Chern. Lett.
(Japan) (1976) 439.
118. Reed, R.I. and Reid, W.K. J. Chern. Soc. (1963) 5933.
119. Beuhler, R.J., Flanigan, E.O., Greene, L.J. and
Friedman, L. Biochem. Biophys. Res. Commun.
(1972) ~, 1082.
120. Beuhler, R.J., Flanigan, E., Greene, L.J. and Friedman,
L. J. Amer. Chern. Soc. (1974) ~, 3990.
121. Beuhler, R.J., Flanigan, E., Greene, L.J. and Friedman,
L. Biochemistry (1974) li, 5060.

170
122. Soltmann, B., Swee1ey, C.C. and Holland, J.F.
Anal. Chern. (1977) 49, 1164.
123. Anderson, W.R. Jr., Frick, W., Daves, G.D. Jr.,
Barofsky, D.F., Yamaguchi, I., Chang, D., Folkers, K.
and Rossell, S.P Biophys. Res. Commun. (1977)
J.!i, 372.
124. Anderson, W.R. Jr., Frick, W. and Daves, G.D., Jr .
. Am. Chern. Soc. (1978) 100, 1974.
125. Baldwin, M.A. and McLafferty, F.W. Org. Mass Spectrom.
(1973) 2, 1353.
126. Hunt, D.F., Shabanowitz, J., Botz, F.K. and Brent, D.A.
Anal. Chern. (1977) 491160.
127. Bruins, A.P. Adv. Mass Spectrom. (1980) 8A, 246.
128. Ohashi, M., Nakayama, N., Kudo, H. and Yamada, S.
Mass. Spectrosc. (Japan) (1976) 24, 265.
129. Ohashi, M. Yamada, S., Kudo, H. and Nakayama, N.
Biomed. Mass Spectrom. (1978) ~, 579.
130. Ohashi, M. and Nakayama, N. Org. Mass Spectrom. (1978)
ll, 642.
131. Hansen, G. and Munson, B. . Chern. (1980) 52, 245.

171
132. Hansen, G. and Munson, B. Anal. Chern. (1978) ~, 1130.
133. Cotter, R.J. Anal. Chern. (1979) ~, 317.
134. Cotter, R.J. and Fenselau, C. Biorned. Mass Spectrorn.
(1979) ~, 287.
135. Bruins, A.P. Anal. Chern. (1980) 2£' 605.
136. Reinhold, V.N. and Carr, S.A. Anal. Chern. (1982) ~,
499.
137. Virelizier, H., Hagemann, R. and Jankowski, K.
Biorned. Mass Spectrorn. (1983) lQ, 559.
138. Carroll, D.I., Nowlin, J.G., Stillwell, R.N. and
Horning, E.C. Anal. Chern. (1983) ~, 2007.
139. Jamieson, G.C., Reuter, C.C. and Fitch, W.L.
Anal. Chern. (1985) ~, 121.
140. Cotter, R.J. Anal. Chern. (1980) 2£' 1589A.
141. Bruins, A.P. Biorned. Mass Spectrorn. (1981) ~, 31.
142. Stillwell, R.N., Carroll, D.I., Nowlin, J.G. and
Horning, E.C. Anal. Chern. (1983) ~, 1313.
143. Tecon, P., Hirano, Y. and Djerassi, C.
Org. Mass Spectrorn. (1982) 17, 277.

172
144. Srnith, R.G. Anal. Chern. (1982) ~, 2006.
145. Junk, G. and Svec, H. J. Arn. Chern. Soc. (1963) ~,
839.
146. Leclercq, P.A. and Desiderio, D.M. argo Mass Spectrorn.
(1973) 2, 515.
147. Milne, G.W.A., Axenrod, T. and Fales, H.M.
~~~~~~.~S~o~c. (1970) ~, 5170.
148. Meot-Ner, M. and Field, F.H. J. Arn. Chern. Soc. (1973)
95, 7207.
149. Winkler, H.U. and Beckey, H.D. Biochern. Biophys. Res.
Commun. (1972) ~, 391.
150. Wipf, H.K., Irving, P., McCarnish, M., Venkataraghavan,
R. and McLafferty, F.W. . Soc. (1973)
9 , 3369.
151. Esrnans, E.L., Alderweireldt, F.C., Marescau, B.A. and
Lowenthal, A.A. Anal. Chern. (1984) 56, 693.
152. In ref. 104.
153. Milne, G.W.A., Fales, H.M. and Axenrod, T. Anal. Chern.,
(1971) il, 1815.
173
154. Cooper, R., and Unger, S. J. Antibiotics, (1985), ~, 24.
155. Gordon, A.J. and Ford, R.A. "The Chemist's Companion";
John Wiley and Sons: New York (1972) pp. 429-436.
156. Perrin, D.D., Armarego, W.L.F. and Perrin, D.R.
"Purification of Laboratory Chemicals··, 2nd ed; Pergamon
Press: Oxford (1982).
157. In ref. 155, p. 428-429.

174
Appendix A
The tuning voltage supplied by each channel of the
MID to control
following circuit.
x Power
supply
y
mass spectrometer is adjusted using the
To MS
(via timing
logic circuit)
The mass range covered by each potentiometer was reduced
by inserting a 2 kilohmn resistor at "x" and a 500 ohm
resistor at "yn.

175
Appendix B
Note 1:
Drugs absorbed from the gastrointestinal tract into
the bloodstream are carried first in the portal circulation
to the liver where they may be metabolised. Loss of drug
from the bloodstream on passage through the liver is termed
the first-pass effect. In some cases, the first-pass effect
may result in virtually complete elimination of the original
drug before it gains access to the general circulation.
Note 2:
Haemodialysis is a procedure for removing waste products
of metabolism from the blood when renal function is inadequate
or has failed completely. Blood from the patient is passed
through an artificial membrane surrounded by a dialysis
fluid (the dialysate), and returned to the patient. Waste
products such as urea, creatinine and uric acid diffuse out
of the blood, across the dialyser membrane and into the
dialysate. An anticoagulant is required to prevent the
blood from clotting.
Note 3:
Haemodialysis requires repeated, reliable vascular
access. This used to be by means of an external artificial
arteriovenous shunt (Figure 38). During dialysis, the shunt is
disconnected and the ends joined to the appropriate parts of
the dialyser. Such shunts tended to clot and gave the patient
no freedom to immerse the limb in water. The commonest access

176
in use today is a subcutaneous arteriovenous fistula
(Figure 39). The radial artery in the non-dominant arm is
joined, usually side to side, with the vein at the wrist so
that the vein back up the arm increases in size and develops
a thicker wall. This enlarged artery-like vein can be
needled to provide access to the bloodstream, first to
withdraw blood and then to return it after it has passed
through the dialyser.
Figure 38. External arteriovenous shunt.
Note 4:
Figure ~~: Subcutaneous arteriovenous fistula.
A drug that is secreted into the bile presented again
to the intestine and may be reabsorbed and passed again to the
liver. This cycle of events is termed enterohepatic
recirculation. The effect of this cycle is to increase the
persistance of the drug in the body and, providing the
concentrations of the drug at its sites of action are
suff ently high, to prolong its duration of action.

177
Appendix C
The equation of the weighted regression line which
minimises the sum of the squares of the residual differences
between the observed y values and the y values predicted from
the regression line is given by y = a + bx, where b is the
best estimate of the slope, given by
b = L:UV L:U2-
and the best estimate of the intercept is given by
where
and
x
a y - bx
1 w = s2
Ewx Ew
and y = L:wy Ew
EUV = Ew(x-x)(y-y) = L:wxy - x yEw.