Drought survival of tropical tree seedlings enhanced by … · Dubois, M., Gilles, K. A., Hamilton,...
15
SUPPLEMENTARY INFORMATION DOI: 10.1038/NCLIMATE2281 NATURE CLIMATE CHANGE | www.nature.com/natureclimatechange 1 Detailed methods Study site details Mean annual rainfall recorded in Danum Valley from 1986-2010 was 2849 mm (± 94.0 s.e.m.). Daily temperature during the course of the experiment averaged 25 °C (± 0.02) with average maximum and minimum temperatures of 30 °C and 23 °C, respectively. The average daily humidity was 92.6% (± 0.1) with average maximum and minimum humidity of 98.4% and 74.2%, respectively. Measurements of climatic variables were collected hourly using digital sensors (SKH 2000 probe, Skye instruments LTD, Llandrindod Wells, Powys, UK). Mean shade-house light was 9.5% (± 1.1) of direct sun-light measured with SKP 210 photosynthetically active radiation sensors (Skye instruments LTD, Llandrindod Wells, Powys, UK). Nursery details Seeds were planted in pots were filled with homogenized forest soil (50% clay, 30% silt and 20% sand) obtained from the Innoprise-FACE Foundation Rainforest Rehabilitation Project (http://www.face-thefuture.com). Seedlings were raised under nursery conditions until every individual had dropped their cotyledons before beginning non-structural carbohydrate manipulation. We replanted individuals that died during the first two months with seedlings from the same mature tree, grown under the same conditions. Non-structural carbohydrate manipulation The high-light conditions were produced with one layer of 70% shade-cloth and averaged 26.4% (± 1.3) of direct sunlight. The low-light conditions were produced with three layers of 70% shade-cloth and averaged 0.4% (± 0.04) of direct sunlight. Light was measured simultaneously under the shade-cloth and the open sky for a 24- hour period at each of three random locations amongst the seedlings - a total of 72 hours of Drought survival of tropical tree seedlings enhanced by non-structural carbohydrate levels © 2014 Macmillan Publishers Limited. All rights reserved.
Transcript of Drought survival of tropical tree seedlings enhanced by … · Dubois, M., Gilles, K. A., Hamilton,...
SUPPLEMENTARY INFORMATIONDOI: 10.1038/NCLIMATE2281
NATURE CLIMATE CHANGE | www.nature.com/natureclimatechange 1
Drought survival of tropical tree seedlings enhanced by non-structural carbohydrate levels
O’Brien et al 1
Supplementary Information
Detailed methods
Study site details Mean annual rainfall recorded in Danum Valley from 1986-2010 was 2849
mm (± 94.0 s.e.m.). Daily temperature during the course of the experiment averaged 25 °C (±
0.02) with average maximum and minimum temperatures of 30 °C and 23 °C, respectively. The
average daily humidity was 92.6% (± 0.1) with average maximum and minimum humidity of
98.4% and 74.2%, respectively. Measurements of climatic variables were collected hourly using
digital sensors (SKH 2000 probe, Skye instruments LTD, Llandrindod Wells, Powys, UK). Mean
shade-house light was 9.5% (± 1.1) of direct sun-light measured with SKP 210
photosynthetically active radiation sensors (Skye instruments LTD, Llandrindod Wells, Powys,
UK).
Nursery details Seeds were planted in pots were filled with homogenized forest soil (50% clay,
30% silt and 20% sand) obtained from the Innoprise-FACE Foundation Rainforest Rehabilitation
Project (http://www.face-thefuture.com). Seedlings were raised under nursery conditions until
every individual had dropped their cotyledons before beginning non-structural carbohydrate
manipulation. We replanted individuals that died during the first two months with seedlings from
the same mature tree, grown under the same conditions.
Non-structural carbohydrate manipulation The high-light conditions were produced with one
layer of 70% shade-cloth and averaged 26.4% (± 1.3) of direct sunlight. The low-light conditions
were produced with three layers of 70% shade-cloth and averaged 0.4% (± 0.04) of direct
sunlight. Light was measured simultaneously under the shade-cloth and the open sky for a 24-
hour period at each of three random locations amongst the seedlings - a total of 72 hours of
Drought survival of tropical tree seedlings enhanced by non-structural carbohydrate levels
© 2014 Macmillan Publishers Limited. All rights reserved.
Drought survival of tropical tree seedlings enhanced by non-structural carbohydrate levels
O’Brien et al 2
measurement per light environment - using SKP 210 photosynthetically active radiation sensors
(Skye instruments LTD, Llandrindod Wells, Powys, UK). Individuals of each species were
randomly distributed throughout the nurseries to average out any variations in the light and
micro-climate across all species. Seedlings were watered every two days and vapour pressure
deficit was similar throughout the pre-treatment period (Supplementary Fig 4).
Destructive harvests and stomatal measurements We destructively harvested one seedling of
each species in each treatment prior to the start of the drought and after 35 days of drought at
five times during the day: pre-dawn (03:00-06:00), mid-morning (08:00-11:00), mid-day (12:00-
14:00), late-afternoon (15:30-17:30) and evening (18:00-20:00). Destructive harvests were also
done on day 83, 102 and 123 days after the treatment began on one to two seedlings of each
species in each NSC-treatment at pre-dawn (03:00-06:00) and mid-day (12:00-14:00). Two
Shorea macrophylla and Durio oxleyanus of enriched and depleted NSC levels were also
harvested at pre-dawn on day 72 to obtain final physiological measurements before complete
mortality of these species. Seedlings were microwaved to stop enzymatic activity within 30
minutes of harvest. We took photographs of all the leaves and analyzed their leaf area using
ImageJ software1. To assess biomass, seedlings were dried to a constant weight at 64 °C and the
leaves, stem and roots weighed (water was used to remove soil and debris from roots). Wood
density was calculated from water volume displacement and dry biomass for the seedlings
harvested prior to the start of drought in order to ensure similar cavitation resistance between
enriched and depleted seedlings2,3. We measured pre-dawn stem water potentials with a
Scholander pressure chamber (model 670, PMS Instrument Co., Corvallis, Oregon, USA) on
destructively harvested seedlings of each species from each NSC treatment on the 83rd and
102nd day of drought in order to examine the water status of the seedlings at the point of severe
© 2014 Macmillan Publishers Limited. All rights reserved.
Drought survival of tropical tree seedlings enhanced by non-structural carbohydrate levels
O’Brien et al 3
water deficit (wilting point). These seedlings were also used to measure the NSC concentration
of seedlings after prolonged drought. We made daily course measures of stomatal conductance
from 08:00 until 18:00 every 14 days with a steady state diffusion porometer (model SC-1,
Decagon Devices, Inc., Pullman, WA, USA). During each daily course, we measured 120
seedlings over three hour periods (three individuals of each species in each NSC treatment within
each watering treatment). Each of the 120 seedlings received three measurements per daily
course (no differences in stomatal closure between NSC-enriched and NSC-depleted seedlings
were found).
Non-structural carbohydrate analysis We used the five seedlings of each species from each
light manipulation treatment to quantify NSC concentrations in the leaf, stem and roots in order
to assess whether the light manipulations significantly altered stored NSC between individuals.
Additionally, we used three drought-seedlings from the later harvests of each species from each
NSC-treatment to assess the effect of drought on NSC. We ground the organs of each seedling
with a ball mill and used 15 mg of sample for NSC analysis. We extracted soluble sugars with a
shaking bath of 80% ethanol at 27 °C for one night followed by two additional 2-hour baths4,5.
We digested the remaining starch with amyloglucosidase (A-7420, Sigma-Aldrich, Co., St.
Louis, MO, USA). The concentrations of soluble sugars and starch (measured as glucose
equivalents) were measured at 487 nm by spectrophotometry after a phenol-sulphuric acid
reaction6,7. We calculated mean NSC concentration by multiplying extracted concentration for
each organ by organ biomass which provides total NSC per organ. We summed these NSC
values and divided by total plant biomass. Therefore, NSC concentration in each organ
represents the percentage of NSC relative to the whole seedling and the sum of each organ
percentage represents the total NSC concentration in the seedling.
© 2014 Macmillan Publishers Limited. All rights reserved.
Drought survival of tropical tree seedlings enhanced by non-structural carbohydrate levels
O’Brien et al 4
Environmental variables In order to measure temperature differences between treatments, we
placed Thermocron Ibuttons (model DS1921G-F5#, Maxim Integrated Products, Inc., Sunnyvale,
CA, USA) in each NSC treatment in drought and watered treatments. Temperatures between the
two NSC-treatments were similar (NSC-depleted = 25.5°C, 95% CI: 24.5 – 26.3 and NSC-
enriched = 25.5°C, 24.6 – 26.4). Volumetric soil moisture content at the top and bottom of the
pot was measured on 1-2 seedlings of each species in each treatment every week with an ML2x
Theta Probe and HH2 moisture meter (Delta-T Devices, Burwell, Cambridge, UK), to ensure
equal soil drying between NSC treatments in the drought treatment. The relationship between
soil water potential and volumetric soil moisture content was determined using the filter paper
method8,9. No differences were found in soil drying through time between the NSC treatments
(Fig. 3).
Statistical analysis To exclude any role of differences in plant morphology in the relationship
between time to death and NSC concentration, we tested whether the relationship between NSC
and survival were robust to the inclusion of leaf number as a covariate in the model (this non-
destructive measure has a strong positive correlation with total leaf area (R2 = 0.37, p-value <
0.0001) and was available for every seedling, whereas other measures of size and morphology
were not). We further tested whether the mortality-NSC relationship was robust to the inclusion
of root biomass to leaf area and shoot to root ratio (Supplementary Fig 5).
The Cox proportional hazard model was appropriate because some seedlings were
harvested before death, which caused left censoring, and monitoring mortality every two days
limited the number of ties10. We modeled the probability of survival through time as a function
of species identity and NSC level (enriched and depleted).
© 2014 Macmillan Publishers Limited. All rights reserved.
Drought survival of tropical tree seedlings enhanced by non-structural carbohydrate levels
O’Brien et al 5
We examined the effect of NSC concentrations on among-species mortality with two
metrics. First, we extracted the risk of mortality from the survival analysis for each species in
each NSC treatment modeled as a function of mean NSC concentration for each species in each
treatment. Second, we performed the same analysis as above but used days to death as the
response variable instead of extracted mortality risk. Because S. macrophylla and D. oxleyanus
had substantially higher risk than all other species, we removed them from the linear analyses of
risk. However, leaving those species in the analysis and using a generalized least squares
analysis with a weighted variance for species to account for heteroscedasticity produced a similar
result. We calculated relative-growth rate (RGR) of height between each successive time point to
examine the slowing of growth between NSC levels. We analyzed RGR as a function of height
(allowing for size correction to initial mean seedling height for all species11) and the interaction
of days since the start of drought and initial NSC level with a random effect for species
(Supplementary Fig 5).
In order to test the water status of seedlings after severe water deficit, we analyzed the
difference between pre-dawn stem water potentials for the enriched and depleted NSC seedling
using linear mixed effects models with day and species within day as random effects. Stem water
potential is a negative number measured in MPa; however, we took the additive inverse in order
to log transform the data to meet the assumptions of normality. Model estimates were back
transformed to MPa in order to avoid confusion in the presentation of the results in figure 2.
Shorea macrophylla and D. oxleyanus were not used in this analysis, as they had died prior to
these measurements. We used the Bayesian Information Criterion for model selection12. All
analyses were done using the R statistical software version 2.15.313 with the nlme and survival
packages10,14.
© 2014 Macmillan Publishers Limited. All rights reserved.
Drought survival of tropical tree seedlings enhanced by non-structural carbohydrate levels
O’Brien et al 6
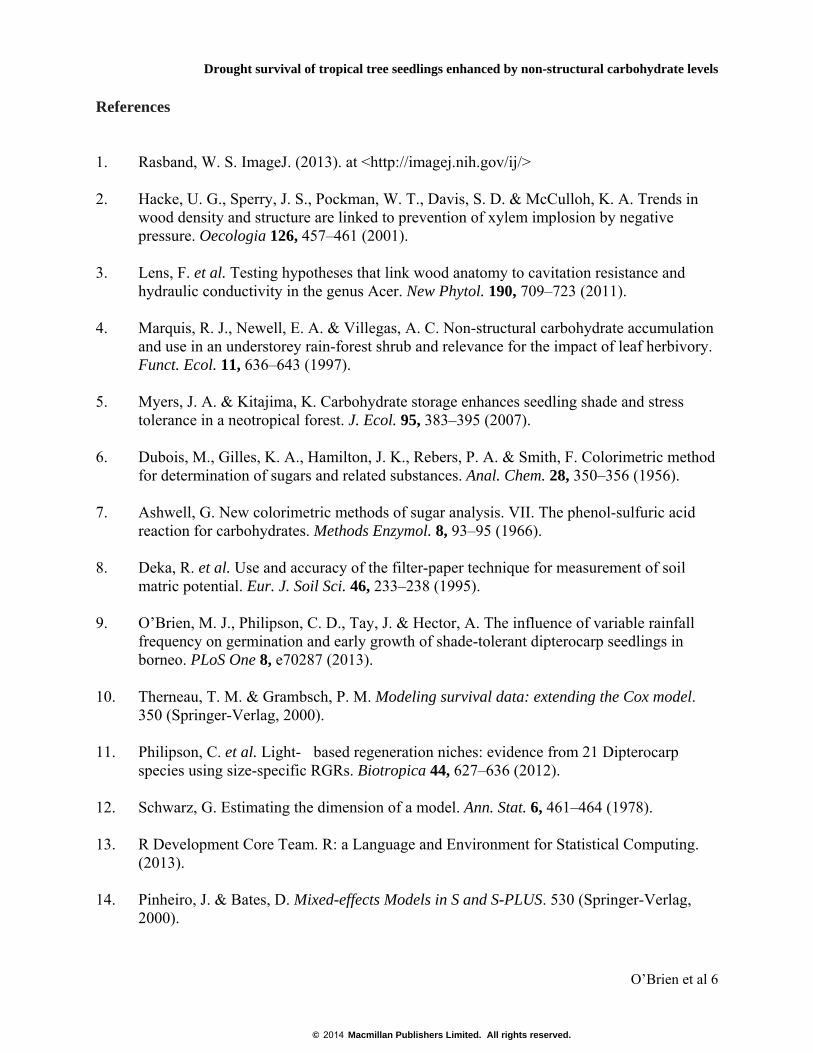
References
1. Rasband, W. S. ImageJ. (2013). at <http://imagej.nih.gov/ij/>
2. Hacke, U. G., Sperry, J. S., Pockman, W. T., Davis, S. D. & McCulloh, K. A. Trends in wood density and structure are linked to prevention of xylem implosion by negative pressure. Oecologia 126, 457–461 (2001).
3. Lens, F. et al. Testing hypotheses that link wood anatomy to cavitation resistance and hydraulic conductivity in the genus Acer. New Phytol. 190, 709–723 (2011).
4. Marquis, R. J., Newell, E. A. & Villegas, A. C. Non-structural carbohydrate accumulation and use in an understorey rain-forest shrub and relevance for the impact of leaf herbivory. Funct. Ecol. 11, 636–643 (1997).
5. Myers, J. A. & Kitajima, K. Carbohydrate storage enhances seedling shade and stress tolerance in a neotropical forest. J. Ecol. 95, 383–395 (2007).
6. Dubois, M., Gilles, K. A., Hamilton, J. K., Rebers, P. A. & Smith, F. Colorimetric method for determination of sugars and related substances. Anal. Chem. 28, 350–356 (1956).
7. Ashwell, G. New colorimetric methods of sugar analysis. VII. The phenol-sulfuric acid reaction for carbohydrates. Methods Enzymol. 8, 93–95 (1966).
8. Deka, R. et al. Use and accuracy of the filter-paper technique for measurement of soil matric potential. Eur. J. Soil Sci. 46, 233–238 (1995).
9. O’Brien, M. J., Philipson, C. D., Tay, J. & Hector, A. The influence of variable rainfall frequency on germination and early growth of shade-tolerant dipterocarp seedlings in borneo. PLoS One 8, e70287 (2013).
10. Therneau, T. M. & Grambsch, P. M. Modeling survival data: extending the Cox model. 350 (Springer-Verlag, 2000).
11. Philipson, C. et al. Light- based regeneration niches: evidence from 21 Dipterocarp species using size-specific RGRs. Biotropica 44, 627–636 (2012).
12. Schwarz, G. Estimating the dimension of a model. Ann. Stat. 6, 461–464 (1978).
13. R Development Core Team. R: a Language and Environment for Statistical Computing. (2013).
14. Pinheiro, J. & Bates, D. Mixed-effects Models in S and S-PLUS. 530 (Springer-Verlag, 2000).
© 2014 Macmillan Publishers Limited. All rights reserved.

Drought survival of tropical tree seedlings enhanced by non-structural carbohydrate levels
O’Brien et al 7
15. Wood, G. H. S. & Meijer, W. Dipterocarps of Sabah (North Borneo). (Sabah Forest Deptartment, 1964).
16. Lemmens, R. H. M. J., Soerianegara, I. & Wong, W. C. in Plant Resour. South-East Asia, Vol. 5, No. 2. (Backhuys Publishers, 1995).
17. Soepadmo, E. & Wong, K. M. Tree flora of Sabah and Sarawak. (Forest Research Institute of Malaysia, 1995).
© 2014 Macmillan Publishers Limited. All rights reserved.
Drought survival of tropical tree seedlings enhanced by non-structural carbohydrate levels
O’Brien et al 8
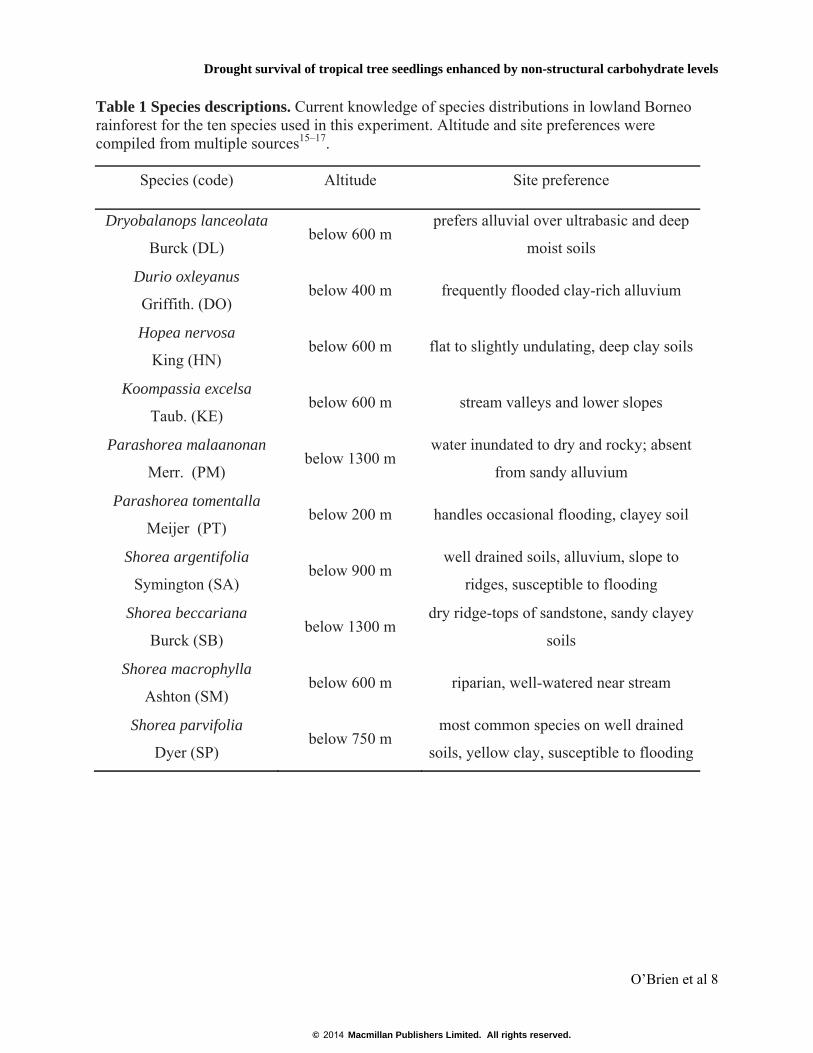
Table 1 Species descriptions. Current knowledge of species distributions in lowland Borneo rainforest for the ten species used in this experiment. Altitude and site preferences were compiled from multiple sources15–17.
Species (code) Altitude Site preference
Dryobalanops lanceolata
Burck (DL) below 600 m
prefers alluvial over ultrabasic and deep
moist soils
Durio oxleyanus
Griffith. (DO) below 400 m frequently flooded clay-rich alluvium
Hopea nervosa
King (HN) below 600 m flat to slightly undulating, deep clay soils
Koompassia excelsa
Taub. (KE) below 600 m stream valleys and lower slopes
Parashorea malaanonan
Merr. (PM) below 1300 m
water inundated to dry and rocky; absent
from sandy alluvium
Parashorea tomentalla
Meijer (PT) below 200 m handles occasional flooding, clayey soil
Shorea argentifolia
Symington (SA) below 900 m
well drained soils, alluvium, slope to
ridges, susceptible to flooding
Shorea beccariana
Burck (SB) below 1300 m
dry ridge-tops of sandstone, sandy clayey
soils
Shorea macrophylla
Ashton (SM) below 600 m riparian, well-watered near stream
Shorea parvifolia
Dyer (SP) below 750 m
most common species on well drained
soils, yellow clay, susceptible to flooding
© 2014 Macmillan Publishers Limited. All rights reserved.

Drought survival of tropical tree seedlings enhanced by non-structural carbohydrate levels
O’Brien et al 9
Figure 1 Differences in non-structural carbohydrates before drought. Confirmation of enriched and depleted non-structural carbohydrate concentrations (95% CIs) for all 10 species prior to drought treatments determined by linear mixed effects models. Triangles represent enriched NSC, and circles represent depleted NSC. Concentrations are the sum of organ concentrations weighted by the biomass of each organ divided by the total biomass.
© 2014 Macmillan Publishers Limited. All rights reserved.

Drought survival of tropical tree seedlings enhanced by non-structural carbohydrate levels
O’Brien et al 10
Figure 2 Similar seedling size and allocation before drought of enriched and depleted NSC. Confirmation of similar seedling sizes between depleted and enriched non-structural carbohydrate concentrations treatments (95% CIs) for all 10 species prior to drought treatments. Each response variable is a function of species and light swapping pre-treatment. Black-triangles represent enriched NSC, and grey-circles represent depleted NSC. Significant differences between enriched and depleted NSC were found between some variables (difference (95% CIs) between enriched and depleted: Leaf = 0.03 (-0.1 – 0.1); Height = 1.9 (1 – 3); Diameter = 0.8 (0.5 – 1.1); Shoot:root = 0.2 (-0.1 – 0.4); Root:leaf area = 1.6 (0.9 – 2.2); Density = 0.02 (-0.01 – 0.05))
© 2014 Macmillan Publishers Limited. All rights reserved.
Drought survival of tropical tree seedlings enhanced by non-structural carbohydrate levels
O’Brien et al 11
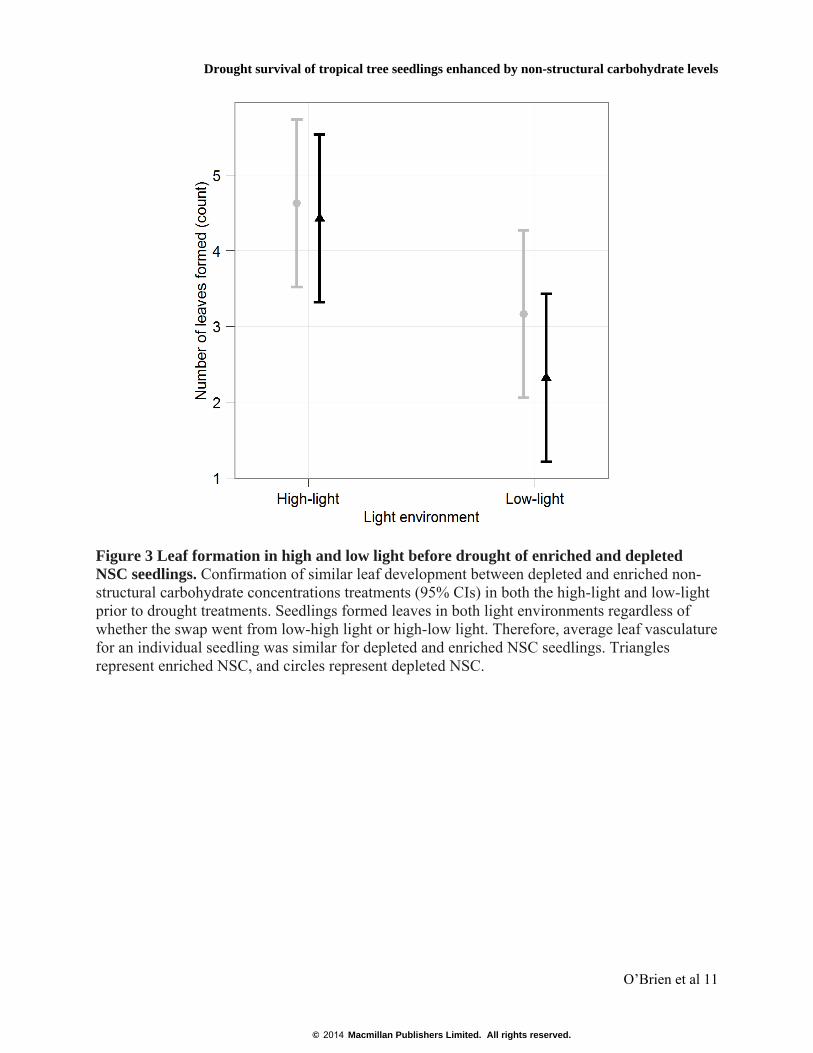
Figure 3 Leaf formation in high and low light before drought of enriched and depleted NSC seedlings. Confirmation of similar leaf development between depleted and enriched non-structural carbohydrate concentrations treatments (95% CIs) in both the high-light and low-light prior to drought treatments. Seedlings formed leaves in both light environments regardless of whether the swap went from low-high light or high-low light. Therefore, average leaf vasculature for an individual seedling was similar for depleted and enriched NSC seedlings. Triangles represent enriched NSC, and circles represent depleted NSC.
© 2014 Macmillan Publishers Limited. All rights reserved.

Drought survival of tropical tree seedlings enhanced by non-structural carbohydrate levels
O’Brien et al 12
Figure 4 Vapour pressure deficits during the 198 days of pre-treatment. Black points represent mid-day and grey points represent pre-dawn measurements. The vertical dashed line represents the day seedlings were moved from either the low-high light (NSC-enriched) or high-low light (NSC-depleted).
© 2014 Macmillan Publishers Limited. All rights reserved.

Drought survival of tropical tree seedlings enhanced by non-structural carbohydrate levels
O’Brien et al 13
Figure 5 Effect of NSC concentration on the time to death while controlling for biomass allocation. (a-c) Mean global time to death under drought for enriched (black triangles) and depleted (grey circles) non-structural carbohydrate (NSC) treatments (with least significant difference intervals, l.s.d.) while controlling for (a) root mass to leaf area, (b) shoot to root ratio and (c) wood density. The global difference in time to death between enriched and depleted seedlings remained robust with the inclusion of root mass to leaf area (9, 95% CI: 5 – 14), shoot to root ratio (11, 95% CI: 5 – 17) and wood density (5, 95% CI: 0.1 – 11). (d-f) Average time to death of each species as a function of average NSCs prior to drought (95% CI) while controlling for (d) root mass to leaf area, (e) shoot to root ratio and (f) wood density. A one percentage point increase in NSC increases survival by 6 days (-0.2 – 13), 5 days (1 – 8) and 8 days (3 – 14) while controlling for root mass to leaf area, shoot to root ratio and wood density, respectively. (Dryobalanops lanceolata: +, Durio oxleyanus: ▲, Hopea nervosa: ◊, Koompassia excelsa: ●, Parashorea malaanonan: ▽, P. tomentella: Δ, Shorea argentifolia: □, S. beccariana: x, S. macrophylla: ○, S. parvifolia: ■)
© 2014 Macmillan Publishers Limited. All rights reserved.
Drought survival of tropical tree seedlings enhanced by non-structural carbohydrate levels
O’Brien et al 14
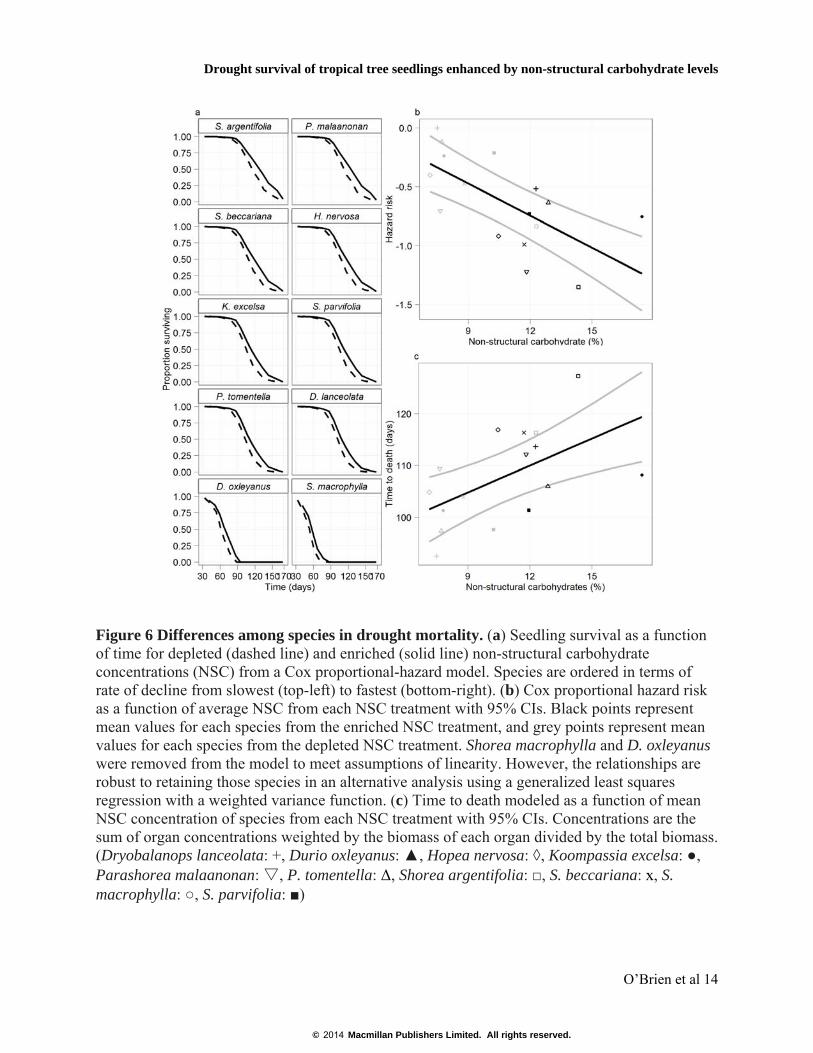
Figure 6 Differences among species in drought mortality. (a) Seedling survival as a function of time for depleted (dashed line) and enriched (solid line) non-structural carbohydrate concentrations (NSC) from a Cox proportional-hazard model. Species are ordered in terms of rate of decline from slowest (top-left) to fastest (bottom-right). (b) Cox proportional hazard risk as a function of average NSC from each NSC treatment with 95% CIs. Black points represent mean values for each species from the enriched NSC treatment, and grey points represent mean values for each species from the depleted NSC treatment. Shorea macrophylla and D. oxleyanus were removed from the model to meet assumptions of linearity. However, the relationships are robust to retaining those species in an alternative analysis using a generalized least squares regression with a weighted variance function. (c) Time to death modeled as a function of mean NSC concentration of species from each NSC treatment with 95% CIs. Concentrations are the sum of organ concentrations weighted by the biomass of each organ divided by the total biomass. (Dryobalanops lanceolata: +, Durio oxleyanus: ▲, Hopea nervosa: ◊, Koompassia excelsa: ●, Parashorea malaanonan: ▽, P. tomentella: Δ, Shorea argentifolia: □, S. beccariana: x, S. macrophylla: ○, S. parvifolia: ■)
© 2014 Macmillan Publishers Limited. All rights reserved.
Drought survival of tropical tree seedlings enhanced by non-structural carbohydrate levels
O’Brien et al 15
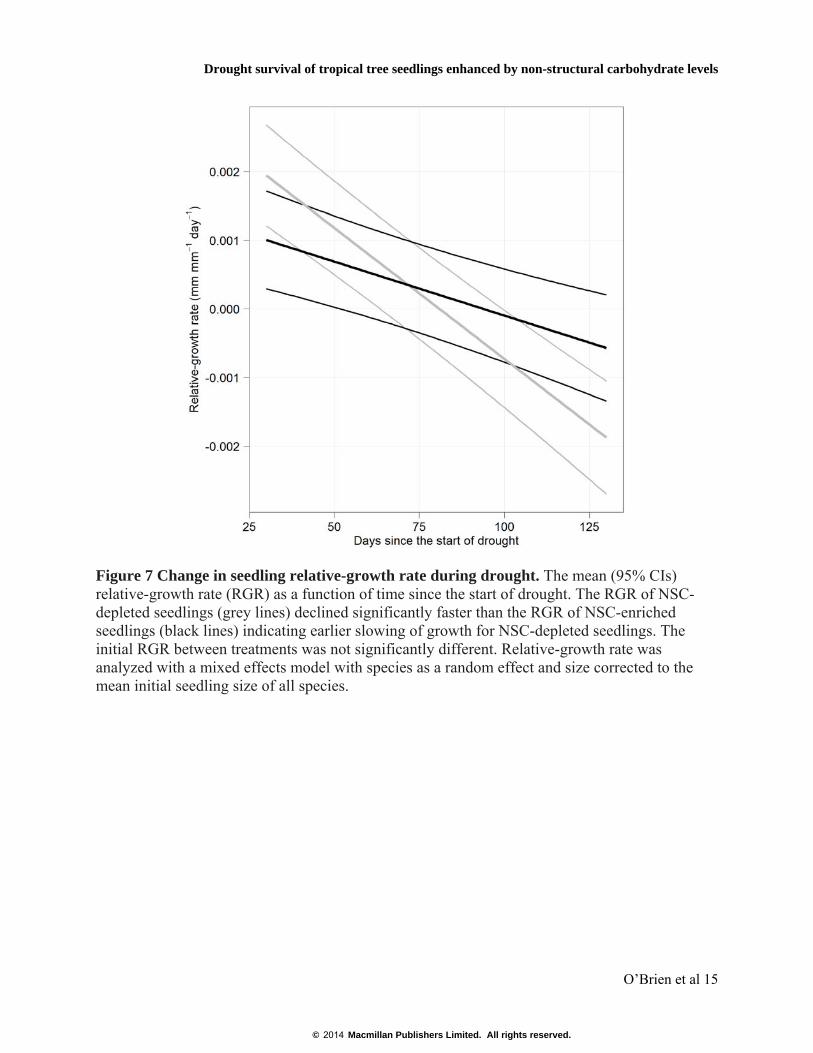
Figure 7 Change in seedling relative-growth rate during drought. The mean (95% CIs) relative-growth rate (RGR) as a function of time since the start of drought. The RGR of NSC-depleted seedlings (grey lines) declined significantly faster than the RGR of NSC-enriched seedlings (black lines) indicating earlier slowing of growth for NSC-depleted seedlings. The initial RGR between treatments was not significantly different. Relative-growth rate was analyzed with a mixed effects model with species as a random effect and size corrected to the mean initial seedling size of all species.
© 2014 Macmillan Publishers Limited. All rights reserved.