DROUGHT POLICY BRIEF WESTERN CAPE AGRICULTURE€¦ · valued at R121 billion in 2016 (Quantec,...
18
DROUGHT POLICY BRIEF WESTERN CAPE AGRICULTURE LOUW PIENAAR & JOHANN BOONZAAIER FEBRUARY 2018 www.elsenburg.com | www.bfap.co.za
Transcript of DROUGHT POLICY BRIEF WESTERN CAPE AGRICULTURE€¦ · valued at R121 billion in 2016 (Quantec,...

DROUGHT POLICY BRIEF
WESTERN CAPE AGRICULTURE
LOUW PIENAAR & JOHANN BOONZAAIER
FEBRUARY 2018
www.elsenburg.com | www.bfap.co.za

1
Table of Contents Executive Summary ............................................................................................................. 2
1. Introduction ...................................................................................................................... 3
2. Drought ............................................................................................................................. 3
3. Agricultural Context ........................................................................................................ 4
3.1 Employment ........................................................................................................... 6
3.2 Exports ..................................................................................................................... 7
3.3 Bio-physical impact .............................................................................................. 9
3.4 Investment in agriculture ...................................................................................... 9
4. Economic Impact Assessment ..................................................................................... 10
4.1 Methodology ....................................................................................................... 10
4.2 Results.................................................................................................................... 11
5. Conclusion ...................................................................................................................... 14
6. References ...................................................................................................................... 15
List of Figures
Figure 1: Western Cape employment per industry (excluding the City of Cape Town
Municipal area) ....................................................................................................................... 6
Figure 2: Farmworker employment in the Western Cape .................................................. 7
Figure 3: Exchange rates: South African Rand against major currencies ....................... 8
Figure 4: GFCF in the agricultural sector in the Western Cape ....................................... 10
List of Table
Table 1: Macro-economic indicators for the Western Cape and South Africa ............. 5
Table 2: Fruit export volumes (tons) from the Western Cape ............................................ 8
Table 3: NDVI averages during vegetative grow periods in the Western Cape ............ 9
Table 4: Economic impact of the drought on the Western Cape agricultural sector 13

2
Executive Summary
This policy brief highlights the adverse economic consequences of the current
drought in the Western Cape on the agricultural sector in order to provide guidance
to decision makers in dealing responsibly with this disaster.
As is well known by now, the Western Cape is currently experiencing the worst
drought in recorded history. The impact of this catastrophe on the provincial
economy is exacerbated by the fact that the agricultural and agri-processing
sectors combined contribute more than 10% of the Province’s GDP and employ
around 340 000 workers whose jobs have now become even more vulnerable. These
sectors also produce more than half of the net agricultural exports of South Africa at
a time when the Rand has been appreciating against almost all of the leading
currencies in the world.
The analysis shows significant declines in farm output, but also additional income
losses as export volumes also decline (currently they are significantly lower (19%)
than last year). These export industries are heavily reliant on higher margins and
producers have therefore prioritised fruit exports with the available water, whilst in
many cases abandoning large areas of vegetable production and other crops with
less favourable profitability projections.
The macro-level impact assessment shows that the Western Cape agricultural sector
is set to lose an estimated R5.9 billion in the 2017/18 season as a result of the drought.
The impact of this dramatic drop in production, especially in highly labour intensive
industries, has resulted in around 30 000 jobs being lost in the process. Anecdotal
evidence from the labour force surveys confirms this decline. The findings suggest a
severely negative impact on the agricultural sector and the financial losses
estimated here suggest that many producers will come under extreme pressure and
may not be able to remain on their farms.
DISCLAIMER:
This document and its contents have been compiled by the Western Cape Department of Agriculture (WCDoA)
and the Bureau for Food and Agricultural Policy (BFAP), for the purpose of analysing the economic impact of the
2017/18 drought. The views expressed in this document are those of the WCDoA and BFAP. Anyone who uses this
information does so at his/her own risk. The WCDoA, BFAP and the author(s) therefore, accepts no liability for
losses incurred resulting from the use of this information.

3
1. Introduction
This policy brief evaluates the impact of the 2017/18 drought on the Western Cape’s
agricultural sector. The aim is to assess the economic and financial impact of the
drought based on the most recent information available and on the most realistic
assumptions. The agricultural sector remains particularly vulnerable to external risks
such as extreme weather events as well as pest and diseases. The Western Cape
Department of Agriculture (WCDoA) and the Bureau for Food and Agricultural Policy
(BFAP) have over the past three years routinely analysed such impacts to inform
robust decision making (BFAP, 2016; Pienaar, 2017a; WCDoA & BFAP, 2017; WCDoA,
2017a; WCDoA, 2017b; BFAP, 2017).
In October 2017, the authors projected the impact of the drought based on a
scenario where Western Cape farmers only receive 40% of their normal water
allocation. The results showed that total agricultural output under these
circumstances would drop by around 35%, which translates into R4.96 billion1 of
Gross Value Added (GVA), a shock to the economy that results in the shedding of
around 35 000 agricultural jobs2 in the process. These findings have been
disseminated to various stakeholders in the agricultural sector, but this report now
moves from scenario analysis towards impact assessment as the drought has now
developed to a point where this becomes possible. Although still too early to make a
final estimate of the economic and financial impact of the drought, the findings
presented here are sufficient to drive key decisions on how to deal with the current
situation and will provide key insights on how to mitigate its impact if/or when normal
rainfall returns.
2. Drought
After three years of significantly lower rainfall, the Province’s average dam levels are
currently at some 22.6%, compared to 34.7% at the same time last year - already an
extremely dry season (Elsenburg.com, 2018). The critically low supply of water in key
agricultural production regions is even more pronounced because agriculture has to
compete with urban (industrial and residential) water use: as a result water
allocation to the sector has been cut more than 60%, and in some cases such as the
Lower Olifants River up to 86%.
This comes at a time when the agricultural sector has also been facing a range of
external risks such as the outbreak of the Highly Pathogenic Avian Influenza (HPAI)
amongst laying hens, costing the economy around R800 million (Pienaar, 2017b),
1 This was measured using average 2015/16 market prices for products and based on average yields across the
Western Cape. 2 Employment number were estimated using employment multipliers gathered from industry representatives, BFAP
(2015) and GreenCape (2016)

4
and more recently the impact of a thunderstorm bringing wind, hail and heavy rains,
which ruined around 200 000 cartons of late season plums (Hortgro, 2018).
In addition, the drought will also have medium to longer term adverse effects on
perennial crops (i.e. on the orchards and vineyards of the Province), placing
agricultural businesses at risk of bankruptcy even after the expected end of the
drought. Indeed, a survey done in 2017 confirmed that 6% of all farmers indicated
that they will not be able to continue farming if water allocations were cut by 60%
(BFAP, 2017). Of course, farmers are doing their best to mitigate these effects by
prioritising their best orchards, starting the process of orchard replacement earlier
and allocating water only to those crops that produce the best margins. In many
parts of the Province, this means that farmers have abandoned vegetable
production and/or decided to preserve their long-term crops by not harvesting
anything this season.
It is clear from these reoccurring events that both the frequency and severity of
climate-induced disasters are increasing. Scientists have warned that the Western
Cape is set to become relatively drier and will experience moderate to strong
warming in the next 100 years (WCDoA, 2017b). These realities are increasingly
putting pressure on the agricultural sector to continue to grow and to create much
needed jobs, especially in rural areas where limited other forms of employment exist.
3. Agricultural Context
In order to understand the impact of the current drought it is essential to start off with
a clear assessment of the importance of agriculture to the regional economy of the
Western Cape, and more broadly the rest of South Africa. Table 1 gives this context.
Starting with the contribution to the economy, the agricultural and agri processing
sectors added R21 billion and R33 billion respectively to the value added in the
Western Cape. This contributed to more than 10% of the entire regional economy,
which is mainly driven by labour intensive cultivation of fruits destined for export
markets (Vink & Tregurtha, 2001). This is clearly indicated by the fact that 52% of all of
the Western Cape’s exported goods were from these two sectors, with exports
valued at R121 billion in 2016 (Quantec, 2018a).
Indeed, when one compares the relative contribution of the agricultural sector in
the Western Cape (3.93%) relative to its contribution to the entire country (2.4%), the
importance of the sector and the potential impact of the drought become even
more significant.

5
Table 1: Macro-economic indicators for the Western Cape and South Africa
Item Western Cape % Contribution South Africa % Contribution
Population
Individuals 6.4 million 100 55.6 million 100
Households 1.8 million 100 15.4 million 100
Economy*
Total GVA R529 billion 100 R3 870 billion 100
Agriculture R21 billion 3.93 R94 billion 2.44
Agri Processing R33 billion 6.17 R175 billion 4.54
Agri + Processing R54 billion 10.10 R270 billion 6.98
Employment
Total Employed 2.4 million 100 16 million 100
Agriculture 217 919 9.21 890 816 5.58
Agri Processing** 126 089 5.32 601 728 3.77
Agri + Processing 344 008 14.53 149 2544 9.35
Exports
All Products R121 billion 100 R1081 billion 100
Agri + Processing R63 billion 51.91 R130 billion 12.07
*All values are for 2016 and GVA is given in 2016-prices using StatsSA deflator
**Agri Processing includes all occupations that do direct agricultural processing work
Source: Own Compilation from ITC (2018), Quantec (2018), QLFS (2018)
The agricultural sector in the Western Cape is made up of around 6 653 large-scale
commercial producers and 9 480 emerging farmers, whilst another 50 000 poorer
families are dependent on irrigated backyard gardening for their subsistence
(StatsSA, 2007; Geostratics, 2010; StatsSA, 2016). The latter are often dependant on
municipal water and it is expected that the majority of these households will not be
able to produce any food during the drought, which will impact negatively on their
food security. This is of major importance as most of these poor families will now have
to buy food at markets to feed themselves, much of it at relatively higher prices.
The Western Cape has a population of around 6.4 million people, who live in 1.8
million households (Quantec, 2018b). Of these individuals, only 2.4 million are
employed, setting the current narrow unemployment rate for the Province at 22%.
The agricultural sector employs around 180 000 workers, whilst the agri processing
sector adds another 126 000 jobs to the economy (QLFS, 2018). These two sectors
therefore employ 15% of the entire participating labour force in the Province, and
make up an even more significant proportion of un-skilled and semi-skilled
employment, the demographic with the highest unemployment rate. The jobs
created by these sectors are also geographically concentrated in rural areas where
limited other employment opportunities exist. This is highlighted in Figure 1 below,
which gives the employment share per industry of all jobs outside of the City of Cape
Town (Metro) and then further disaggregates the agricultural jobs according to the
skill levels of those jobs. This clearly shows the importance of the agricultural sector as

6
the main employer (22%) in the Western Cape’s more rural regions, while these jobs
are essentially un-skilled (71%) and semi-skilled (25%) occupations (Quantec, 2018c).
Figure 1: Western Cape employment per industry (excluding the City of Cape
Town Municipal area)
Source: Own Compilation from Quantec (2018c)
Not specifically shown in this figure, but put in another way to emphasise its
importance, the agricultural sector employs 38% of all of the unskilled workers
outside of the Cape Town Metro in the Province. No other industry has the ability to
employ such a large proportion of these workers.
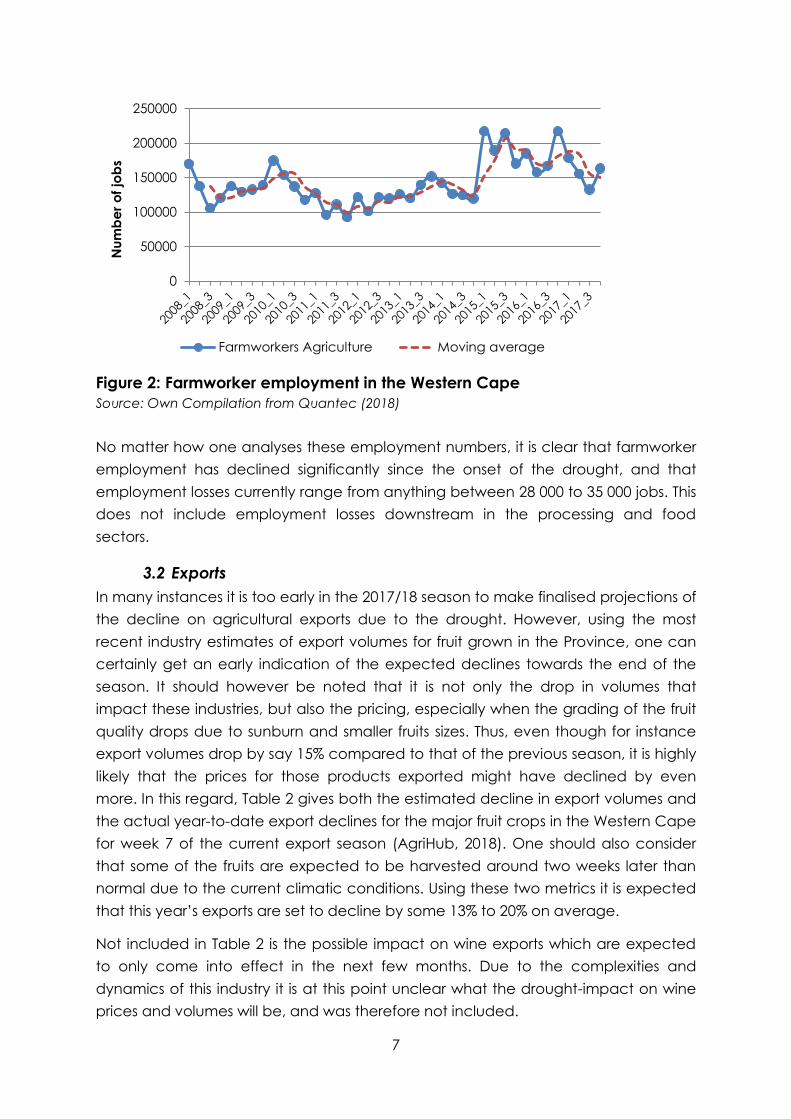
3.1 Employment
The most recent job numbers from Statistics South Africa (StatsSA), released in mid-
February, show employment numbers for the fourth quarter of 2017. It was quite
surprising that agricultural employment did not decline further from the third to the
fourth quarter of 2017, although one would expect further declines in the coming
months. Regardless, Figure 2 clearly shows the major impact of the drought on
farmworker employment in the Western Cape. The big jump shown in the 1st quarter
of 2015 was due to a technical change in the sample weightings by StatsSA, and
does not imply any structural changes in employment. However, of more
importance is the declining trend since then. Applying a moving average for every
three quarters to control for seasonality, the combined average agricultural
employment for the 2nd, 3rd and 4th quarters of 2016 compared to that of 2017 was a
decline of 31 000 jobs (QLFS, 2018). Looking at actual employment numbers and
comparing the average employment numbers per quarter of 2015 and 2016, to that
of 2017, the drop is even more severe at 32 047 jobs lost (QLFS, 2018).
Other
1%
Transport
3%
Construction
6%
Manufacturing
9%
Social
Services
13%
Government
13%
Finance
15%
Trade
18%
Skilled
5%
Semi-Skilled
25%
Un-Skilled
71%
Agriculture
22%
7
Figure 2: Farmworker employment in the Western Cape
Source: Own Compilation from Quantec (2018)
No matter how one analyses these employment numbers, it is clear that farmworker
employment has declined significantly since the onset of the drought, and that
employment losses currently range from anything between 28 000 to 35 000 jobs. This
does not include employment losses downstream in the processing and food
sectors.
3.2 Exports
In many instances it is too early in the 2017/18 season to make finalised projections of
the decline on agricultural exports due to the drought. However, using the most
recent industry estimates of export volumes for fruit grown in the Province, one can
certainly get an early indication of the expected declines towards the end of the
season. It should however be noted that it is not only the drop in volumes that
impact these industries, but also the pricing, especially when the grading of the fruit
quality drops due to sunburn and smaller fruits sizes. Thus, even though for instance
export volumes drop by say 15% compared to that of the previous season, it is highly
likely that the prices for those products exported might have declined by even
more. In this regard, Table 2 gives both the estimated decline in export volumes and
the actual year-to-date export declines for the major fruit crops in the Western Cape
for week 7 of the current export season (AgriHub, 2018). One should also consider
that some of the fruits are expected to be harvested around two weeks later than
normal due to the current climatic conditions. Using these two metrics it is expected
that this year’s exports are set to decline by some 13% to 20% on average.
Not included in Table 2 is the possible impact on wine exports which are expected
to only come into effect in the next few months. Due to the complexities and
dynamics of this industry it is at this point unclear what the drought-impact on wine
prices and volumes will be, and was therefore not included.
0
50000
100000
150000
200000
250000N
um
be
r o
f jo
bs
Farmworkers Agriculture Moving average

8
Table 2: Fruit export volumes (tons) from the Western Cape
Product Structure of the Industry
Export|Local|Processed
Export
Volumes
2016/17
YTD
('000)
Estimated
Export
Volumes
2017/18
('000)
Estimated
Export
Drop
(Total)
YTD Drop
in Export
volumes
(Week 7)
Estimate:
% of
harvest
complete
Apples 68%|10%|15% 417.8 382.2 -9 -33 4%
Table grapes 93%|06%|01% 185.7 121.2 -35 -23 70%
Plums &
Prunes 75%|23%|02% 64.8 53.9 -17 -24 60%
Pear 49%|13%|37% 218.4 202.0 -8 -23 17%
Oranges 72%|06%|15% 162.6 148.0 -9 - -
Naartjies 75%|12%|14% 74.4 69.9 -6 - -
Peach &
Nectarines 06%|21%|73% 15.7 15.6 -1 -5 82%
Apricots 09%|04%|87% 3.7 3.4 -7 -8 92%
Lemons &
Limes 67%|04%|29% 21.6 20.5 -5 - -
Total - 1 164.7 1 016.7 -13 -19 -
Source: Own Compilation from various sources
Another really important factor that is exacerbating the impact of the drought this
season is the current and sudden strengthening of the South African Rand against
most of the leading currencies since December 2017. Although welcomed by many,
fruit exporters and farmers receive their income in foreign currency, and this sudden
drop depicted in Figure 3 below will significantly impact agribusinesses this season.
Since November 2017 the Rand has strengthened by 15% against the US dollar, 9.7%
against the British Pound and 10.4% against the Euro (Quantec, 2018c; MoneyWeb,
2018).
Figure 3: Exchange rates: South African Rand against major currencies
Source: Quantec (2018b) & MoneyWeb (2018)
0
5
10
15
20
25
01-2
01
0
05-2
01
0
09-2
01
0
01-2
01
1
05-2
01
1
09-2
01
1
01-2
01
2
05-2
01
2
09-2
01
2
01-2
01
3
05-2
01
3
09-2
01
3
01-2
01
4
05-2
01
4
09-2
01
4
01-2
01
5
05-2
01
5
09-2
01
5
01-2
01
6
05-2
01
6
09-2
01
6
01-2
01
7
05-2
01
7
09-2
01
7
01-2
01
8
Sou
th A
fric
an R
and
ZAR: USD ZAR: Pound ZAR: Euro

9
3.3 Bio-physical impact
A Geographic Information Systems (GIS) was used to estimate the impact of the
drought on crop growth. The calculation is done using the Normalised Difference
Vegetation Index (NDVI) for some of the major crops in the Province during the main
vegetative growth period during the year. Using this remote sensing satellite
imagery, the average NDVI indices was calculated comparing 2017/18 against
2016/17 (current drought impact) and also to 2015 which is considered a “normal”
rainfall year. The results show remarkable consistency with the average drop in
production expected of around 14%. What is clear from this Table is that these fruit
trees have been under severe pressure in crucial growth periods, compared to 2015.
Table 3: NDVI averages during vegetative grow periods in the Western Cape
Crop Average
NDVI_2015
Average
NDVI
2016/17
Average
NDVI
2017/18
Change:
2016/17
vs
2017/18
(%)
Change:
2017/18 vs
2015 (%)
Estimated
Production
decline from
industry (%)
Wine grapes 106545 100787 91952 -8.8 -13.7 -20
Apples 78601 74834 70953 -5.2 -9.7 -9
Table grapes 95156 89246 78878 -11.6 -17.1 -18
Plums & Prunes 95877 92166 85473 -7.3 -10.9 -16
Pear 92550 89174 83376 -6.5 -9.9 -8
Oranges 78165 79543 76001 -4.5 -2.8 -9
Naartjies 69225 68499 68605 0.2 -0.9 -6
Peach & Nectarines 97029 93628 84010 -10.3 -13.4 -5
Apricots 80250 75264 62954 -16.4 -21.6 -7
Lemons & Lime 66574 67076 65141 -2.9 -2.2 -5
Total 859973 830217 767342 -7.6 -10.8 -14
Source: Own compilation using MODIS3 using ORNL DAAC (2018) and WCDoA (2013)
3.4 Investment in agriculture
Direct investment in agriculture is a key driver for development and is essential for
the long-term sustainability and competitiveness of the sector. Figure 1 shows that
the drought is also impacting on on-farm investment decisions. Gross Fixed Capital
Formation (GFCF) in the Western Cape’s agricultural sector has declined from its
highest peak in 2013 of R4.8 million, to around R3 billion in 2016 (Quantec, 2018d).
Though the drought conditions were not the only determining factor in this decline, it
is a significant one. When data for 2017 become available, it will no doubt confirm
our suspicion that on-farm investment has continued this downward trend into the
current year. This should be a cause for concern, as long-term productivity gains are
dependent on capital formation to drive growth in the sector. This being said, it is
also expected that once the sector moves on from the drought one could expect
3 This refers to the Moderate Resolution Imaging Spectroradiometer (MODIS) which gathers discrete spectral bands
of the surface which enable NDVI calculations.

10
significant increases in investment as lessons learnt during the drought will probably
result in increased orchard replacement and in some cases expansion due to more
efficient use of water.
Figure 4: GFCF in the agricultural sector in the Western Cape
Source: Quantec (2018d)
4. Economic Impact Assessment
4.1 Methodology
Measuring the economic impact the current drought is particularly challenging. First,
the drought impact varies considerably between different regions in the Province,
with different micro-climates, rainfall, catchment areas, water availability and types
of agricultural production (dry-land vs irrigated; grains vs fruits vs vegetables vs
livestock; intensive vs extensive systems). Second, sufficiently detailed and up-to-
date data is mostly not available. Third, many industries are currently still in the
process of harvesting or will soon be, hence the impact of the drought on
production is based largely on initial crop estimates.
Due to these difficulties the authors use data from a wide range of primary and
secondary sources, industry representatives, producers and agricultural specialists.
Economic impacts at an industry-level are then aggregated to get an estimate of
the Provincial impact. This approach highlights the fact that the last time that StatsSA
conducted an agricultural census was back in 2007.
The analysis is therefore done by using industry norms and gross margin analyses
based on the area planted for each crop (WCDoA; 2013). In some cases the
0
1
2
3
4
5
6
Va
lue
in
Ra
nd
(B
illio
n)
Machinery & Equipment Fixed Improvements
Transport Total GFCF

11
hectares planted were adjusted to reflect recent changes in land-use patterns
(CGA, 2017; Hortgro, 2016; Vinpro, 2017; SATI, 2017; PotatoesSA, 2018). Production
volumes for the current season were estimated using the latest industry information
available, while various informal discussions with industry, farmers and experts
provided additional information which gave the necessary context. In short, using
costing averages for all the major crops grown in the Western Cape, an estimate is
calculated for aggregate total costs per industry which producers would have
incurred for both this season’s produce (2016/17) and the one before (2015/16)4.
These were based on average production costs per hectare for each of the crops
(BFAP, 2018; Esuite, 2018; WCDoA, 2018; Hortgro, 2016; Vinpro, 2017; CGA, 2017)
Next, the structure of these industries was determined by looking at the main
marketing channels (exports; local fresh market and agri processing) and for each of
these the average prices were calculated for 2016/17. Then, the average prices that
farmers could expect to receive in the current 2017/18 season were also estimated.
This allows for a relatively crude comparison between the agricultural GVA
(excluding livestock) of the past two seasons, to get a GVA-impact as a result of the
drought (and other adverse shocks). The way to interpret the findings is to compare
the 2016/17 economic value added to that of 2017/18. This indicates sector-wide
losses in net income. The estimates are considered to be conservative as in a
“normal” year inflation drivers would have pushed agricultural GVA much higher
than the previous year.
In this process of estimating the economic impact, various assumptions were made
and findings were compared to actual numbers available at the time of writing. The
analysis does not allow for capturing the impact of micro-level or management
decisions on-farm, nor does it estimate micro-regional impacts. However, some
overall trends were observed that will be explained in the next section and against
this backdrop the initial impact of the drought is determined in a robust manner.
Again, the findings are conservative as the relatively greater impact of lower exports
and lower prices were not separately calculated. Furthermore, the increased supply
of fruit in the local market will put further pressure on prices, driving income streams
to farmers even lower. Finally, the analysis does not include all crops grown in the
Western Cape as information on many of the alternative fruits and vegetables was
not readily available.
4.2 Results
The results from the analysis are presented in Table 3 and give the macro-economic
impact of the drought per broad industry classification. Compared to the 2016/17
season, the cost to the Western Cape agricultural economy as a result of the
4 In cases where information on the inflation of production costs was not readily available, StatsSA’s (2018) average
Producer Price Index (PPI) for agriculture was used (i.e. a 6.4% increase in costs).

12
drought is estimated to be R5.9 billion in GVA and represents an average production
decline of around 20%. This is considerably higher than the R4.9 billion projected by
the analysis done back in 2017 for a number of reasons. Firstly, the impact of the
record losses in wheat production from 1.1 million tons in 2017 to 586 800 tons in 2018
was much more than the 35% drop initially anticipated (Crop Estimates Committee,
2018). This 47% decline has erased around R2.4 billion in income to the grain sector,
whilst both canola and barley producers were also under severe pressure. In
aggregate, the grain industry in the Western Cape’s GVA decline is valued at R2.8
billion.
Secondly, the strengthening of the Rand in the past weeks is putting pressure on
export earnings for fruit exports. This implies that if the Rand was trading at average
levels for 2017, fruit exports would have had considerably higher turnover when
prices are converted to local currency: this would have softened the impact of the
drought. Finally, all numbers given below reflect 2018 current prices, whilst that of the
previous estimate was based on 2016 prices.
When looking at the fruit sectors, the grape industries will incur the greatest losses
due to the drought. The Western Cape table grape industry is set to lose around
R787 million, whilst the wine grape industry another R591 million at the primary level.
As previously mentioned, these estimates are based on a range of assumptions and
despite of a conscious effort, to include as many as possible of the complexities
surrounding the true impact of the drought, it is impossible to make a clear
distinction between each of the underlying drivers. One of these underlying drivers is
the influence of long-term trends in the area under production. For example, in the
case of wine grapes, the total area planted to wine grapes has decline from more
than 99 000 ha in 2014 to 95 000 ha in 2016. This drop is obviously driving a decline in
production. However, based on the survey and industry expert knowledge, the drop
in production in the current season is anticipated to be well beyond the impact of
the declining trend in area of wine grapes, although the impact on revenues should
be smaller for a proportion of the harvest, because of higher quality, a phenomenon
that can only hold in the short term. Similar dynamics are also present in the citrus
industry, but in this case the rapid expansion in the area under production in recent
years is mitigating the impact of the drought to some extent due to a larger area
that is under production.
The pome fruit (apples & pears) industry’s output will decline by an estimated 9%,
which translates into R898 million lost, whilst the stone fruit industry (apricots, plums,
peaches and nectarines) lose another R458 million. The impact on the citrus industry
was more difficult to calculate as harvesting of these orchards has not yet started.
The industry suggests that much can still change if good rains are forthcoming in the
next two months. However, using a modest production decline of 7.7% in the
Western Cape, the income losses are valued at around R259 million.
13
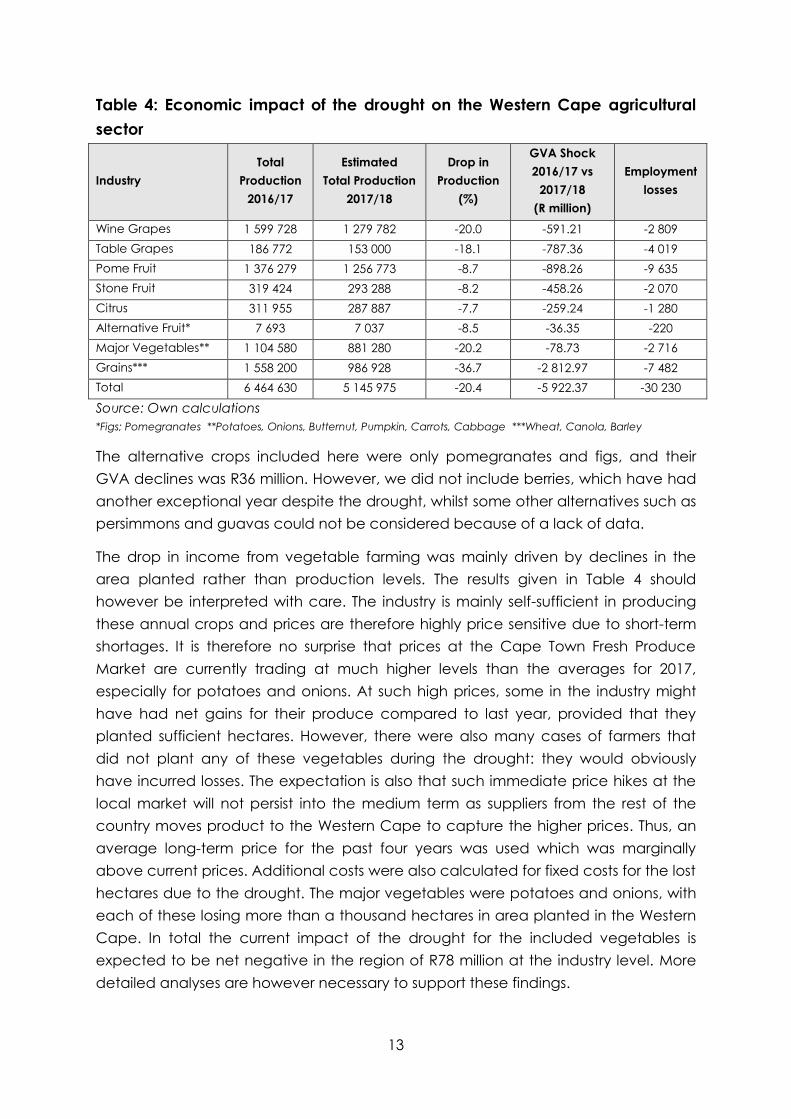
Table 4: Economic impact of the drought on the Western Cape agricultural
sector
Industry
Total
Production
2016/17
Estimated
Total Production
2017/18
Drop in
Production
(%)
GVA Shock
2016/17 vs
2017/18
(R million)
Employment
losses
Wine Grapes 1 599 728 1 279 782 -20.0 -591.21 -2 809
Table Grapes 186 772 153 000 -18.1 -787.36 -4 019
Pome Fruit 1 376 279 1 256 773 -8.7 -898.26 -9 635
Stone Fruit 319 424 293 288 -8.2 -458.26 -2 070
Citrus 311 955 287 887 -7.7 -259.24 -1 280
Alternative Fruit* 7 693 7 037 -8.5 -36.35 -220
Major Vegetables** 1 104 580 881 280 -20.2 -78.73 -2 716
Grains*** 1 558 200 986 928 -36.7 -2 812.97 -7 482
Total 6 464 630 5 145 975 -20.4 -5 922.37 -30 230
Source: Own calculations
*Figs; Pomegranates **Potatoes, Onions, Butternut, Pumpkin, Carrots, Cabbage ***Wheat, Canola, Barley
The alternative crops included here were only pomegranates and figs, and their
GVA declines was R36 million. However, we did not include berries, which have had
another exceptional year despite the drought, whilst some other alternatives such as
persimmons and guavas could not be considered because of a lack of data.
The drop in income from vegetable farming was mainly driven by declines in the
area planted rather than production levels. The results given in Table 4 should
however be interpreted with care. The industry is mainly self-sufficient in producing
these annual crops and prices are therefore highly price sensitive due to short-term
shortages. It is therefore no surprise that prices at the Cape Town Fresh Produce
Market are currently trading at much higher levels than the averages for 2017,
especially for potatoes and onions. At such high prices, some in the industry might
have had net gains for their produce compared to last year, provided that they
planted sufficient hectares. However, there were also many cases of farmers that
did not plant any of these vegetables during the drought: they would obviously
have incurred losses. The expectation is also that such immediate price hikes at the
local market will not persist into the medium term as suppliers from the rest of the
country moves product to the Western Cape to capture the higher prices. Thus, an
average long-term price for the past four years was used which was marginally
above current prices. Additional costs were also calculated for fixed costs for the lost
hectares due to the drought. The major vegetables were potatoes and onions, with
each of these losing more than a thousand hectares in area planted in the Western
Cape. In total the current impact of the drought for the included vegetables is
expected to be net negative in the region of R78 million at the industry level. More
detailed analyses are however necessary to support these findings.

14
When applying employment multipliers to the losses indicated in Table 3, around
30 000 job-losses are expected due to the drought (GreenCape, 2015). In total, the
macro-economic impact of the drought to the Western Cape described above
does not include the spill-over impact into the next few years as the sector recovers
from the drought. Even if the Province receives rainfall that is in line with average
rainfall patterns, it could take between 2-3 years for dam levels to recover sufficiently
to justify lifting water restrictions. Furthermore, the sector-wide impacts of increased
demand for fruit trees, which are currently at very low stocks, are a big concern due
to the many hectares of early removal: farmers will likely have to wait to be able to
replant. The follow-on impact of no income generated for the newly established
orchard of between 3 to 5 years from planting suggests that the sector will be
adversely impacted for the foreseeable future and it could take up to 10 years
before the agricultural value-added recovers to levels last seen in 2016.
5. Conclusion
The findings in this policy brief suggests a significant impact of the drought on the
Western Cape’s economy and will have severe implications for farm businesses and
those employed in the sector. Compared to the previous season, aggregate
income after costs is estimated to decline by up to R5.9 billion due to the lower
output as a result of the drought, and is set to decimate around 30 000 jobs. Various
factors at present are exacerbating the drought impact, such as the sudden strong
Rand and additional adverse external impacts such as storms, hail and sun-burn. To
mitigate the impact of the drought key decisions are needed to drive the sector
through this difficult time. In light of the findings in this policy brief urgent and
targeted interventions are needed to drive the sector through this disaster.
Unfortunately no clear policy instruments currently exist which can guide the process
of disaster relief to fruit and vegetable farmers. The Section 7 Drought Committee
that has recently been re-convened by the National Agricultural Marketing Council
(NAMC) to address some of these challenges will need to take note of the following
considerations. Support to the agricultural sector by means of direct subsidies has a
long history of adverse consequences and negative spill-overs. Support interventions
should therefore be focussed on protecting the industry as a whole, especially
emerging farmers which will not be able to continue farming due the losses incurred
during the drought. Also, the livelihoods of thousands of farmworker families and the
food security of poor households should also drive decisions in this regard. Indirect
support to farmers to remain on-farm should therefore be prioritised in a way that
supports the entire agricultural economy to get through the drought.
Additionally, the sustainability and competitiveness of the agricultural sector is
dependent on the following realties. First, climate change has become the ‘new
normal’, and it would seem as if the main impact on the Western Cape is going to

15
be the extent, duration and seasonal distribution of rainfall: less rain, more summer
rains, and fewer rainy days. This means that a recalculation of the water needs on
the part of those charged with responsibility to supply water to agriculture and other
users, and of the realistic water availability on the part of the water users, is required
as a matter of urgency.
Second, the current drought is already in its third year. The farmers of the Western
Cape are not passive recipients of advice from the authorities and the ‘experts’:
they are where they are because they are forward looking, and risk takers. Obviously
not all to the same extent: there are leaders and there are followers, and there are
those who are historically advantaged and those who are disadvantaged, etc.
Notwithstanding, they have already started to adapt to the ‘new normal’, as has
been shown in this analysis. Public policy should therefore lean more towards support
to this process of adaptation, and less to invent new ways of adapting. This requires
decisions about:
How to go about engaging with all types of farmers to ascertain what support
suits their needs the best;
What are the real bottlenecks that discourage farmers from successfully
adapt to the changes;
Which farmers should be targeted first – geographically, population group,
industry, etc.;
How to separate the urgent from the important, and build priorities around
the latter;
How to approach the important issue of the timing and sequencing of
reforms?
How to synchronise the activities along the myriad of supply chains that
operate in the province;
Not least, how to protect farm worker interests in this initiative.
6. References
AgriHub, 2018. AgriHub. [Online] Available at: http://www.agrihub.co.za/reports/
[Accessed 20 February 2018].
BFAP, 2011. The Impact of Thailand's market closure to South African fresh produce.
Pretoria: Bureau for Fod and Agricultural Policy.
BFAP, 2013. Impact of possible European Union market's closure to South African
citrus. Pretoria: Bureau for Food and Agricultural Policy.
BFAP, 2016. Policy Brief on the 2015/2016 drought. Pretoria: Bureau for Food and
Agricultural Policy.
16
BFAP, 2018. Farming Systems Analysis. Insights from Divan van der Westhuizen.
Pretoria: Bureau for Food and Agricultural Policy.
Census, 2011. Census of Agricultural Households. Pretoria: Statistics South Africa.
CGA, 2017. Key industry statistics for citrus growers. Hillcrest: Citrus Growers
Association.
Crop Estimates Committee, 2018. Winter Cereal (2017): 6th Production Forecast.
Pretoria: South African Grain Information Service Department of Agriculture, Forestry
and Fisheries.
Elsenburg.com, 2018. Western Cape Government: Agriculture. [Online] Available at:
http://www.elsenburg.com/agri-tools/western-cape-dam-levels [Accessed 1
February 2018].
Esuite, 2018. Enterprise Budgets. Pretoria: Extention Suite Online.
Geostratics, 2010. Farmer database Project: Development of a spatial information
system on black farmers in the Western Cape. Elsenburg: Western Cape Departmnet
of Agriculture Geostratics.
GreenCape, 2015. Greencape Sectoral Multipliers. Pretoria: Conningarth
Economists.
Hortgro, 2016. Key deciduous fruit statistics. Paarl: Hortgro.
Hortgro, 2018. Hail damage on stone fruit. Season Update: 15 February 2018. Paarl:
Hortgro.
MoneyWeb, 2018. Data tools and quick indicators. [Online] Available at:
https://www.moneyweb.co.za/tools-and-data/daily-indicators/ [Accessed 18
February 2018].
ORNL DAAC, 2018. MODIS Collection 6 Land Products Global Subsetting and
Visualization Tool. Tennessee: ORNL DAAC.
Pienaar, L., 2017a. An Economic Impact Assessment of Water Allocation Decisions
on Irrigated Agriculture in the Western Cape. Elsenburg: Western Cape Department
of Agriculture.
Pienaar, L., 2017b. Economic Impact Assessment: Avian influenza in the Western
Cape. Elsenburg: Agricultural Economics Services Western Cape Department of
Agriculture.
PotatoesSA, 2018. Western Cape Drought: Impact on the potato industry. Pretoria:
Potatoes South Africa.

17
QLFS, 2018. Quarterly Labour Force Survey (Revised): From 2008 Quarter 1 to 2017
Quarter 4. Pertoria: Statistics South Africa.
Quantec, 2018a. Regional Standardised Data: Regional Trade. Pretoria: Quantec.
Quantec, 2018b. Regional Standardised Data: Demographics. Pretoria: Quantec.
Quantec, 2018c. International Economic data: Exchange rates. Pretoria: South
African Reserve Bank.
Quantec, 2018d. Regional Standardised Industry: Capital Formation. Pretoria:
Quantec.
SATI, 2017. Statistics booklet. Paarl: South African Table Grape Industry.
StatsSA, 2007. Census of Commercial Agriculture: Financial and production statistics.
Pretoria: Statistics South Africa.
StatsSA, 2016. Community Census: Agricultural Households. Pretoria: Statistics South
Africa.
StatsSA, 2018. P0142.1 Producer Price Index (PPI). Pretoria: Statistics South Africa.
Vink, N. & Tregurtha, N., 2001. Agriculture and Mariculture: Structure, performance
and future prospects. Elsenburg: Western Cape Department of Agriculture.
Vinpro, 2017. Cost guide. Paarl: Vinpro.
WCDoA, 2017a. Economic Impact Assessment. Presentation given at the Project
Khulisa press conference on 17 October 2017. Cape Town: Agricultural Economic
Services Western Cape Department of Agriculture.
WCDoA, 2017b. Informing the Western Cape agricultural sector on the 2015-2017
drought: A drought fact sheet. Elsenburg: Western Cape Department of Agriculture.
WCDoA, 2018. Enterprise Budgets. Elsenburg: Agricultural Economics Services
Western Cape Department of Agriculture.
WCDoA & BFAP, 2017. The impact of water shortage on irrigated agriculture in the
Western Cape. Elsenburg: Western Cape Department of Agriculture Bureau for Food
and Agricultural Policy.