Drought management plans and water availability in agriculture: A risk assessment model for a...
8
Drought management plans and water availability in agriculture: A risk assessment model for a Southern European basin Carlos Dionisio Pérez-Blanco a,b,n , Carlos Mario Gómez c,d,e,1 a Fondazione Eni Enrico Mattei (FEEM), Isola di San Giorgio Maggiore, 30124 Venice, Italy b Centro Euro-Mediterraneo sui Cambiamenti Climatici, Divisione CIP, Isola di San Giorgio Maggiore 8, 30124 Venice, Italy c University of Alcalá de Henares, Plaza de la Victoria 2, 28802 Alcalá de Henares, Madrid, Spain d Madrid Institute for Advanced Studies in Water Technologies (IMDEA-Water), C/ Punto Net, 4, 2º piso, Edificio ZYE, Parque Científico Tecnológico de la Universidad de Alcalá, 28805 Alcalá de Henares, Madrid, Spain e University of Oxford, Lady Margaret Hall, OX2 6QA Oxford, UK article info Article history: Received 13 May 2013 Received in revised form 17 January 2014 Accepted 28 February 2014 Keywords: Agricultural economics Water economics Risk management Mediterranean river basin abstract The Drought Management Plans (DMPs) are regulatory instruments that establish priorities among the different water uses and define more stringent constraints to access to publicly provided water during droughts, especially for non-priority uses such as agriculture. These plans have recently become widespread across EU southern basins. However, in some of these basins the plans were approved without an assessment of the potential impacts that they may have on the economic activities exposed to water restrictions. This paper develops a stochastic methodology to estimate the expected water availability in agriculture that results from the decision rules of the recently approved DMPs. The methodology is applied to the particular case of the Guadalquivir River Basin in southern Spain. Results show that if DMPs are successfully enforced, available water will satisfy in average 62.2% of current demand, and this figure may drop to 50.2% by the end of the century as a result of climate change. This is much below the minimum threshold of 90% that has been guaranteed to irrigators so far. & 2014 The Authors. Published by Elsevier B.V. This is an open access article under the CC BY-NC-ND license (http://creativecommons.org/licenses/by-nc-nd/3.0/). 1. Introduction Population growth and the improvement of living standards have increased water demand worldwide and, along with decreas- ing water supply as a result of climate change, the vulnerability to drought events. This situation is to a great extent attributable to agriculture, which is the world's largest water consumer and is often believed to be wasteful (OECD, 2013; Ward and Pulido- Velazquez, 2008). Consequently, policy makers in drought prone areas have called for measures to save water in this sector and thus guarantee the provision of water for priority uses, namely, drinking water and minimum environmental flows. However, the effective- ness of these measures has been burdened so far by the prevailing paradigm, which considers water demand as an exogenous variable outside the field of water policy. As a result, water policy has been mostly based on expensive supply oriented policies, such as the construction of major infrastructures or the modernization of irrigation devices, that paradoxically have ended up increasing water demand, reducing water availability and undermining the robustness and resiliency of the system and its ability to cope with future droughts (Anderies et al., 2004; Ruttan, 2002). The high financial costs of these policies in a time of crisis and especially the limits of water supply have forced water authorities to alter their policy action. In the EU, some important legal restrictions over agricultural water use have recently been approved to address the problem of recurrent droughts. This is the case of the Drought Management Plans (DMPs). DMPs are inspired in the drought contingency plans implemented in the US since the '80s and thus follow similar rules (NDMC, 2013). Basically, DMPs define the precise thresholds of possible drought situations and set the water constraints that will come into force in each of these cases, with the aim of guaranteeing priority uses. The drought thresholds are obtained from the historical assess- ment of water supply, while the extent of the water constraints varies from one basin to other and depends largely on the ratio between water demand and water supply, being more restrictive in the more exploited basins and focusing on agricultural uses (the water use with the lowest priority) (EC, 2008). As a result, the declaration of a drought will automatically reduce, in a predictable amount, the quantity of water delivered to the irrigation system from publicly controlled water sources. In spite of being relatively new and voluntary, DMPs have rapidly spread across EU southern countries, such as France, Italy, Contents lists available at ScienceDirect journal homepage: www.elsevier.com/locate/wace Weather and Climate Extremes http://dx.doi.org/10.1016/j.wace.2014.02.003 2212-0947/& 2014 The Authors. Published by Elsevier B.V. This is an open access article under the CC BY-NC-ND license (http://creativecommons.org/licenses/by-nc-nd/3.0/). n Corresponding author. Tel.: þ39 041 270 0411; fax: þ39 041 270 0412. E-mail addresses: [email protected] (C.D. Pérez-Blanco), [email protected] (C.M. Gómez). 1 Tel.: þ34 91 830 59 62x116;fax: þ34 91 830 59 61. Please cite this article as: Pérez-Blanco, C.D., Gómez, C.M., Drought management plans and water availability in agriculture: A risk assessment model for a Southern European.... Weather and Climate Extremes (2014), http://dx.doi.org/10.1016/j.wace.2014.02.003i Weather and Climate Extremes ∎ (∎∎∎∎) ∎∎∎–∎∎∎
-
Upload
carlos-mario -
Category
Documents
-
view
213 -
download
1
Transcript of Drought management plans and water availability in agriculture: A risk assessment model for a...
Drought management plans and water availability in agriculture:A risk assessment model for a Southern European basin
Carlos Dionisio Pérez-Blanco a,b,n, Carlos Mario Gómez c,d,e,1
a Fondazione Eni Enrico Mattei (FEEM), Isola di San Giorgio Maggiore, 30124 Venice, Italyb Centro Euro-Mediterraneo sui Cambiamenti Climatici, Divisione CIP, Isola di San Giorgio Maggiore 8, 30124 Venice, Italyc University of Alcalá de Henares, Plaza de la Victoria 2, 28802 Alcalá de Henares, Madrid, Spaind Madrid Institute for Advanced Studies in Water Technologies (IMDEA-Water), C/ Punto Net, 4, 2º piso, Edificio ZYE, Parque Científico Tecnológico de la Universidad de Alcalá,28805 Alcalá de Henares, Madrid, Spaine University of Oxford, Lady Margaret Hall, OX2 6QA Oxford, UK
a r t i c l e i n f o
Article history:Received 13 May 2013Received in revised form17 January 2014Accepted 28 February 2014
Keywords:Agricultural economicsWater economicsRisk managementMediterranean river basin
a b s t r a c t
The Drought Management Plans (DMPs) are regulatory instruments that establish priorities among thedifferent water uses and define more stringent constraints to access to publicly provided water duringdroughts, especially for non-priority uses such as agriculture. These plans have recently becomewidespread across EU southern basins. However, in some of these basins the plans were approvedwithout an assessment of the potential impacts that they may have on the economic activities exposedto water restrictions. This paper develops a stochastic methodology to estimate the expected wateravailability in agriculture that results from the decision rules of the recently approved DMPs. Themethodology is applied to the particular case of the Guadalquivir River Basin in southern Spain. Resultsshow that if DMPs are successfully enforced, available water will satisfy in average 62.2% of currentdemand, and this figure may drop to 50.2% by the end of the century as a result of climate change. This ismuch below the minimum threshold of 90% that has been guaranteed to irrigators so far.& 2014 The Authors. Published by Elsevier B.V. This is an open access article under the CC BY-NC-ND
license (http://creativecommons.org/licenses/by-nc-nd/3.0/).
1. Introduction
Population growth and the improvement of living standardshave increased water demand worldwide and, along with decreas-ing water supply as a result of climate change, the vulnerability todrought events. This situation is to a great extent attributable toagriculture, which is the world's largest water consumer and isoften believed to be wasteful (OECD, 2013; Ward and Pulido-Velazquez, 2008). Consequently, policy makers in drought proneareas have called for measures to save water in this sector and thusguarantee the provision of water for priority uses, namely, drinkingwater and minimum environmental flows. However, the effective-ness of these measures has been burdened so far by the prevailingparadigm, which considers water demand as an exogenous variableoutside the field of water policy. As a result, water policy has beenmostly based on expensive supply oriented policies, such as theconstruction of major infrastructures or the modernization ofirrigation devices, that paradoxically have ended up increasingwater demand, reducing water availability and undermining the
robustness and resiliency of the system and its ability to cope withfuture droughts (Anderies et al., 2004; Ruttan, 2002).
The high financial costs of these policies in a time of crisis andespecially the limits of water supply have forced water authoritiesto alter their policy action. In the EU, some important legalrestrictions over agricultural water use have recently beenapproved to address the problem of recurrent droughts. This isthe case of the Drought Management Plans (DMPs). DMPs areinspired in the drought contingency plans implemented in the USsince the '80s and thus follow similar rules (NDMC, 2013).Basically, DMPs define the precise thresholds of possible droughtsituations and set the water constraints that will come into forcein each of these cases, with the aim of guaranteeing priority uses.The drought thresholds are obtained from the historical assess-ment of water supply, while the extent of the water constraintsvaries from one basin to other and depends largely on the ratiobetween water demand and water supply, being more restrictivein the more exploited basins and focusing on agricultural uses (thewater use with the lowest priority) (EC, 2008). As a result, thedeclaration of a drought will automatically reduce, in a predictableamount, the quantity of water delivered to the irrigation systemfrom publicly controlled water sources.
In spite of being relatively new and voluntary, DMPs haverapidly spread across EU southern countries, such as France, Italy,
Contents lists available at ScienceDirect
journal homepage: www.elsevier.com/locate/wace
Weather and Climate Extremes
http://dx.doi.org/10.1016/j.wace.2014.02.0032212-0947/& 2014 The Authors. Published by Elsevier B.V. This is an open access article under the CC BY-NC-ND license (http://creativecommons.org/licenses/by-nc-nd/3.0/).
n Corresponding author. Tel.: þ39 041 270 0411; fax: þ39 041 270 0412.E-mail addresses: [email protected] (C.D. Pérez-Blanco),
[email protected] (C.M. Gómez).1 Tel.: þ34 91 830 59 62x116;fax: þ34 91 830 59 61.
Please cite this article as: Pérez-Blanco, C.D., Gómez, C.M., Drought management plans and water availability in agriculture:A risk assessment model for a Southern European.... Weather and Climate Extremes (2014), http://dx.doi.org/10.1016/j.wace.2014.02.003i
Weather and Climate Extremes ∎ (∎∎∎∎) ∎∎∎–∎∎∎

Portugal and Spain2 (EC, 2008). In particular, Spain has pioneered theadoption of DMPs and every river basin comprising more than tworegions (NUTS 23) has already approved its DMP. However, there areno assessments available on the potential impact of DMPs on theeconomic activities exposed to water restrictions. As a result, theeffects of DMPs over water availability in sectors such as agricultureare basically unknown. This paper wants to help bridge this gap. Wedevelop a stochastic methodology to estimate the expected wateravailability in agriculture resulting from the decision rules of therecently approved DMPs. Then we apply this method to the particularcase of the Guadalquivir River Basin (GRB) in Spain, using historicaldata and official climate change scenarios. Results show that after theimplementation of the basin's DMP expected water availability dropsto 62.2% of the annual demand, with relevant spatial disparitiesamong sub-basins. According to the previous legislation, River BasinManagement Plans (RBMPs) had to guarantee irrigators a water accessreliability of 90%. This has happened since the implementation of thefirst wave of RBMPs in 1998 (Berbel et al., 2012). However, if DMPs aresuccessfully enforced, it will not be possible to guarantee a failure ratebelow the target of 10% -rather the contrary, this failure rate will beclose to 40%.
This paper is structured as follows: in Section 2, we introduce thearea where the case study is applied, the Guadalquivir River Basin in
southern Spain. Section 3 presents the methodology used to estimateexpected water availability in agriculture, and Section 4 presents theresults obtained. Section 5 discusses the results and concludes.
2. Background to the case study: the Guadalquivir river basin(Spain)
Because most of the variables involved in the design of theDMPs are site-specific, such as water supply and risk exposure, weillustrate each step of the model with the results for the particularcase of the GRB in Southern Spain.
The GRB is a large basin (57,071 km2) located in the south ofSpain (see Fig. 1). 90.2% of its territory is located in the region(NUTS 2) of Andalusia (ES61), with less relevant shares in theregions of Castile-La Mancha (ES42) (7.1%), Extremadura (ES43)(2.5%) and Murcia (ES62) (0.2%)4. The GRB has a semi-aridMediterranean climate, with an average temperature of 16.8 1C,warm summers and mild winters. Rainfall is scarce (548 mm/yearin average) and unevenly distributed along time, with peakmonthly values between 70 and 80 mm/month from Novemberto February and values below 25 mm/month during the summer(June to September). Due to relatively high temperatures potentialevapotranspiration is high, and during the summer months higherthan rainfall, resulting in a low runoff with an average value of128 mm/year (GRBA, 2013).
In spite of water scarcity and recurrent droughts, past economicgrowth in the GRB has been closely coupled to increases in waterdemand. As a result, average water demand amounts to 4016 hm3/year, while renewable resources are estimated to be 3028 hm3/year,resulting in an overexploitation of almost 1000 hm3/year and awater exploitation index (ratio of total freshwater abstraction over
Fig. 1. Location of the Guadalquivir River Basin in the Iberian Peninsula and detail of its sub-basins.
2 Unlike other water management instruments such as River Basin Manage-ment Plans, DMPs are not prescriptive, although they are already available inseveral Southern European basins in Spain, Italy, Portugal and France, and also inFinland, Netherlands and UK.
3 The NUTS classification (for French Nomenclature des unités territorialesstatistiques, Nomenclature of territorial units for statistics in English) is a hier-archical system for dividing up the economic territory of the EU. For each EUmember country, a hierarchy of three NUTS levels is established, which do notnecessarily correspond to administrative divisions within the country. A NUTS codebegins with a two-letter code referencing the country, followed by up to threenumbers indicating the three possible levels of disaggregation. The three NUTSlevels are: NUTS 3, usually working at a local level (parish/canton/oblast/city andregency/county/municipality); NUTS 2, which is a set of NUTS 3 and usually worksat a level of region/province/state/prefecture (including: autonomous type); andNUTS 1, working at different levels and defined as a set of NUTS 2 (EC, 2003).
4 ES61: ESpaña (Spain), NUTS 1 number 6, NUTS 2 number 61; ES42: ESpaña(Spain), NUTS 1 number 4, NUTS 2 number 42; ES 43: ESpaña (Spain), NUTS1 number 4, NUTS 2 number 43; ES62: ESpaña (Spain), NUTS 1 number 6, NUTS2 number 62.
C.D. Pérez-Blanco, C.M. Gómez / Weather and Climate Extremes ∎ (∎∎∎∎) ∎∎∎–∎∎∎2
Please cite this article as: Pérez-Blanco, C.D., Gómez, C.M., Drought management plans and water availability in agriculture:A risk assessment model for a Southern European.... Weather and Climate Extremes (2014), http://dx.doi.org/10.1016/j.wace.2014.02.003i
total renewable resources) of 1.22 (GRBA, 2007). More recentestimations set this ratio at 1.64 (EEA, 2009). Consequently, theGRB is regarded as a severely overexploited and drought exposedbasin and its recurrent drought events may have particularlyharmful effects over the economy (GRBA, 2013). In addition, strongevidence suggests that the existing water supply deficit of the lastdecades has been effectively covered with non-renewable ground-water resources, thus reducing the resiliency of the system todroughts and worsening the water crisis (GRBA, 2013; WWF, 2006).
Overexploitation is not homogeneously distributed among the14 sub-basins that constitute the GRB. The Regulación GeneralSub-basin, which is the largest sub-basin and supplies most of thewater in the GRB, is also the most deteriorated system. Theremaining sub-basins, including Salado de Morón, Campiña Sevil-lana, Alto Genil, Hoya de Guadix, Alto Guadiana Menor, Bembézar-Retortillo, Viar, Almonte-Marismas, Jaén, Rumblar, Guadalmellato,Huesna and Sevilla are less overexploited (GRBA, 2013).
Agriculture is the main water user in the GRB and demands 87% ofthe total water consumption. Given the structural water deficit of thebasin, this sector is highly vulnerable to drought events. Agriculture isa traditional activity in the GRB, of relevance in terms of employmentand income generation (agriculture represents 5.5% of the Gross ValueAdded and 7% of the employment in the GRB, as compared to 3.1% and4% in Spain, respectively) (GRBA, 2013). In order to avoid financiallosses in this strategic sector, during droughts water authorities havetraditionally prioritized water supply to agriculture over environmen-tal uses (EEA, 2009), thus leading to further overexploitation. Althoughthis goes against the principles of the EU Water Framework Directive(EC, 2000), it has been possible because water restrictions duringdrought events until a few years ago were based on a crisis-management approach that allowed water authorities to take discre-tionary (and often unpredictable) decisions. All this has changed afterthe implementation of the DMPs.
3. Methodology
DMPs quantify the particular situation at hand and the severityof the problem by using an objective and publicly observabledrought index. This drought index is an objective monthly valuethat is estimated at a sub-basin level using a combination of site-relevant hydrogeological variables, which include rainfall, runoff,groundwater stock and/or water stored in reservoirs (BOE, 2001).The drought index value ranges between 0 and 1 depending on theseverity of the drought. A value close to 1 denotes a situation ofnormality, while a value close to 0 denotes an extreme droughtevent. In the case of Spain, the severity of the drought is dividedinto four categories: normality, pre-alert, alert and emergency.Each one of these drought thresholds specifies the water restric-tions that will come into force for every water use, beingparticularly severe in the case of agriculture. In the GRB, waterrestrictions for the whole irrigation campaign are adopted inaccordance to the drought index calculated at the beginning ofthe irrigation campaign in April5 (GRBA, 2007).
The model presented in this paper estimates the probabilitydensity functions (PDFs) of the site-relevant hydrogeological vari-ables. Then it uses these PDFs to obtain the probability of everydrought index value in every sub-basin and aggregates theseprobabilities to obtain the probability of each drought threshold(i.e., the probability of being under normality, pre-alert, alert andemergency). Every drought threshold has a pre-established waterrestriction associated, and from these water restrictions and theircorresponding probabilities the model obtains the expected wateravailability for irrigated agriculture.
3.1. Probability Density Functions (PDFs)
DMPs use hydrogeological variables to calculate droughtindices that assess the drought severity in a sub-basin. Droughtindices are made up of one or a combination of the followinghydrogeological variables: rainfall, runoff, water stored in reser-voirs and the stock of groundwater (see for example the DMPs ofSRBA, 2008; GRBA, 2007; JRBA, 2005). There are large data seriesof these variables (covering from 47 to 67 years) available inofficial databases (AEMET, 2013; MAGRAMA, 2013a, 2013b). Weuse these data series to estimate the PDF for all the relevantvariables in the GRB's sub-basins. This way we obtain the prob-ability of every possible state of nature. We use a Gamma PDF forthe rainfall (Martin et al., 2001), runoff (Gómez and Pérez-Blanco,2012) and groundwater (Pérez-Blanco and Gómez, 2013) and aWeibull PDF for the water stored in reservoirs (Martínez et al.,2002).
3.1.1. Gamma PDFThe Gamma PDF is defined by a scale parameter ðaÞ and a shape
parameter ðbÞ that we estimate by maximum likelihood. Thefunction reaches a maximum for intermediate values, decreasesaccording to its scale parameter and converges to a normaldistribution function as the shape parameter increases. TheGamma PDF allows us to assign a probability density piði¼ 1;…;3Þ for the variable yi ði¼ 1;…;3Þ:
piðyiÞ ¼ zðyija; bÞ ¼1
baΓðaÞyia�1expð�yi
bÞ ð1Þ
Where y1 is rainfall, y2 the groundwater stock and y3 the runoff,expressed as the ratio (in %) of the average value of the variable forthe last 12 months (in the case of groundwater stock, we considerthe last observed value) to the maximum value in the historicaldata series, and p1, p2 and p3 are their corresponding probabilitydensities. Rainfall is used in the calculation of the drought index inthe sub-basins of Campiña Sevillana, Alto Guadiana Menor andAlmonte Marismas and the corresponding Gamma PDFs arecalibrated with data from AEMET (2013) for the time period1944–2011. Runoff data is used in the calculation of the droughtindex in the Viar and Huesna sub-basins and the correspondingGamma PDFs are calibrated with data from MAGRAMA (2013a) forthe time period 1943–2009. Data on groundwater levels is used inthe calculation of the drought index in the Alto Genil Sub-basinand the corresponding Gamma PDF is calibrated with data fromMAGRAMA (2013b) 6 for the time period 1965–2012.
Table 1 shows the best fit parameters for these variables intheir corresponding sub-basins using a Gamma function.
5 The GRB has a ratio of reservoir storage capacity to average annual water useof 2.38 (GRBA, 2013; MAGRAMA, 2013a). Since hydrological droughts lag behindmeteorological droughts, DMPs assume that this large storage capacity is enough toprevent further water restrictions along the irrigation campaign, even if themeteorological drought is aggravated (GRBA, 2007). Therefore, water restrictionsare not revised until the following campaign, although in the past water authoritieshave imposed extraordinary measures during particularly severe drought events(nonetheless, these measures are part of a crisis response out of the scope of DMPsand of this work) (BOE, 2005, 2006). In theory, this rigidity also applies if thedeclaration of a drought is followed by a series of rainy months, until thehydrological drought is overcome. However, in practice, water restrictions maybe softened in the latter case.
6 Drought indices in the Alto Genil, Viar and Huesna sub-basins are obtainedfrom the aggregated data on water stored in one or more reservoirs. However,some of the data series required in these cases were not sufficiently large to adjustrobust PDFs. We selected then proxy variables based on the more significant watersources for irrigation (with available large data series) in these sub-basins. Droughtthresholds and water restrictions were defined in accordance to the rules of theGRB DMP (GRBA, 2007).
C.D. Pérez-Blanco, C.M. Gómez / Weather and Climate Extremes ∎ (∎∎∎∎) ∎∎∎–∎∎∎ 3
Please cite this article as: Pérez-Blanco, C.D., Gómez, C.M., Drought management plans and water availability in agriculture:A risk assessment model for a Southern European.... Weather and Climate Extremes (2014), http://dx.doi.org/10.1016/j.wace.2014.02.003i
3.1.2. Weibull PDFThe Weibull distribution is a continuous probability distribu-
tion with a scale parameter ðcÞ and a shape parameter ðdÞ that weestimate by maximum likelihood. The Weibull PDF assigns aprobability density pi (i¼ 4) for the water stored in reservoirs yi(i¼ 4), expressed as a percentage over the maximum value in thehistorical data:
p4ðy4Þ ¼ jðy4jc; dÞ ¼dc
y4c
� �d�1exp � y4
c
� �d� �
ð2Þ
The water stored in reservoirs is the most relevant variable inthe calculation of the drought index in the GRB's sub-basins. Weuse it in the calculation of the drought index in the sub-basins ofRegulación General, Salado de Morón, Alto Genil, Hoya de Guadix,Alto Guadiana Menor, Bembézar-Retortillo, Jaén, Rumblar, Guadal-mellato and Sevilla. Data series from MAGRAMA (2013a) that spanthe time period 1943–2009 are used to calibrate the correspond-ing Weibull PDFs.
Table 2 shows the best fit parameters for the water stored inreservoirs in these sub-basins using a Weibull function.
3.2. Drought indices
Now we obtain the probability of every drought index value ðIeÞusing the PDFs obtained above. For the simplest case in which onlyone variable is used, the drought index is obtained as follows7
(GRBA, 2007):
Ie;yi ¼yi �yimin
2ðyiav �yiminÞ
h i; if yioyiav
12 1þyi �yiav
1�yiav
h i; if yiZyiav
8><>: ð3Þ
Where yi is the variable's observed value in the month of reference(April in the GRB) and yiav and yimin are the average and minimumvalues in the historical data series of that variable, respectively (allof them as a percentage over their maximum value in thehistorical data). The corresponding probability of this droughtindex would be thus pi ði¼ 1;…;4Þ.
In the case where the drought index is made up of a combina-tion of hydrological variables (combined drought index), it is
obtained as follows:
Ie ¼ ∑4
i ¼ 1binIe;yi ð4Þ
where bi is a weighting coefficient predetermined by the riverbasin authority that ranges from 0 (the variable is not relevant inthe calculation of the index) to 1 (the same situation as in (3)),with ∑4
i ¼ 1bi ¼ 1. The probability of the combined drought indexðqIe Þ is
qIe ¼ ∏4
i ¼ 1hðyiÞ ð5Þ
where:
hðyiÞ ¼1 ; if bi ¼ 0
piðyiÞ ; if bi40
(ð6Þ
3.3. Drought thresholds and expected water availability
We finally aggregate the probabilities of all the feasible indexvalues into the four drought stages (normality; pre-alert; alert;and emergency) to obtain the aggregated probability of everydrought stage. First we define a set of dummy variables that areused to signal the drought severity (normality, nIe ; pre-alert, zIe ;alert, aIe ; and emergency, eIe ):
nIe ¼1 ; if Ie4 Ie;z0 ; if Ier Ie;z
(ð7Þ
zIe ¼1 ; if Ie;ao Ier Ie;z0 ; otherwise
(ð8Þ
aIe ¼1 ; if Ie;eo Ier Ie;a0 ; otherwise
(ð9Þ
eIe ¼1 ; if Ier Ie;e0 ; if Ie4 Ie;e
(ð10Þ
where Ie;z , Ie;a and Ie;e are the pre-alert, alert and emergencythresholds, respectively, which in the case of the GRB adopt avalue of 0.5, 0.3 and 0.15, respectively (GRBA, 2007).
Next we obtain the probability of every drought stage k ðqIe ;kÞ inthe sub-basins of the GRB. For example, the probability for the
Table 1Gamma function. The dependent variable is the percentage of rainfall ðy1Þ,groundwater ðy2Þ or runoff ðy3Þ over their maximum value in the historical data.Source: Authors' elaboration from AEMET (2013) and MAGRAMA (2013a, 2013b).
Sub-basin Variabletype
Timeperiod
Coefficient
a (Scale) b (Shape)
Campiña Sevillana y1 1944–2011 10.699a
(0.764)0.057a
(0.005)Alto GuadianaMenor
y1 1944–2011 11.327a
(0.755)0.049a
(0.004)Almonte-Marismas y1 1944–2011 16.452a
(1.371)0.032a
(0.003)Alto Genil y2 1965–2012 7.719a (0.858) 0.062a
(0.010)Viar y3 1943–2009 1.679a (0.316) 0.193a
(0.025)Huesna y3 1943–2009 1.263a 0.324a
Estimated by maximum likelihood. Standard errors in parentheses.a Significant at the 1% level.
Table 2Weibull function. The dependent variable is the percentage of dam-stored waterover dam storage capacity ðy4Þ.Source: Authors' elaboration from MAGRAMA (2013a).
Sub-basin Time period Coefficient
a (Scale) b (Shape)
Salado de Morón 1943–2009 0.500a (0.036) 1.684a (0.153)Alto Genil 1943–2009 0.597a (0.040) 1.683a (0.129)Hoya de Guadix 1943–2009 0.818a (0.068) 5.109a (0.426)Alto Guadiana Menor 1943–2009 0.720a (0.080) 3.062a (0.510)Bembézar-Retortillo 1943–2009 0.711a (0.178) 2.397a (0.184)Jaén 1943–2009 0.549a (0.110) 1.698a (0.170)Rumblar 1943–2009 0.743a (0.106) 2.538a (0.195)Guadalmellato 1943–2009 0.589a (0.059) 1.924a (0.275)Sevilla 1943–2009 0.731a (0.061) 2.137a (0.194)Regulación General 1943–2009 0.347a (0.035) 1.484a (0.212)
Estimated maximum likelihood. Standard errors in parentheses.a Significant at the 1% level.
7 Drought indices are obtained in the same way in all the Spanish basins.
C.D. Pérez-Blanco, C.M. Gómez / Weather and Climate Extremes ∎ (∎∎∎∎) ∎∎∎–∎∎∎4
Please cite this article as: Pérez-Blanco, C.D., Gómez, C.M., Drought management plans and water availability in agriculture:A risk assessment model for a Southern European.... Weather and Climate Extremes (2014), http://dx.doi.org/10.1016/j.wace.2014.02.003i

stage of normality ðqIe ;nÞ is obtained as follows:
qIe ;n ¼Z maxy1
y1 ¼ 0
Z maxy2
y2 ¼ 0
Z maxy3
y3 ¼ 0
Z maxy4
y4 ¼ 0ðnIen ∏
4
i ¼ 1hðyiÞ dyiÞ ð11Þ
where maxyi is the value of the variable yi that makes thecumulative density function equal to 1 (i.e., the probability ofhaving a value above this limit is zero8). ∏4
i ¼ 1hðyiÞ is defined in (6).Similarly, the probability for the stages of pre-alert ðqIe ;zÞ, alert
ðqIe ;aÞ and emergency ðqIe ;eÞ is obtained as follows:
qIe ;z ¼Z maxy1
y1 ¼ 0
Z maxy2
y1 ¼ 2
Z maxy3
y3 ¼ 0
Z maxy4
y4 ¼ 0ðzIen ∏
4
i ¼ 1hðyiÞ dyiÞ ð12Þ
qIe ;a ¼Z maxy1
y1 ¼ 0
Z maxy2
y2 ¼ 0
Z maxy3
y3 ¼ 0
Z maxy4
y4 ¼ 0ðaIen ∏
4
i ¼ 1hðyiÞ dyiÞ ð13Þ
qIe ;e ¼Z maxy1
y1 ¼ 0
Z maxy2
y2 ¼ 0
Z maxy3
y3 ¼ 0
Z maxy4
maxy4
ðeIen ∏4
i ¼ 1hðyiÞ dyiÞ ð14Þ
Finally we use the water availability specified in the DMP forevery drought stage k ðRIe ;kÞ to estimate the expected wateravailability in agriculture ðEWirrÞ. In the GRB the DMP establishesthe following four drought thresholds and their correspondingwater availability (GRBA, 2007): (i) whenwater levels are regardedas normal ðIe4 Ie;zÞ, there are no restrictions ðRIe ;n ¼ 1Þ; (ii) wateravailability for irrigation is reduced by 5% ðRIe ;z ¼ 0:95Þ whenavailable water falls below the prealert threshold ðIe;ao Ier Ie;zÞ;(iii) if the alert limits are exceeded ðIe;eo Ier Ie;aÞ, water avail-ability for irrigation is reduced by 30% ðRIe ;a ¼ 0:7Þ; and (iv) inemergency situations ðIer Ie;eÞ, water availability for irrigation isreduced by 70% ðRIe ;e ¼ 0:3Þ. EWirr is obtained for every sub-basinin the GRB as follows:
EWirr¼∑kqIe ;knRIe ;k ð15Þ
3.4. Climate change scenarios
So far we are assuming that the dynamics of the renewablewater resources are stable and endogenous. However, there isevidence that renewable water resources worldwide (OECD, 2013)and also in Spanish basins (MAGRAMA, 2013b, 2011) have beendecreasing during the last years. Climate change is regarded as themain cause and consequently has become a matter of concern,especially in overexploited and drought exposed southern basinssuch as the GRB (GRBA, 2013, 2007). Accordingly, national andregional authorities have commissioned several reports on theeffects of climate change over water supply in the GRB.
The most extensive and up to date assessment on the avail-ability of water resources under different climatic scenarios is thatof MAGRAMA (2011). This report develops water availabilityscenarios at a river basin level based on the climate changescenario families A2 and B2 designed by the IntergovernmentalPanel on Climate Change (IPCC, 2007). The simulations byMAGRAMA (2011) load temperature and rainfall forecasts byIPCC (2007) into the SIMPA hydrogeological model9 in order toestimate water availability in different water sources for the timeperiods 2011–2040, 2041–2070 and 2071–2100, and then comparethe results to the average water availability in the control period1961–1990.
Instead of using all the possible water availability scenarios inMAGRAMA (2011), this paper summarizes the information in thereport in synthetic indices that are obtained as the average of thealternative water availability scenarios for every water source andtime period in the GRB. Then we use these synthetic indices toadjust the historical data series of the hydrogeological variablesused to obtain the drought indices, and we repeat the methodol-ogy above (Sections 3.1–3.3) to assess the impact of climate changeon water availability in agriculture in the medium-long termconsidering climate change. The three time periods considered(2011–2040, 2041–2070 and 2071–2100) show a decrease in watersupply in every water source as compared to the control period1961–1990. Rainfall decreases 7.5% in the time period 2011–2040,12.5% in 2041–2070 and 19% in 2071–2100 (MAGRAMA, 2011,p. 116), runoff decreases 12%, 20% and 33.5% (MAGRAMA, 2011,p. 192), respectively, and groundwater decreases 14%, 21.5%and 33.5%, respectively (MAGRAMA, 2011, p. 168). There is noinformation regarding the impact of climate change on wateravailability in reservoirs, which is assumed to evolve in the sameway as runoff.
4. Results
4.1. Baseline scenario
According to our model, after the implementation of the DMPin the GRB a drought is declared almost one in two years and theprobability of suffering an extreme drought (with water restric-tions for agriculture of 70%) is approximately 14%. Consequently,the implementation of the DMP results in an expected wateravailability for agriculture (EWirr) of 62.2%10 of the water allot-ment in a normal hydrological year without drought (much lowerthan the 90% specified in the previous legislation).
Expected water availability varies significantly among sub-basins. Regulación General is the largest sub-basin in the GRBand represents 66% of agricultural water demand, and it is also themost affected sub-basin by the water restrictions specified in theDMP, with an expected water availability of 51%. The Jaén Sub-basin (3.3% of the agricultural water demand) also has a lowexpected water availability of 67%. On the other hand, the sub-basins of Campiña Sevillana, Alto Genil, Hoya de Guadix, AltoGuadiana, Bembézar-Retortillo, Viar, Almonte Marismas andSevilla, which together represent 26.8% of the agricultural waterdemand in the GRB, have an expected water availability over 80%.The remaining sub-basins show similar results, with expectedwater availability values above 75%, although most of these sub-basins are located upstream and have a marginal relevance forirrigation (3.8% of the agricultural water demand) (GRBA, 2013)(Fig. 2).
4.2. Climate change scenarios
In this section we use climate projections to assess possiblefuture reductions in renewable water resources (see Section 3.4).Our results show that expected water availability for agriculturein the GRB is reduced in average by 4.5% in 2012–2040 ðEWirr ¼57:7%Þ, by 7.7% in 2041–2070 ðEWirr¼ 54:5%Þ and by 13% in2071–2100 ðEWirr¼ 49:2%Þ as compared to the values in thesimulation with no climate change (Section 4.1).
As before, there are relevant differences among sub-basins. Inthe Regulación General Sub-Basin the expected water availability
8 If we adjust a PDF to yi in a given sub-basin, maxyi is the value at the end ofthe tail of the PDF, i.e., the value above which the probability of yi is zero.
9 The SIMPA model (Sistema Integrado de Simulación Precipitación Aportación)estimates real evapotranspiration, soil humidity, runoff and groundwater rechargeat a spatial detail of 1 km2 on a monthly basis (Ministry of Public Works, 2013).
10 This value is obtained as the weighted average of the expected wateravailability for agriculture in every sub-basin. Weights are assigned in accordanceto the share of agricultural water demand in every sub-basin (see Table 3).
C.D. Pérez-Blanco, C.M. Gómez / Weather and Climate Extremes ∎ (∎∎∎∎) ∎∎∎–∎∎∎ 5
Please cite this article as: Pérez-Blanco, C.D., Gómez, C.M., Drought management plans and water availability in agriculture:A risk assessment model for a Southern European.... Weather and Climate Extremes (2014), http://dx.doi.org/10.1016/j.wace.2014.02.003i
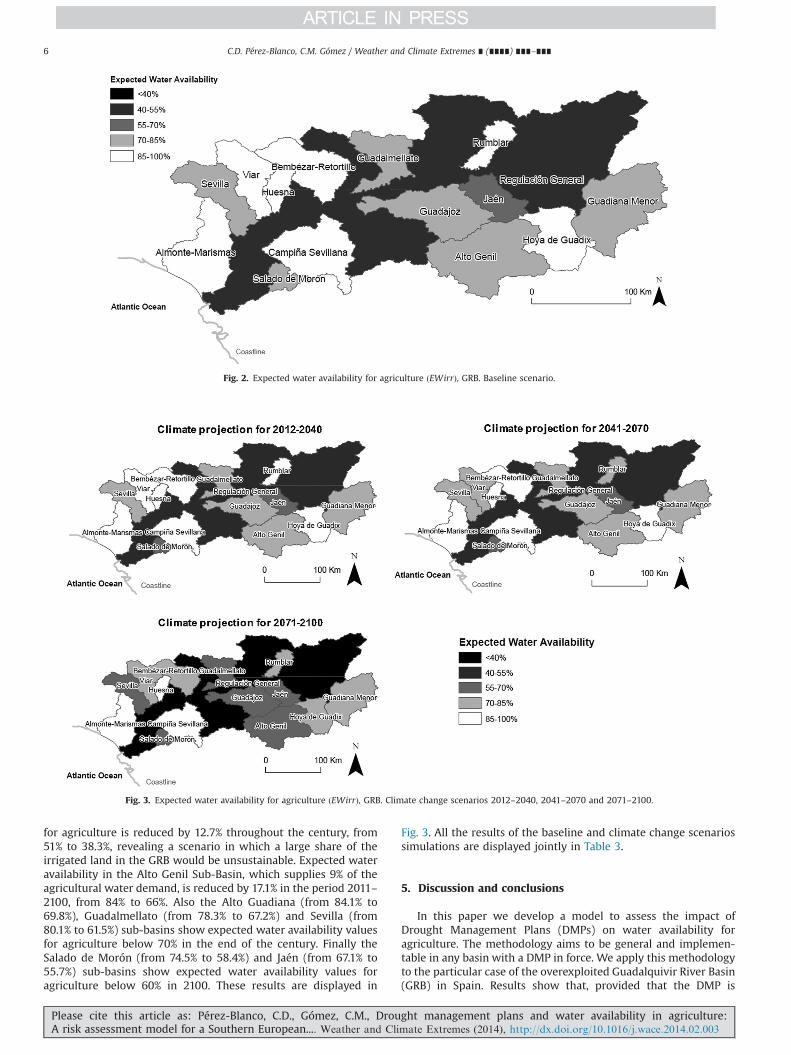
for agriculture is reduced by 12.7% throughout the century, from51% to 38.3%, revealing a scenario in which a large share of theirrigated land in the GRB would be unsustainable. Expected wateravailability in the Alto Genil Sub-Basin, which supplies 9% of theagricultural water demand, is reduced by 17.1% in the period 2011–2100, from 84% to 66%. Also the Alto Guadiana (from 84.1% to69.8%), Guadalmellato (from 78.3% to 67.2%) and Sevilla (from80.1% to 61.5%) sub-basins show expected water availability valuesfor agriculture below 70% in the end of the century. Finally theSalado de Morón (from 74.5% to 58.4%) and Jaén (from 67.1% to55.7%) sub-basins show expected water availability values foragriculture below 60% in 2100. These results are displayed in
Fig. 3. All the results of the baseline and climate change scenariossimulations are displayed jointly in Table 3.
5. Discussion and conclusions
In this paper we develop a model to assess the impact ofDrought Management Plans (DMPs) on water availability foragriculture. The methodology aims to be general and implemen-table in any basin with a DMP in force. We apply this methodologyto the particular case of the overexploited Guadalquivir River Basin(GRB) in Spain. Results show that, provided that the DMP is
Fig. 2. Expected water availability for agriculture ðEWirrÞ, GRB. Baseline scenario.
Fig. 3. Expected water availability for agriculture ðEWirrÞ, GRB. Climate change scenarios 2012–2040, 2041–2070 and 2071–2100.
C.D. Pérez-Blanco, C.M. Gómez / Weather and Climate Extremes ∎ (∎∎∎∎) ∎∎∎–∎∎∎6
Please cite this article as: Pérez-Blanco, C.D., Gómez, C.M., Drought management plans and water availability in agriculture:A risk assessment model for a Southern European.... Weather and Climate Extremes (2014), http://dx.doi.org/10.1016/j.wace.2014.02.003i

effectively enforced, the effects over water availability in agricul-ture are significant. Water availability is reduced in average to62.5% of the water demand, a much lower figure than the wateravailability of 90% that the previous legislation aimed to guarantee.In some areas, the impact may be even larger. For example,expected water availability is halved in the Regulación GeneralSub-basin, which comprises most of the irrigated lands in the GRB.If we introduce climate change simulations in our model, waterrestrictions become more intense and frequent.
In basins suffering a severe water deficit, such as the GRB,water restrictions are tighter and thus have more impact on non-priority uses such as agriculture. Climate change is expected tofurther reduce water availability and increase the gap betweenwater supply and demand. Therefore, complementary policiesaimed towards reducing and adapting agricultural water demandto existing water supply are needed. This policy mix would havethe potential to improve the environmental status of water bodiesand make agriculture a sustainable activity in the medium-longrun. However, unlike the US contingency plans, EU DMPs do notinclude the use of complementary policies to curb water demand,such as voluntary agreements, water markets or water pricing. Asa result, water demand in the GRB is expected to remain in similarlevels (GRBA, 2013), although expected water availability will bereduced throughout the century (OECD, 2013; MAGRAMA, 2011).
It is also important to consider that in this model we haveassumed a perfect enforcement of DMPs. However, experienceshows that moral hazard abounds in water use. Water demandmay remain higher than water supply during droughts even if wecontrol for minimum environmental flows, at the expense ofloosely controlled groundwater bodies. This has already happenedin other Mediterranean basins such as the Segura River Basin inSpain (Gómez and Pérez-Blanco, 2012) and the Murray DarlingBasin in Australia (Crase, 2012). The substitution of the publiclyallotted water by illegal groundwater abstractions may createenvironmental as well as inequality concerns, as those who haveno access to groundwater would be the ones actually facing theconsequences of water restrictions.
In order to avoid a sudden and disproportionate impact ofdroughts on agriculture and at the same time guarantee waterdemand for priority uses, water policy needs to balance watersupply and demand. Without complementary policies, DMPs mayregulate water availability but not agents' incentives to use water.Water demand needs to be addressed as well.
Therefore, DMPs should not be regarded as a panacea, butrather as a part of an institutional change towards a sustainable
water management. A comprehensive policy mix can find the wayto make the reduction of water scarcity and drought exposurecompatible with the maintenance of a sustainable agriculturalsector. DMPs are a first step and an opportunity, but the transitiontowards a sustainable water use relies on building better institu-tions and putting the effective incentives in place in order to keepwater demand under control.
Acknowledgments
The research leading to these results has received funding fromthe EU Seventh Framework Program (FP7/2007–2013) under Grantagreements n1 265213 (EPI-WATER – Evaluating Economic PolicyInstruments for Sustainable Water Management in Europe) and n1308438 (ENHANCE – Enhancing risk management partnerships forcatastrophic natural disasters in Europe). The authors alsoacknowledge the support of the Spanish Association of AgrarianInsuring Firms (Agroseguro S.A.). We would like to thank twoanonymous referees for their interest in our paper and for thecomments, which allowed us to improve the original version ofthe manuscript.
References
AEMET, 2013. AEMET Climatological Series (Password Required) [WWW Docu-ment]. Agencia Española de Meteorología – Database. URL ⟨http://ftpdatos.aemet.es/series_climatologicas/⟩ (accessed 20.10.13).
Anderies, J., Janssen, M., Ostrom, E., 2004. Framework to analyze the robustness ofsocial-ecological systems from an institutional perspective. Presented at theThe Commons in an Age of Global Transition: Challenges, Risks and Opportu-nities, the Tenth Biennial Conference of the International Association for theStudy of Common Property, Oaxaca, Mexico.
Berbel, J., Kolberg, S., Martin-Ortega, J., 2012. Assessment of the draft hydrologicalbasin plan of the Guadalquivir River Basin (Spain). Int. J. Water Resour. Dev. 28,43–55.
BOE, 2001. Ley 10/2001, de 5 de julio, del Plan Hidrológico Nacional, Law.BOE, 2005. Real Decreto-Ley 15/2005, de 16 de diciembre, de medidas urgentes
para la regulación de las transacciones de derechos al aprovechamiento de agua(Vigente hasta el 30 de Noviembre de 2009), Royal Decree.
BOE, 2006. Real Decreto-Ley 9/2006, de 15 de septiembre, por el que se adoptanmedidas urgentes para paliar los efectos producidos por la sequía en laspoblaciones y en las explotaciones agrarias de regadío en determinadascuencas hidrográficas, Royal Decree.
Crase, L., 2012. Water markets, property rights and managing environmental waterreserves. In: Water Policy Reform. Edward Elgar Publishing, Cheltenham,pp. 37–48.
EC, 2000. Water Framework Directive 2000/60/EC, Council Directive.EC, 2003. Regulation No 1059/2003, Regulation.EC, 2008. Drought Management Plan Report (Report no. 23). European Commission,
Brussels (Belgium).
Table 3Agricultural water demand and expected water availability for agriculture ðEWirrÞ in the GRB, all scenarios.Source: Authors' elaboration. Agricultural water demand was obtained from GRBA (2013).
Sub-basin Agricultural water demand (%) EWirr
Baseline (%) 2011–2040 (%) 2041–2070 (%) 2071–2100 (%)
Salado de Morón 0.5 74.5 66.6 65.3 58.4Campiña Sevillana 2.3 97.5 93.2 91.3 89.7Alto Genil 9.0 83.9 76.8 73.1 66.7Hoya de Guadix 1.7 96.0 94.9 91.1 84.9Alto Guadiana Menor 4.0 84.1 80.8 75.6 69.8Bembézar-Retortillo 4.2 90.8 90.1 87.3 83.4Viar 1.5 92.2 86.4 83.0 78.3Almonte-Marismas 0.0 97.3 93.3 92.0 90.6Jaén 3.3 67.1 66.7 64.0 55.7Rumblar 0.2 88.0 85.0 81.1 73.1Guadalmellato 2.8 78.3 77.7 74.5 67.2Huesna 0.3 95.8 93.1 92.4 87.3Sevilla 4.1 80.1 73.0 70.7 61.5Regulación General 66.0 51.0 46.2 43.2 38.3Guadalquivir River Basin 100.0 62.2 57.7 54.5 49.2
C.D. Pérez-Blanco, C.M. Gómez / Weather and Climate Extremes ∎ (∎∎∎∎) ∎∎∎–∎∎∎ 7
Please cite this article as: Pérez-Blanco, C.D., Gómez, C.M., Drought management plans and water availability in agriculture:A risk assessment model for a Southern European.... Weather and Climate Extremes (2014), http://dx.doi.org/10.1016/j.wace.2014.02.003i

EEA, 2009. Water Resources Across Europe – confronting Water Scarcity andDrought (Report No. 2/2009). European Environment Agency, Copenhagen,Denmark.
Gómez, C.M., Pérez-Blanco, C.D., 2012. Do drought management plans reducedrought risk? A risk assessment model for a Mediterranean river basin. Ecol.Econ. 76, 42–48.
GRBA, 2007. Plan de Actuación en Situaciones de Alerta y Eventual Sequía de laCuenca del Guadalquivir (Report). Guadalquivir River Basin Authority.
GRBA, 2013. Plan Hidrológico de la Demarcación Hidrográfica del Guadalquivir(River Basin Management Plan). Guadalquivir River Basin Authority.
IPCC, 2007. IPCC Fourth Assessment Report (AR4). Intergovernmental Panel onClimate Change, Geneva, Switzerland.
JRBA, 2005. Protocolo de actuación en situación de alerta y eventual sequía(Report). Júcar River Basin Authority, Valencia.
MAGRAMA, 2011. Evaluación del impacto del cambio climático en los recursoshídricos en régimen natural (Report). Ministerio de Agricultura, Alimentación yMedio Ambiente.
MAGRAMA, 2013a. Anuario de Aforos [WWW Document]. Anuario de Aforos delMinisterio de Agricultura, Alimentación y Medio Ambiente. URL ⟨http://hercules.cedex.es/anuarioaforos/default.asp⟩ (accessed 20.10.13).
MAGRAMA, 2013b. Sistema de Información del Agua (SIA) [WWW Document].Ministerio de Agricultura, Alimentación y Medio Ambiente. URL ⟨http://servicios2.MAGRAMA.es/sia/visualizacion/lda/recursos/superficiales_escorrentia.jsp⟩.
Martin, S.W., Barnett, B.J., Coble, K.H., 2001. Developing and pricing precipitationinsurance. J. Agric. Resour. Econ. 26, 261–274.
Martínez, E.I., Garrido, A., Gómez-Ramos, A., 2002. Evaluación de la garantía desuministro de agua a la agricultura. Una aplicación a la cuenca del Guadalquivir.Ingeniería del agua. vol. 9, pp. 279–294.
Ministry of Public Works, 2013. Sistema Integrado para la Modelación del procesoPrecipitación Aportación (SIMPA) [WWW Document]. URL ⟨http://hercules.cedex.es/hidrologia/pub/proyectos/simpa.htm⟩ (accessed 20.10.13).
NDMC, 2013. Directory of Drought and Management Plans [WWW Document].National Drought Mitigation Centre. URL ⟨http://drought.unl.edu/Planning/PlanningInfobyState/DroughtandManagementPlans.aspx⟩ (accessed 30.09.13).
OECD, 2013. Water Security for Better Lives (Report), OECD Studies on Water.Organisation for Economic Co-operation and Development, Paris, France.
Pérez-Blanco, C.D., Gómez, C.M., 2013. Designing optimum insurance schemes toreduce water overexploitation during drought events: a case study of LaCampiña, Guadalquivir River Basin, Spain. J. Environ. Econ. Policy 2, 1–15.
Ruttan, V.W., 2002. Productivity growth in world agriculture: sources and con-straints. J. Econ. Perspect. 16, 161–184.
SRBA, 2008. Plan de Actuación en Situaciones de Alerta y Eventual Sequía de laCuenca del Segura (Report). Segura River Basin Authority.
Ward, F.A., Pulido-Velazquez, M., 2008. Water conservation in irrigation canincrease water use. Proc. Natl. Acad. Sci. 105, 18215–18220.
WWF, 2006. Illegal Water Use in Spain. WWF, Madrid. Spain (Causes Effects andSolutions (Report))
C.D. Pérez-Blanco, C.M. Gómez / Weather and Climate Extremes ∎ (∎∎∎∎) ∎∎∎–∎∎∎8
Please cite this article as: Pérez-Blanco, C.D., Gómez, C.M., Drought management plans and water availability in agriculture:A risk assessment model for a Southern European.... Weather and Climate Extremes (2014), http://dx.doi.org/10.1016/j.wace.2014.02.003i